
Assessment of the Risk of Insulin Resistance in Workers Classified as Metabolically Healthy Obese
 , ,
, ,
Abstract
1. Introduction
2. Methods
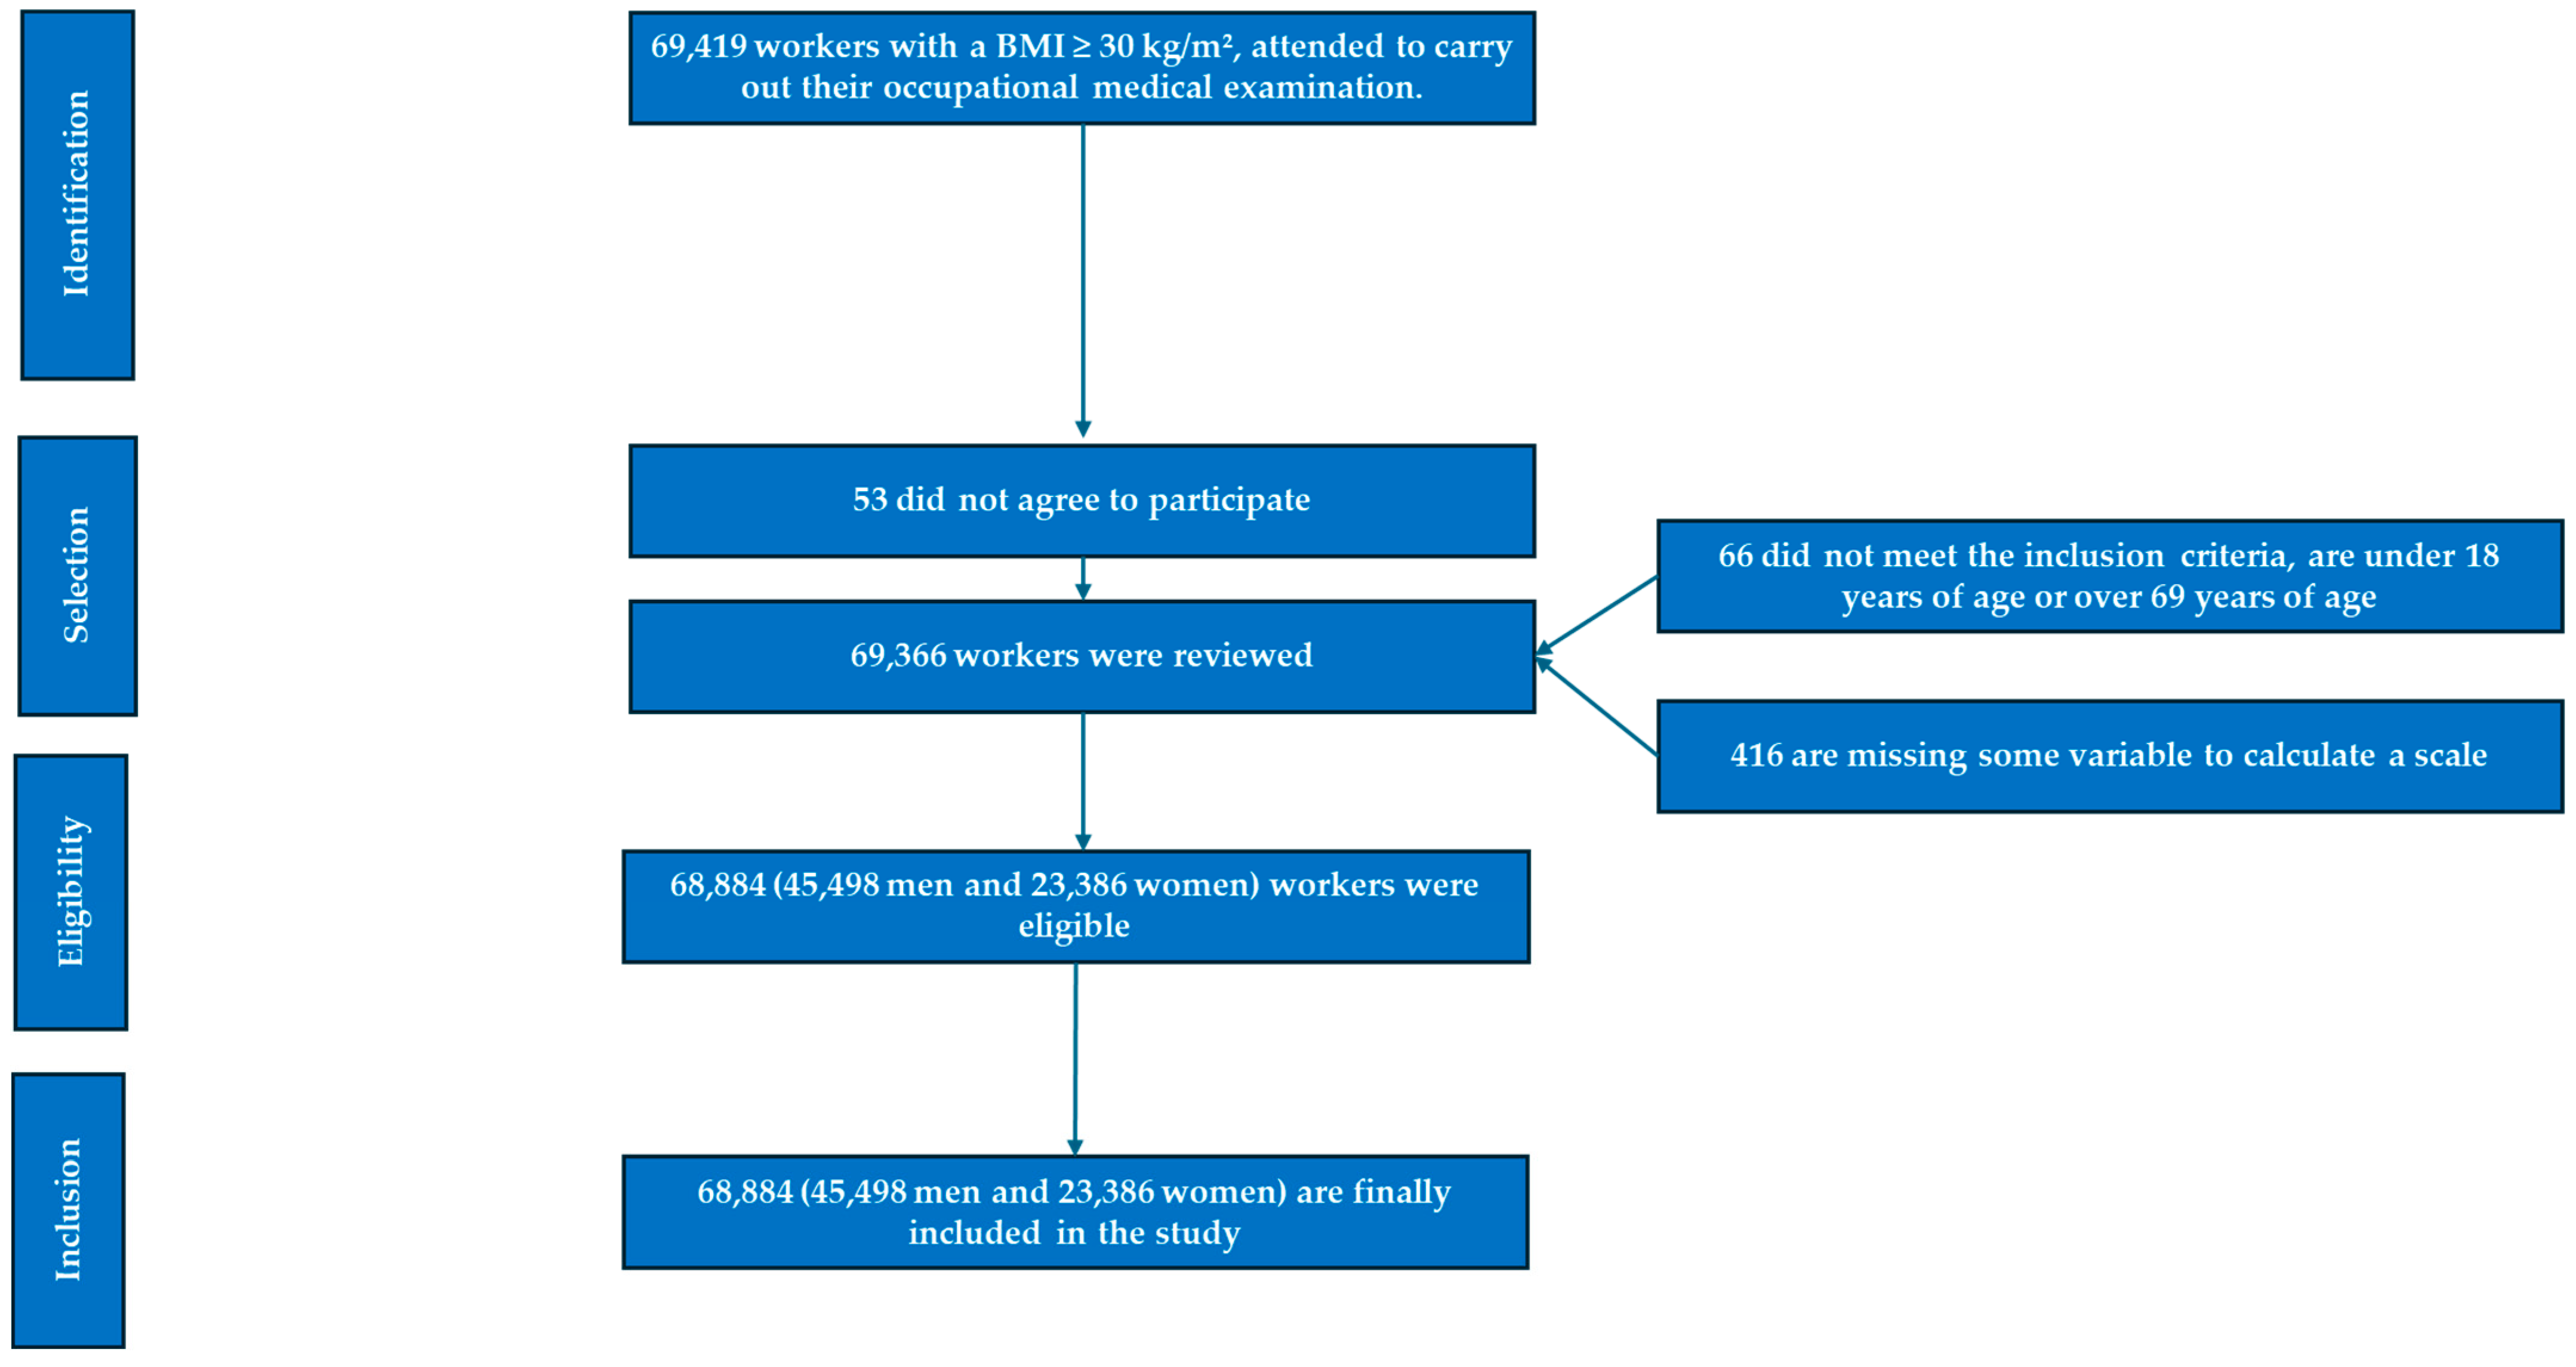
2.1. Study Design and Participants
- Inclusion Criteria:
- Obesity, defined as a body mass index (BMI) ≥ 30 kg/m2.
- Age between 18 and 69 years.
- Employment at one of the participating companies.
- Voluntary participation in the study.
- Exclusion Criteria:
- Individuals younger than 18 or older than 69 years.
- No employment contract with any participating company.
- Did not provide informed consent to participate in the study.
- Did not authorize the use of their data for epidemiological purposes.
- Missing variables necessary for calculations.
- Body mass index (BMI) ≤ 30 kg/m2.
2.2. Variable Assessment
2.3. Biochemical Analyses
2.4. Definition of Metabolically Healthy Obesity (MHO)
- Waist circumference: ≥88 cm in women and ≥102 cm in men.
- Triglyceride levels: ≥150 mg/dL or undergoing lipid-lowering therapy.
- HDL cholesterol levels: <50 mg/dL in women or <40 mg/dL in men.
- Fasting glucose levels: ≥100 mg/dL or receiving glucose-lowering treatment.
- Blood pressure status: Systolic blood pressure (SBP) ≥ 130 mmHg and/or diastolic blood pressure (DBP) ≥ 85 mmHg, or the use of antihypertensive therapy.
- Group A: No metabolic syndrome factors.
- Group B: One metabolic syndrome factor.
- Group C: Up to two metabolic syndrome factors.
2.5. Demographic and Socioeconomic Variables
- Sex was recorded as a binary variable (male or female).
- Age was determined by subtracting the date of birth from the date of the medical ex-amination.
- Educational attainment was categorized into three levels: Primary education, High school education, and University education.
- Socioeconomic status was classified according to the Spanish Society of Epidemiolo-gy criteria, based on the 2011 National Occupational Classification (CNO-11) [41], and categorized as follows:
- ○
- Social Class I: Executives, university-educated professionals, athletes, and artists.
- ○
- Social Class II: Intermediate professionals and skilled self-employed workers.
- ○
- Social Class III: Low-skilled workers.
- Participants were classified as smokers if they had consumed any form of tobacco at least once per day in the past 30 days or had ceased smoking within the preceding 12 months.
- Adherence to the Mediterranean diet was evaluated using a 14-item questionnaire, with responses scored as 0 or 1 point per item. A total score ≥ 9 was indicative of high adherence [42].
- Physical activity levels were assessed using the International Physical Activity Questionnaire (IPAQ), a self reported instrument designed to quantify physical activity patterns over the previous 7 days [43].
2.6. Statistical Analysis
2.7. Ethical Considerations
3. Results
4. Discussion
Strengths and Limitations
5. Conclusions
Author Contributions
Funding
Institutional Review Board Statement
Informed Consent Statement
Data Availability Statement
Conflicts of Interest
References
- Naghizadeh, M.; Maskouni, S.J.; Mortazavi, Z.; Ahmadi, M.; Shokri, S. The Impact of Fast Food Consumption on the Development of General and Central Obesity. Acad. J. Health Sci. 2024, 39, 44–48. [Google Scholar] [CrossRef]
- Suren Garg, S.; Kushwaha, K.; Dubey, R.; Gupta, J. Association between obesity, inflammation and insulin resistance: Insights into signaling pathways and therapeutic interventions. Diabetes Res. Clin. Pract. 2023, 200, 110691. [Google Scholar] [CrossRef] [PubMed]
- Blüher, M. Metabolically Healthy Obesity. Endocr Rev. 2020, 41, bnaa004. [Google Scholar] [CrossRef] [PubMed] [PubMed Central]
- Petersen, M.C.; Smith, G.I.; Palacios, H.H.; Farabi, S.S.; Yoshino, M.; Yoshino, J.; Cho, K.; Davila-Roman, V.G.; Shankaran, M.; Barve, R.A.; et al. Cardiometabolic characteristics of people with metabolically healthy and unhealthy obesity. Cell Metab. 2024, 36, 745–761.e5. [Google Scholar] [CrossRef] [PubMed] [PubMed Central]
- Griera Borrás, J.L.; Contreras Gilbert, J. Are there healthy obese? Endocrinol. Nutr. 2014, 61, 47–51. [Google Scholar] [CrossRef] [PubMed]
- Tsatsoulis, A.; Paschou, S.A. Metabolically Healthy Obesity: Criteria, Epidemiology, Controversies, and Consequences. Curr. Obes. Rep. 2020, 9, 109–120. [Google Scholar] [CrossRef] [PubMed]
- Barrea, L.; Muscogiuri, G.; Pugliese, G.; de Alteriis, G.; Colao, A.; Savastano, S. Metabolically Healthy Obesity (MHO) vs. Metabolically Unhealthy Obesity (MUO) Phenotypes in PCOS: Association with Endocrine-Metabolic Profile, Adherence to the Mediterranean Diet, and Body Composition. Nutrients 2021, 13, 3925. [Google Scholar] [CrossRef]
- Gómez-Zorita, S.; Queralt, M.; Vicente, M.A.; González, M.; Portillo, M.P. Metabolically healthy obesity and metabolically obese normal weight: A review. J. Physiol. Biochem. 2021, 77, 175–189. [Google Scholar] [CrossRef] [PubMed]
- Su, Z.; Efremov, L.; Mikolajczyk, R. Differences in the levels of inflammatory markers between metabolically healthy obese and other obesity phenotypes in adults: A systematic review and meta-analysis. Nutr. Metab. Cardiovasc. Dis. 2024, 34, 251–269. [Google Scholar] [CrossRef]
- Kang, Y.M.; Jung, C.H.; Cho, Y.K.; Jang, J.E.; Hwang, J.Y.; Kim, E.H.; Lee, W.J.; Park, J.-Y.; Kim, H.-K. Visceral adiposity index predicts the conversion of metabolically healthy obesity to an unhealthy phenotype. PLoS ONE 2017, 12, e0179635. [Google Scholar] [CrossRef]
- Wang, J.-S.; Xia, P.-F.; Ma, M.-N.; Li, Y.; Geng, T.-T.; Zhang, Y.-B.; Tu, Z.-Z.; Jiang, L.; Zhou, L.-R.; Zhang, B.-F.; et al. Trends in the Prevalence of Metabolically Healthy Obesity Among US Adults, 1999–2018. JAMA Netw. Open 2023, 6, e232145. [Google Scholar] [CrossRef]
- Sastre-Alzamora, T.; Tomás-Gil, P.; Paublini, H.; Pallarés, L.; Ramírez-Manent, J.I.; López-González, A.A. Relationship between heart age and insulin resistance risk scales in 139634 Spanish workers. Acad. J. Health Sci. 2024, 39, 16–22. [Google Scholar] [CrossRef]
- Lee, S.H.; Park, S.Y.; Choi, C.S. Insulin Resistance: From Mechanisms to Therapeutic Strategies. Diabetes Metab. J. 2022, 46, 15–37. [Google Scholar] [CrossRef]
- Kosmas, C.E.; Bousvarou, M.D.; Kostara, C.E.; Papakonstantinou, E.J.; Salamou, E.; Guzman, E. Insulin resistance and cardiovascular disease. J. Int. Med. Res. 2023, 51, 3000605231164548. [Google Scholar] [CrossRef]
- He, M.; Wang, J.; Liang, Q.; Li, M.; Guo, H.; Wang, Y.; Deji, C.; Sui, J.; Wang, Y.-W.; Liu, Y.; et al. Time-restricted eating with or without low-carbohydrate diet reduces visceral fat and improves metabolic syndrome: A randomized trial. Cell Rep. Med. 2022, 3, 100777. [Google Scholar] [CrossRef]
- Li, H.; Meng, Y.; He, S.; Tan, X.; Zhang, Y.; Zhang, X.; Wang, L.; Zheng, W. Macrophages, Chronic Inflammation, and Insulin Resistance. Cells 2022, 11, 3001. [Google Scholar] [CrossRef]
- Al-Mansoori, L.; Al-Jaber, H.; Prince, M.S.; Elrayess, M.A. Role of Inflammatory Cytokines, Growth Factors and Adipokines in Adipogenesis and Insulin Resistance. Inflammation 2022, 45, 31–44. [Google Scholar] [CrossRef]
- Tanase, D.M.; Gosav, E.M.; Costea, C.F.; Ciocoiu, M.; Lacatusu, C.M.; Maranduca, M.A.; Ouatu, A.; Floria, M. The Intricate Relationship between Type 2 Diabetes Mellitus (T2DM), Insulin Resistance (IR), and Nonalcoholic Fatty Liver Disease (NAFLD). J. Diabetes Res. 2020, 2020, 3920196. [Google Scholar] [CrossRef]
- Kolb, H. Obese visceral fat tissue inflammation: From protective to detrimental? BMC Med. 2022, 20, 494. [Google Scholar] [CrossRef]
- Schulze, M.B.; Stefan, N. Metabolically healthy obesity: From epidemiology and mechanisms to clinical implications. Nat. Rev. Endocrinol. 2024, 20, 633–646. [Google Scholar] [CrossRef]
- Abiri, B.; Koohi, F.; Ebadinejad, A.; Valizadeh, M.; Hosseinpanah, F. Transition from metabolically healthy to unhealthy overweight/obesity and risk of cardiovascular disease incidence: A systematic review and meta-analysis. Nutr. Metab. Cardiovasc. Dis. 2022, 32, 2041–2051. [Google Scholar] [CrossRef] [PubMed]
- Song, Z.; Gao, M.; Lv, J.; Yu, C.; Guo, Y.; Bian, Z.; Wei, Y.; Yang, L.; Du, H.; Chen, Y.; et al. Metabolically healthy obesity, transition to unhealthy phenotypes, and type 2 diabetes in 0.5 million Chinese adults: The China Kadoorie Biobank. Eur. J. Endocrinol. 2022, 186, 233–244. [Google Scholar] [CrossRef] [PubMed] [PubMed Central]
- Gutiérrez-Repiso, C.; Linares-Pineda, T.M.; Gonzalez-Jimenez, A.; Aguilar-Lineros, F.; Valdés, S.; Soriguer, F.; Rojo-Martínez, G.; Ti-nahones, F.J.; Morcillo, S. Epigenetic Biomarkers of Transition from Metabolically Healthy Obesity to Metabolically Unhealthy Obesity Phenotype: A Prospective Study. Int. J. Mol. Sci. 2021, 22, 10417. [Google Scholar] [CrossRef]
- Martin-Piedra, L.; Alcala-Diaz, J.F.; Gutierrez-Mariscal, F.M.; de Larriva, A.P.A.; Romero-Cabrera, J.L.; Torres-Peña, J.D.; Caballero-Villarraso, J.; Luque, R.M.; Perez-Martinez, P.; Lopez-Miranda, J.; et al. Evolution of Metabolic Phenotypes of Obesity in Coronary Patients after 5 Years of Dietary Intervention: From the CORDI-OPREV Study. Nutrients 2021, 13, 4046. [Google Scholar] [CrossRef]
- Colleluori, G.; Villareal, D.T. Aging, obesity, sarcopenia and the effect of diet and exercise intervention. Exp. Gerontol. 2021, 155, 111561. [Google Scholar] [CrossRef]
- Chaput, J.-P.; McHill, A.W.; Cox, R.C.; Broussard, J.L.; Dutil, C.; da Costa, B.G.G.; Sampasa-Kanyinga, H.; Wright, K.P. The role of insufficient sleep and circadian misa-lignment in obesity. Nat. Rev. Endocrinol. 2023, 19, 82–97. [Google Scholar] [CrossRef]
- Murlasits, Z.; Kupai, K.; Kneffel, Z. Role of physical activity and cardiorespiratory fitness in metabolically healthy obesity: A nar-rative review. BMJ Open Sport. Exerc. Med. 2022, 8, e001458. [Google Scholar] [CrossRef]
- Ojalehto Lindfors, E.; De Oliveira, T.L.; Reynolds, C.A.; Zhan, Y.; Dahl Aslan, A.K.; Jylhävä, J.; Sjölander, A.; Karlsson, I.K. Genetic influences, lifestyle and psychosocial aspects in relation to metabolically healthy obesity and conversion to a metabolically unhealthy state. Diabetes Obes. Metab. 2025, 27, 207–214. [Google Scholar] [CrossRef]
- Stefan, N. Causes, consequences, and treatment of metabolically unhealthy fat distribution. Lancet Diabetes Endocrinol. 2020, 8, 616–627. [Google Scholar] [CrossRef]
- Tutunchi, H.; Naeini, F.; Ebrahimi-Mameghani, M.; Najafipour, F.; Mobasseri, M.; Ostadrahimi, A. Metabolically healthy and unhealthy obesity and the progression of liver fibrosis: A cross-sectional study. Clin. Res. Hepatol. Gastroenterol. 2021, 45, 101754. [Google Scholar] [CrossRef]
- Cho, A.Y.; Roh, J.G.; Shim, Y.S.; Lee, H.S.; Hwang, J.S. Biochemical predictors of metabolically unhealthy obesity in children and ado-lescents. J. Pediatr. Endocrinol. Metab. 2021, 35, 97–103. [Google Scholar] [CrossRef]
- Aisike, G.; Kuerbanjiang, M.; Muheyati, D.; Zaibibuli, K.; Lv, M.X.; Han, J. Correlation analysis of obesity phenotypes with leptin and adiponectin. Sci. Rep. 2023, 13, 17718. [Google Scholar] [CrossRef]
- Xu, R.; Shen, P.; Wu, C.; Wan, Y.; Fan, Z.; Gao, X. BMI, high-sensitivity C-reactive protein and the conversion from metabolically healthy to unhealthy phenotype in Chinese adults: A cohort study. Public. Health Nutr. 2021, 24, 4124–4131. [Google Scholar] [CrossRef]
- Ler, P.; Ojalehto, E.; Zhan, Y.; Finkel, D.; Dahl Aslan, A.K.; Karlsson, I.K. Conversions between metabolically unhealthy and healthy obesity from midlife to late-life. Int. J. Obes. 2024, 48, 433–436. [Google Scholar] [CrossRef]
- Jéru, I.; Fellahi, S.; Capeau, J.; Bastard, J.P.; Vigouroux, C.; Pour le groupe de travail RIHN Adipokinesb. Leptine, adiponectine, syndromes lipodystrophiques et d’insulino-résistance sévère. Ann. Biol. Clin. 2020, 78, 261–264. (In French) [Google Scholar] [CrossRef]
- Li, S.; Han, X.; Song, J.; Dong, M.; Xie, T. Mechanism of Action and Risk Prediction of Adiponectin in Cardiovascular Diseases. Front. Biosci. (Landmark Ed.) 2024, 29, 286. [Google Scholar] [CrossRef]
- Petri, C.; Campa, F.; Holway, F.; Pengue, L.; Arrones, L.S. ISAK-Based Anthropometric Standards for Elite Male and Female Soccer Players. Sports 2024, 12, 69. [Google Scholar] [CrossRef]
- Ramírez-Manent, J.I.; Tomás-Gil, P.; Coll-Villalonga, J.L.; Marti-Lliteras, P.; López-González, A.A.; Paublini, H. Influence of socio-demographic variables and tobacco consumption on the prevalence of atherogenic dyslipidemia and lipid triad in 418.343 spanish workers. Acad. J. Health Sci. 2023, 38, 84–89. [Google Scholar] [CrossRef]
- Friedewald, W.T.; Levy, R.I.; Fredrickson, D.S. Estimation of the concentration of low-density lipoprotein cholesterol in plasma, without use of the preparative ultracentrifuge. Clin. Chem. 1972, 18, 499–502. [Google Scholar] [CrossRef]
- Sastre-Alzamora, T.; Tomás-Gil, P.; Paublini, H.; Pallarés, L.; Ramírez-Manent, J.I.; López-González, A.A. Relationship between heart age and cardiometabolic risk scales in 139634 Spanish workers. Acad. J. Health Sci. 2024, 39, 141–148. [Google Scholar] [CrossRef]
- Domingo-Salvany, A.; Bacigalupe, A.; Carrasco, J.M.; Espelt, A.; Ferrando, J.; Borrell, C. del Grupo de Determinantes Sociales de Sociedad Española de Epidemiología. Propuestas de clase social neoweberiana y neomarxista a partir de la Clasificación Nacional de Ocupaciones 2011 [Proposals for social class classification based on the Spanish National Classification of Occupations 2011 using neo-Weberian and neo-Marxist approaches]. Gac. Sanit. 2013, 27, 263–272. [Google Scholar]
- Mestre-Font, M.; Busquets-Cortés, C.; Ramírez-Manent, J.I.; Tomás-Gil, P.; Paublini, H.; López-González, A.A. Influence of socio-demographic variables and healthy habits on the values of type 2 diabetes risk scales. Acad. J. Health Sci. 2024, 39, 99–106. [Google Scholar] [CrossRef]
- Lee, P.H.; Macfarlane, D.J.; Lam, T.H.; Stewart, S.M. Validity of the International Physical Activity Questionnaire Short Form (IPAQ-SF): A systematic review. Int. J. Behav. Nutr. Phys. Act. 2011, 8, 115. [Google Scholar] [CrossRef]
- Gallardo-Alfaro, L.; Bibiloni, M.d.M.; Mascaró, C.M.; Montemayor, S.; Ruiz-Canela, M.; Salas-Salvadó, J.; Corella, D.; Fitó, M.; Romaguera, D.; Vioque, J.; et al. Leisure-Time Physical Activity, Sedentary Behaviour and Diet Quality are Associated with Metabolic Syndrome Severity: The PREDIMED-Plus Study. Nutrients. 2020, 12, 1013. [Google Scholar] [CrossRef] [PubMed] [PubMed Central]
- García-Hermoso, A.; López-Gil, J.F.; Izquierdo, M.; Ramírez-Vélez, R.; Ezzatvar, Y. Exercise and Insulin Resistance Markers in Children and Adolescents With Excess Weight: A Systematic Review and Network Meta-Analysis. JAMA Pediatr. 2023, 177, 1276–1284, Erratum in: JAMA Pediatr. 2023, 177, 1362. https://doi.org/10.1001/jamapediatrics.2023.5135. [Google Scholar] [CrossRef] [PubMed] [PubMed Central]
- Fowler, J.R.; Tucker, L.A.; Bailey, B.W.; LeCheminant, J.D. Physical Activity and Insulin Resistance in 6,500 NHANES Adults: The Role of Abdominal Obesity. J. Obes. 2020, 2020, 3848256. [Google Scholar] [CrossRef] [PubMed] [PubMed Central]
- Mirabelli, M.; Chiefari, E.; Arcidiacono, B.; Corigliano, D.M.; Brunetti, F.S.; Maggisano, V.; Russo, D.; Foti, D.P.; Brunetti, A. Mediterranean Diet Nutrients to Turn the Tide against Insulin Resistance and Related Diseases. Nutrients 2020, 12, 1066. [Google Scholar] [CrossRef] [PubMed] [PubMed Central]
- Guasch-Ferré, M.; Willett, W.C. The Mediterranean diet and health: A comprehensive overview. J. Intern. Med. 2021, 290, 549–566. [Google Scholar] [CrossRef] [PubMed]
- Pavlidou, E.; Papadopoulou, S.K.; Fasoulas, A.; Papaliagkas, V.; Alexatou, O.; Chatzidimitriou, M.; Mentzelou, M.; Giaginis, C. Diabesity and Dietary Inter-ventions: Evaluating the Impact of Mediterranean Diet and Other Types of Diets on Obesity and Type 2 Diabetes Management. Nutrients 2023, 16, 34. [Google Scholar] [CrossRef] [PubMed] [PubMed Central]
- Camhi, S.M.; Katzmarzyk, P.T. Differences in body composition between metabolically healthy obese and metabolically abnormal obese adults. Int. J. Obes. 2014, 38, 1142–1145. [Google Scholar] [CrossRef] [PubMed] [PubMed Central]
- Hwang, Y.-C.; Hayashi, T.; Fujimoto, W.Y.; Kahn, S.E.; Leonetti, D.L.; McNeely, M.J.; Boyko, E.J. Visceral abdominal fat accumulation predicts the conversion of metabolically healthy obese subjects to an unhealthy phenotype. Int. J. Obes. 2015, 39, 1365–1370. [Google Scholar] [CrossRef] [PubMed] [PubMed Central]
- Adeva-Andany, M.M.; Domínguez-Montero, A.; Adeva-Contreras, L.; Fernández-Fernández, C.; Carneiro-Freire, N.; González-Lucán, M. Body Fat Distribution Contributes to Defining the Relationship between Insulin Resistance and Obesity in Human Diseases. Curr. Diabetes Rev. 2024, 20, e160823219824. [Google Scholar] [CrossRef] [PubMed]
- Cai, S.; Dang, J.; Zhong, P.; Ma, N.; Liu, Y.; Shi, D.; Zou, Z.; Dong, Y.; Ma, J.; Song, Y. Sex differences in metabolically healthy and metabolically unhealthy obesity among Chinese children and adolescents. Front. Endocrinol. 2022, 13, 980332, Erratum in: Front. Endocrinol. 2022, 13, 1074024. https://doi.org/10.3389/fendo.2022.1074024. [Google Scholar] [CrossRef] [PubMed] [PubMed Central]
- Kim, H.Y.; Kim, J.H. Temporal trends in the prevalence of metabolically healthy overweight and obesity in Korean youth: Data from the Korea National Health and Nutrition Examination Survey 2011–2019. Ann. Pediatr. Endocrinol. Metab. 2022, 27, 134–141. [Google Scholar] [CrossRef] [PubMed] [PubMed Central]
- Aguiló Juanola, M.C.; López-González, A.A.; Tomás-Gil, P.; Paublini, H.; Tárraga-López, P.J.; Ramírez-Manent, J.I. Influence of tobacco consumption on the values of different insulin resistance risk scales and non-alcoholic fatty liver disease and hepatic fibrosis scales in 418,343 spanish people. Acad. J. Health Sci. 2024, 39, 9–15. [Google Scholar] [CrossRef]
- Cano-Ibañez, N.; Gea, A.; Ruiz-Canela, M.; Corella, D.; Salas-Salvadó, J.; Schröder, H.; Navarrete-Muñoz, E.M.; Romaguera, D.; Martínez, J.A.; Barón-López, F.J.; et al. Diet quality and nutrient density in subjects with metabolic syndrome: Influence of socioeconomic status and lifestyle factors. A cross-sectional assessment in the PRED-IMED-Plus study. Clin. Nutr. 2020, 39, 1161–1173. [Google Scholar] [CrossRef] [PubMed]
- Paudel, S.; Ahmadi, M.; Phongsavan, P.; Hamer, M.; Stamatakis, E. Do associations of physical activity and sedentary behaviour with cardiovascular disease and mortality differ across socioeconomic groups? A prospective analysis of device-measured and self-reported UK Biobank data. Br. J. Sports Med. 2023, 57, 921–929. [Google Scholar] [CrossRef] [PubMed] [PubMed Central]
- Li, G.; Ma, Z.; Lu, Y.; Jiang, Y.; Zhao, H.; Sun, M.; Wang, Y.; He, Q.; Feng, Z.; Li, T.; et al. Associations of socioeconomic status and chronic stress with incident atrial fibrillation among older adults: A prospective cohort study from the UK biobank. Int. J. Cardiol. 2025, 418, 132633. [Google Scholar] [CrossRef] [PubMed]
- Tahapary, D.L.; Pratisthita, L.B.; Fitri, N.A.; Marcella, C.; Wafa, S.; Kurniawan, F.; Rizka, A.; Tarigan, T.J.E.; Harbuwono, D.S.; Purnamasari, D.; et al. Challenges in the diagnosis of insulin resistance: Focusing on the role of HOMA-IR and Tryglyceride/glucose index. Diabetes Metab. Syndr. 2022, 16, 102581. [Google Scholar] [CrossRef] [PubMed]
- Khoramipour, K.; Chamari, K.; Hekmatikar, A.A.; Ziyaiyan, A.; Taherkhani, S.; Elguindy, N.M.; Bragazzi, N.L. Adiponectin: Structure, Physio-logical Functions, Role in Diseases, and Effects of Nutrition. Nutrients 2021, 13, 1180. [Google Scholar] [CrossRef] [PubMed] [PubMed Central]
- Cui, C.; Liu, L.; Qi, Y.; Han, N.; Xu, H.; Wang, Z.; Shang, X.; Han, T.; Zha, Y.; Wei, X.; et al. Joint association of TyG index and high sensitivity C-reactive protein with cardiovascular disease: A national cohort study. Cardiovasc. Diabetol. 2024, 23, 156. [Google Scholar] [CrossRef] [PubMed] [PubMed Central]
- Rodriguez-Garcia, E.; Ruiz-Nava, J.; Santamaria-Fernandez, S.; Fernandez-Garcia, J.C.; Vargas-Candela, A.; Yahyaoui, R.; Tinahones, F.J.; Bernal-Lopez, M.R.; Gomez-Huelgas, R. Impli-cations of the Mediterranean diet and physical exercise on the lipid profile of metabolically healthy obese women as measured by nuclear magnetic resonance spectroscopy (1H NMR). Chem. Phys. Lipids. 2018, 213, 68–75. [Google Scholar] [CrossRef] [PubMed]
- Oh, E.; Cho, N.J.; Kang, H.; Kim, S.H.; Park, H.K.; Kwon, S.H. Computed tomography evaluation of skeletal muscle quality and quantity in people with morbid obesity with and without metabolic abnormality. PLoS ONE 2023, 18, e0296073. [Google Scholar] [CrossRef] [PubMed] [PubMed Central]
- Kolahdouzi, S.; Baghadam, M.; Kani-Golzar, F.A.; Saeidi, A.; Jabbour, G.; Ayadi, A.; De Sousa, M.; Zouita, A.; Abderrahmane, A.B.; Zouhal, H. Progressive circuit resistance training improves inflammatory biomarkers and insulin resistance in obese men. Physiol. Behav. 2019, 205, 15–21. [Google Scholar] [CrossRef] [PubMed]
- Wang, X.; Fan, M.; Meng, Q.; Wu, H.; Wang, Q.; Liu, T. Comparative study on the function of high-intensity intermittent exercise and continuous aerobic exerciseon obese children. Acad. J. Health Sci. 2024, 39, 40–49. [Google Scholar] [CrossRef]
- Celada Roldana, C.; López Díez, J.; Cerezuela, M.A.; Rider, F.; Tárraga Marcos, A.; Tárraga López, P.J.; López González, A.A.; Ramírez Manent, J.I. Cardiovascular effects of a nutritional educational intervention in diabetic patients with poor control. Acad. J. Health Sci. 2023, 38, 57–65. [Google Scholar] [CrossRef]
- Mukharjee, S.; Bank, S.; Maiti, S. Chronic Tobacco Exposure by Smoking Develops Insulin Resistance. Endocr. Metab. Immune Disord. Drug Targets 2020, 20, 869–877. [Google Scholar] [CrossRef] [PubMed]
- Maddatu, J.; Anderson-Baucum, E.; Evans-Molina, C. Smoking and the risk of type 2 diabetes. Transl Res. 2017, 184, 101–107. [Google Scholar] [CrossRef] [PubMed] [PubMed Central]
- Watanabe, K.; Wilmanski, T.; Diener, C.; Earls, J.C.; Zimmer, A.; Lincoln, B.; Hadlock, J.J.; Lovejoy, J.C.; Gibbons, S.M.; Magis, A.T.; et al. Multiomic signatures of body mass index identify heterogeneous health phenotypes and responses to a lifestyle intervention. Nat. Med. 2023, 29, 996–1008. [Google Scholar] [CrossRef] [PubMed] [PubMed Central]
- Torres García, J.C.; Tárraga López, P.J.; Ramírez Gallegos, I.; Tarraga Marcos, A.; López González, A.A.; Manent, J.I.R. Relación entre actividad Física y Riesgo Cardiovascular: Una revisión sistemática. Acad. J. Health Sci. 2024, 39, 26–40. [Google Scholar] [CrossRef]
- Papakonstantinou, E.; Oikonomou, C.; Nychas, G.; Dimitriadis, G.D. Effects of Diet, Lifestyle, Chrononutrition and Alternative Dietary Interventions on Postprandial Glycemia and Insulin Resistance. Nutrients 2022, 14, 823. [Google Scholar] [CrossRef] [PubMed] [PubMed Central]
- Trang, K.; Grant, S.F.A. Genetics and epigenetics in the obesity phenotyping scenario. Rev. Endocr. Metab. Disord. 2023, 24, 775–793. [Google Scholar] [CrossRef] [PubMed] [PubMed Central]
- Gasmi, A.; Noor, S.; Menzel, A.; Doşa, A.; Pivina, L.; Bjørklund, G. Obesity and Insulin Resistance: Associations with Chronic In-flammation, Genetic and Epigenetic Factors. Curr. Med. Chem. 2021, 28, 800–826. [Google Scholar] [CrossRef] [PubMed]
- Ling, C. Epigenetic regulation of insulin action and secretion—Role in the pathogenesis of type 2 diabetes. J. Intern. Med. 2020, 288, 158–167. [Google Scholar] [CrossRef] [PubMed]
- Zembic, A.; Eckel, N.; Stefan, N.; Baudry, J.; Schulze, M.B. An Empirically Derived Definition of Metabolically Healthy Obesity Based on Risk of Cardiovascular and Total Mortality. JAMA Netw. Open 2021, 4, e218505. [Google Scholar] [CrossRef] [PubMed] [PubMed Central]
- WWang, W.-Q.; Wei, B.; Song, Y.-P.; Guo, H.; Zhang, X.-H.; Wang, X.-P.; Yan, Y.-Z.; Ma, J.-L.; Wang, K.; Keerman, M.; et al. Metabolically healthy obesity and unhealthy normal weight rural adults in Xinjiang: Prevalence and the associated factors. BMC Public Health 2021, 21, 1940. [Google Scholar] [CrossRef] [PubMed] [PubMed Central]
- García-Perea, A.; Fernández-Cruz, E.; de la O-Pascual, V.; Gonzalez-Zorzano, E.; Moreno-Aliaga, M.J.; Tur, J.A.; Martinez, J.A. Nutritional and Lifestyle Features in a Mediterranean Cohort: An Epidemiological Instrument for Categorizing Metabotypes Based on a Computational Algorithm. Medicina 2024, 60, 610. [Google Scholar] [CrossRef] [PubMed] [PubMed Central]
- Safaei, M.; Sundararajan, E.A.; Driss, M.; Boulila, W.; Shapi’i, A. A systematic literature review on obesity: Understanding the causes & consequences of obesity and reviewing various machine learning approaches used to predict obesity. Comput. Biol. Med. 2021, 136, 104754. [Google Scholar] [CrossRef] [PubMed]

| Men n = 45,498 | Women n = 23,386 | ||
|---|---|---|---|
| Mean (SD) | Mean (SD) | p-Value | |
| Age (years) | 42.9 (10.0) | 42.0 (10.4) | <0.001 |
| Height (cm) | 173.2 (7.1) | 160.0 (6.7) | <0.001 |
| Weight (kg) | 99.7 (12.4) | 87.5 (12.3) | <0.001 |
| Waist (cm) | 96.7 (8.9) | 83.3 (8.8) | <0.001 |
| Hip (cm) | 108.6 (7.9) | 109.5 (9.3) | <0.001 |
| Systolic BP (mmHg) | 131.8 (16.2) | 124.0 (15.9) | <0.001 |
| Diastolic BP (mmHg) | 81.0 (10.7) | 76.9 (11.0) | <0.001 |
| Total cholesterol (mg/dL) | 204.1 (38.8) | 200.3 (37.4) | <0.001 |
| HDL-cholesterol (mg/dL) | 48.3 (7.0) | 51.2 (7.1) | <0.001 |
| LDL-cholesterol (mg/dL) | 124.5 (37.5) | 127.1 (37.0) | <0.001 |
| Triglycerides (mg/dL) | 158.6 (108.4) | 110.5 (55.8) | <0.001 |
| Glucose (mg/dL) | 92.3 (14.0) | 89.0 (13.4) | <0.001 |
| % | % | p-Value | |
| <30 years | 10.0 | 13.5 | <0.001 |
| 30–39 years | 28.3 | 28.2 | |
| 40–49 years | 34.5 | 32.3 | |
| 50–59 years | 22.6 | 21.9 | |
| 60–69 years | 4.6 | 4.3 | |
| Elementary school | 63.7 | 64.9 | <0.001 |
| High school | 32.3 | 30.6 | |
| University | 4.0 | 4.5 | |
| Social class I | 4.6 | 4.2 | <0.001 |
| Social class II | 15.7 | 21.4 | |
| Social class III | 79.7 | 74.4 | |
| No physical activity | 96.5 | 95.3 | <0.001 |
| Physical activity | 3.5 | 4.7 | |
| No Mediterranean diet | 91.8 | 85.1 | <0.001 |
| Mediterranean diet | 8.2 | 14.9 | |
| Non-smokers | 68.3 | 74.0 | <0.001 |
| Smokers | 31.7 | 26.0 |
| n = 8764 | n = 36,734 | n = 24,264 | n = 21,234 | n = 34,660 | n = 10,838 | ||||
|---|---|---|---|---|---|---|---|---|---|
| MHO (A) | NMHO (A) | MHO (B) | NMHO (B) | MHO (C) | NMHO (C) | ||||
| Men | Mean (SD) | Mean (SD) | p-Value | Mean (SD) | Mean (SD) | p-Value | Mean (SD) | Mean (SD) | p-Value |
| TyG index | 8.3 (0.3) | 8.9 (0.6) | <0.001 | 8.4 (0.4) | 9.0 (0.6) | <0.001 | 8.5 (0.5) | 9.1 (0.6) | <0.001 |
| TyG-BMI | 264.7 (19.6) | 297.6 (38.2) | <0.001 | 270.9 (23.3) | 303.5 (38.6) | <0.001 | 278.7 (27.1) | 313.0 (40.0) | <0.001 |
| TyG-waist | 774.5 (52.8) | 880.1(105.1) | <0.001 | 794.9 (65.5) | 898.6(103.7) | <0.001 | 822.0 (78.8) | 926.6(103.5) | <0.001 |
| TyG-WtHR | 4.5 (0.3) | 5.1 (0.6) | <0.001 | 4.6 (0.4) | 5.2 (0.6) | <0.001 | 4.7 (0.4) | 5.3 (0.6) | <0.001 |
| METS-IR | 45.6 (3.4) | 52.6 (7.0) | <0.001 | 47.0 (4.1) | 53.8 (7.0) | <0.001 | 48.7 (4.8) | 55.8 (7.2) | <0.001 |
| SPISE-IR | 2.1 (0.2) | 2.5 (0.5) | <0.001 | 2.1 (0.3) | 2.6 (0.5) | <0.001 | 2.2 (0.3) | 2.7 (0.5) | <0.001 |
| PRISQ | 17.4 (6.8) | 26.8 (8.4) | <0.001 | 20.4 (7.7) | 28.1 (8.0) | <0.001 | 22.7 (8.0) | 29.9 (7.6) | <0.001 |
| Women | n = 6146 | n = 17,240 | n = 14,446 | n = 8938 | n = 19,976 | n = 3410 | |||
| TyG index | 8.1 (0.4) | 8.5 (0.5) | <0.001 | 8.2 (0.4) | 8.6 (0.5) | <0.001 | 8.3 (0.4) | 8.7 (0.5) | <0.001 |
| TyG-BMI | 257.2 (15.5) | 293.1 (40.6) | <0.001 | 267.3 (25.2) | 300.0 (41.6) | <0.001 | 276.4 (31.3) | 311.2 (43.3) | <0.001 |
| TyG-waist | 659.4 (47.0) | 775.6 (97.2) | <0.001 | 702.6 (75.2) | 793.8 (95.6) | <0.001 | 730.9 (84.3) | 820.5 (95.5) | <0.001 |
| TyG-WtHR | 4.2 (0.3) | 4.8 (0.6) | <0.001 | 4.4 (0.4) | 4.9 (0.6) | <0.001 | 4.6 (0.5) | 5.1 (0.6) | <0.001 |
| METS-IR | 43.2 (2.2) | 50.4 (6.9) | <0.001 | 45.4 (4.4) | 51.7 (7.0) | <0.001 | 47.3 (5.2) | 53.6 (7.3) | <0.001 |
| SPISE-IR | 1.9 (0.2) | 2.4 (0.5) | <0.001 | 2.1 (0.3) | 2.4 (0.5) | <0.001 | 2.2 (0.4) | 2.6 (0.5) | <0.001 |
| PRISQ | 15.1 (6.5) | 23.6 (8.3) | <0.001 | 17.5 (7.0) | 25.3 (8.0) | <0.001 | 19.9 (7.6) | 27.6 (7.7) | <0.001 |
| n = 8764 | n = 36,734 | n = 24,264 | n = 21,234 | n = 34,660 | n = 10,838 | ||||
|---|---|---|---|---|---|---|---|---|---|
| MHO (A) | NMHO (A) | MHO (B) | NMHO (B) | MHO (C) | NMHO (C) | ||||
| Men | % | % | p-Value | % | % | p-Value | % | % | p-Value |
| TyG index high | 3.1 | 52.2 | <0.001 | 11.7 | 61.0 | <0.001 | 24.4 | 74.6 | <0.001 |
| METS-IR high | 9.4 | 58.9 | <0.001 | 18.3 | 67.8 | <0.001 | 32.1 | 80.3 | <0.001 |
| SPISE-IR high | 21.5 | 71.3 | <0.001 | 33.8 | 79.2 | <0.001 | 48.1 | 88.9 | <0.001 |
| PRISQ high | 5.3 | 51.8 | <0.001 | 19.9 | 58.1 | <0.001 | 30.7 | 67.6 | <0.001 |
| Women | n = 6146 | n = 17,240 | n = 14,446 | n = 8938 | n = 19,976 | n = 3410 | |||
| TyG index high | 5.0 | 31.2 | <0.001 | 7.9 | 38.1 | <0.001 | 13.4 | 52.8 | <0.001 |
| METS-IR high | 0.3 | 42.2 | <0.001 | 11.0 | 50.7 | <0.001 | 22.9 | 63.1 | <0.001 |
| SPISE-IR high | 5.9 | 55.8 | <0.001 | 22.2 | 64.5 | <0.001 | 35.8 | 76.3 | <0.001 |
| PRISQ high | 2.7 | 25.7 | <0.001 | 5.1 | 31.8 | <0.001 | 10.3 | 44.4 | <0.001 |
| TyG Index High | SPISE-IR High | METS-IR High | PRISQ High | |
|---|---|---|---|---|
| OR (95% CI) | OR (95% CI) | OR (95% CI) | OR (95% CI) | |
| Female | 1 | 1 | 1 | 1 |
| Male | 2.25 (2.14–2.35) | 1.22 (1.18–1.26) | 1.33 (1.26–1.40) | 1.36 (1.28–1.45) |
| <30 years | 1 | 1 | 1 | 1 |
| 30–39 years | 1.06 (1.03–1.09) | 1.09 (1.06–1.13) | 1.16 (1.09–1.23) | 1.10 (1.06–1.14) |
| 40–49 years | 1.11 (1.07–1.15) | 1.29 (1.20–1.38) | 1.35 (1.28–1.42) | 1.21 (1.16–1.26) |
| 50–59 years | 1.24 (1.12–1.37) | 1.59 (1.43–1.75) | 1.68 (1.50–1.86) | 1.85 (1.61–2.19) |
| 60–69 years | 1.61 (1.43–1.81) | 2.08 (1.80–2.36) | 1.99 (1.80–2.19) | 2.11 (1.88–2.34) |
| University | 1 | 1 | 1 | 1 |
| High school | 1.09 (1.06–1.12) | 1.12 (1.06–1.18) | 1.08 (1.04–1.12) | 1.07 (1.04–1.10) |
| Elementary school | 1.20 (1.13–1.27) | 1.28 (1.16–1.40) | 1.25 (1.18–1.32) | 1.23 (1.15–1.31) |
| Social class I | 1 | 1 | 1 | 1 |
| Social class II | 1.05 (1.02–1.08) | 1.21 (1.15–1.27) | 1.06 (1.03–1.10) | 1.16 (1.12–1.20) |
| Social class III | 1.29 (1.20–1.38) | 1.53 (1.37–1.70) | 1.33 (1.24–1.42) | 1.41 (1.31–1.51) |
| Physical activity | 1 | 1 | 1 | 1 |
| No physical activity | 6.34 (5.98–6.70) | 5.29 (4.96–5.62) | 6.78 (6.30–7.26) | 3.88 (3.59–4.18) |
| Mediterranean diet | 1 | 1 | 1 | 1 |
| No Mediterranean diet | 5.35 (4.99–5.71) | 3.40 (3.05–3.75) | 5.10 (4.70–5.51) | 2.90 (2.49–3.31) |
| Non-smokers | 1 | 1 | 1 | 1 |
| Smokers | 1.06 (1.03–1.10) | 1.16 (1.11–1.20) | 1.14 (1.09–1.18) | 1.03 (1.00–1.07) |
| MHO (A) | 1 | 1 | 1 | 1 |
| NMHO (A) | 4.67 (4.25–5.12) | 2.12 (2.02–2.21) | 2.05 (1.94–2.17) | 2.21 (2.07–2.36) |
| MHO (B) | 1 | 1 | 1 | 1 |
| NMHO (B) | 5.52 (5.27–5.79) | 2.98 (2.86–3.11) | 2.62 (2.51–2.74) | 2.36 (2.18–2.54) |
| MHO (C) | 1 | 1 | 1 | 1 |
| NMHO (C) | 8.79 (8.24–9.37) | 8.81 (8.10–9.58) | 4.25 (4.03–4.47) | 7.60 (6.59–8.77) |
Disclaimer/Publisher’s Note: The statements, opinions and data contained in all publications are solely those of the individual author(s) and contributor(s) and not of MDPI and/or the editor(s). MDPI and/or the editor(s) disclaim responsibility for any injury to people or property resulting from any ideas, methods, instructions or products referred to in the content. |
© 2025 by the authors. Licensee MDPI, Basel, Switzerland. This article is an open access article distributed under the terms and conditions of the Creative Commons Attribution (CC BY) license (https://creativecommons.org/licenses/by/4.0/).
Share and Cite
García Samuelsson, M.; Tárraga López, P.J.; López-González, Á.A.; Paublini, H.; Martínez-Almoyna Rifá, E.; Ramírez-Manent, J.I. Assessment of the Risk of Insulin Resistance in Workers Classified as Metabolically Healthy Obese. Nutrients 2025, 17, 1345. https://doi.org/10.3390/nu17081345
García Samuelsson M, Tárraga López PJ, López-González ÁA, Paublini H, Martínez-Almoyna Rifá E, Ramírez-Manent JI. Assessment of the Risk of Insulin Resistance in Workers Classified as Metabolically Healthy Obese. Nutrients. 2025; 17(8):1345. https://doi.org/10.3390/nu17081345
Chicago/Turabian StyleGarcía Samuelsson, Miguel, Pedro Juan Tárraga López, Ángel Arturo López-González, Hernán Paublini, Emilio Martínez-Almoyna Rifá, and José Ignacio Ramírez-Manent. 2025. "Assessment of the Risk of Insulin Resistance in Workers Classified as Metabolically Healthy Obese" Nutrients 17, no. 8: 1345. https://doi.org/10.3390/nu17081345
APA StyleGarcía Samuelsson, M., Tárraga López, P. J., López-González, Á. A., Paublini, H., Martínez-Almoyna Rifá, E., & Ramírez-Manent, J. I. (2025). Assessment of the Risk of Insulin Resistance in Workers Classified as Metabolically Healthy Obese. Nutrients, 17(8), 1345. https://doi.org/10.3390/nu17081345