Article

Maternal Obesity and Excessive Gestational Weight Gain Influence Endocannabinoid Levels in Human Milk Across Breastfeeding: Potential Implications for Offspring Development

by
Tatiana F. Pontes
1,
Gabriel Reis
2,
Gustavo R. C. Santos
2,
Henrique M. G. Pereira
2,
Gilberto Kac
3,
Ana L. L. Ferreira
3,† and
Isis H. Trevenzoli
1,*,†
1
Laboratório de Endocrinologia Molecular, Instituto de Biofísica Carlos Chagas Filho, Universidade Federal do Rio de Janeiro, Rio de Janeiro 21941-971, Brazil
2
Laboratório Brasileiro de Controle de Dopagem, Instituto de Química, Universidade Federal do Rio de Janeiro, Rio de Janeiro 21941-853, Brazil
3
Observatório de Epidemiologia Nutricional, Instituto de Nutrição Josué de Castro, Universidade Federal do Rio de Janeiro, Rio de Janeiro 21941-853, Brazil
*
Author to whom correspondence should be addressed.
These authors contributed equally to this work.
Nutrients 2025, 17(8), 1344; https://doi.org/10.3390/nu17081344
Submission received: 14 March 2025 / Revised: 3 April 2025 / Accepted: 8 April 2025 / Published: 14 April 2025
(This article belongs to the Special Issue Maternal Nutritional Status and Infant Development)

Abstract

:
Background/Objectives: Endocannabinoids are endogenous bioactive lipids that promote neurodevelopment and positive energy balance. Increased levels of endocannabinoids are associated with obesity, but the effect of maternal obesity on breast milk endocannabinoids across lactation is mostly unknown. Methods: Women from Rio de Janeiro (Brazil) (n = 92) were followed from the third trimester of pregnancy to 119 days postpartum, and milk samples were analyzed in the postpartum days 2–8 (T1), 28–47 (T2), and 88–119 (T3). We assessed the endocannabinoids anandamide (AEA) and 2-arachidonoylglycerol (2-AG) by high-performance liquid chromatography–mass spectrometry, leptin and insulin by immunoassay, and macronutrients by colorimetric assays in milk samples. Results: Milk AEA concentration was higher in T2 compared with T1 or T3, while 2-AG levels were higher in T2 and T3 compared with T1. Milk endocannabinoids were directly correlated with pre-pregnancy body mass index (BMI), gestational weight gain (GWG), and milk triglycerides. Triglyceride and leptin levels were higher in mature milk (T2 and T3) of women with BMI > 25 or excessive GWG. Adjusted linear regression models showed a positive association between excessive GWG and milk 2-AG (β = 1629; 95% CI: 467–2792; p = 0.008). Conclusions: The endocannabinoid levels are higher in mature milk from women with obesity or excessive GWG, which may impact offspring development and metabolism.

1. Introduction

Obesity or overweight is highly prevalent among women of reproductive age, reaching over 15% worldwide (World Health Organization, WHO, 2016). In the United States, the prevalence of pre-pregnancy obesity reaches nearly 30% of women [1,2], and in Brazil, it is 32.2%, according to the Brazilian National Survey on Child Nutrition (ENANI, 2019) [3]. Maternal obesity is an obstetric concern, increasing the risk for gestational diabetes, preeclampsia, preterm birth, and other complications for mothers and infants [4,5,6]. It has also been associated with changes in breast milk composition in humans [7,8,9] and animal models [10,11,12,13]. These nutritional and metabolic imbalances during critical periods of development may be associated with the developmental origins of health and disease (DOHaD), programming the long-term metabolic phenotype of the offspring [5,14]. The molecular mechanisms associated with the long-term impact of maternal obesity on offspring mainly involve epigenetic changes resulting in maladaptive gene expression and unfavorable metabolic phenotypes [15,16,17].
Obesity is commonly associated with an overactivation of the endocannabinoid system (ECS) in humans and animal models [18,19,20,21,22,23], but there are still controversies in the literature [24]. The ECS is a lipid signaling system comprising several endogenous cannabinoids (endocannabinoids), cannabinoid receptors, and metabolizing enzymes that synthesize or degrade these bioactive lipids. Anandamide (AEA) and 2-arachidonoylglycerol (2-AG) are the main endocannabinoids in mammals, which are synthesized from membrane phospholipids containing arachidonic acid (n-6 polyunsaturated fatty acid, n-6 PUFA). These major endocannabinoids present well-characterized effects mediated by the type 1 and type 2 cannabinoid receptors, including an increase in appetite and lipogenesis and a decrease in energy expenditure [19,25]. In early development, the ECS plays an important role in regulating neurogenesis, the proliferation of neural progenitors, cell lineage commitment, neuronal migration, axonal elongation, synaptogenesis, glial formation, postnatal myelination, and neural network formation [25,26,27,28]. Therefore, changes in the endocannabinoid levels and signaling in early life can potentially affect energy metabolism regulation and physiological brain development programming, which can have long-term adverse consequences.
During early development, breast milk is the optimal nutrition for neonates, providing water, nutrients, bioactive molecules, hormones, and microbiome, and, therefore, protecting infants while their immune system matures [29,30]. It was recently discovered that breast milk also contains endocannabinoids [31,32,33,34,35], but the effect of maternal nutritional status on milk endocannabinoid levels is mostly unclear. In the present study, we hypothesized that maternal obesity/overweight (BMI > 25) and excessive gestational weight gain (ex GWG) would be associated with an increased content of AEA and 2-AG in human breast milk. We further hypothesized that maternal dietary lipids would be correlated with the levels of endocannabinoids in breast milk because it has been demonstrated that n-3 PUFA decreases the AEA and 2-AG levels [36,37] and n-6 PUFA increases cannabinoid signaling [37,38] in other biological matrixes. Lastly, we hypothesized that there would be a differential profile of these endocannabinoids in breast milk across breastfeeding periods as babies’ needs change over time.

2. Materials and Methods

2.1. The Study Design and Eligibility Criteria

The data used in the present study were from a prospective cohort followed in a public health care center in Rio de Janeiro, Brazil. The participants’ recruitment lasted from February 2017 to April 2019. Details about the study design were previously described [8,39].
The current study analyzed data from a non-probabilistic sample of 92 women, with a baseline and three follow-ups, carried out at the following times, respectively: third trimester of pregnancy as baseline (between the 28th and 35th weeks of gestation) and postpartum days 2–8 (time 1—T1; sampling of colostrum), 28–50 (time 2—T2; sampling of 1-month milk), and 88 and 119 (time 3—T3; sampling of 3-month milk). Pregnant women who met the following eligibility criteria were included: age between 18 and 40 years old; time of pregnancy between the 28th and 35th weeks; singleton pregnancy and free of chronic non-transmissible diseases (diabetes, hypertension, heart diseases) and transmissible diseases; and singleton pregnancy. Participants were excluded when not breastfeeding during the follow-up (T1, T2, or T3) or when they developed gestational diabetes or preeclampsia, presented transmissible diseases, and delivered stillbirths or preterm infants (Figure 1).
Maternal pre-pregnancy BMI (weight (kg)/height (m)2) was calculated using self-reported pre-pregnancy weight (kg) and the height measured at 28–50 days postpartum (WHO 1995). Height was measured in duplicate using a stadiometer (Altura Exata, Belo Horizonte, Brazil). A third measurement was performed when a difference higher than 0.5 cm between the first two measurements was observed. In these cases, the mean of two similar measurements was used. The pre-pregnancy overweight/obesity variable was constructed based on the pre-pregnancy BMI categories (i.e., overweight/obesity BMI ≥ 25 kg/m2 and normal weight 18.5 < BMI < 25 kg/m2). Two women had a BMI < 18.5 kg/m2 (18.2 and 18.3 kg/m2) and were arbitrarily grouped in the normal weight category considering the cut-off proximity. Total gestational weight gain (GWG) was calculated as the difference between the body weight at the end of pregnancy and the self-reported pre-pregnancy weight. According to the Institute of Medicine (IOM, 2009) guidelines, GWG adequacy is categorized as follows: for women with a pre-pregnancy BMI < 18.5 kg/m2 (underweight), the recommended GWG is 12.5–18 kg; BMI between 18.5–24.9 kg/m2 (normal weight), it is 11.5–16 kg; BMI between 25–29.9 kg/m2 (overweight), it is 7–11.5 kg; and for those with a BMI ≥ 30 kg/m2 (obesity), it is 5–9 kg. GWG was considered excessive when above these recommended ranges [40].
A semiquantitative food frequency questionnaire (FFQ) was applied to estimate maternal dietary intake at the baseline time point. This instrument consisted of 85 food items and was previously validated in Brazil for estimating intakes of nutrients throughout gestation [41]. Estimates of dietary intake of total lipid, cholesterol, saturated, monounsaturated, and polyunsaturated lipids were considered. All dietary estimates were adjusted for total energy using the residual method [42].
The research protocol was carried out following the Declaration of Helsinki of 1975 and was approved by the Research Ethics Committees of the Municipal Secretary of Health and Civil Defense of the State of Rio de Janeiro (protocol number, CAAE: 49218115.0.3001.5279 approve on 8 July 2016) and by the research ethics committee of the Maternidade Escola da Universidade Federal do Rio de Janeiro (UFRJ) (CAAE: 49218115.0.0000.5275 approved on 25 February 2016).

2.2. Breast Milk Collection and Handling

The breast milk samples were collected at the public health care center during the T1, T2, and T3 interviews. This procedure was performed according to the Brazilian Network of Human Milk Banks protocol, regulated by the National Health Surveillance Agency (Brazil, 2007). The milk was collected manually, preferably by the participant, in the morning after breakfast.
Preceding breast milk extraction, general guidance on massage techniques to avoid engorgement and mastitis was provided. Subsequently, the nursing mother was instructed to wash her hands and use disposable head covers and face protection masks. The collections were performed directly in sterile, non-pyrogenic, ribonuclease (RNAse) and deoxyribonuclease (DNAse) free falcon tubes. In T1, 5 mL of milk was collected and later divided into 5 aliquots of 1 mL. At T2 and T3, 17 mL of milk were collected and distributed into 1 aliquot of 5 mL and 12 aliquots of 1 mL. Aliquoted samples were immediately frozen (−20 °C) and transported in a box with controlled temperature (1 °C to 5 °C) to be stored at −80 °C in the research laboratory for later analyses [7,39].

2.3. Milk Protein, Triglyceride, and Hormone Quantification

Protein breast milk concentration was assessed in skimmed milk by using the BCA PierceTM kit (Thermo Scientific, Waltham, MA, USA), and triglyceride concentration was determined in the whole milk by a colorimetric commercial kit (Bioclin, Quibasa Quimica, Belo Horizonte, Brazil), following the manufacturer’s recommendation. Leptin and insulin concentrations were assessed in skimmed milk by Milliplex kit (HMHEMAG-34K-07, Merck-Millipore, Burlington, MA, USA), following the manufacturer’s recommendations.

2.4. Milk Endocannabinoid Quantification

AEA and 2-AG milk concentrations were assessed by liquid chromatography–mass spectrometry (LC/MS) based on the method previously described for human milk [32] and rat milk [13] with slight adaptations. The assay was conducted using 180 μL of whole human milk or 180 μL of each standard of the calibration curve. The standard curve was obtained by serial dilution of the AEA and 2-AG standards (Cayman Chemical, Ann Arbor, MI, USA) in a 10% milk powder solution with the range of 0.03–5.0 ng/mL for AEA and 23–3000 ng/mL for 2-AG. The deuterated standards AEAd4 (1 ng) and 2-AGd5 (10 ng) (Cayman Chemical, USA) were added to each sample or curve as internal calibrators (20 μL). An ice-cold mixture of acetonitrile and PBS (1:1) was added to the samples and standards (1000 μL) for protein precipitation and lipid extraction. The proteins were separated by centrifugation (14,000× g, 4 °C, 5 min). The supernatant was acidified with 5 volumes of 5% phosphoric acid. Solid-phase extraction was performed using reversed-phase chromatography cartridges OASIS HLB (Waters Corp., Milford, MA, USA) following the manufacturer’s instructions. The lipid fraction was eluted from the columns with 1 mL of acetonitrile at room temperature. The eluate was dried under nitrogen steam at 32 °C for 20 min and resuspended in 100 μL of methanol for endocannabinoid detection (in triplicate) by LC-MS.
The chromatographic separation was performed in a reversed-phase column ACE CORE-25A-0502U (2.5 μm, 50 mm × 2.1 mm) at 40 °C. The mobile phases comprised (A) H2O with 5 mM ammonium formate and 0.1% formic acid and (B) MeOH with 0.1% formic acid. The flow rate was set at 500 µL/min. The elution profile was 0–0.5 min, 75% B; 0.5–2 min, 75–100% B; 2–4 min, 100% B; 4–4.1 min, 75% B; 4.1–5.0, 75% B to equilibration to the initial conditions. The overall run time was 5 min, and the injection volume was 20.0 µL. The LC effluent was pumped to a Q-Exactive mass spectrometer (Q Exactive Plus-Ultimate 3000 HPLC system, Thermo Scientific, Bremen, Germany), operating in positive ionization mode. The spray voltage was set at 3.9 and 2.9 kV in positive ionization mode. The capillary temperature was 380 °C, and the S-lens radio frequency (RF) level was set at 80 (arbitrary units). The nitrogen sheath and auxiliary gas flow rates were set at 60 and 20 (arbitrary units). To ensure mass accuracies below 6 ppm, the instrument was calibrated in positive mode using the manufacturer’s calibration solution (Thermo Fisher Scientific, Bremen, Germany). The mass spectrometer acquired FullMS and T-SIM at a resolution of 70.000 full width at half maximum (FWHM) and with an automatic gain control (AGC) of 106, maximum IT 75 ms. The target masses were 348.2890 m/z to AEA, 379.2837 m/z to 2-AG, 352.3143 m/z to D4-AEA, and 384.3153 m/z to D5-2AG.

2.5. Statistical Analysis

The sample size of the present study was not calculated a priori because this was a probabilistic sampling cohort. However, a posteriori analysis was performed using the G*Power program v.3.1.9.6 [43] and the milk concentration of leptin, AEA, and 2-AG as parameters. Regarding leptin, one of the main hormonal hallmarks of obesity, the inclusion of at least 14 women per group would result in a statistical power of 80% (1-β = 0.8) to identify statistically significant differences (α = 0.05), with an effect size of d = 0.99, a two-tailed test, and a sample size ratio = 1. For the endocannabinoids, AEA and 2-AG, considering the same statistical power, a sample size of 38 and 24, respectively, would be used per group. Using the actual sample concentrations obtained in the present study, the effect size for leptin at T2 and pre-pregnancy BMI was d = 1.06, for AEA at T2 was d = 0.46, and for 2-AG at T2 was d = 0.56.
The distribution of the continuous variables was evaluated according to the Shapiro-Wilk test. Because those variables (milk compounds) did not present normal distribution, non-parametric tests were performed: 1-Mann–Whitney test was used to compare each compound concentration per time point separately (BMI < 25 vs. BMI ≥ 25 or n GWG vs. e GWG), and 2-Kruskal–Wallis test with Dunn’s post hoc test was used to evaluate the time variation of each compound in the breast milk, considering all the samples without categorization. The dietary intake data were adjusted according to the total energy consumed by the participants using the residues method [42].
Spearman correlations were performed between variables of maternal dietary intake during pregnancy and maternal anthropometric variables and the content of triglycerides, proteins, endocannabinoids, and hormones in milk at all time points. For this analysis, a moderate correlation was considered at 0.25 > R2 < 0.50, a high correlation at R2 > 0.50, and a low correlation at R2 < 0.25.
Linear regression models were used to investigate the association of anthropometric variables and lipid dietary intake and the composition of endocannabinoids in milk, considering a single sample set from 2 to 119 days with only one sample from each woman (n = 84). For this analysis, all women with milk samples at T2 (n = 60), women with samples at T1 (n = 15, including those with samples also at the last visit), and those with samples exclusively at T3 (n = 9) were included.
The confounders were selected according to a theoretical model based on the scientific literature. Additionally, the human milk compounds that showed significant correlations with endocannabinoids were used as adjustments. The following variables were used: maternal age, parity, years of schooling, postpartum time of the sample, and milk triglycerides and leptin. Statistical analyses were performed using Prisma software, version 9.0, and RStudio version 4.1.2 (R Core Team, 2021). A significance level < 0.05 was used for all analyses.

3. Results

3.1. Anthropometric and Demographic Profile of the Participants

In this study, 147 women were recruited and signed the term of consent form. Forty-nine women were excluded at the beginning of the study because of missing visits, changing the living area, or not meeting the inclusion criteria. Additionally, six participants did not collect milk samples. A total of 92 participants were included in this study, from whom 149 milk samples were collected: 41 samples in T1 (2–8 postpartum days), 67 samples in T2 (28–50 postpartum days), and 41 samples in T3 (88–119 postpartum days). Eight women were excluded from the FFQ analysis due to missing data or implausible energy intake (over 6000 kcal) (n = 84). Only six participants had samples collected across the three postpartum periods (Figure 1).
The median maternal age was 26 years old, and most of the participants had vaginal delivery (58.8%), and there was a higher prevalence of Black/Hispanic women in this cohort (60.9%). The median pre-pregnancy body mass index (BMI) and gestational weight gain (GWG) were 24.4 kg/m2 and 11.8 kg, respectively. Among the participants, 44 women were normal weight (51%), 26 were overweight (30%), and 14 were obese (16%). Two women had a BMI < 18.5 (18.2 and 18.3 kg/m2). The median energy intake per day was 2740 kcal (113 g protein, 432 g carbohydrates, and 84.6 g of total lipids). The n-6/n-3 ratio was 10.6 (Table 1).

3.2. Macronutrient and Hormone Profile in Human Milk

Milk protein concentration was higher at T1 (median: 16.26 mg/mL) compared with T2 (median: 13.49 mg/mL) (p = 0.0157) but not compared with T3 (median: 15.42 mg/mL). Milk triglyceride concentration was higher in T2 (median: 964.3) compared with T3 (median: 779.4 mg/mL) (p = 0.0426) but not compared with T1 (median: 842.4 mg/mL). Leptin and insulin milk concentration did not vary across the three-time points analyzed (Table 2).
Milk protein concentration was not altered in overweight or obese women or women with excessive GWG at any time point analyzed, but triglyceride concentration was 19.8% higher in milk samples from overweight or obese women at T3 compared with normal-weight women (p = 0.0195). Maternal pre-pregnancy overweight or excessive GWG did not account for insulin milk concentration variations. However, milk leptin concentration was 88.8% higher at T2 and 2-fold higher at T3 in overweight or obese women than in normal-weight women (p < 0.0001). In addition, leptin concentration was 63.6% higher in T2 milk samples from women presenting excessive GWG (p = 0.0141) (Table 3).

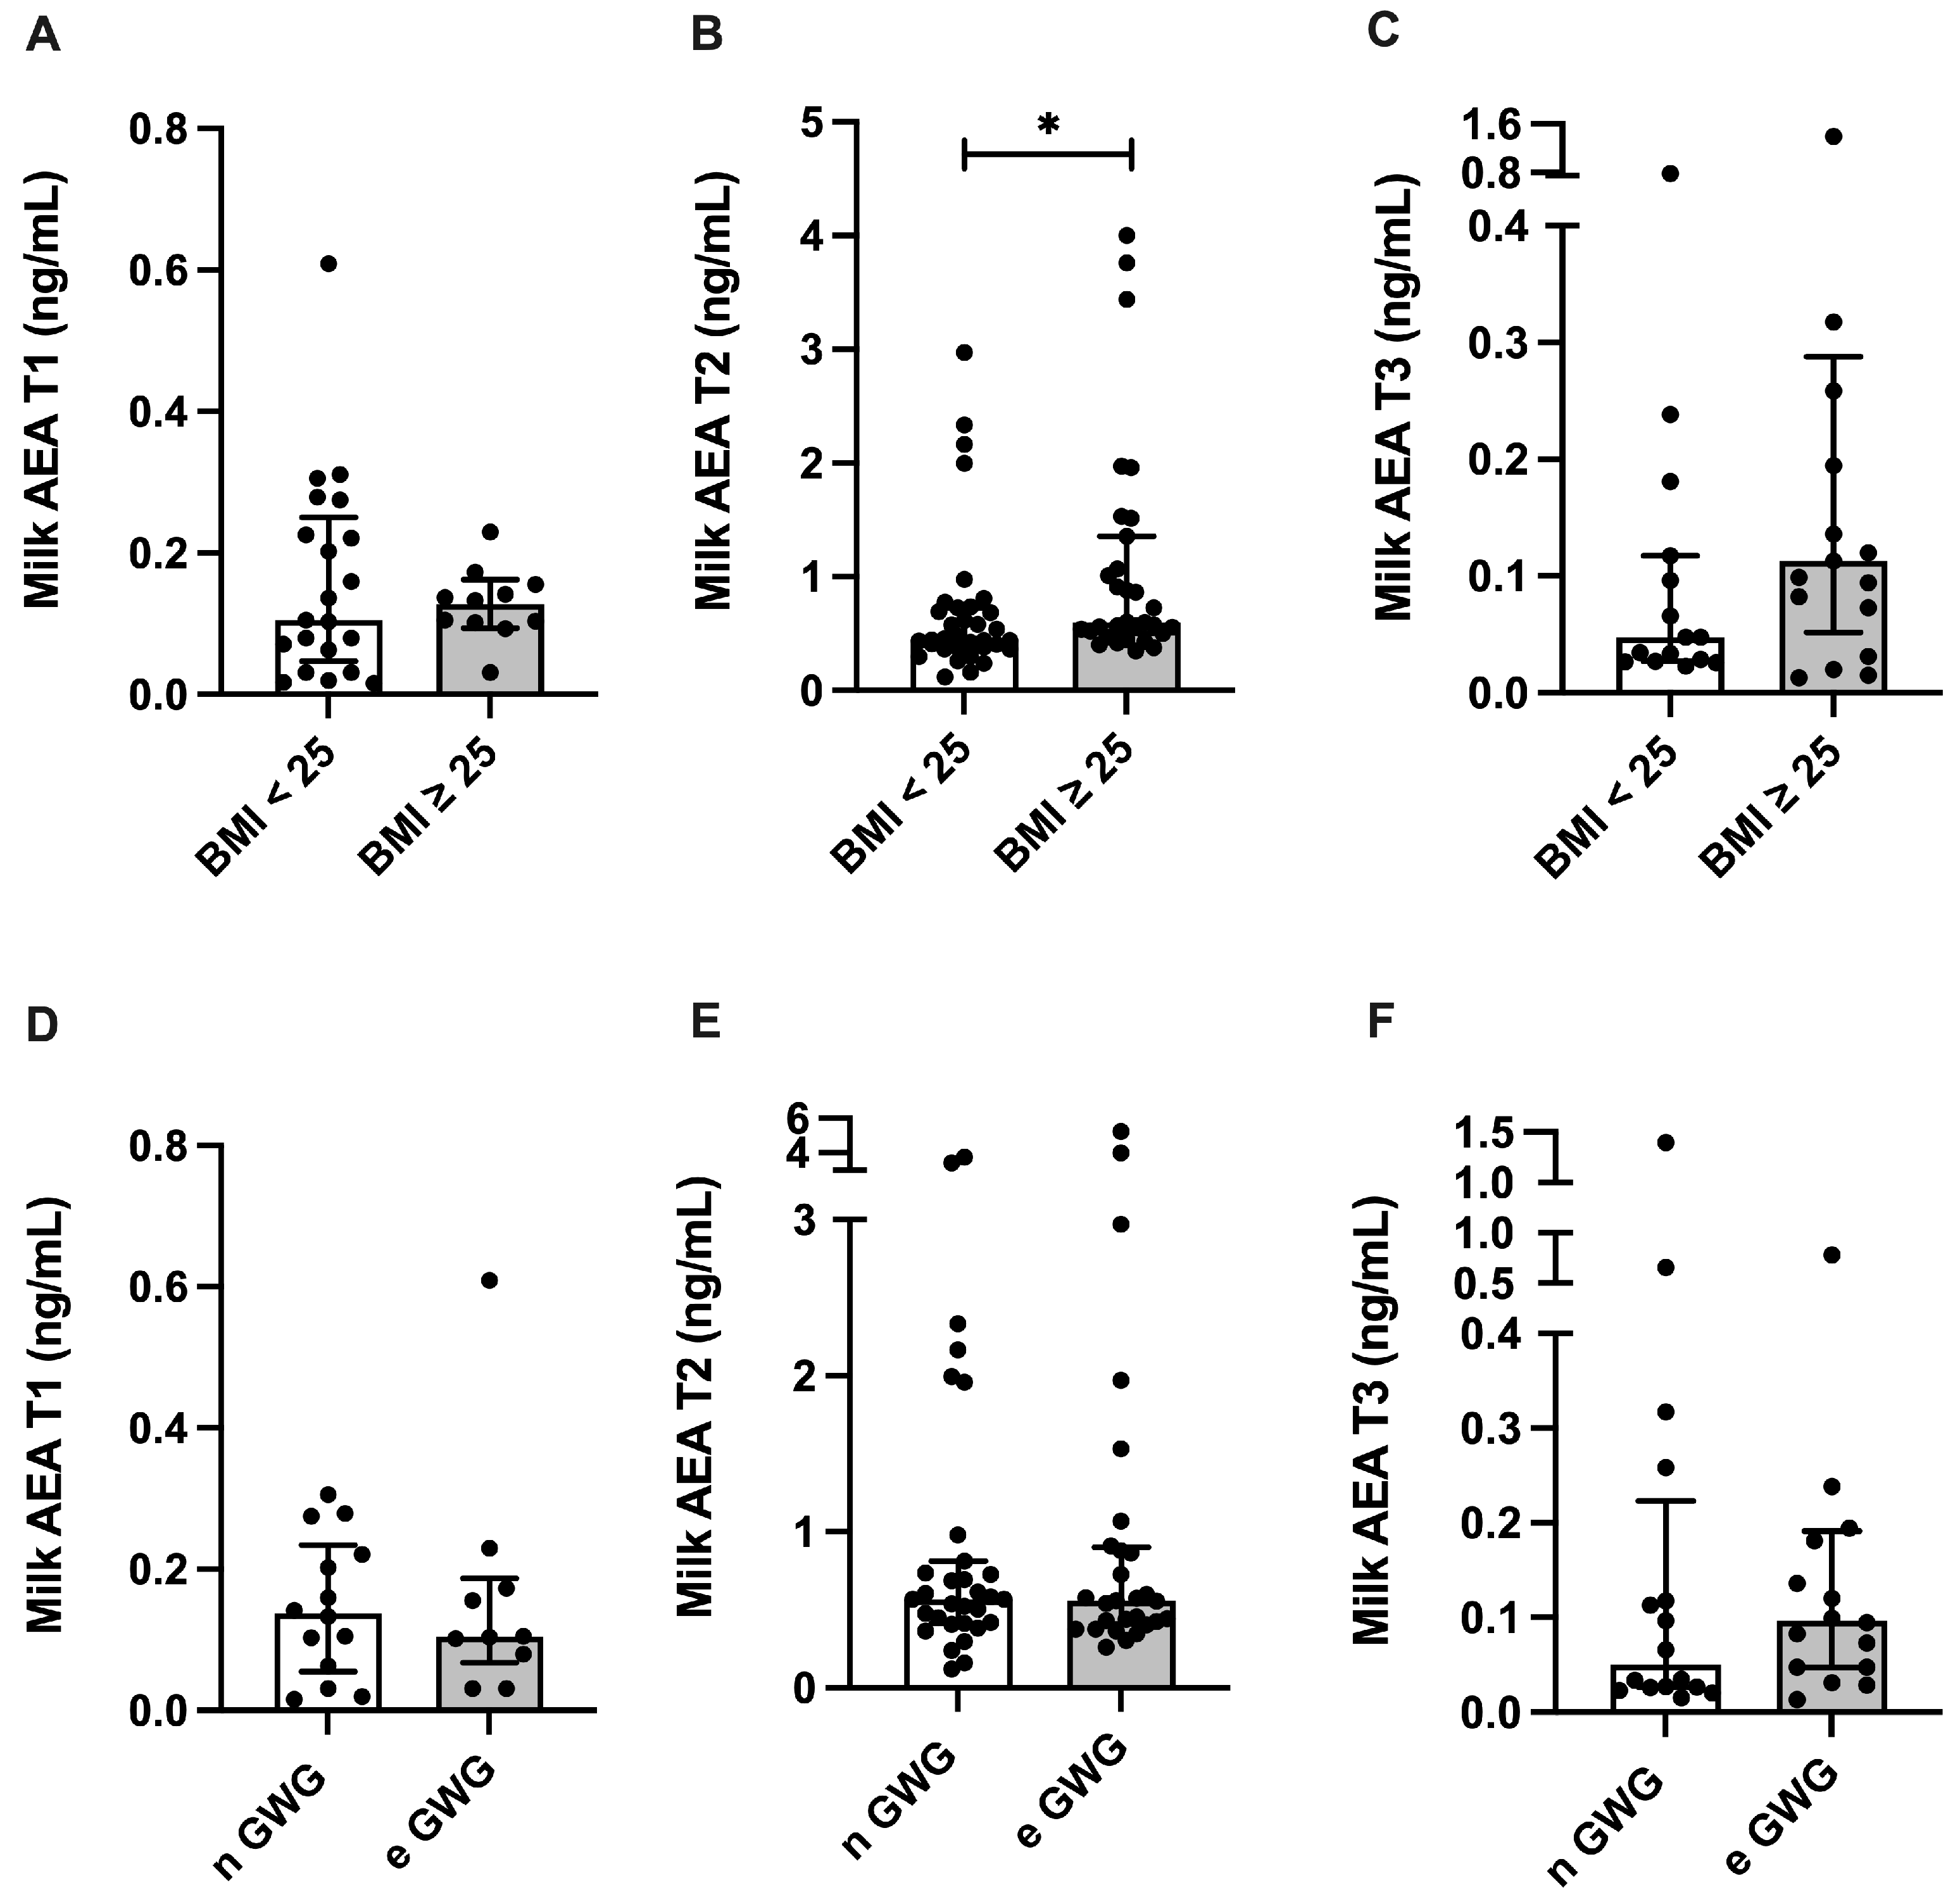
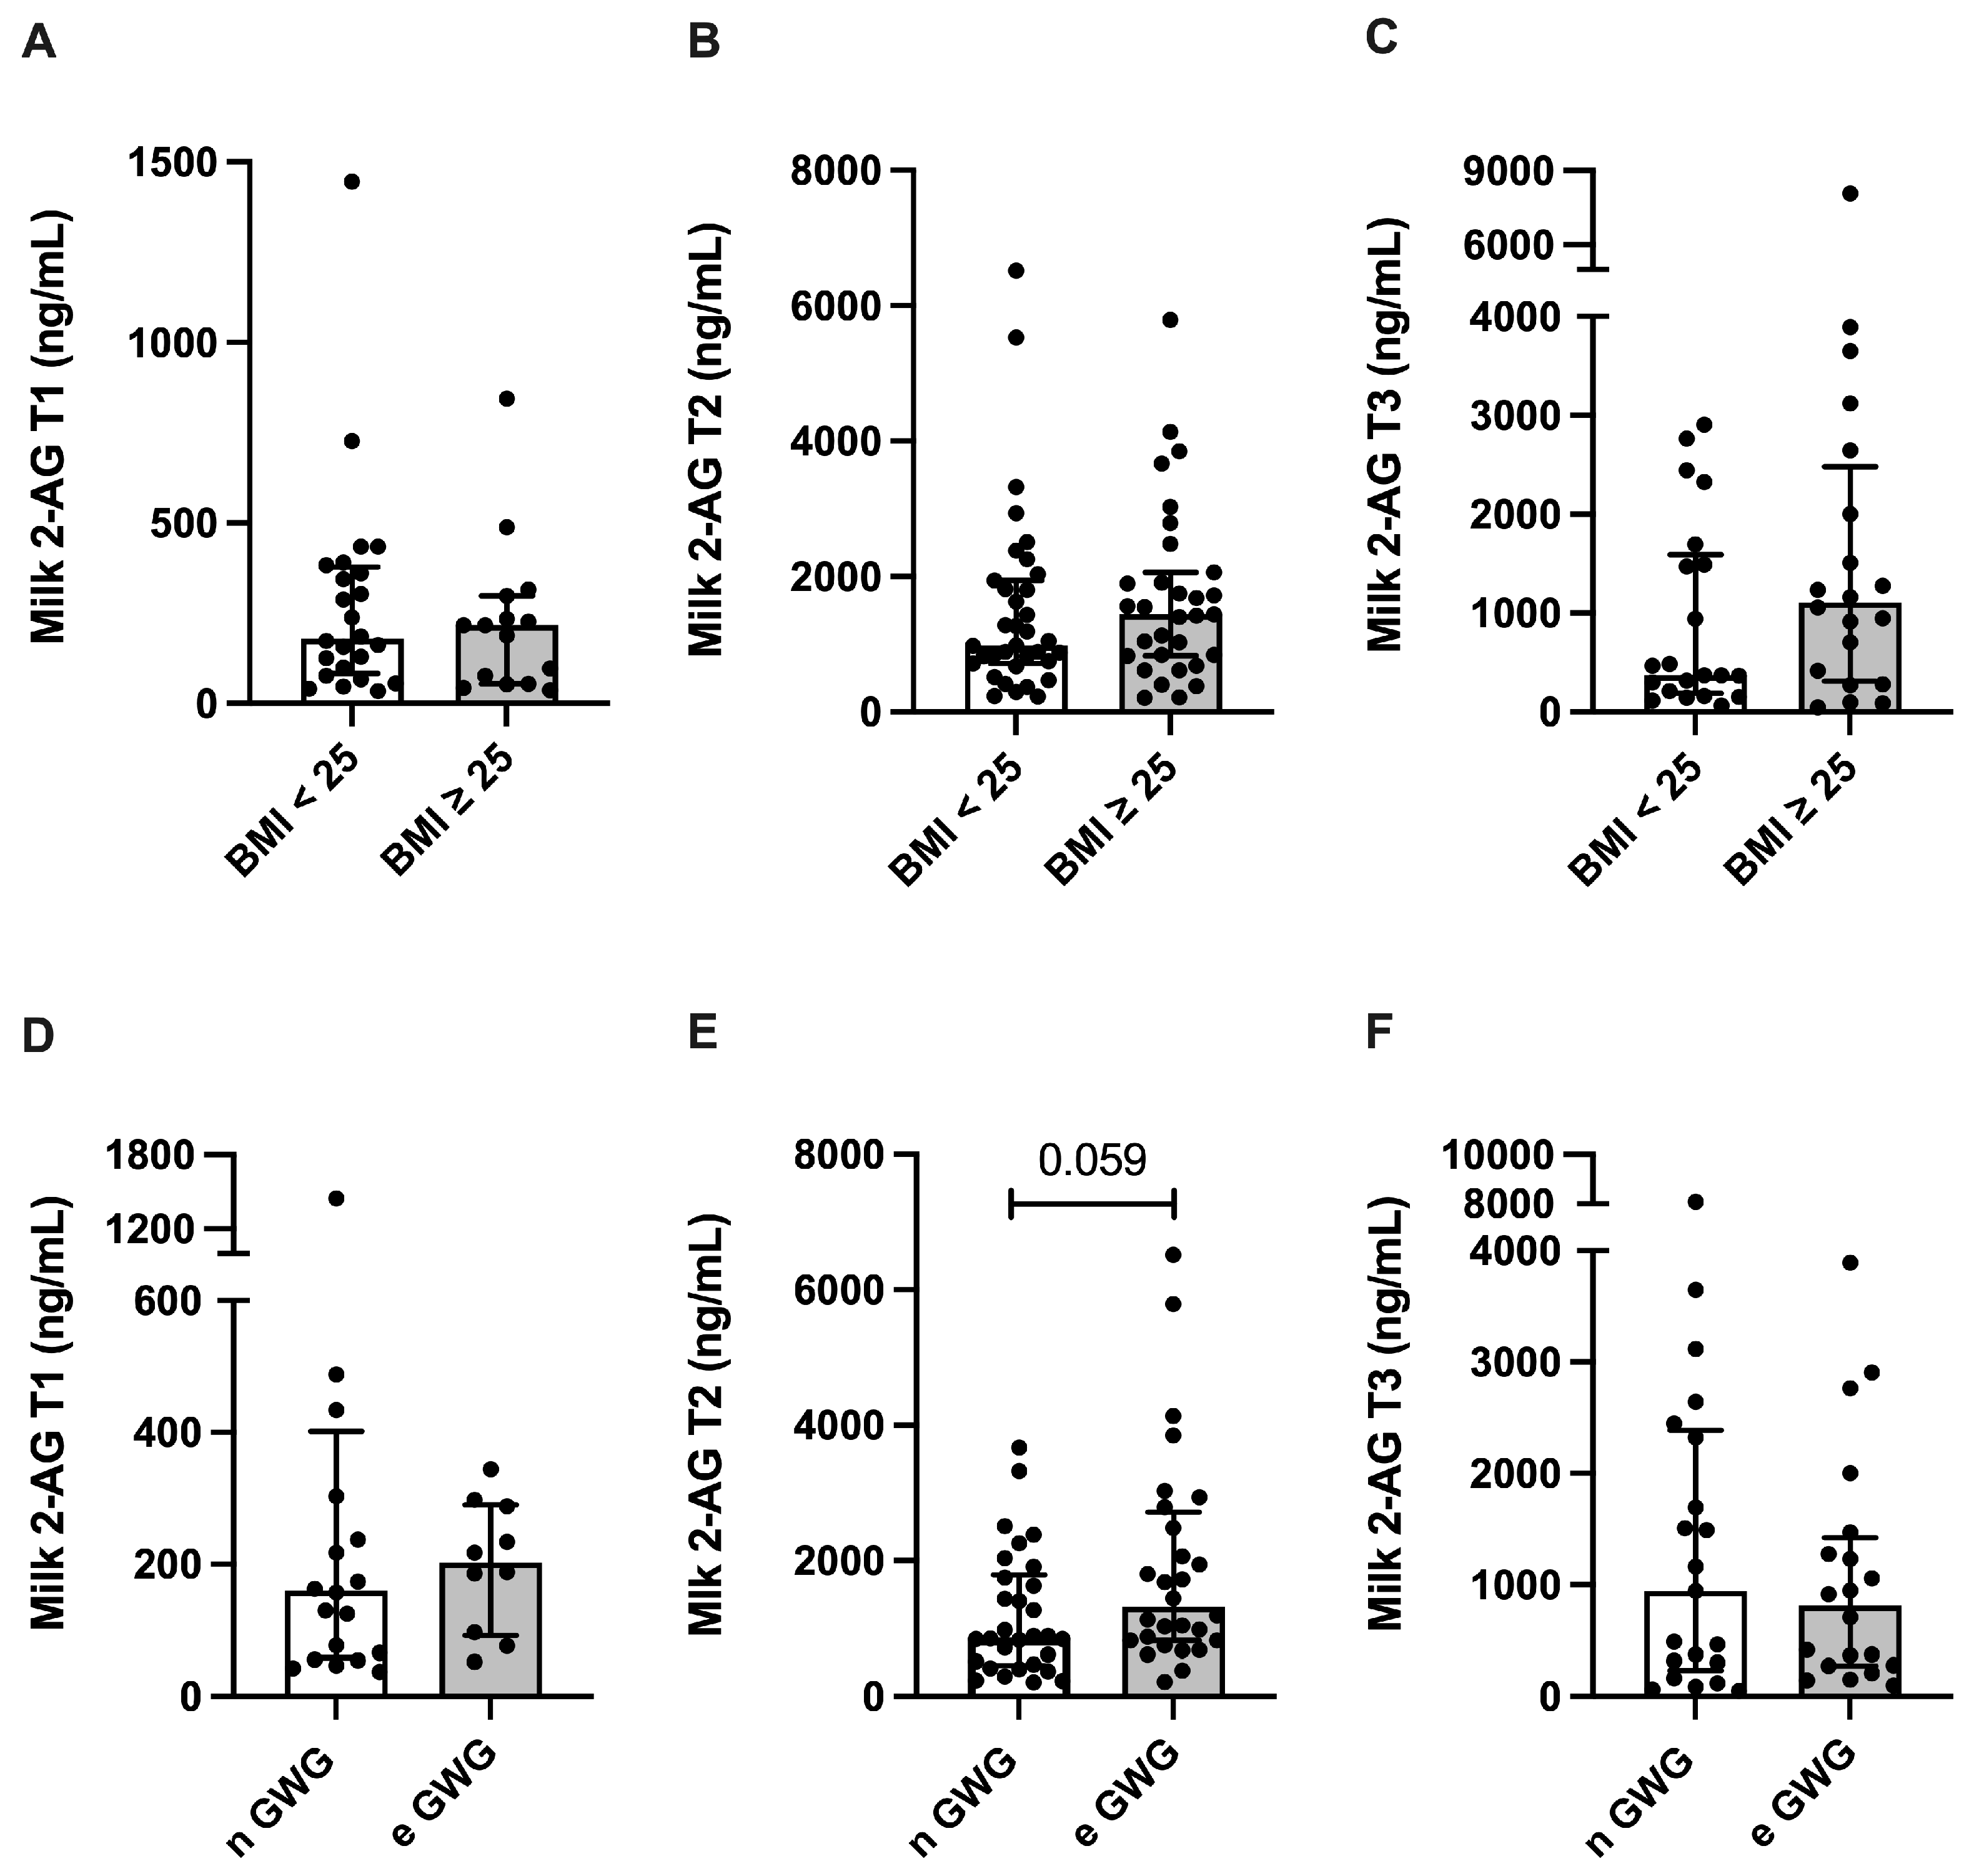
3.3. Endocannabinoid Profile in Human Milk

AEA and 2-AG milk concentration varied across lactation, with higher levels of AEA in T2 (median: 0.568 ng/mL), compared with T1 (median: 0.136 ng/mL) and T3 (median: 0.088 ng/mL) (p < 0.0001), and higher levels of 2-AG in T2 (median: 1269 ng/mL) and T3 (median: 916.6 ng/mL), compared with T1 (median: 187.8 ng/mL) (p < 0.001) (Figure 2). In addition, 2-AG milk concentration was approximately 1000-fold higher than the AEA concentration (Figure 2).
AEA milk concentration was 32.9% higher in overweight or obese women at T2, compared with normal-weight women (p = 0.0154), while excessive GWG did not alter AEA milk levels (Figure 3). The 2-AG milk concentration was not altered in overweight or obese women, but the 2-AG milk concentration in women presenting excessive GWG was 51.6% higher at T2 compared with normal GWG (p = 0.059) (Figure 4).

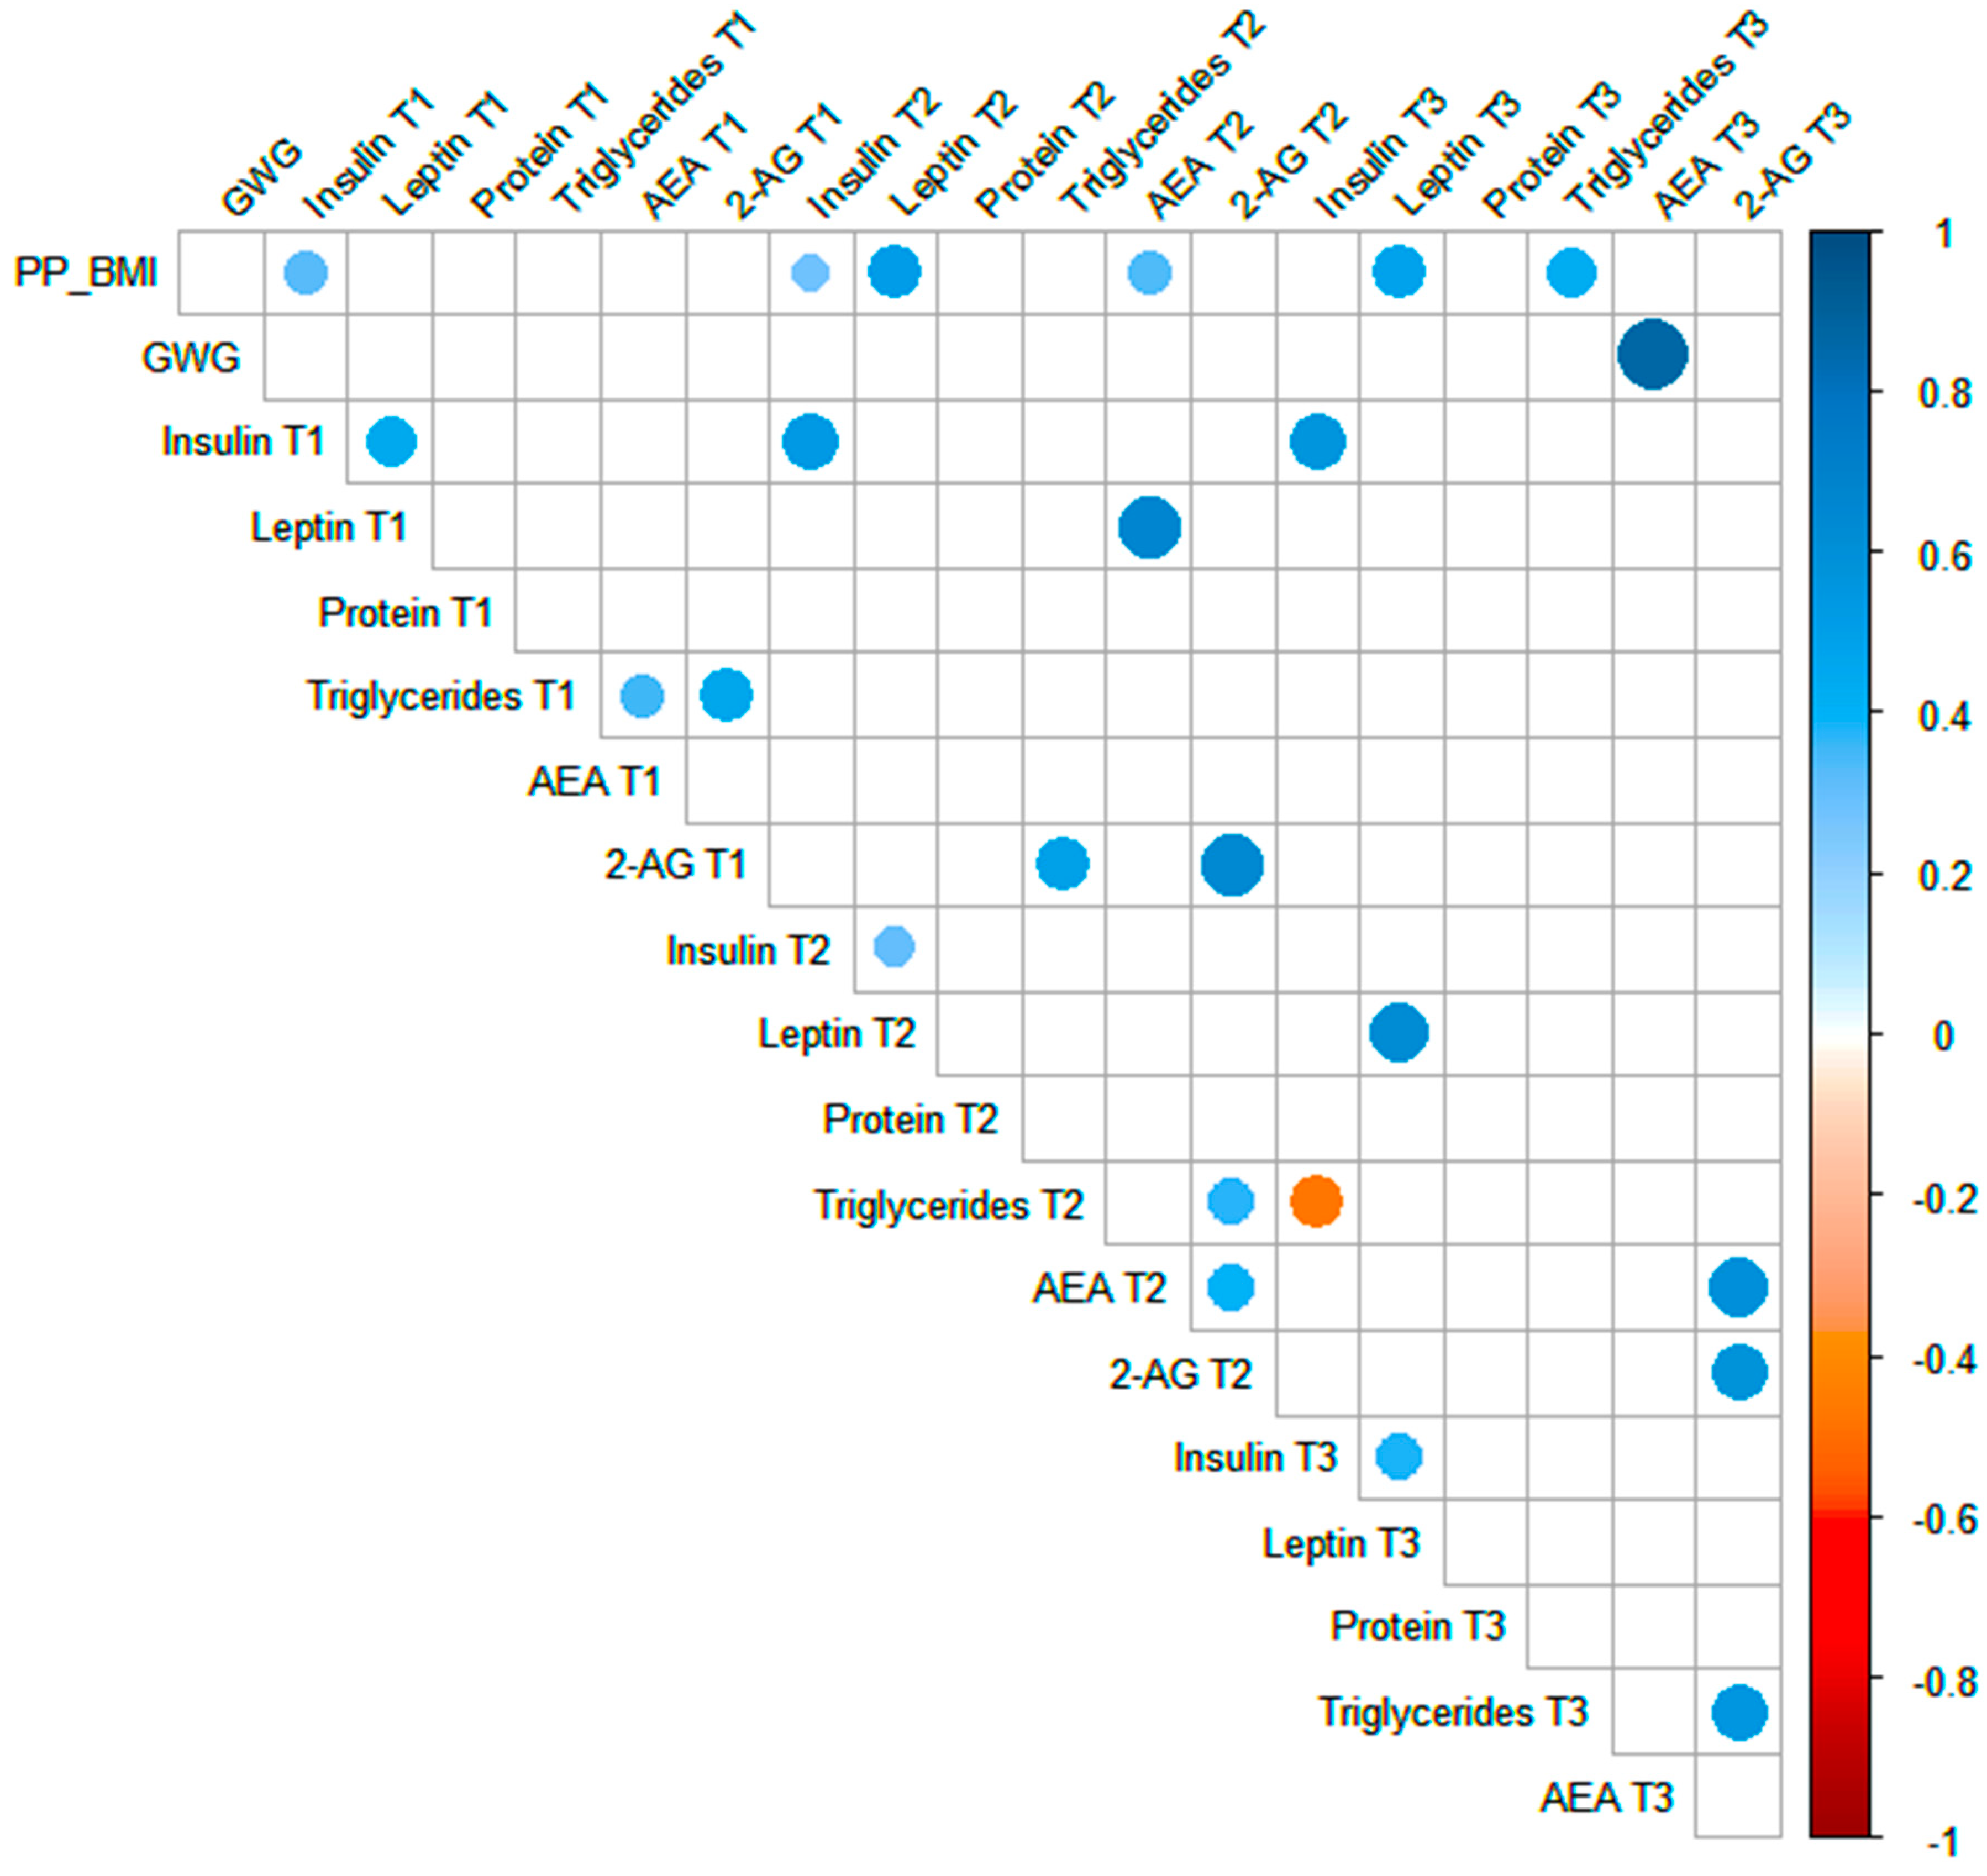
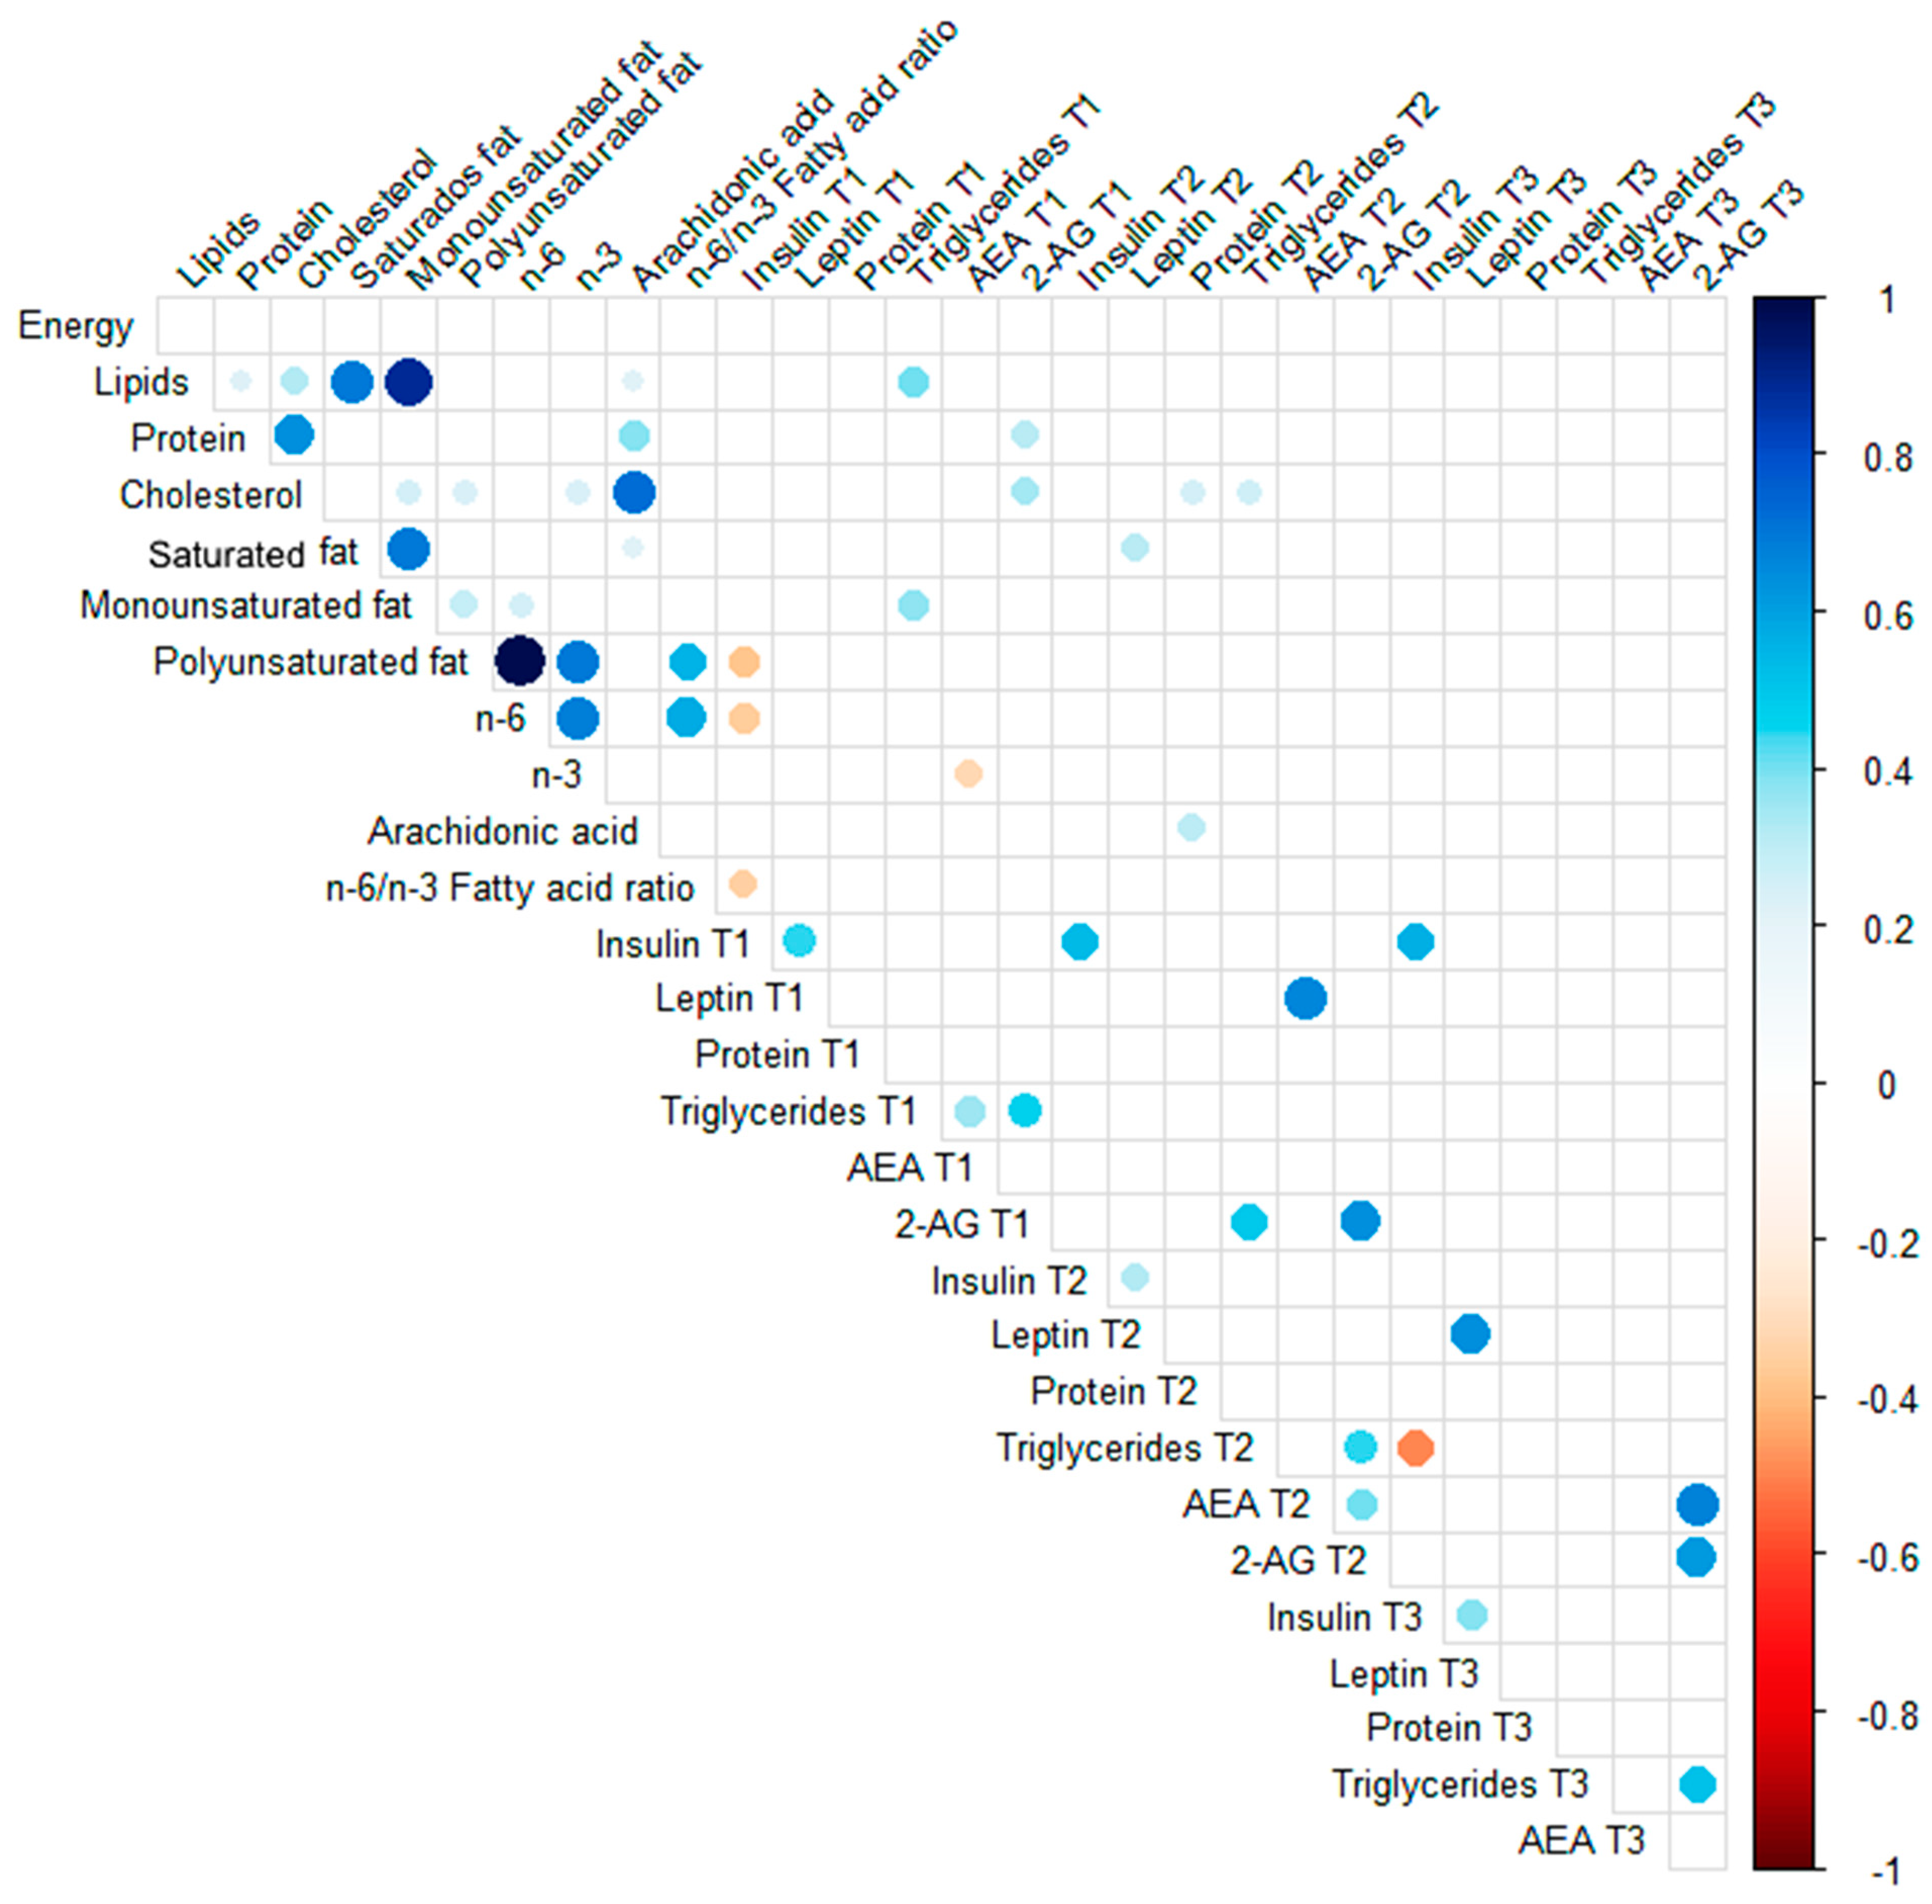
3.4. Spearman Correlations

Maternal anthropometric characteristics were significantly correlated with several milk components across lactation (Figure 5). Of note, maternal pre-pregnancy BMI was directly correlated with milk concentration of insulin (T1 and T2), leptin (T2 and T3), AEA (T2), and triglycerides (T3) (p < 0.05; 0.25 > R2 < 0.50). The maternal GWG was strongly and directly correlated with AEA milk concentration at T3 (p < 0.05; R2: 0.87). It was also observed a direct correlation between milk triglycerides and 2-AG concentration at T3 (p < 0.05; R2: 0.47) (Figure 5). The evaluation of correlations between maternal lipid intake and milk components was less prominent (Figure 6). Maternal intake of n-6 PUFA was inversely correlated with milk insulin concentration at T1 (p < 0.05; R2: −0.35), and the n-3 PUFA intake was inversely correlated with milk AEA concentration at T1 (p < 0.05; R2: −0.31).

3.5. Linear Regression Models

The unadjusted linear regression models showed a positive association between excessive GWG and the concentration of 2-AG in breast milk. Thus, women with excessive GWG had a 1366 ng/mL higher concentration of 2-AG in breast milk than those without excessive GWG (β = 1366; 95%CI: 362.4; 2370.7). After adjustments for triglyceride and leptin concentration in breast milk, maternal age, parity, and the analyzed lactation period, the positive linear association remained significant and was even stronger among women with excessive GWG and 2-AG content in milk (β = 1629.5; 95%CI: 466.7; 2792.3), compared with women without excessive GWG (Table 4). No significant associations were found between maternal dietary intake and the levels of endocannabinoids in breast milk (Table 5).

4. Discussion

In the present study, the main finding was that maternal pre-pregnancy overweight or obesity and excessive gestational weight gain were associated with increased levels of the endocannabinoids AEA and 2-AG in mature breast milk but not in colostrum. A significant variation in endocannabinoid concentrations was observed from colostrum to mature milk, with mature milk exhibiting higher concentrations. Notably, milk endocannabinoids were positively correlated with milk triglyceride and leptin levels and negatively correlated with maternal intake of n-3 PUFA during the third trimester of gestation.
Endocannabinoids are lipid-derived molecules, and a positive association between their levels and the lipid content of breast milk is expected. The median triglyceride concentration in breast milk was significantly higher at one month postpartum (T2) compared with three months (T3), which occurred parallel to an increase in the endocannabinoids AEA and 2-AG. Differently, the protein concentration was higher in colostrum (T1) when lower levels of endocannabinoids were exhibited. Higher protein concentration in colostrum has been observed in previous studies [44], and it has been associated with the content of proteins related to energy functions, the immune system, and bioactive compounds such as peptide-derived hormones and growth factors [45,46].
Milk samples of women with pre-pregnancy overweight or obesity showed higher triglyceride concentration compared with milk from women of normal weight at T3, with a positive correlation between these variables at the same time point. The association between maternal BMI and milk macronutrients varies across studies [47,48], likely due to differences in the source of lipids in breast milk, which may come from the diet or maternal energy stores, such as adipose tissue [49]. However, we found no marked correlations between milk components and maternal diet, possibly because the FFQ was applied to the volunteers during the third gestational trimester, while milk samples were collected up to three months postpartum. Thus, we speculate that the higher triglyceride content in breast milk of overweight or obese women is associated with increased mobilization from adipose tissue stores.
The adipocyte-derived hormone leptin and the pancreas-derived hormone insulin are also present in breast milk. These hormones are important for energy metabolism by inducing satiety and energy expenditure, but they also promote early development of the hypothalamic feeding circuitry [50,51,52]. In the present study, a robust increase in leptin concentration was observed in the milk of overweight or obese women compared with the women of normal weight. A similar profile was observed in the mature milk of women presenting excessive GWG. Spearman correlation analysis showed that leptin concentration in mature milk was positively correlated with maternal pre-pregnancy BMI, while insulin concentration in colostrum was positively correlated with maternal BMI. These findings corroborate other human studies on milk hormone composition [53,54,55,56,57]. Altered leptin levels in early life may increase the risk of overweight and obesity in offspring later in life [50,58]. Specifically, milk leptin concentration at one month postpartum has been positively associated with infant BMI up to two years of age [54].
Obesity is frequently associated with increased circulating levels of endocannabinoids [24,59,60,61], but the effect of maternal obesity on the endocannabinoid milk profile is poorly investigated. In the present study, maternal obesity or overweight and excessive GWG were associated with higher concentrations of endocannabinoids in mature milk, confirming the main hypothesis of this study. In contrast, a cohort study conducted in the United States did not find differences in milk 2-AG concentration between normal weight and overweight or obese women at four to eight weeks postpartum, and milk AEA concentration was reported to be very low and under the limit of detection [62]. This divergence between the studies may be attributed to (1) differences in sample size, as Datta et al. (2021) [62] included only 11–13 samples per group, and we analyzed 31–35 samples per group at a comparable time point (T2), and (2) differences in the timing of sample collection (morning vs. 24 h collection). Interestingly, Datta et al. reported higher levels of milk 2-AG during daytime compared with nighttime [62]. This physiological circadian rhythm has also been demonstrated for the serum levels of 2-AG [63]. This rhythm may contribute to feeding behavior during the day and decreased hypothalamus-pituitary-adrenal (cortisol) activity at night, modulated by the ECS [25]. More recently, Fradet et al. (2024) demonstrated that milk 2-AG concentration at two months postpartum is higher in samples of overweight or obese women with gestational diabetes compared with obese women who did not develop this comorbidity [35]. In addition, they found a negative correlation between non-n-3 N-acyl-ethanolamines (a subset of endocannabinoids) and the weight-for-age z-score of offspring from women with gestational diabetes [35]. Therefore, we suggest that both obesity and gestational diabetes may increase the levels of endocannabinoids in breast milk, potentially impacting offspring development.
In the present study, we observed that the concentration of 2-AG is 1000-fold higher than AEA across the three lactation time points, consistent with relative concentrations observed in other biological samples, such as the brain [64,65], and with previous studies reporting the absolute concentrations of these endocannabinoids in human milk [32,33,34,62,66,67]. To the best of our knowledge, this is the first study to evaluate endocannabinoid levels from colostrum to mature milk in both eutrophic and overweight or obese women. We observed that milk AEA peaked around one month postpartum (T2), and 2-AG levels also increased at T2 but remained in high concentrations for up to three months (T3). This profile is not yet fully understood, but it may be associated with neurodevelopmental processes occurring primarily after birth, such as synaptogenesis, myelinization, and synaptic pruning [68], as well as the initiation of suckling [69]. Corroborating the present results, it was demonstrated that the concentration of the endocannabinoid-like compound palmitoylethanolamide is increased in breast milk at six months compared with one month in a cohort of Guatemalan women [33]. In contrast, no differences in endocannabinoid concentration were observed between transitional milk at two weeks and mature milk at four weeks postpartum [32], or between mature milk at four to eight weeks and mature milk at four to six months postpartum [62] in two U.S. cohorts.
The main limitations of this study include (1) the incomplete emptying of the mammary glands during milk extraction, which may affect the lipid content of breast milk; (2) the lack of milk fatty acid data, which would be relevant given that endocannabinoids are derived from arachidonic acid (n-6 PUFA); and (3) the follow-up losses resulting in only six women with milk collected in all time points of lactation. This study was performed in a non-probabilistic sample, which limits the generalization of the findings. Although using longitudinal regression models with repeated measures (the ideal statistical approach for this study design) was not possible, using statistical models that accounted for adjustments of potential confounders was one strategy to ensure that the findings could be considered reliable. The strengths of the present study include (1) the evaluation of milk endocannabinoids at important time points of lactation (T1, T2, T3) according to maternal BMI, GWG, and dietary profile and (2) it is the first study conducted in a Brazilian population, using a greater sample size compared with previous studies on milk endocannabinoids.

5. Conclusions

The milk levels of the endocannabinoids AEA and 2-AG change differentially across breastfeeding time points, with a transient increase in AEA at one month postpartum and a sustained increase in 2-AG from one to three months. In addition, there was a negative association between maternal intake of n-3 PUFA and the milk levels of endocannabinoids. Maternal overweight or obesity and excessive GWG were associated with increased levels of both endocannabinoids, but there was stronger evidence of a positive association between excessive GWG and the milk levels of 2-AG.
The precise physiological relevance of the amounts of endocannabinoids in breast milk for offspring development remains to be determined, possibly using experimental models of maternal obesity as a more controlled approach. Future studies should also explore the association between elevated endocannabinoid levels in the breast milk of obese women and infant development. Assessing endocannabinoid levels in breast milk may have clinical implications for evaluating the risk of metabolic and neurodevelopmental complications in offspring. On the other hand, higher endocannabinoid levels in milk might benefit babies born with low birth weight, as these compounds could support positive energy balance and adequate brain development. In addition, nutritional interventions targeting maternal diet during breastfeeding, such as modulating dietary n-3 and n-6 PUFA, may be an interesting strategy for altering the levels of endocannabinoids in breast milk.

Author Contributions

T.F.P.: conceptualization, methodology, and data analysis. G.R., G.R.C.S. and H.M.G.P.: methodology—mass spectrometry. A.L.L.F.: data curation, statistical analysis, writing—original draft preparation, and writing—reviewing and editing. G.K.: data curation, supervision, funding acquisition, and writing—reviewing and editing. I.H.T.: conceptualization, investigation, methodology, data analysis, supervision, funding acquisition, and writing—reviewing and editing. All authors have read and agreed to the published version of the manuscript.

Funding

This research was funded by the Carlos Chagas Filho Foundation for Research Support in the State of Rio De Janeiro (FAPERJ; Grants E-26/202.668/2018 and E-26/010.002429/2019) and by the National Council for Scientific and Technological Development (CNPq; Grant 403339/2021-9). T.F.P. was a recipient of a master scholarship from FAPERJ (E-26/201.708/2021), and A.L.L.F. was a recipient of a postdoc fellowship from FAPERJ (E-26/200.429/2020).

Institutional Review Board Statement

The study was conducted in accordance with the Declaration of Helsinki and was approved by the Research Ethics Committees of the Municipal Secretary of Health and Civil Defense of the State of Rio de Janeiro (protocol number: CAAE: 49218115.0.3001.5279 approve on 8 July 2016) and by the research ethics committee of the Maternidade Escola da Universidade Federal do Rio de Janeiro (UFRJ) (CAAE: 49218115.0.0000.5275) on 25 February 2016.

Informed Consent Statement

Informed consent was obtained from all subjects involved in the study.

Data Availability Statement

The original contributions presented in this study are included in the article. Further inquiries can be directed to the corresponding author.

Acknowledgments

We are especially grateful to all women and infants participating in the cohort from the Public Health Center presented in this study. We also thank Juliana Pena Gonçalves for her technical support at the Laboratory of Molecular Endocrinology and Gustavo Ramalho and Gabriel Reis for their technical support with mass spectrometry in the Laboratory for Technical Development (LADETEC) of the Federal University of Rio de Janeiro, Brazil.

Conflicts of Interest

The authors declare no conflict of interest. The funders had no role in the design of the study; in the collection, analyses, or interpretation of data; in the writing of the manuscript; or in the decision to publish the results.

References

  1. Singh, G.K.; DiBari, J.N. Marked Disparities in Pre-Pregnancy Obesity and Overweight Prevalence among US Women by Race/Ethnicity, Nativity/Immigrant Status, and Sociodemographic Characteristics, 2012–2014. J. Obes. 2019, 2019, 2419263. [Google Scholar] [CrossRef] [PubMed]
  2. Driscoll, A.K.; Gregory, E.C.W. Prepregnancy Body Mass Index and Infant Outcomes by Race and Hispanic Origin: United States, 2020. Natl. Vital. Stat. Rep. 2021, 70, 1–8. [Google Scholar]
  3. Kac, G. Nutritional Status of Children and Mothers: Prevalence of Anthropometric Indicators of Brazilian Under-Five Children and Their Biological Mothers; Federal University of Rio de Janeiro: Rio de Janeiro, Brazil, 2022; Available online: https://enani.nutricao.ufrj.br/ (accessed on 11 March 2025).
  4. Brenes-Martin, F.; Melero-Jimenez, V.; Lopez-Guerrero, M.A.; Calero-Ruiz, M.M.; Vazquez-Fonseca, L.; Abalos-Martinez, J.; Quintero-Prado, R.; Torrejon, R.; Visiedo, F.; Bugatto, F. First Trimester Evaluation of Maternal Visceral Fat and Its Relationship with Adverse Pregnancy Outcomes. Biology 2023, 12, 144. [Google Scholar] [CrossRef]
  5. Inzani, I.; Ozanne, S.E. Programming by maternal obesity: A pathway to poor cardiometabolic health in the offspring. Proc. Nutr. Soc. 2022, 81, 227–242. [Google Scholar] [CrossRef] [PubMed]
  6. Poston, L.; Caleyachetty, R.; Cnattingius, S.; Corvalan, C.; Uauy, R.; Herring, S.; Gillman, M.W. Preconceptional and maternal obesity: Epidemiology and health consequences. Lancet Diabetes Endocrinol. 2016, 4, 1025–1036. [Google Scholar] [CrossRef] [PubMed]
  7. Ferreira, A.L.L.; Freitas-Costa, N.; da Silva Rosa Freire, S.; Figueiredo, A.C.C.; Padilha, M.; Alves-Santos, N.H.; Kac, G. Association of pre-pregnancy maternal overweight/obesity and dietary intake during pregnancy with the concentrations of persistent organic pollutants in the human milk of women from Rio de Janeiro, Brazil. Environ. Sci. Pollut. Res. Int. 2023, 30, 44999–45014. [Google Scholar] [CrossRef]
  8. Batalha, M.A.; Ferreira, A.L.L.; Freitas-Costa, N.C.; Figueiredo, A.C.C.; Carrilho, T.R.B.; Shahab-Ferdows, S.; Hampel, D.; Allen, L.H.; Perez-Escamilla, R.; Kac, G. Factors associated with longitudinal changes in B-vitamin and choline concentrations of human milk. Am. J. Clin. Nutr. 2021, 114, 1560–1573. [Google Scholar] [CrossRef]
  9. Samuel, T.M.; Zhou, Q.; Giuffrida, F.; Munblit, D.; Verhasselt, V.; Thakkar, S.K. Nutritional and Non-nutritional Composition of Human Milk Is Modulated by Maternal, Infant, and Methodological Factors. Front. Nutr. 2020, 7, 576133. [Google Scholar] [CrossRef]
  10. Bautista, C.J.; Montano, S.; Ramirez, V.; Morales, A.; Nathanielsz, P.W.; Bobadilla, N.A.; Zambrano, E. Changes in milk composition in obese rats consuming a high-fat diet. Br. J. Nutr. 2016, 115, 538–546. [Google Scholar] [CrossRef]
  11. Castillo, P.; Kuda, O.; Kopecky, J.; Pomar, C.A.; Palou, A.; Palou, M.; Pico, C. Reverting to a Healthy Diet during Lactation Normalizes Maternal Milk Lipid Content of Diet-Induced Obese Rats and Prevents Early Alterations in the Plasma Lipidome of the Offspring. Mol. Nutr. Food Res. 2022, 66, e2200204. [Google Scholar] [CrossRef]
  12. Franco, J.G.; Fernandes, T.P.; Rocha, C.P.; Calvino, C.; Pazos-Moura, C.C.; Lisboa, P.C.; Moura, E.G.; Trevenzoli, I.H. Maternal high-fat diet induces obesity and adrenal and thyroid dysfunction in male rat offspring at weaning. J. Physiol. 2012, 590, 5503–5518. [Google Scholar] [CrossRef]
  13. Dias-Rocha, C.P.; Costa, J.C.B.; Oliveira, Y.S.; Fassarella, L.B.; Woyames, J.; Atella, G.C.; Santos, G.R.C.; Pereira, H.M.G.; Pazos-Moura, C.C.; Almeida, M.M.; et al. Maternal high-fat diet decreases milk endocannabinoids with sex-specific changes in the cannabinoid and dopamine signaling and food preference in rat offspring. Front. Endocrinol. 2023, 14, 1087999. [Google Scholar] [CrossRef] [PubMed]
  14. Barker, D.J. The developmental origins of adult disease. J. Am. Coll. Nutr. 2004, 23, 588S–595S. [Google Scholar] [CrossRef] [PubMed]
  15. Jonsson, J.; Renault, K.M.; Garcia-Calzon, S.; Perfilyev, A.; Estampador, A.C.; Norgaard, K.; Lind, M.V.; Vaag, A.; Hjort, L.; Michaelsen, K.F.; et al. Lifestyle Intervention in Pregnant Women With Obesity Impacts Cord Blood DNA Methylation Which Associates With Body Composition in the Offspring. Diabetes 2021, 70, 854–866. [Google Scholar] [CrossRef] [PubMed]
  16. Alba-Linares, J.J.; Perez, R.F.; Tejedor, J.R.; Bastante-Rodriguez, D.; Ponce, F.; Carbonell, N.G.; Zafra, R.G.; Fernandez, A.F.; Fraga, M.F.; Lurbe, E. Maternal obesity and gestational diabetes reprogram the methylome of offspring beyond birth by inducing epigenetic signatures in metabolic and developmental pathways. Cardiovasc. Diabetol. 2023, 22, 44. [Google Scholar] [CrossRef]
  17. Si, J.; Meir, A.Y.; Hong, X.; Wang, G.; Huang, W.; Pearson, C.; Adams, W.G.; Wang, X.; Liang, L. Maternal pre-pregnancy BMI, offspring epigenome-wide DNA methylation, and childhood obesity: Findings from the Boston Birth Cohort. BMC Med. 2023, 21, 317. [Google Scholar] [CrossRef]
  18. Akurati, S.; Hanlon, E.C. Beyond the Scale: Exploring the Endocannabinoid System’s Impact on Obesity. Curr. Diabetes Rep. 2024, 25, 6. [Google Scholar] [CrossRef]
  19. Veilleux, A.; Di Marzo, V.; Silvestri, C. The Expanded Endocannabinoid System/Endocannabinoidome as a Potential Target for Treating Diabetes Mellitus. Curr. Diabetes Rep. 2019, 19, 117. [Google Scholar] [CrossRef]
  20. Iannotti, F.A.; Piscitelli, F.; Martella, A.; Mazzarella, E.; Allara, M.; Palmieri, V.; Parrella, C.; Capasso, R.; Di Marzo, V. Analysis of the “endocannabinoidome” in peripheral tissues of obese Zucker rats. Prostaglandins Leukot. Essent. Fatty Acids 2013, 89, 127–135. [Google Scholar] [CrossRef]
  21. Di Marzo, V.; Silvestri, C. Lifestyle and Metabolic Syndrome: Contribution of the Endocannabinoidome. Nutrients 2019, 11, 1956. [Google Scholar] [CrossRef]
  22. Engeli, S.; Bohnke, J.; Feldpausch, M.; Gorzelniak, K.; Janke, J.; Batkai, S.; Pacher, P.; Harvey-White, J.; Luft, F.C.; Sharma, A.M.; et al. Activation of the peripheral endocannabinoid system in human obesity. Diabetes 2005, 54, 2838–2843. [Google Scholar] [CrossRef] [PubMed]
  23. Martins, C.J.; Genelhu, V.; Pimentel, M.M.; Celoria, B.M.; Mangia, R.F.; Aveta, T.; Silvestri, C.; Di Marzo, V.; Francischetti, E.A. Circulating Endocannabinoids and the Polymorphism 385C>A in Fatty Acid Amide Hydrolase (FAAH) Gene May Identify the Obesity Phenotype Related to Cardiometabolic Risk: A Study Conducted in a Brazilian Population of Complex Interethnic Admixture. PLoS ONE 2015, 10, e0142728. [Google Scholar] [CrossRef]
  24. Mattelaer, N.; Van der Schueren, B.; Van Oudenhove, L.; Weltens, N.; Vangoitsenhoven, R. The circulating and central endocannabinoid system in obesity and weight loss. Int. J. Obes. 2024, 48, 1363–1382. [Google Scholar] [CrossRef] [PubMed]
  25. Almeida, M.M.; Dias-Rocha, C.P.; Calvino, C.; Trevenzoli, I.H. Lipid endocannabinoids in energy metabolism, stress and developmental programming. Mol. Cell Endocrinol. 2022, 542, 111522. [Google Scholar] [CrossRef] [PubMed]
  26. Uthayakumaran, K.; Sunil, M.; Ratcliffe, E.M. Evaluating the Role of the Endocannabinoid System in Axon Guidance: A Literature Review. Cannabis Cannabinoid Res. 2024, 9, 12–20. [Google Scholar] [CrossRef]
  27. Song, C.G.; Kang, X.; Yang, F.; Du, W.Q.; Zhang, J.J.; Liu, L.; Kang, J.J.; Jia, N.; Yue, H.; Fan, L.Y.; et al. Endocannabinoid system in the neurodevelopment of GABAergic interneurons: Implications for neurological and psychiatric disorders. Rev. Neurosci. 2021, 32, 803–831. [Google Scholar] [CrossRef]
  28. Paraiso-Luna, J.; Aguareles, J.; Martin, R.; Ayo-Martin, A.C.; Simon-Sanchez, S.; Garcia-Rincon, D.; Costas-Insua, C.; Garcia-Taboada, E.; de Salas-Quiroga, A.; Diaz-Alonso, J.; et al. Endocannabinoid signalling in stem cells and cerebral organoids drives differentiation to deep layer projection neurons via CB(1) receptors. Development 2020, 147, dev192161. [Google Scholar] [CrossRef]
  29. Boquien, C.Y. Human Milk: An Ideal Food for Nutrition of Preterm Newborn. Front. Pediatr. 2018, 6, 295. [Google Scholar] [CrossRef]
  30. Verduci, E.; Gianni, M.L.; Vizzari, G.; Vizzuso, S.; Cerasani, J.; Mosca, F.; Zuccotti, G.V. The Triad Mother-Breast Milk-Infant as Predictor of Future Health: A Narrative Review. Nutrients 2021, 13, 486. [Google Scholar] [CrossRef]
  31. Gouveia-Figueira, S.; Nording, M.L. Development and validation of a sensitive UPLC-ESI-MS/MS method for the simultaneous quantification of 15 endocannabinoids and related compounds in milk and other biofluids. Anal. Chem. 2014, 86, 1186–1195. [Google Scholar] [CrossRef]
  32. Gaitan, A.V.; Wood, J.T.; Zhang, F.; Makriyannis, A.; Lammi-Keefe, C.J. Endocannabinoid Metabolome Characterization of Transitional and Mature Human Milk. Nutrients 2018, 10, 1294. [Google Scholar] [CrossRef]
  33. Gaitan, A.V.; Wood, J.T.; Solomons, N.W.; Donohue, J.A.; Ji, L.; Liu, Y.; Nikas, S.P.; Zhang, F.; Allen, L.H.; Makriyannis, A.; et al. Endocannabinoid Metabolome Characterization of Milk from Guatemalan Women Living in the Western Highlands. Curr. Dev. Nutr. 2019, 3, nzz018. [Google Scholar] [CrossRef] [PubMed]
  34. Wu, J.; Gouveia-Figueira, S.; Domellof, M.; Zivkovic, A.M.; Nording, M.L. Oxylipins, endocannabinoids, and related compounds in human milk: Levels and effects of storage conditions. Prostaglandins Other Lipid Mediat. 2016, 122, 28–36. [Google Scholar] [CrossRef]
  35. Fradet, A.; Castonguay-Paradis, S.; Dugas, C.; Perron, J.; St-Arnaud, G.; Marc, I.; Doyen, A.; Flamand, N.; Dahhani, F.; Di Marzo, V.; et al. The human milk endocannabinoidome and neonatal growth in gestational diabetes. Front. Endocrinol. 2024, 15, 1415630. [Google Scholar] [CrossRef] [PubMed]
  36. Kim, J.; Carlson, M.E.; Kuchel, G.A.; Newman, J.W.; Watkins, B.A. Dietary DHA reduces downstream endocannabinoid and inflammatory gene expression and epididymal fat mass while improving aspects of glucose use in muscle in C57BL/6J mice. Int. J. Obes. 2016, 40, 129–137. [Google Scholar] [CrossRef]
  37. Fisk, H.L.; Childs, C.E.; Miles, E.A.; Ayres, R.; Noakes, P.S.; Paras-Chavez, C.; Kuda, O.; Kopecky, J.; Antoun, E.; Lillycrop, K.A.; et al. Dysregulation of endocannabinoid concentrations in human subcutaneous adipose tissue in obesity and modulation by omega-3 polyunsaturated fatty acids. Clin. Sci. 2021, 135, 185–200. [Google Scholar] [CrossRef] [PubMed]
  38. Freitas, H.R.; Isaac, A.R.; Malcher-Lopes, R.; Diaz, B.L.; Trevenzoli, I.H.; De Melo Reis, R.A. Polyunsaturated fatty acids and endocannabinoids in health and disease. Nutr. Neurosci. 2017, 21, 695–714. [Google Scholar] [CrossRef]
  39. Ferreira, A.L.; Alves, R.; Figueiredo, A.; Alves-Santos, N.; Freitas-Costa, N.; Batalha, M.; Yonemitsu, C.; Manivong, N.; Furst, A.; Bode, L.; et al. Human Milk Oligosaccharide Profile Variation Throughout Postpartum in Healthy Women in a Brazilian Cohort. Nutrients 2020, 12, 790. [Google Scholar] [CrossRef]
  40. Weight Gain During Pregnancy: Reexamining the Guidelines; Rasmussen, K.M., Yaktine, A.L., Eds.; National Academies Press: Washington, DC, USA, 2009. [Google Scholar] [CrossRef]
  41. Barbieri, P.; Crivellenti, L.C.; Nishimura, R.Y.; Sartorelli, D.S. Validation of a food frequency questionnaire to assess food group intake by pregnant women. J. Hum. Nutr. Diet. 2015, 28 (Suppl. 1), 38–44. [Google Scholar] [CrossRef]
  42. Willett, W.C.; Howe, G.R.; Kushi, L.H. Adjustment for total energy intake in epidemiologic studies. Am. J. Clin. Nutr. 1997, 65, 1220S–1228S; discussion 1229S–1231S. [Google Scholar] [CrossRef]
  43. Faul, F.; Erdfelder, E.; Lang, A.G.; Buchner, A. G*Power 3: A flexible statistical power analysis program for the social, behavioral, and biomedical sciences. Behav. Res. Methods 2007, 39, 175–191. [Google Scholar] [CrossRef] [PubMed]
  44. Zhang, Y.; Zhang, X.; Mi, L.; Li, C.; Zhang, Y.; Bi, R.; Pang, J.; Li, Y. Comparative Proteomic Analysis of Proteins in Breast Milk during Different Lactation Periods. Nutrients 2022, 14, 3648. [Google Scholar] [CrossRef]
  45. Grapov, D.; Lemay, D.G.; Weber, D.; Phinney, B.S.; Azulay Chertok, I.R.; Gho, D.S.; German, J.B.; Smilowitz, J.T. The human colostrum whey proteome is altered in gestational diabetes mellitus. J. Proteome Res. 2015, 14, 512–520. [Google Scholar] [CrossRef]
  46. Obermann-Borst, S.A.; Eilers, P.H.; Tobi, E.W.; de Jong, F.H.; Slagboom, P.E.; Heijmans, B.T.; Steegers-Theunissen, R.P. Duration of breastfeeding and gender are associated with methylation of the LEPTIN gene in very young children. Pediatr. Res. 2013, 74, 344–349. [Google Scholar] [CrossRef] [PubMed]
  47. Ellsworth, L.; Perng, W.; Harman, E.; Das, A.; Pennathur, S.; Gregg, B. Impact of maternal overweight and obesity on milk composition and infant growth. Matern. Child. Nutr. 2020, 16, e12979. [Google Scholar] [CrossRef]
  48. Bzikowska-Jura, A.; Czerwonogrodzka-Senczyna, A.; Oledzka, G.; Szostak-Wegierek, D.; Weker, H.; Wesolowska, A. Maternal Nutrition and Body Composition During Breastfeeding: Association with Human Milk Composition. Nutrients 2018, 10, 1379. [Google Scholar] [CrossRef] [PubMed]
  49. Bobinski, R.; Bobinska, J. Fatty acids of human milk—A review. Int. J. Vitam. Nutr. Res. 2022, 92, 280–291. [Google Scholar] [CrossRef]
  50. Bouret, S.G. Developmental programming of hypothalamic melanocortin circuits. Exp. Mol. Med. 2022, 54, 403–413. [Google Scholar] [CrossRef]
  51. Lemas, D.J.; Young, B.E.; Baker, P.R., II; Tomczik, A.C.; Soderborg, T.K.; Hernandez, T.L.; de la Houssaye, B.A.; Robertson, C.E.; Rudolph, M.C.; Ir, D.; et al. Alterations in human milk leptin and insulin are associated with early changes in the infant intestinal microbiome. Am. J. Clin. Nutr. 2016, 103, 1291–1300. [Google Scholar] [CrossRef]
  52. Sinkiewicz-Darol, E.; Adamczyk, I.; Lubiech, K.; Pilarska, G.; Twaruzek, M. Leptin in Human Milk-One of the Key Regulators of Nutritional Programming. Molecules 2022, 27, 3581. [Google Scholar] [CrossRef]
  53. Logan, C.A.; Koenig, W.; Rothenbacher, D.; Genuneit, J. Determinants of leptin in human breast milk: Results of the Ulm SPATZ Health Study. Int. J. Obes. 2019, 43, 1174–1180. [Google Scholar] [CrossRef] [PubMed]
  54. Logan, C.A.; Siziba, L.P.; Koenig, W.; Carr, P.; Brenner, H.; Rothenbacher, D.; Genuneit, J. Leptin in Human Milk and Child Body Mass Index: Results of the Ulm Birth Cohort Studies. Nutrients 2019, 11, 1883. [Google Scholar] [CrossRef]
  55. Andreas, N.J.; Hyde, M.J.; Herbert, B.R.; Jeffries, S.; Santhakumaran, S.; Mandalia, S.; Holmes, E.; Modi, N. Impact of maternal BMI and sampling strategy on the concentration of leptin, insulin, ghrelin and resistin in breast milk across a single feed: A longitudinal cohort study. BMJ Open 2016, 6, e010778. [Google Scholar] [CrossRef]
  56. Sims, C.R.; Lipsmeyer, M.E.; Turner, D.E.; Andres, A. Human milk composition differs by maternal BMI in the first 9 months postpartum. Am. J. Clin. Nutr. 2020, 112, 548–557. [Google Scholar] [CrossRef] [PubMed]
  57. Sadr Dadres, G.; Whitaker, K.M.; Haapala, J.L.; Foster, L.; Smith, K.D.; Teague, A.M.; Jacobs, D.R., Jr.; Kharbanda, E.O.; McGovern, P.M.; Schoenfuss, T.C.; et al. Relationship of Maternal Weight Status Before, During, and After Pregnancy with Breast Milk Hormone Concentrations. Obesity 2019, 27, 621–628. [Google Scholar] [CrossRef]
  58. Pico, C.; Palou, M.; Pomar, C.A.; Rodriguez, A.M.; Palou, A. Leptin as a key regulator of the adipose organ. Rev. Endocr. Metab. Disord. 2022, 23, 13–30. [Google Scholar] [CrossRef]
  59. Little, T.J.; Cvijanovic, N.; DiPatrizio, N.V.; Argueta, D.A.; Rayner, C.K.; Feinle-Bisset, C.; Young, R.L. Plasma endocannabinoid levels in lean, overweight, and obese humans: Relationships to intestinal permeability markers, inflammation, and incretin secretion. Am. J. Physiol. Endocrinol. Metab. 2018, 315, E489–E495. [Google Scholar] [CrossRef]
  60. Azar, S.; Sherf-Dagan, S.; Nemirovski, A.; Webb, M.; Raziel, A.; Keidar, A.; Goitein, D.; Sakran, N.; Shibolet, O.; Tam, J.; et al. Circulating Endocannabinoids Are Reduced Following Bariatric Surgery and Associated with Improved Metabolic Homeostasis in Humans. Obes. Surg. 2019, 29, 268–276. [Google Scholar] [CrossRef] [PubMed]
  61. Depommier, C.; Flamand, N.; Pelicaen, R.; Maiter, D.; Thissen, J.P.; Loumaye, A.; Hermans, M.P.; Everard, A.; Delzenne, N.M.; Di Marzo, V.; et al. Linking the Endocannabinoidome with Specific Metabolic Parameters in an Overweight and Insulin-Resistant Population: From Multivariate Exploratory Analysis to Univariate Analysis and Construction of Predictive Models. Cells 2021, 10, 71. [Google Scholar] [CrossRef]
  62. Datta, P.; Melkus, M.W.; Rewers-Felkins, K.; Patel, D.; Bateman, T.; Baker, T.; Hale, T.W. Human Milk Endocannabinoid Levels as a Function of Obesity and Diurnal Rhythm. Nutrients 2021, 13, 2297. [Google Scholar] [CrossRef]
  63. Hanlon, E.C.; Leproult, R.; Stuhr, K.L.; Doncheck, E.M.; Hillard, C.J.; Van Cauter, E. Circadian Misalignment of the 24-hour Profile of Endocannabinoid 2-Arachidonoylglycerol (2-AG) in Obese Adults. J. Clin. Endocrinol. Metab. 2020, 105, 792–802. [Google Scholar] [CrossRef] [PubMed]
  64. Muldoon, P.P.; Chen, J.; Harenza, J.L.; Abdullah, R.A.; Sim-Selley, L.J.; Cravatt, B.F.; Miles, M.F.; Chen, X.; Lichtman, A.H.; Damaj, M.I. Inhibition of monoacylglycerol lipase reduces nicotine withdrawal. Br. J. Pharmacol. 2015, 172, 869–882. [Google Scholar] [CrossRef] [PubMed]
  65. Smaga, I.; Jastrzebska, J.; Zaniewska, M.; Bystrowska, B.; Gawlinski, D.; Faron-Gorecka, A.; Broniowska, Z.; Miszkiel, J.; Filip, M. Changes in the Brain Endocannabinoid System in Rat Models of Depression. Neurotox. Res. 2017, 31, 421–435. [Google Scholar] [CrossRef]
  66. Gaitan, A.V.; Wood, J.T.; Liu, Y.; Ji, L.; Nikas, S.P.; Makriyannis, A.; Lammi-Keefe, C.J. Maternal Dietary Fatty Acids and Their Relationship to Derived Endocannabinoids in Human Milk. J. Hum. Lact. 2021, 37, 813–820. [Google Scholar] [CrossRef]
  67. Bruun, S.; Gouveia-Figueira, S.; Domellof, M.; Husby, S.; Neergaard Jacobsen, L.; Michaelsen, K.F.; Fowler, C.J.; Zachariassen, G. Satiety Factors Oleoylethanolamide, Stearoylethanolamide, and Palmitoylethanolamide in Mother’s Milk Are Strongly Associated with Infant Weight at Four Months of Age-Data from the Odense Child Cohort. Nutrients 2018, 10, 1747. [Google Scholar] [CrossRef] [PubMed]
  68. Budday, S.; Steinmann, P.; Kuhl, E. Physical biology of human brain development. Front. Cell Neurosci. 2015, 9, 257. [Google Scholar] [CrossRef]
  69. Fride, E.; Braun, H.; Matan, H.; Steinberg, S.; Reggio, P.H.; Seltzman, H.H. Inhibition of milk ingestion and growth after administration of a neutral cannabinoid CB1 receptor antagonist on the first postnatal day in the mouse. Pediatr. Res. 2007, 62, 533–536. [Google Scholar] [CrossRef]
Figure 1. Study design. Flow diagram of the participants with anthropometric and dietary records and their milk samples collected for the analysis of endocannabinoids, hormones, proteins, and triglycerides during lactation in a women cohort of Rio de Janeiro, Brazil. BMI: body mass index; GWG: gestational weight gain. Note: 1 General exclusion included gestational diabetes, preeclampsia, preterm birth, and stillbirth. 2 Women with implausible energy intake include <600 or >6000 kcal/day. 3 In the linear regression analyses, all women with milk samples at 28–50 days postpartum (T2) (n = 60), women with samples at 2–8 days (T1) (n = 15, including those with samples also at the last visit), and those with samples exclusively at 88–119 days (T3) (n = 9) were included.
Nutrients 17 01344 g001
Figure 2. Endocannabinoid concentration in the human milk between 2 and 119 days postpartum. Milk concentration of the endocannabinoids (A) anandamide (AEA) and (B) 2-arachidonoylglycerol (2-AG) at 2–8 (T1, n = 41), 28–47 (T2, n = 67) and 88–119 (T3, n = 41) days postpartum. Data are expressed as median and interquartile intervals and were analyzed using Kruskal–Wallis test, followed by Dunn’s post-hoc test. * p < 0.05.
Nutrients 17 01344 g002
Figure 3. Milk concentration of the endocannabinoid anandamide (AEA) and maternal anthropometry. (AC) AEA milk concentration at 2–8 (T1, n = 41), 28–47 (T2, n = 67), and 88–119 (T3, n = 41) days postpartum stratified by maternal pre-pregnancy body mass index (BMI; <25 or >25) or (DF) gestational weight gain (GWG; normal (n GWG) or excessive (e GWG)). Data are expressed as median and interquartile intervals and were analyzed using Mann–Whitney test. * p < 0.05.
Nutrients 17 01344 g003
Figure 4. Milk concentration of the endocannabinoid 2-arachidonoylglycerol (2-AG) and maternal anthropometry. (AC) 2-AG milk concentration at 2–8 (T1, n = 41), 28–47 (T2, n = 67), and 88–119 (T3, n = 41) days postpartum stratified by maternal pre-pregnancy body mass index (BMI; <25 or >25) or (DF) gestational weight gain (GWG; normal (n GWG) or excessive (e GWG)). Data are expressed as median and interquartile intervals and were analyzed using Mann–Whitney test.
Nutrients 17 01344 g004
Figure 5. Spearman rank correlations between milk components and maternal anthropometry. Spearman correlations between milk concentration of insulin, leptin, proteins, triglycerides, and endocannabinoids (AEA and 2-AG) at postpartum days 2–8 (T1), 28–47 (T2), and 88–119 (T3) and maternal pre-pregnancy BMI (PP_BMI) and gestational weight gain (GWG). The circle only becomes visible for the correlations with a significance level of p < 0.05. The circles indicate statistical significance (p < 0.05), and their size is directly proportional to the effect size. The blue color indicates a positive correlation, and the red color indicates a negative correlation, according to the scale bar.
Nutrients 17 01344 g005
Figure 6. Spearman rank correlations between milk components and maternal diet. Spearman correlations between milk concentration of insulin, leptin, proteins, triglycerides, and endocannabinoids (AEA and 2-AG) at postpartum days 2–8 (T1), 28–47 (T2), and 88–119 (T3) and maternal total energy intake and the consumption of dietary lipids, proteins, cholesterol, saturated, monounsaturated, and polyunsaturated fat, n-3 PUFA, n-6 PUFA, arachidonic acid, and n-6/n-3 ratio. The circles indicate statistical significance (p < 0.05), and their size is directly proportional to the effect size. The blue color indicates a positive correlation, and the red color indicates a negative correlation, according to the scale bar.
Nutrients 17 01344 g006
Table 1. Demographic, reproductive, anthropometric, and dietetic profile of women from the Brazilian cohort, Rio de Janeiro.
Variablesn = 92
Median [IQR]
Maternal age (years)26.0 [22.2–31.4]
Education (schooling years)12.0 [9.00–12.0]
Pre-pregnancy BMI (kg/m2)24.4 [21.1–28.8]
Total GWG (kg)11.8 [9.00–14.3]
Dietary intake
  Total energy intake (kcal)2740 [1950–3800]
  Proteins (g) 1113 [100–128]
  Carbohydrates (g) 1432 [389–461]
  Lipids (g) 184.6 [75.1–93.3]
  Saturated fatty acid (g) 134.1 [29.6–39.0]
  Monounsaturated fatty acid (g) 128.5 [24.9–31.1]
  Polyunsaturated fatty acid (g) 118.2 [15.6–22.0]
  Omega-6 polyunsaturated fatty acid (g) 1 16.2 [14.1–19.7]
  Omega-3 polyunsaturated fatty acid (g) 11.49 [1.28–1.72]
  Arachidonic acid (g) 10.0936 [0.0702–0.134]
  n-6/n-3 ratio10.6 [9.60–13.0]
Gestational age at delivery39.4 [38.9–40.9]
Delivery mode 2n (%)
  Vaginal50 (58.8)
  Caesarean35 (41.2)
Parity 3
  Multiparous42 (46.2)
  Primiparous49 (53.8)
Skin color 4
  White11 (12.2)
  Brown/Mixed color56 (62.2)
  Black21 (23.3)
  Yellow/Asian2 (2.2)
Pregestational BMI (kg/m2) 5
  Underweight (<18.5)2 (2.3)
  Normal weight (≥18.5 and <25.0)44 (50.6)
  Overweight (≥25.0 and <30.0) 26 (29.9)
  Obese (≥30.0)14 (16.1)
Note: 1 Data corrected by total kcal of maternal intake. IQR: interquartile range; BMI: body mass index; GWG: gestational weight gain. 2 Because of missing data n = 85. 3 Because of missing data n = 91. 4 Because of missing data n = 90. 5 Because of missing data n = 86.
Table 2. Milk concentration of total proteins, triglycerides, insulin, and leptin across lactation of women from the Brazilian cohort, Rio de Janeiro.
Variables Median [IQR] (n)
T1T2T3
Total protein (mg/mL)16.3 [15.0–18.1] * (40)13.5 [12.5–15.5] (65)15.4 [14.6–17.5] (39)
Total triglycerides (mg/mL)842.4 [773–966] (41)964.3 [848–1074] # (64)779.4 [674–903] (41)
Insulin (ng/mL)0.90 [0.55–1.21] (41)0.84 [0.70–1.21] (67)1.04 [0.87–1.70] (37)
Leptin (ng/mL)0.45 [0.34–0.72] (31)0.65 [0.45–0.75] (67)0.62 [0.44–0.81] (41)
Data were analyzed using Kruskal–Wallis test, followed by Dunn’s multiple comparison test. * p < 0.05 compared with T2; # p < 0.05 compared with T3.
Table 3. Milk concentration of total proteins, triglycerides, insulin, and leptin across lactation of Brazilian women according to pregestational BMI or gestational weight gain (GWG).
Variables Median [IQR] (n)
BMI < 25BMI ≥ 25
Total protein (mg/mL) T116.0 [14.3–18.1] (24)17.3 [14.5–19.8] (16)
Total protein (mg/mL) T212.6 [11.7–15.3] (35)15.2 [13.0–17.1] (30)
Total protein (mg/mL) T315.1 [13.8–19.1] (20)15.5 [13.6–17.3] (19)
Total triglycerides (mg/mL) T1912 [786–1113] (25)823 [704–1036] (16)
Total triglycerides (mg/mL) T21036 [803–1126] (35)855 [788–1071] (29)
Total triglycerides (mg/mL) T3693 [605–851] (21)830 [767–1008] * (20)
Insulin (ng/mL) T10.58 [0.44–1.17] (25)1.14 [0.85–1.49] (16)
Insulin (ng/mL) T20.75 [0.61–1.21] (35)1.08 [0.71–1.56] (32)
Insulin (ng/mL) T31.04 [0.79–2.02] (21)1.23 [0.88–1.75] (20)
Leptin (ng/mL) T10.45 [0.16–0.77] (22)0.46 [0.35–0.89] (16)
Leptin (ng/mL) T20.45 [0.32–0.65] (35)0.85 [0.63–1.15] * (32)
Leptin (ng/mL) T30.44 [0.25–0.63] (21)0.95 [0.62–1.27] * (20)
n GWGe GWG
Total protein (mg/mL) T116.4 [14.8–18.4] (28)15.6 [14.5–19.8] (12)
Total protein (mg/mL) T212.6 [11.6–15.0] (36)15.9 [13.3–18.1] (28)
Total protein (ng/mL) T315.9 [13.7–19.3] (21)15.1 [14.4–17.3] (20)
Total triglycerides (ng/mL) T1832 [742–1036] (29)844 [704–1139] (12)
Total triglycerides (mg/mL) T21014 [803–1084] (36)951 [796–1084] (28)
Total triglycerides (mg/mL) T3779 [605–1008] (21)798 [666–967] (19)
Insulin (ng/mL) T10.73 [0.44–1.49] (21)1.01 [0.58–1.22] (20)
Insulin (ng/mL) T20.96 [0.61–1.51] (31)0.78 [0.68–1.29] (36)
Insulin (ng/mL) T31.44 [0.81–3.12] (15)1.02 [0.87–1.70] (26)
Leptin (ng/mL) T10.50 [0.24–0.67] (18)0.40 [0.34–0.93] (20)
Leptin (ng/mL) T20.44 [0.32–0.75] (31)0.72 [0.59–1.03] * (36)
Leptin (ng/mL) T30.62 [0.24–1.16] (15)0.62 [0.38–0.97] (26)
Data were analyzed using Mann–Whitney test. * p < 0.05 compared with BMI < 25 or non-excessive gestational weight gain (n GWG).
Table 4. Linear regression models of associations between pre-gestational BMI and gestational weight gain and AEA and 2-AG concentrations in breast milk at 2–119 days postpartum (n = 84).
Independent Variables Unadjusted models
AEA
Categorical Variable (yes/no)βCI (95%)p
  BMI ≥ 25 kg/m2 0.64–0.97; 2.260.432
  Gestational Weight Gain 12.37–1.65; 6.380.239
2-AG
Categorical Variable (yes/no)βCI (95%)p
  BMI ≥ 25 kg/m2174.60–398.5; 747.60.546
  Gestational Weight Gain11366.6362.4; 2370.70.009
Independent Variables Adjusted models
AEA
Categorical Variable (yes/no)βCI (95%)p
  BMI ≥ 25 kg/m21.81–0.18; 3.800.073
  Gestational Weight Gain 13.51–1.22; 8.230.140
2-AG
Categorical Variable (yes/no)βCI (95%)p
  BMI ≥ 25 kg/m2413.93–251.9; 1079.80.219
  Gestational Weight Gain 11629.51466.7; 2792.30.008
Note: 1 Classification of gestational weight gain according to the Institute of Medicine (IOM, 2009). Adjustments for maternal age, parity, postpartum time of the sample, milk triglycerides, and leptin. Bold p-values indicate a statistical significance. CI: confidence interval; AEA: anandamide; 2-AG: 2-arachidonoylglycerol.
Table 5. Linear regression models of associations between dietary lipid intake during pregnancy and AEA and 2-AG concentration in breast milk from 2–119 days postpartum (n = 84).
Independent VariablesUnadjusted Models
AEA
Dietary intakeβCI (95%)p
  Total lipids (g)−0.01−0.05; 0.040.807
  Cholesterol (mg)−0.00−0.00; 0.000.608
  Saturated fatty acid (g)−0.03−0.11; 0.050.429
  Monounsaturated fatty acid (g)−0.01−0.15; 0.140.909
  Polyunsaturated fatty acid (g)−0.02−0.14; 0.100.756
  Fatty acid n-6 (g)−0.02−0.15; 0.110.785
  Fatty acid n-3 (g)−0.33−2.31; 1.660.745
  Arachidonic acid (g)5.24−5.54; 16.030.336
  Ratio n-6/n-3−0.01−0.25; 0.240.952
2-AG
Dietary intake βCI (95%)p
  Total lipids (g) −5.33−21.09; 10.430.503
  Cholesterol (mg)−0.19−1.50; 1.110.770
  Saturated fatty acid (g)−14.81−42.38; 12.770.382
  Monounsaturated fatty acid (g)−22.68−74.03; 28.660.378
  Polyunsaturated fatty acid (g)8.00−35.59; 51.610.716
  Fatty acid n-6 (g)13.52−32.12; 59.170.557
  Fatty acid n-3 (g)114.6−598.50; 827.770.745
  Arachidonic acid (g)1492.3−2393.96; 5378.560.447
  Ratio n-6/n-3 60.38−26.32–147.080.170
AEA
Dietary intake βCI (95%)p
  Total lipids (g)0.01−0.05; 7.410.815
  Cholesterol (mg)0.00−0.00; 0.000.716
  Saturated fatty acid (g)−0.03−0.11; 0.050.416
  Monounsaturated fatty acid (g)−0.01−0.16; 0.130.850
  Polyunsaturated fatty acid (g)−0.01−0.14; 0.120.886
  Fatty acid n-6 (g)−0.01−0.15; 0.130.861
  Fatty acid n-3 (g)0.01−2.02; 2.180.944
  Arachidonic acid (g)4.37−7.00; 15.750.446
  Ratio n-6/n-3 −0.01−0.29; 0.240.847
2-AG
Dietary intake βCI (95%)p
  Total lipids (g) −2.98−18.13; 12.170.696
  Cholesterol (mg)−0.38−1.65; 0.890.557
  Saturated fatty acid (g)−8.73−36.13; 18.670.528
  Monounsaturated fatty acid (g)−22.63−71.68; 26.410.361
  Polyunsaturated fatty acid (g)−12.63−56.26; 30.980.566
  Fatty acid n-6 (g)−10.59−56.76; 35.576.649
  Fatty acid n-3 (g)−50.32−756.26; 655.630.887
  Arachidonic acid (g)2039.36−1766.42; 5845.140.290
  Ratio n-6/n-3 22.26−66.14; 110.660.617
Note: Adjustments for maternal age, parity, postpartum time of the sample, triglycerides, and leptin. CI: confidence interval; AEA: anandamide; 2-AG: 2-arachidonoylglycerol.
Disclaimer/Publisher’s Note: The statements, opinions and data contained in all publications are solely those of the individual author(s) and contributor(s) and not of MDPI and/or the editor(s). MDPI and/or the editor(s) disclaim responsibility for any injury to people or property resulting from any ideas, methods, instructions or products referred to in the content.

