
The Association Between the Triglyceride Glucose Index and Hyperuricemia: A Dose–Response Meta-Analysis

 and
and
Abstract
:1. Introduction
2. Methods
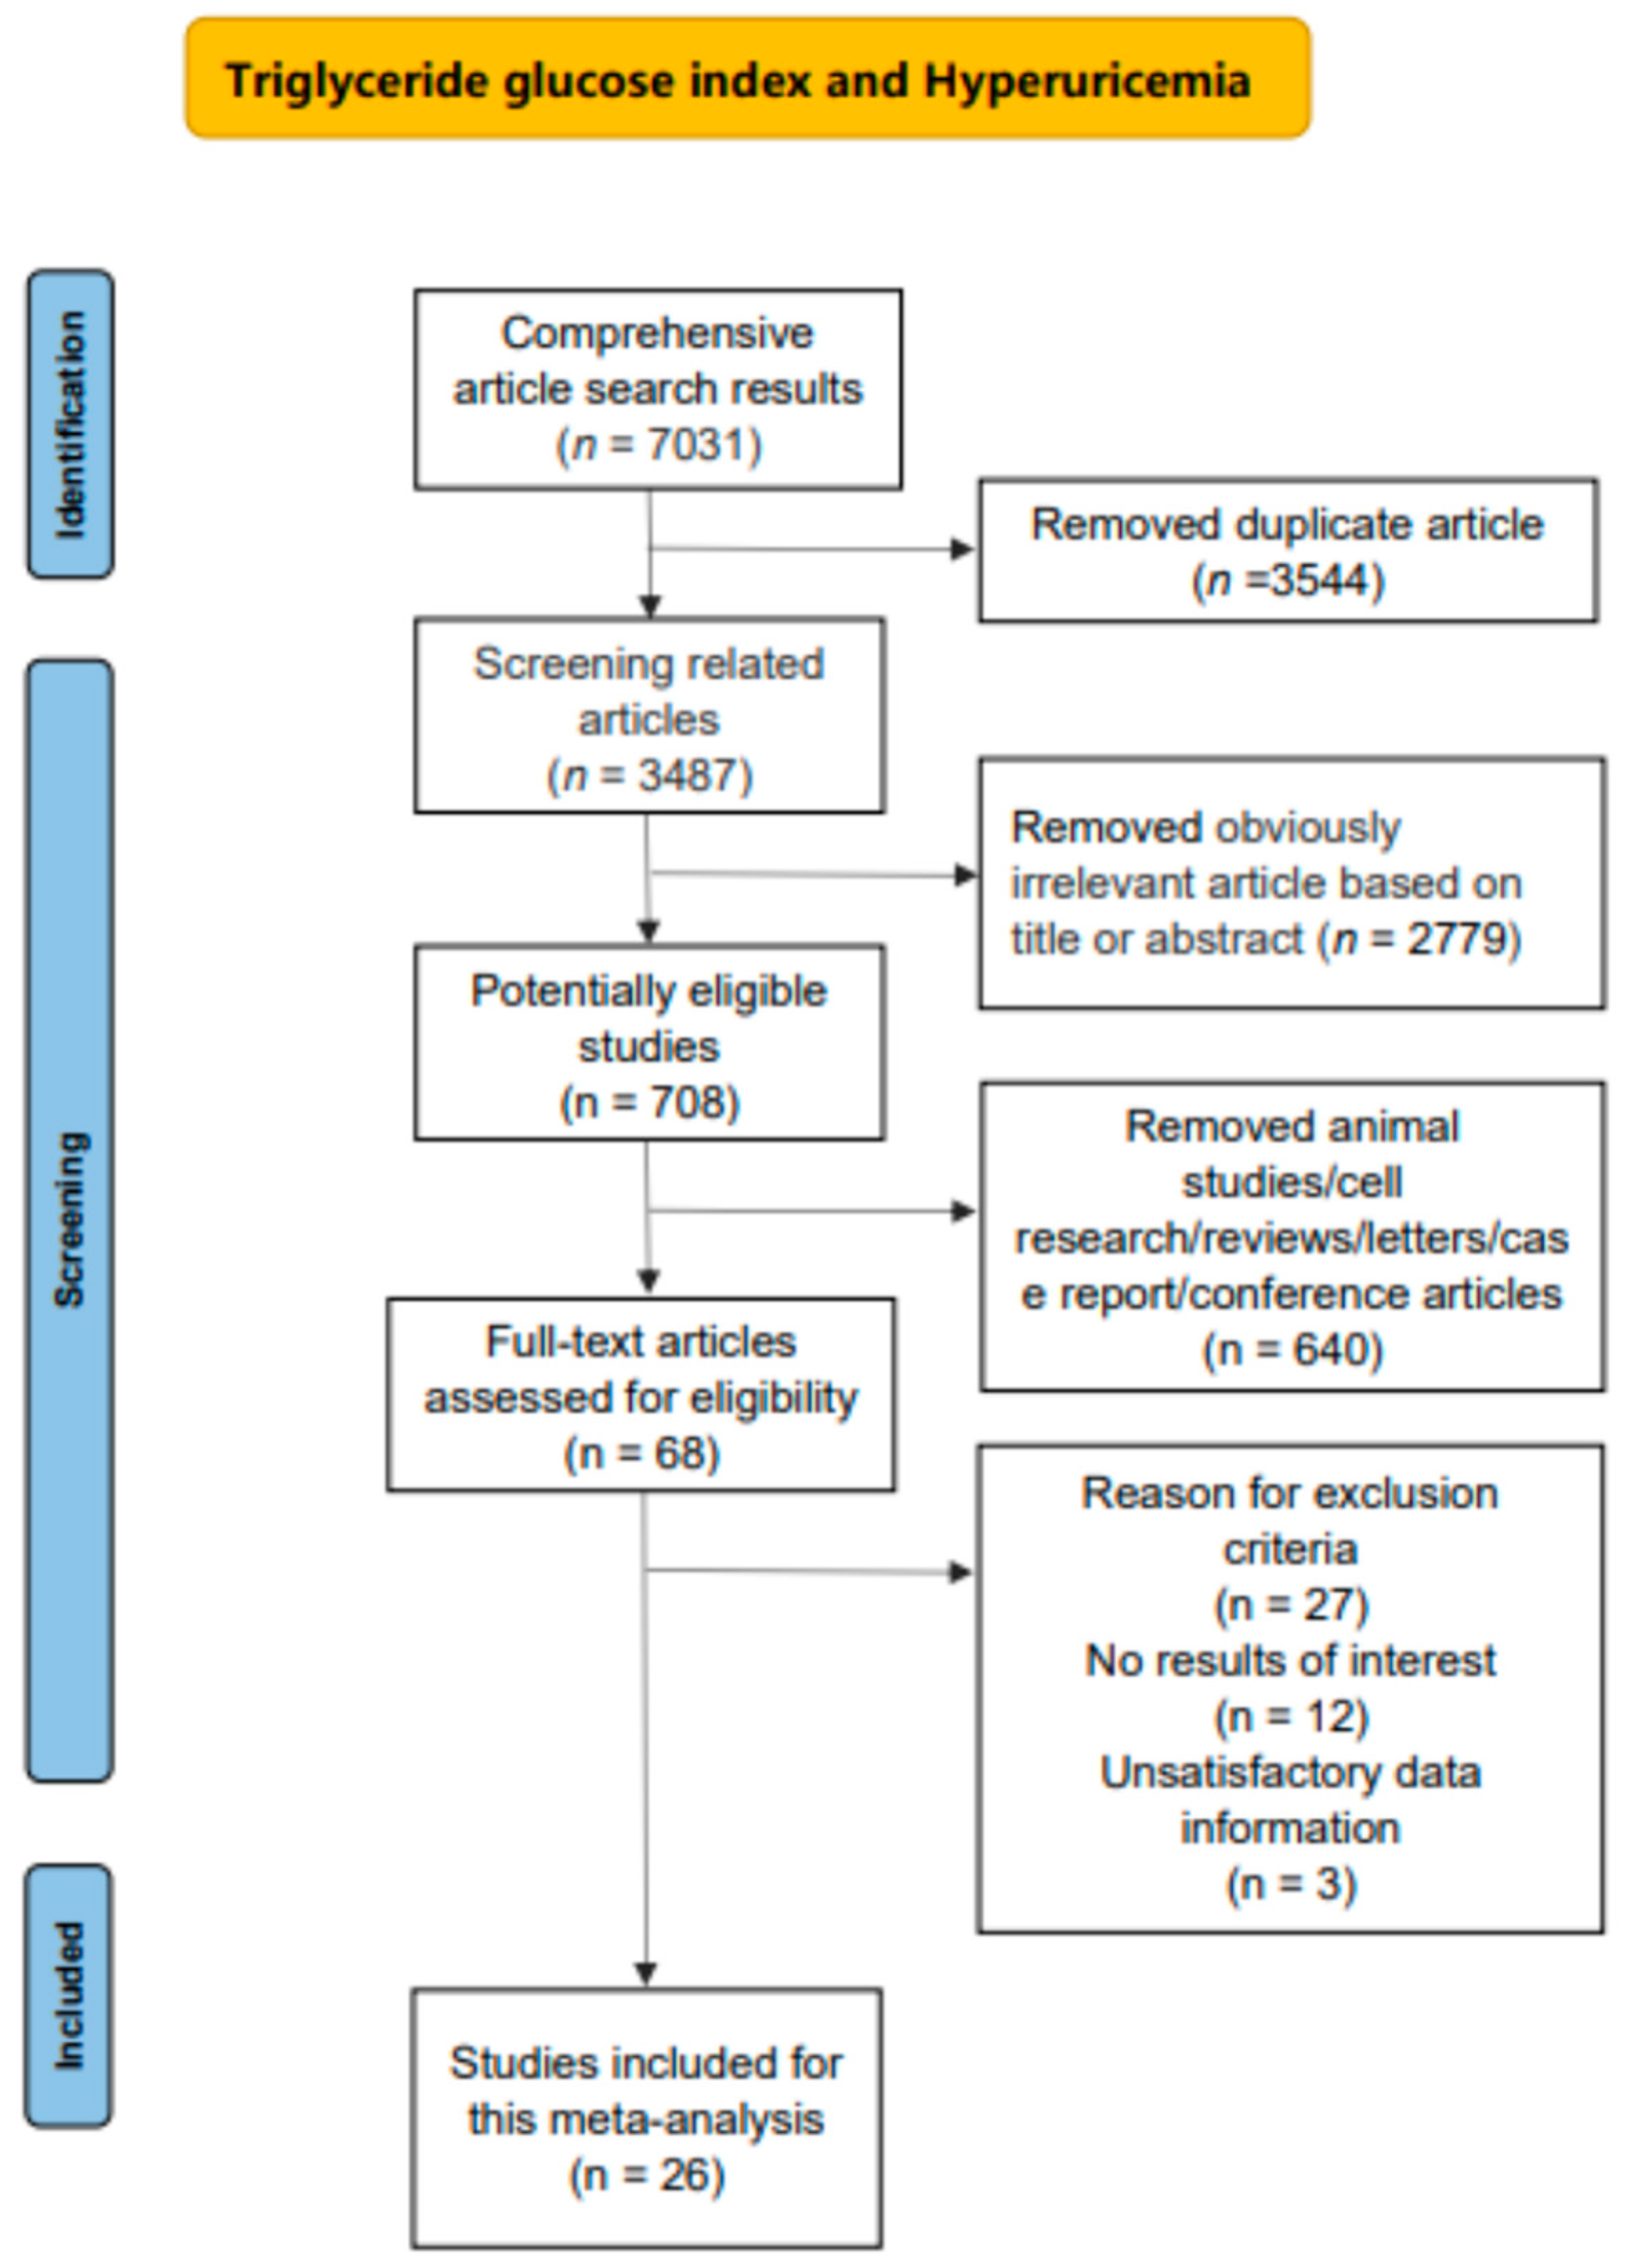
2.1. Data Sources and Retrieval Methods
2.2. Criteria for Inclusion and Exclusion
2.3. Data Extraction
2.4. Quality Assessment
2.5. Statistical Analysis
3. Results
4. Discussion
5. Conclusions
Supplementary Materials
Author Contributions
Funding
Institutional Review Board Statement
Informed Consent Statement
Data Availability Statement
Conflicts of Interest
References
- Maiuolo, J.; Oppedisano, F.; Gratteri, S.; Muscoli, C.; Mollace, V. Regulation of uric acid metabolism and excretion. Int. J. Cardiol. 2016, 213, 8–14. [Google Scholar] [CrossRef] [PubMed]
- Gou, R.; Dou, D.; Tian, M.; Chang, X.; Zhao, Y.; Meng, X.; Li, G. Association between triglyceride glucose index and hyperuricemia: A new evidence from China and the United States. Front. Endocrinol. 2024, 15, 1403858. [Google Scholar] [CrossRef] [PubMed]
- Srivastava, A.; Kaze, A.D.; McMullan, C.J.; Isakova, T.; Waikar, S.S. Uric Acid and the Risks of Kidney Failure and Death in Individuals with CKD. Am. J. Kidney Dis. 2018, 71, 362–370. [Google Scholar] [CrossRef]
- Wang, H.; Zhang, H.; Sun, L.; Guo, W. Roles of hyperuricemia in metabolic syndrome and cardiac-kidney-vascular system diseases. Am. J. Transl. Res. 2018, 10, 2749–2763. [Google Scholar] [PubMed]
- Katsiki, N.; Dimitriadis, G.D.; Mikhailidis, D.P. Serum Uric Acid and Diabetes: From Pathophysiology to Cardiovascular Disease. Curr. Pharm. Des. 2021, 27, 1941–1951. [Google Scholar] [CrossRef]
- Butler, F.; Alghubayshi, A.; Roman, Y. The Epidemiology and Genetics of Hyperuricemia and Gout across Major Racial Groups: A Literature Review and Population Genetics Secondary Database Analysis. J. Pers. Med. 2021, 11, 231. [Google Scholar] [CrossRef]
- Zhang, M.; Zhu, X.; Wu, J.; Huang, Z.; Zhao, Z.; Zhang, X.; Xue, Y.; Wan, W.; Li, C.; Zhang, W.; et al. Prevalence of Hyperuricemia Among Chinese Adults: Findings from Two Nationally Representative Cross-Sectional Surveys in 2015–16 and 2018–19. Front. Immunol. 2022, 12, 791983. [Google Scholar] [CrossRef]
- Chen-Xu, M.; Yokose, C.; Rai, S.K.; Pillinger, M.H.; Choi, H.K. Contemporary Prevalence of Gout and Hyperuricemia in the United States and Decadal Trends: The National Health and Nutrition Examination Survey, 2007–2016. Arthritis Rheumatol. 2019, 71, 991–999. [Google Scholar] [CrossRef]
- Alizargar, J.; Bai, C.H.; Hsieh, N.C.; Wu, S.V. Use of the triglyceride-glucose index (TyG) in cardiovascular disease patients. Cardiovasc. Diabetol. 2020, 19, 8. [Google Scholar] [CrossRef]
- Abreu, E.; Fonseca, M.J.; Santos, A.C. [Association between hyperuricemia and insulin resistance]. Acta Medica Port. 2011, 24 (Suppl. 2), 565–574. [Google Scholar]
- Jiao, Z.; Gao, H.L.; Li, H.; Jia, Z.P.; Li, D.P.; Sun, D.Y.; Wang, B.Y. [Pre-diabetes mellitus influenced by hyperuricemia]. Zhonghua Liu Xing Bing Xue Za Zhi 2013, 34, 725–727. [Google Scholar] [PubMed]
- Galindo-Yllu, B.M.; Rojas-Humpire, R.; Toro-Huamanchumo, C.J.; Gutierrez-Ajalcriña, R.; Soriano, A.N. Serum Uric Acid Is Associated with Metabolic Syndrome and Insulin Resistance among Health Personnel from Peru. J. Nutr. Metab. 2021, 2021, 9933319. [Google Scholar] [CrossRef] [PubMed]
- Ormazabal, V.; Nair, S.; Elfeky, O.; Aguayo, C.; Salomon, C.; Zuñiga, F.A. Association between insulin resistance and the development of cardiovascular disease. Cardiovasc. Diabetol. 2018, 17, 122. [Google Scholar] [CrossRef] [PubMed]
- Di Pino, A.; DeFronzo, R.A. Insulin Resistance and Atherosclerosis: Implications for Insulin-Sensitizing Agents. Endocr. Rev. 2019, 40, 1447–1467. [Google Scholar] [CrossRef]
- Kraemer, F.B.; Ginsberg, H.N. Gerald, M. Reaven, MD: Demonstration of the central role of insulin resistance in type 2 diabetes and cardiovascular disease. Diabetes Care 2014, 37, 1178–1181. [Google Scholar] [CrossRef]
- Wang, A.; Wang, G.; Liu, Q.; Zuo, Y.; Chen, S.; Tao, B.; Tian, X.; Wang, P.; Meng, X.; Wu, S.; et al. Triglyceride-glucose index and the risk of stroke and its subtypes in the general population: An 11-year follow-up. Cardiovasc. Diabetol. 2021, 20, 46. [Google Scholar] [CrossRef]
- Muniyappa, R.; Lee, S.; Chen, H.; Quon, M.J. Current approaches for assessing insulin sensitivity and resistance in vivo: Advantages, limitations, and appropriate usage. Am. J. Physiol. Endocrinol. Metab. 2008, 294, E15–E26. [Google Scholar] [CrossRef]
- Wallace, T.M.; Levy, J.C.; Matthews, D.R. Use and abuse of HOMA modeling. Diabetes Care 2004, 27, 1487–1495. [Google Scholar] [CrossRef]
- Ranganath; Madan, R.; Varghese, R.T. Assessing Insulin Sensitivity and Resistance in Humans. In Endotext; Feingold, K.R., Ahmed, S.F., Anawalt, B., Blackman, M.R., Boyce, A., Chrousos, G., Corpas, E., de Herder, W.W., Dhatariya, K., Dungan, K., et al., Eds.; MDText.com, Inc.: South Dartmouth, MA, USA, 2000. [Google Scholar]
- Matthews, D.R.; Hosker, J.P.; Rudenski, A.S.; Naylor, B.A.; Treacher, D.F.; Turner, R.C. Homeostasis model assessment: Insulin resistance and beta-cell function from fasting plasma glucose and insulin concentrations in man. Diabetologia 1985, 28, 412–419. [Google Scholar] [CrossRef]
- Khamseh, M.E.; Malek, M.; Abbasi, R.; Taheri, H.; Lahouti, M.; Alaei-Shahmiri, F. Triglyceride Glucose Index and Related Parameters (Triglyceride Glucose-Body Mass Index and Triglyceride Glucose-Waist Circumference) Identify Nonalcoholic Fatty Liver and Liver Fibrosis in Individuals with Overweight/Obesity. Metab. Syndr. Relat. Disord. 2021, 19, 167–173. [Google Scholar] [CrossRef]
- Sánchez-García, A.; Rodríguez-Gutiérrez, R.; Mancillas-Adame, L.; González-Nava, V.; Díaz González-Colmenero, A.; Solis, R.C.; Álvarez-Villalobos, N.A.; González-González, J.G. Diagnostic Accuracy of the Triglyceride and Glucose Index for Insulin Resistance: A Systematic Review. Int. J. Endocrinol. 2020, 2020, 4678526. [Google Scholar] [CrossRef] [PubMed]
- Irace, C.; Carallo, C.; Scavelli, F.B.; De Franceschi, M.S.; Esposito, T.; Tripolino, C.; Gnasso, A. Markers of insulin resistance and carotid atherosclerosis. A comparison of the homeostasis model assessment and triglyceride glucose index. Int. J. Clin. Pract. 2013, 67, 665–672. [Google Scholar] [CrossRef] [PubMed]
- Ding, X.; Wang, X.; Wu, J.; Zhang, M.; Cui, M. Triglyceride-glucose index and the incidence of atherosclerotic cardiovascular diseases: A meta-analysis of cohort studies. Cardiovasc. Diabetol. 2021, 20, 76. [Google Scholar] [CrossRef]
- Khalaji, A.; Behnoush, A.H.; Khanmohammadi, S.; Ghanbari Mardasi, K.; Sharifkashani, S.; Sahebkar, A.; Vinciguerra, C.; Cannavo, A. Triglyceride-glucose index and heart failure: A systematic review and meta-analysis. Cardiovasc. Diabetol. 2023, 22, 244. [Google Scholar] [CrossRef] [PubMed]
- Liu, X.; Tan, Z.; Huang, Y.; Zhao, H.; Liu, M.; Yu, P.; Ma, J.; Zhao, Y.; Zhu, W.; Wang, J. Relationship between the triglyceride-glucose index and risk of cardiovascular diseases and mortality in the general population: A systematic review and meta-analysis. Cardiovasc. Diabetol. 2022, 21, 124. [Google Scholar] [CrossRef]
- Tao, L.C.; Xu, J.N.; Wang, T.T.; Hua, F.; Li, J.J. Triglyceride-glucose index as a marker in cardiovascular diseases: Landscape and limitations. Cardiovasc. Diabetol. 2022, 21, 68. [Google Scholar] [CrossRef]
- Zeng, Y.; Yin, L.; Yin, X.; Zhao, D. Association of triglyceride-glucose index levels with gestational diabetes mellitus in the US pregnant women: A cross-sectional study. Front. Endocrinol. 2023, 14, 1241372. [Google Scholar] [CrossRef]
- Nabipoorashrafi, S.A.; Seyedi, S.A.; Rabizadeh, S.; Ebrahimi, M.; Ranjbar, S.A.; Reyhan, S.K.; Meysamie, A.; Nakhjavani, M.; Esteghamati, A. The accuracy of triglyceride-glucose (TyG) index for the screening of metabolic syndrome in adults: A systematic review and meta-analysis. Nutr. Metab. Cardiovasc. Dis. NMCD 2022, 32, 2677–2688. [Google Scholar] [CrossRef]
- Li, Y.; You, A.; Tomlinson, B.; Yue, L.; Zhao, K.; Fan, H.; Zheng, L. Insulin resistance surrogates predict hypertension plus hyperuricemia. J. Diabetes Investig. 2021, 12, 2046–2053. [Google Scholar] [CrossRef]
- Zuo, Y.Q.; Gao, Z.H.; Yin, Y.L.; Yang, X.; Guan, X.; Feng, P.Y. Insulin Resistance Surrogates May Predict HTN-HUA in Young, Non-Obese Individuals. Diabetes Metab. Syndr. Obes. Targets Ther. 2024, 17, 3593–3601. [Google Scholar] [CrossRef]
- Ghorbani, Z.; Mirmohammadali, S.N.; Shoaibinobarian, N.; Rosenkranz, S.K.; Arami, S.; Hekmatdoost, A.; Mahdavi-Roshan, M. Insulin resistance surrogate markers and risk of hyperuricemia among patients with and without coronary artery disease: A cross-sectional study. Front. Nutr. 2023, 10, 1048675. [Google Scholar] [CrossRef]
- Page, M.J.; McKenzie, J.E.; Bossuyt, P.M.; Boutron, I.; Hoffmann, T.C.; Mulrow, C.D.; Shamseer, L.; Tetzlaff, J.M.; Akl, E.A.; Brennan, S.E.; et al. The PRISMA 2020 statement: An updated guideline for reporting systematic reviews. BMJ 2021, 372, n71. [Google Scholar] [CrossRef]
- Stang, A. Critical evaluation of the Newcastle-Ottawa scale for the assessment of the quality of nonrandomized studies in meta-analyses. Eur. J. Epidemiol. 2010, 25, 603–605. [Google Scholar] [CrossRef] [PubMed]
- Lo, C.K.; Mertz, D.; Loeb, M. Newcastle-Ottawa Scale: Comparing reviewers’ to authors’ assessments. BMC Med. Res. Methodol. 2014, 14, 45. [Google Scholar] [CrossRef] [PubMed]
- Guyatt, G.H.; Oxman, A.D.; Vist, G.E.; Kunz, R.; Falck-Ytter, Y.; Alonso-Coello, P.; Schünemann, H.J. GRADE: An emerging consensus on rating quality of evidence and strength of recommendations. BMJ 2008, 336, 924–926. [Google Scholar] [CrossRef]
- Higgins, J.P.; Thompson, S.G.; Deeks, J.J.; Altman, D.G. Measuring inconsistency in meta-analyses. BMJ 2003, 327, 557–560. [Google Scholar] [CrossRef] [PubMed]
- Egger, M.; Davey Smith, G.; Schneider, M.; Minder, C. Bias in meta-analysis detected by a simple, graphical test. BMJ 1997, 315, 629–634. [Google Scholar] [CrossRef] [PubMed]
- Greenland, S.; Longnecker, M.P. Methods for trend estimation from summarized dose-response data, with applications to meta-analysis. Am. J. Epidemiol. 1992, 135, 1301–1309. [Google Scholar] [CrossRef]
- Han, Y.; Zhou, Z.; Zhang, Y.; Zhao, G.; Xu, B. The Association of Surrogates of Insulin Resistance with Hyperuricemia among Middle-Aged and Older Individuals: A Population-Based Nationwide Cohort Study. Nutrients 2023, 15, 3139. [Google Scholar] [CrossRef]
- Yu, C.; Wang, T.; Zhou, W.; Zhu, L.; Huang, X.; Bao, H.; Cheng, X.; Prodam, F. Positive Association between the Triglyceride-Glucose Index and Hyperuricemia in Chinese Adults with Hypertension: An Insight from the China H-Type Hypertension Registry Study. Int. J. Endocrinol. 2022, 2022, 4272715. [Google Scholar] [CrossRef]
- Dong, J.; Yang, H.; Zhang, Y.; Hu, Q. Triglyceride-glucose index is a predictive index of hyperuricemia events in elderly patients with hypertension: A cross-sectional study. Clin. Exp. Hypertens. 2021, 44, 34–39. [Google Scholar] [CrossRef] [PubMed]
- Kahaer, M.; Zhang, B.; Chen, W.; Liang, M.; He, Y.; Chen, M.; Li, R.; Tian, T.; Hu, C.; Sun, Y. Triglyceride Glucose Index Is More Closely Related to Hyperuricemia Than Obesity Indices in the Medical Checkup Population in Xinjiang, China. Front. Endocrinol. 2022, 13, 861760. [Google Scholar] [CrossRef] [PubMed]
- Liu, S.; Zhou, Z.; Wu, M.; Zhang, H.; Xiao, Y.; Prodam, F. Association between the Triglyceride Glucose Index and Hyperuricemia in Patients with Primary Hypertension: A Cross-Sectional Study. Int. J. Endocrinol. 2023, 2023, 5582306. [Google Scholar] [CrossRef]
- Shi, W.; Xing, L.; Jing, L.; Tian, Y.; Liu, S. Usefulness of Triglyceride-glucose Index for estimating Hyperuricemia risk: Insights from a general Population. Postgrad. Med. 2019, 131, 348–356. [Google Scholar] [CrossRef] [PubMed]
- Sun, J.; Sun, M.; Su, Y.; Li, M.; Ma, S.; Zhang, Y.; Zhang, A.; Cai, S.; Cheng, B.; Bao, Q.; et al. Mediation effect of obesity on the association between triglyceride-glucose index and hyperuricemia in Chinese hypertension adults. J. Clin. Hypertens. 2022, 24, 47–57. [Google Scholar] [CrossRef]
- Zhou, S.; Yu, Y.; Zhang, Z.; Ma, L.; Wang, C.; Yang, M.; Cheng, X.; Liu, T.; Sun, R.; Chen, Y. Association of obesity, triglyceride-glucose and its derivatives index with risk of hyperuricemia among college students in Qingdao, China. Front. Endocrinol. 2022, 13, 1001844. [Google Scholar] [CrossRef]
- Luo, Y.; Hao, J.; He, X.; Wang, C.; Zhao, H.; Zhang, Z.; Yang, L.; Ren, L. Association Between Triglyceride-Glucose Index and Serum Uric Acid Levels: A Biochemical Study on Anthropometry in Non-Obese Type 2 Diabetes Mellitus Patients. Diabetes Metab. Syndr. Obes. Targets Ther. 2022, 15, 3447–3458. [Google Scholar] [CrossRef]
- Wang, H.; Zhang, J.; Pu, Y.; Qin, S.; Liu, H.; Tian, Y.; Tang, Z. Comparison of different insulin resistance surrogates to predict hyperuricemia among U.S. non-diabetic adults. Front. Endocrinol. 2022, 13, 1028167. [Google Scholar] [CrossRef]
- Qi, J.; Ren, X.; Hou, Y.; Zhang, Y.; Zhang, Y.; Tan, E.; Wang, L. Triglyceride-Glucose Index is Significantly Associated with the Risk of Hyperuricemia in Patients with Nonalcoholic Fatty Liver Disease. Diabetes Metab. Syndr. Obes. 2023, 16, 1323–1334. [Google Scholar] [CrossRef]
- Li, Q.; Shao, X.; Zhou, S.; Cui, Z.; Liu, H.; Wang, T.; Fan, X.; Yu, P. Triglyceride-glucose index is significantly associated with the risk of hyperuricemia in patients with diabetic kidney disease. Sci. Rep. 2022, 12, 19988. [Google Scholar] [CrossRef]
- Liu, X.Z.; Xu, X.; Zhu, J.Q.; Zhao, D.B. Association between three non-insulin-based indexes of insulin resistance and hyperuricemia. Clin. Rheumatol. 2019, 38, 3227–3233. [Google Scholar] [CrossRef]
- Wu, X.; Zhou, M.; Bu, J.; Chang, Y.; Mahan, Y.; Lu, H.; Zhang, Y.; Zhang, X.; Wang, Z.; Zhou, L. Prevalence and Risk Factors of Hyperuricemia in the Urban Health Checkup Population in Xinjiang, China: A Cross-Sectional Study. Risk Manag. Healthc. Policy 2023, 16, 1531–1544. [Google Scholar] [CrossRef] [PubMed]
- Gu, Q.; Hu, X.; Meng, J.; Ge, J.; Wang, S.J.; Liu, X.Z. Associations of Triglyceride-Glucose Index and Its Derivatives with Hyperuricemia Risk: A Cohort Study in Chinese General Population. Int. J. Endocrinol. 2020, 2020, 3214716. [Google Scholar] [CrossRef]
- Zhang, L.; Wan, Q.; Zhou, Y.; Xu, J.; Yan, C.; Ma, Y.; Xu, M.; He, R.; Li, Y.; Zhong, X.; et al. Age-related and gender-stratified differences in the association between high triglyceride and risk of hyperuricemia. Lipids Health Dis. 2019, 18, 147. [Google Scholar] [CrossRef] [PubMed]
- Mutailipu, K.; Du, L.; Guo, J.; Liu, S.; Chen, Y.; Lu, L.; Qu, S.; Chen, H.; Bu, L. Sex-Based Differences in the Associations Between Obesity- and Lipid-Related Indexes and Hyperuricemia Risk in Patients with Obesity. Diabetes Metab. Syndr. Obes. Targets Ther. 2024, 17, 4721–4733. [Google Scholar] [CrossRef]
- Qiu, L.; Ren, Y.; Li, J.; Li, M.; Li, W.; Qin, L.; Ning, C.; Zhang, J.; Gao, F. Nonlinear association of triglyceride-glucose index with hyperuricemia in US adults: A cross-sectional study. Lipids Health Dis. 2024, 23, 145. [Google Scholar] [CrossRef] [PubMed]
- Lertsakulbunlue, S.; Sangkool, T.; Bhuriveth, V.; Mungthin, M.; Rangsin, R.; Kantiwong, A.; Sakboonyarat, B. Associations of triglyceride-glucose index with hyperuricemia among Royal Thai Army personnel. BMC Endocr. Disord. 2024, 24, 17. [Google Scholar] [CrossRef]
- Li, H.; Shen, Z.; Jiang, W.; Jia, B.; Li, S.; Zhang, P.; Wang, L.; Yuan, P.; Lu, Y. The effects and predictive values of novel anthropometric parameters on uric acid levels and hyperuricemia in adults. Sci. Rep. 2025, 15, 956. [Google Scholar] [CrossRef]
- Wang, L.; Chao, J.; Zhang, N.; Wu, Y.; Bao, M.; Yan, C.; Chen, T.; Li, X.; Chen, Y. A national study exploring the association between triglyceride-glucose index and risk of hyperuricemia events in adults with hypertension. Prev. Med. Rep. 2024, 43, 102763. [Google Scholar] [CrossRef]
- Seifi, N.; Nosrati, M.; Koochackpoor, G.; Aghasizadeh, M.; Bahari, H.; Namdar, H.B.; Afkhami, N.; Darban, R.A.; Azarian, F.; Ferns, G.A.; et al. The association between hyperuricemia and insulin resistance surrogates, dietary- and lifestyle insulin resistance indices in an Iranian population: MASHAD cohort study. Nutr. J. 2024, 23, 5. [Google Scholar] [CrossRef]
- Song, P.; Wang, H.; Xia, W.; Chang, X.; Wang, M.; An, L. Prevalence and correlates of hyperuricemia in the middle-aged and older adults in China. Sci. Rep. 2018, 8, 4314. [Google Scholar] [CrossRef] [PubMed]
- Song, J.; Jin, C.; Shan, Z.; Teng, W.; Li, J. Prevalence and Risk Factors of Hyperuricemia and Gout: A Cross-sectional Survey from 31 Provinces in Mainland China. J. Transl. Intern. Med. 2022, 10, 134–145. [Google Scholar] [CrossRef]
- Rai, S.K.; Fung, T.T.; Lu, N.; Keller, S.F.; Curhan, G.C.; Choi, H.K. The Dietary Approaches to Stop Hypertension (DASH) diet, Western diet, and risk of gout in men: Prospective cohort study. BMJ 2017, 357, j1794. [Google Scholar] [CrossRef]
- Nakamura, K.; Sakurai, M.; Miura, K.; Morikawa, Y.; Yoshita, K.; Ishizaki, M.; Kido, T.; Naruse, Y.; Suwazono, Y.; Nakagawa, H. Alcohol intake and the risk of hyperuricaemia: A 6-year prospective study in Japanese men. Nutr. Metab. Cardiovasc. Dis. NMCD 2012, 22, 989–996. [Google Scholar] [CrossRef]
- Dawson, J.; Wyss, A. Chicken or the Egg? Hyperuricemia, Insulin Resistance, and Hypertension. Hypertension 2017, 70, 698–699. [Google Scholar] [CrossRef] [PubMed]
- Vasques, A.C.; Novaes, F.S.; de Oliveira Mda, S.; Souza, J.R.; Yamanaka, A.; Pareja, J.C.; Tambascia, M.A.; Saad, M.J.; Geloneze, B. TyG index performs better than HOMA in a Brazilian population: A hyperglycemic clamp validated study. Diabetes Res. Clin. Pract. 2011, 93, e98–e100. [Google Scholar] [CrossRef] [PubMed]
- Sattui, S.E.; Singh, J.A.; Gaffo, A.L. Comorbidities in patients with crystal diseases and hyperuricemia. Rheum. Dis. Clin. N. Am. 2014, 40, 251–278. [Google Scholar] [CrossRef]
- Kang, B.; Yang, Y.; Lee, E.Y.; Yang, H.K.; Kim, H.S.; Lim, S.Y.; Lee, J.H.; Lee, S.S.; Suh, B.K.; Yoon, K.H. Triglycerides/glucose index is a useful surrogate marker of insulin resistance among adolescents. Int. J. Obes. 2017, 41, 789–792. [Google Scholar] [CrossRef]
- de Oliveira, E.P.; Burini, R.C. High plasma uric acid concentration: Causes and consequences. Diabetol. Metab. Syndr. 2012, 4, 12. [Google Scholar] [CrossRef]
- Xu, L.; Shi, Y.; Zhuang, S.; Liu, N. Recent advances on uric acid transporters. Oncotarget 2017, 8, 100852–100862. [Google Scholar] [CrossRef]
- Mandal, A.K.; Mount, D.B. The molecular physiology of uric acid homeostasis. Annu. Rev. Physiol. 2015, 77, 323–345. [Google Scholar] [CrossRef] [PubMed]
- Toyoki, D.; Shibata, S.; Kuribayashi-Okuma, E.; Xu, N.; Ishizawa, K.; Hosoyamada, M.; Uchida, S. Insulin stimulates uric acid reabsorption via regulating urate transporter 1 and ATP-binding cassette subfamily G member 2. Am. J. Physiol. Ren. Physiol. 2017, 313, F826–F834. [Google Scholar] [CrossRef] [PubMed]
- Leyva, F.; Wingrove, C.S.; Godsland, I.F.; Stevenson, J.C. The glycolytic pathway to coronary heart disease: A hypothesis. Metab. Clin. Exp. 1998, 47, 657–662. [Google Scholar] [CrossRef]
- Baldwin, W.; McRae, S.; Marek, G.; Wymer, D.; Pannu, V.; Baylis, C.; Johnson, R.J.; Sautin, Y.Y. Hyperuricemia as a mediator of the proinflammatory endocrine imbalance in the adipose tissue in a murine model of the metabolic syndrome. Diabetes 2011, 60, 1258–1269. [Google Scholar] [CrossRef]
- McCormick, N.; O’Connor, M.J.; Yokose, C.; Merriman, T.R.; Mount, D.B.; Leong, A.; Choi, H.K. Assessing the Causal Relationships Between Insulin Resistance and Hyperuricemia and Gout Using Bidirectional Mendelian Randomization. Arthritis Rheumatol. 2021, 73, 2096–2104. [Google Scholar] [CrossRef]
- Gao, Z.; Zuo, M.; Han, F.; Yuan, X.; Sun, M.; Li, X.; Liu, R.; Jiang, W.; Zhang, L.; Chang, B.; et al. Renal impairment markers in type 2 diabetes patients with different types of hyperuricemia. J Diabetes Investig 2019, 10, 118–123. [Google Scholar] [CrossRef]
- Zhang, Y.; Wei, F.; Chen, C.; Cai, C.; Zhang, K.; Sun, N.; Tian, J.; Shi, W.; Zhang, M.; Zang, Y.; et al. Higher triglyceride level predicts hyperuricemia: A prospective study of 6-year follow-up. J. Clin. Lipidol. 2018, 12, 185–192. [Google Scholar] [CrossRef]
- Geer, E.B.; Shen, W. Gender differences in insulin resistance, body composition, and energy balance. Gend. Med. 2009, 6 (Suppl. 1), 60–75. [Google Scholar] [CrossRef] [PubMed]
- Motlani, V.; Motlani, G.; Pamnani, S.; Sahu, A.; Acharya, N. Endocrine Changes in Postmenopausal Women: A Comprehensive View. Cureus 2023, 15, e51287. [Google Scholar] [CrossRef]
- Pitteloud, N.; Mootha, V.K.; Dwyer, A.A.; Hardin, M.; Lee, H.; Eriksson, K.F.; Tripathy, D.; Yialamas, M.; Groop, L.; Elahi, D.; et al. Relationship between testosterone levels, insulin sensitivity, and mitochondrial function in men. Diabetes Care 2005, 28, 1636–1642. [Google Scholar] [CrossRef]
- Mohammadi, M.; Allahverdipour, H.; Ghanbari Moghaddam, A.; Matlabi, H. The Prevalence of Andropause and Its Relationship with Sexual Quality of Life Among Older Iranian Men. Am. J. Men’s Health 2023, 17, 15579883231161050. [Google Scholar] [CrossRef] [PubMed]
- Pfeilschifter, J.; Köditz, R.; Pfohl, M.; Schatz, H. Changes in proinflammatory cytokine activity after menopause. Endocr. Rev. 2002, 23, 90–119. [Google Scholar] [CrossRef] [PubMed]
- Shi, J.; Fan, J.; Su, Q.; Yang, Z. Cytokines and Abnormal Glucose and Lipid Metabolism. Front. Endocrinol. 2019, 10, 703. [Google Scholar] [CrossRef] [PubMed]

| Study | Country | Design | Participant Features | Sample Size | Mean Age (Years) | Male (%) | TyG Index Analysis | Diagnosis of Hyperuricemia | Variables Adjusted | NOS |
|---|---|---|---|---|---|---|---|---|---|---|
| Yutong Han et al. [40] | China | case–control study | participants aged ≥ 45 years | 5269 | 58.58 ± 8.61 | 45.28 | Continuous; Categorized (Q4:Q1) | SUA ≥ 7 mg/dL (men) and ≥6 mg/dL (women) | age, gender, residence, education, marital status, smoking, drinking, HTN, diabetes, CVD, dyslipidemia and TC, BUN, Cre, HbA1c and C-reactive proteins | 8 |
| Chao Yu et al. [41] | China | cross-sectional study | adults with HTN | 13,060 | 63.81 | 51.04 | Continuous; Categorized (Q4:Q1) | SUA ≥ 7 mg/dL | gender, age, BMI, SBP, DBP, education, exercise, WC, drinking, smoking, HDL-C, LDL-C, serum homocysteine, eGFR, diabetes and antiplatelet and antihypertensive medicines | 6 |
| Jiankai Dong et al. [42] | China | cross-sectional study | in-patients with primary hypertension | 428 | 67.86 ± 6.96 | 46.70 | Continuous | two non-daily fasting SUA levels ≥ 7 mg/dL (men) and ≥6 mg/dL (women) | gender, age, body weight, smoking, drinking and BMI | 6 |
| Mayina Kahaer et al. [43] | China | cross-sectional study | the medical checkup population | 2243 | 41.55 ± 12.70 | 72.05 | Categorized (Q4:Q1) | SUA > 7 mg/dL | age, SBP, DBP, BUN, Cre, TC and LDL-C | 7 |
| Shanshan Liu et al. [44] | China | cross-sectional study | in-patients with primary HTN | 1707 | 62.97 ± 12.87 | 46.00 | Continuous; Categorized (Q3:Q1) | SUA ≥ 7 mg/dL | age, gender, ALB, ALT, AST, Scr, BUN, d-dimer, INR, eGFR, HTN, LDL-C, HDL-C and LPa | 6 |
| Wenrui Shi et al. [45] | China | cross-sectional study | general population | 6466 | 59.57 ± 10.49 | 39.81 | Continuous; Categorized (Q4:Q1) | SUA ≥ 7 mg/dL (men) and ≥6 mg/dL (women) | age, gender, education, income, exercise, smoking, drinking, BMI, HTN, DM, eGFR, HDL-C, LDL-C, antidiabetic and lipid-lowering therapy and CVD | 8 |
| Jin Sun et al. [46] | China | cross-sectional study | community-based | 4551 | 58.63 ± 8.33 | 33.60 | Categorized (Q4:Q1) | SUA ≥ 7 mg/dL (men) and ≥6 mg/dL (women) | age, gender, SBP, DBP, Scr, BUN, stroking, CHD and DM, serum cholesterol, HDL-C, LDL-C, BMI, WC and hip circumference | 8 |
| Shizhe Zhou et al. [47] | China | cross-sectional study | college students | 23,411 | 18.28 ± 0.64 | 47.74 | Categorized (Q4:Q1) | two measurements on different days, SUA > 7 mg/dL | age, SBP, DBP, BUN, Cre, ALT, AST and TC | 7 |
| Yaxin Li et al. [30] | China | cross-sectional study | population-based community | 4352 | - | 44.97 | Categorized (Q4:Q1) | SUA ≥ 7 mg/dL (men) and ≥6 mg/dL (premenopausal women) | gender, age, education, smoking, drinking, exercise, TC, LDL-C and eGFR | 8 |
| Yu Luo et al. [48] | China | cross-sectional study | patients with T2DM | 719 | - | 60.64 | Continuous | SUA > 7 mg/dL (men) and >6 mg/dL (women) | age, gender, BMI, ALB, ALT, AST, BUN, Scr, TG, HDL-C, FPG, HbA1c and fatty liver | 6 |
| Hao Wang et al. [49] | US | cross-sectional study | non-diabetic patients | 7743 | 45.17 ± 17.10 | 49.15 | Categorized (Q4:Q1) | SUA ≥ 6 mg/dL | gender, age, race, education, smoking, drinking, SBP, DBP, MET, TC, LDL-C and eGFR | 8 |
| Jiaxin Qi et al. [50] | China | retrospective case–control study | patients with NAFLD | 461 | - | 41.20 | Continuous; Categorized (Q3:Q1) | SUA > 7 mg/dL (men) and >6 mg/dL (women) | age, gender, BMI, HTN, DM, smoking, ALT, AST and Scr | 6 |
| Qiuhong Li et al. (1) [51] | China | cross-sectional study | patients with diabetic nephropathy | 6471 | 59.11 ± 10.53 | 58.41 | Categorized (Q4:Q1) | SUA ≥ 7 mg/dL | age, gender, HDL-C, LDL-C, BMI, eGFR, 24hTP, SBP, DBP and HbA1c | 6 |
| Qiuhong Li et al. (2) [51] | China | cohort study | patients with diabetic nephropathy | 3634 | - | - | Categorized (Q4:Q1) | SUA ≥ 7 mg/dL | age, gender, HDL-C, LDL-C, BMI, eGFR, 24hTP, SBP, DBP and HbA1c | 8 |
| Xing Zhen Liu et al. [52] | China | cross-sectional study | adults without self-reported use of drugs | 174,695 | 45.00 ± 12.20 | 60.20 | Categorized (Q4:Q1) | SUA ≥ 7 mg/dL (men and postmenopausal women) and ≥6 mg/dL (premenopausal women) | age, smoking, WC and eGFR | 7 |
| Zeinab Ghorbani et al. [32] | Iran | cross-sectional study | individuals who visited the cardiology outpatient clinic | 1170 | - | 40.60 | Categorized (Q3:Q1) | SUA ≥ 5.6 mg/dL | gender; age; HTN, T2DM or hyperlipidemia; using antihypertensive α, antidiabetic β or antihyperlipidemic medications γ; and smoking | 6 |
| Xuanxia Wu et al. [53] | China | cross-sectional study | general population | 32,354 | - | 55.94 | Categorized (Q4:Q1) | SUA > 7 mg/dL (men) and >6 mg/dL (women) | gender, age, race, residence, marital status, BMI, abdominal obesity, HTN, diabetes, CHD and dyslipidemia | 8 |
| Qing Gu et al. [54] | China | cohort study | general population | 42,387 | 43.10 ± 12.30 | 56.30 | Categorized (Q3:Q1) | SUA ≥ 7 mg/dL (men and postmenopausal women) and ≥6 mg/dL (premenopausal women or those receiving urate lowering therapies) | age, smoking, BMI, HTN, NAFLD, eGFR and urate | 9 |
| Lei Zhang et al. [55] | China | cross-sectional study | participants of physical examination | 24,438 | 47.23 | 51.38 | Categorized (Q4:Q1) | SUA ≥ 7.392 mg/dL (men) and ≥6 mg/dL (women) | age, alanine aminotransferase, γ-glutamyl transpeptidase, Scr, BUN, TC and HDL-C | 8 |
| Kelibinuer Mutailipu et al. [56] | China | cross-sectional study | Department of Endocrinology at the hospital | 951 | 31.00 | 42.69 | Categorized (Q4:Q1) | SUA ≥ 7 mg/dL (men) and >6 mg/dL (women) | age, HR, HbA1c, FPG, TC, TG, HDL, LDL, BAI and LAP | 6 |
| Ruoyu Gou et al. [2] | US and China | cross-sectional study | data from NHANES in US and CHARLS in China | US: 14,259 China: 4613 | US: 45.92 China: 68.52 | US: 52.67 China: 69.91 | Categorized (Q4:Q1) | SUA ≥ 7 mg/dL (men) and ≥6 mg/dL (women) | gender, age, marital status, education, HTN, diabetes, hypertriglyceridemia and healthy lifestyle score | 8 |
| Yu-Qiang Zuo et al. [31] | China | cross-sectional study | an annual health check-up population | 6219 | 39.13 | 22.77 | Categorized (Q4:Q1) | two non-fasting SUA levels ≥ 7 mg/dL | gender, age, drinking, smoking, menopause status, LDL-C and TC. | 8 |
| Linjie Qiu et al. [57] | US | cross-sectional study | data from the NHANES | 8572 | 49.2 | 49.93 | Continuous | SUA ≥ 7 mg/dL (men) and ≥6 mg/dL (women) | age, gender, race, education, marital status, smoking, drinking, exercise, BMI, family income to poverty ratio, LDL, HDL, HbA1c, Scr, eGFR, HTN, diabetes, arthritis, CHD and stroke | 8 |
| Sethapong Lertsakulbunlue et al. [58] | Thailand | cross-sectional study | Royal Thai Army personnel | 231,286 | 47.4 | 89.4 | Categorized (Q4:Q1) | SUA ≥ 7 mg/dL (men) and ≥6 mg/dL (women) | age, gender, BMI, region, scheme, year, smoking, drinking, exercise, SBP, DBP, AST and ALT | 6 |
| Li Hongwei et al. [59] | China | cross-sectional study | adults undergoing health screening | 14,834 | 50.6 | 65.98 | Categorized (Q4:Q1) | a fasting SUA > 7 mg/dL (men), and > 6 mg/dL (women) | age, SBP, DBP, FPG, smoking, drinking, exercise and diet. | 8 |
| Leixia Wang et al. [60] | US | cross-sectional study | data from the NHANES | 7367 | 51.8 | 48.34 | Categorized (Q4:Q1) | SUA ≥ 7 mg/dL (men) and ≥6 mg/dL (women) | gender, age, education, race, smoking, drinking, exercise, BMI, WC, TC, TG, HDL-C, LDL-C, HbA1c, fasting blood glucose and self-reported comorbidities | 8 |
| Najmeh Seif et al. [61] | Iran | cross-sectional study | part of the Mashhad Stroke and Heart Atherosclerotic Disorder cohort study | 6457 | 48.44 | 39.94 | Categorized (Q4:Q1) | SUA ≥ 7 mg/dL (men) and ≥6 mg/dL (women) | age, gender, BMI, energy intake, education, smoking, exercise, chronic diseases including diabetes, HTN, dyslipidemia and eGFR. | 8 |
| Subgrouped by | No. of Trials | OR | 95% CI | I2 (%) | Pover effect | Pinteraction | Pmeta-regression |
|---|---|---|---|---|---|---|---|
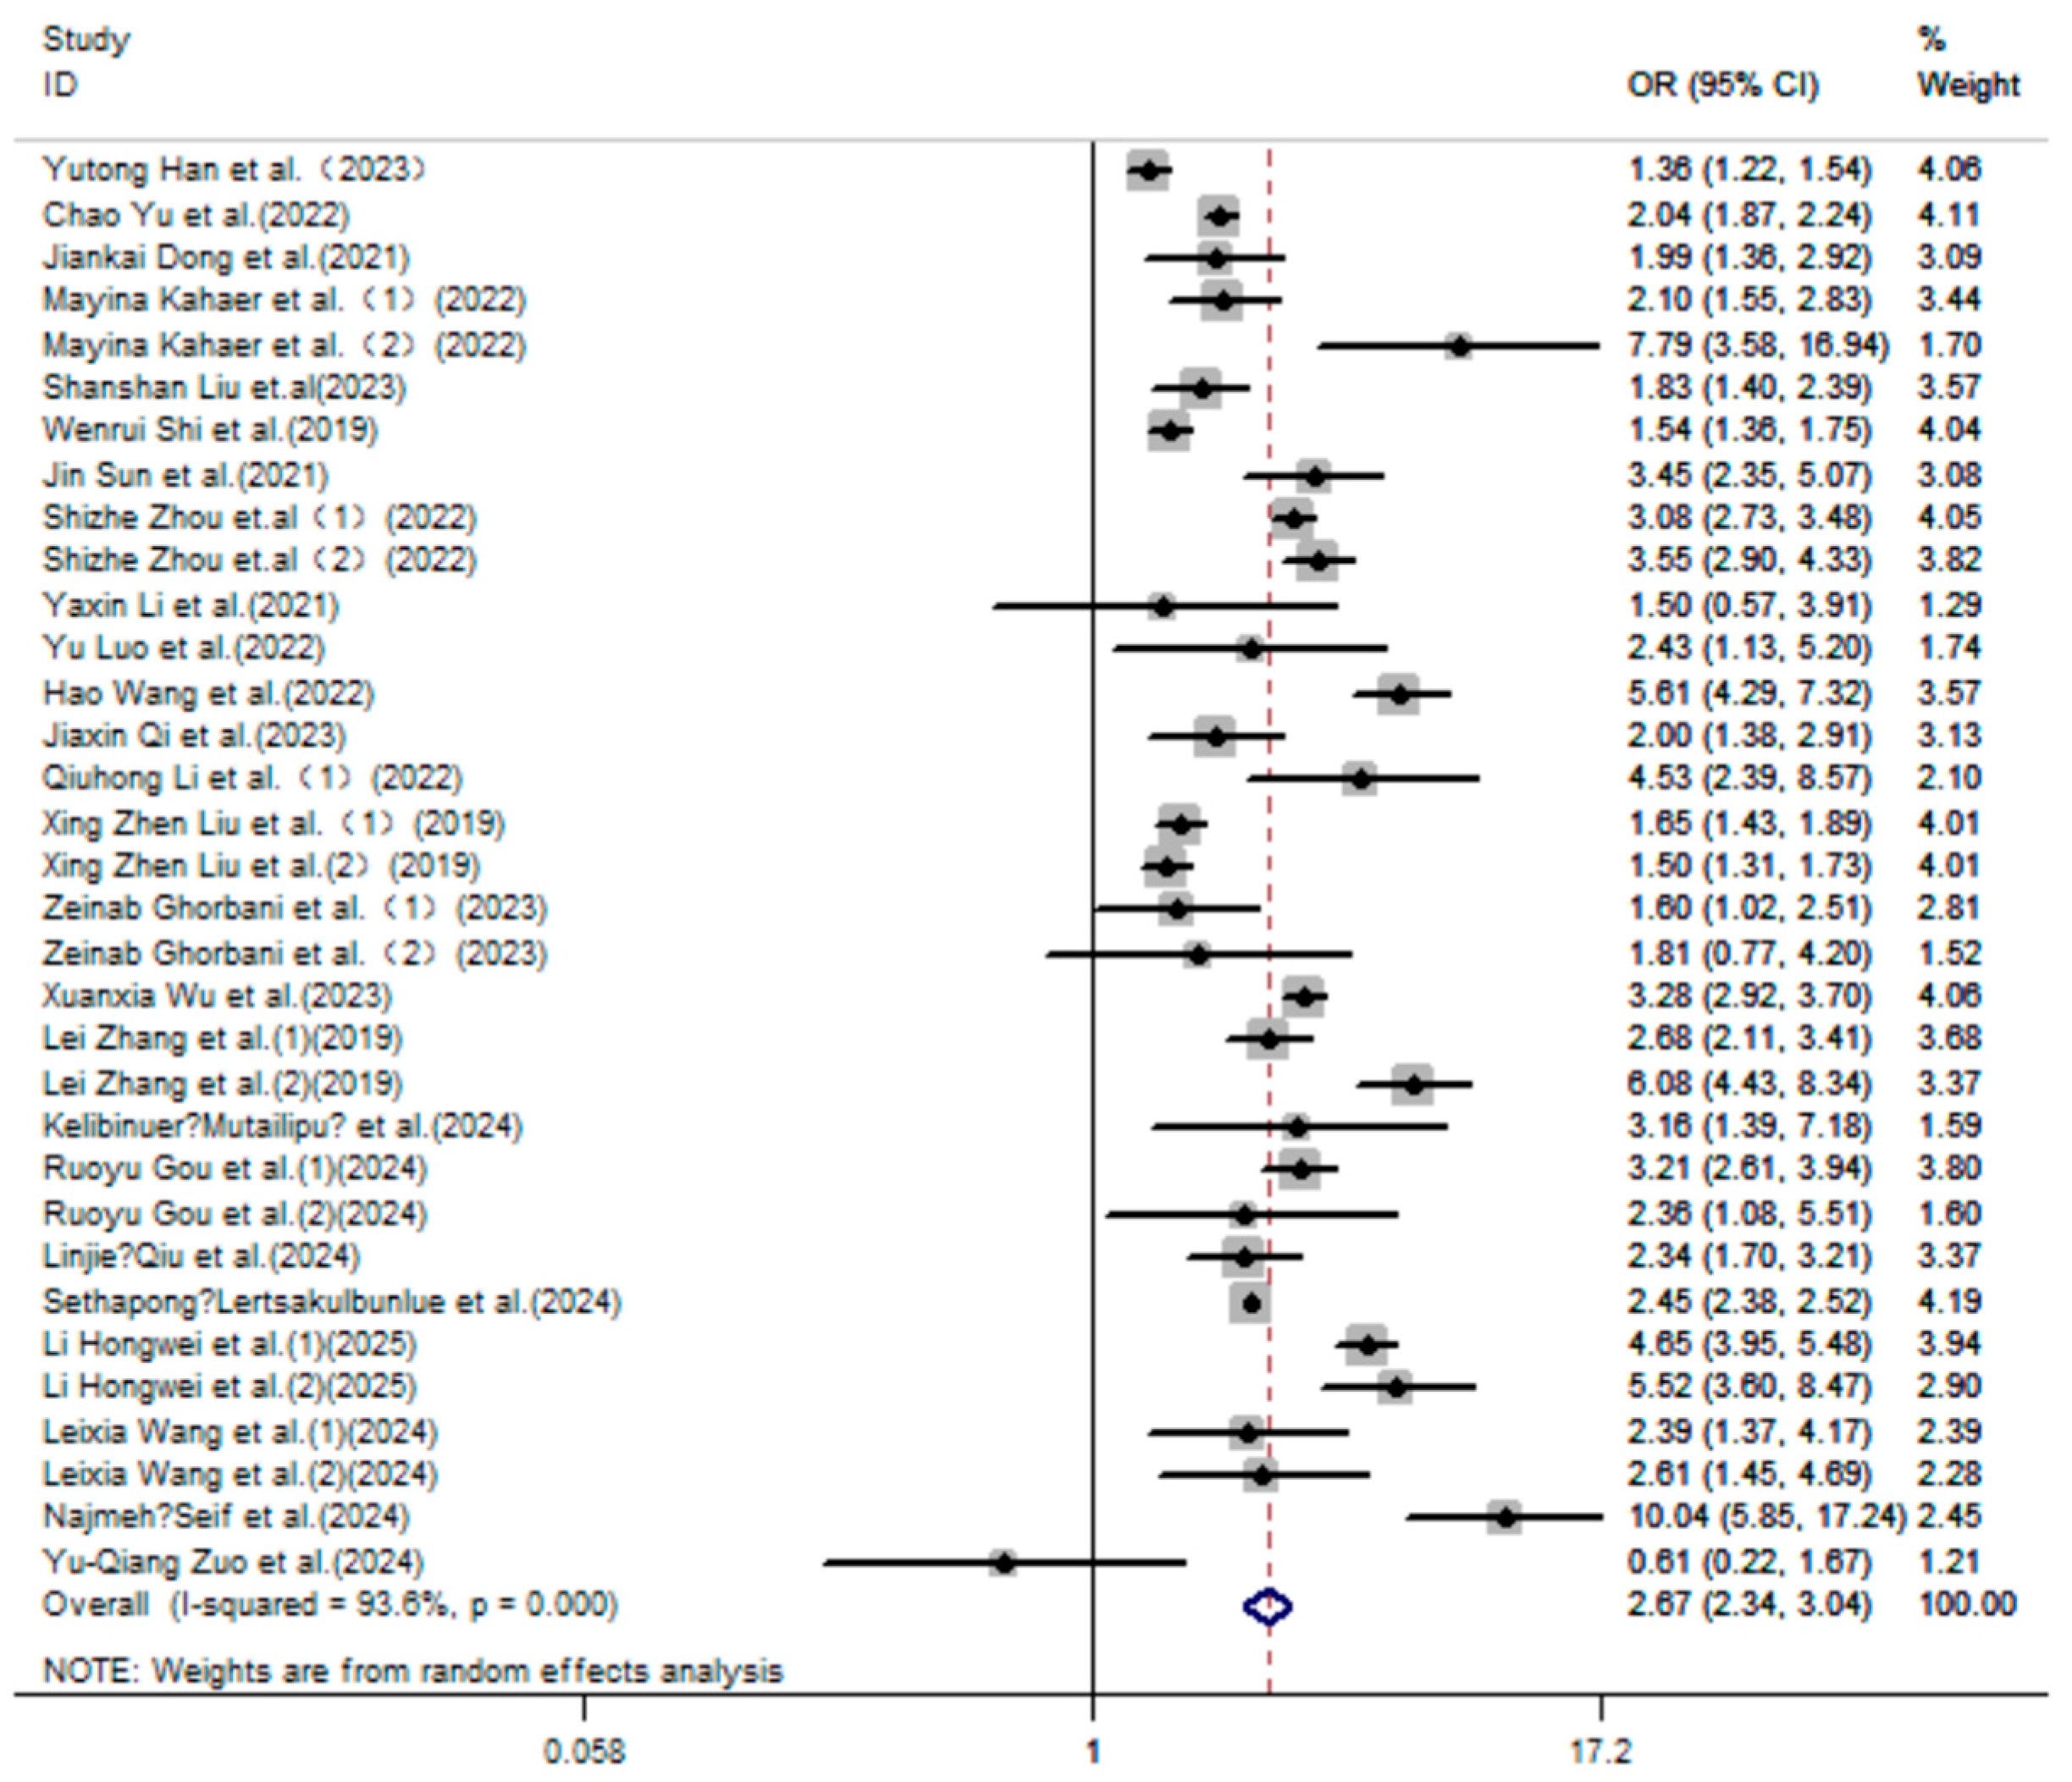
| region | 25 | 2.67 | (2.34, 3.04) | 93.6 | <0.001 | 0.43 | 0.495 |
| Asia | 22 | 2.58 | (2.24, 2.98) | 94.1 | <0.001 | ||
| North America | 4 | 3.15 | (2.22, 4.47) | 61.3 | <0.001 | ||
| TyG index analysis | 25 | 2.67 | (2.34, 3.04) | 93.6 | <0.001 | <0.001 | 0.017 |
| continuous | 8 | 1.82 | (1.54, 2.14) | 81.6 | <0.001 | ||
| categorized | 17 | 3.05 | (2.61, 3.56) | 92.6 | <0.001 | ||
| gender | 13 | 2.60 | (2.22, 3.05) | 92.6 | <0.001 | 0.03 | 0.053 |
| men | 12 | 2.21 | (1.80, 2.70) | 92.9 | <0.001 | ||
| women | 13 | 3.18 | (2.43, 4.16) | 92.8 | <0.001 | ||
| age | 8 | 2.16 | (1.78, 2.63) | 87.7 | <0.001 | 0.18 | 0.222 |
| <60 | 4 | 2.41 | (1.72, 3.38) | 93.5 | <0.001 | ||
| ≥60 | 7 | 1.89 | (1.69, 2.11) | 13.3 | 0.328 | ||
| body mass index | 7 | 1.82 | (1.59, 2.08) | 84.4 | <0.001 | 0.18 | 0.241 |
| non-overweight | 3 | 1.62 | (1.31, 2.00) | 74.4 | 0.008 | ||
| overweight | 6 | 1.94 | (1.66, 2.26) | 79.3 | <0.001 | ||
| diabetes | 8 | 2.20 | (1.55, 3.13) | 87.1 | <0.001 | 0.81 | 0.837 |
| yes | 4 | 2.09 | (1.10, 3.98) | 81.7 | 0.001 | ||
| no | 6 | 2.30 | (1.52, 3.48) | 87.9 | <0.001 | ||
| eGFR | 3 | 1.78 | (1.50, 2.11) | 74.6 | 0.003 | 0.60 | 0.637 |
| <60 | 2 | 1.66 | (1.28, 2.17) | 0.0 | 0.540 | ||
| ≥60 | 3 | 1.82 | (1.46, 2.27) | 86.1 | 0.001 | ||
| hypertension | 9 | 1.99 | (1.73, 2.29) | 66.8 | <0.001 | 0.87 | 0.893 |
| yes | 8 | 1.98 | (1.74, 2.26) | 52.2 | 0.033 | ||
| no | 5 | 1.92 | (1.27, 2.89) | 80.2 | <0.001 | ||
| heart disease | 3 | 2.08 | (1.77, 2.44) | 0.0 | 0.618 | 0.15 | 0.246 |
| yes | 2 | 1.61 | (1.10, 2.36) | 0.0 | 0.955 | ||
| no | 3 | 2.19 | (1.84, 2.62) | 0.0 | 0.749 | ||
| year of publication | 25 | 2.67 | (2.34, 3.04) | 93.6 | <0.001 | 0.79 | 0.770 |
| <2023 | 12 | 2.73 | (2.21, 3.37) | 93.8 | <0.001 | ||
| ≥2023 | 13 | 2.62 | (2.15, 3.21) | 93.5 | <0.001 | ||
| diagnosis of hyperuricemia | 25 | 2.67 | (2.34, 3.04) | 93.6 | <0.001 | 0.43 | 0.597 |
| 1 * | 16 | 2.55 | (2.13, 3.04) | 94.7 | <0.001 | ||
| other | 9 | 2.87 | (2.26, 3.64) | 91.2 | <0.001 |
Disclaimer/Publisher’s Note: The statements, opinions and data contained in all publications are solely those of the individual author(s) and contributor(s) and not of MDPI and/or the editor(s). MDPI and/or the editor(s) disclaim responsibility for any injury to people or property resulting from any ideas, methods, instructions or products referred to in the content. |
© 2025 by the authors. Licensee MDPI, Basel, Switzerland. This article is an open access article distributed under the terms and conditions of the Creative Commons Attribution (CC BY) license (https://creativecommons.org/licenses/by/4.0/).
Share and Cite
Wang, J.; He, Q.; Sun, W.; Li, W.; Yang, Y.; Cui, W.; Yang, X. The Association Between the Triglyceride Glucose Index and Hyperuricemia: A Dose–Response Meta-Analysis. Nutrients 2025, 17, 1462. https://doi.org/10.3390/nu17091462
Wang J, He Q, Sun W, Li W, Yang Y, Cui W, Yang X. The Association Between the Triglyceride Glucose Index and Hyperuricemia: A Dose–Response Meta-Analysis. Nutrients. 2025; 17(9):1462. https://doi.org/10.3390/nu17091462
Chicago/Turabian StyleWang, Juan, Qiang He, Wenhui Sun, Wei Li, Yuting Yang, Weiwei Cui, and Xiangshan Yang. 2025. "The Association Between the Triglyceride Glucose Index and Hyperuricemia: A Dose–Response Meta-Analysis" Nutrients 17, no. 9: 1462. https://doi.org/10.3390/nu17091462
APA StyleWang, J., He, Q., Sun, W., Li, W., Yang, Y., Cui, W., & Yang, X. (2025). The Association Between the Triglyceride Glucose Index and Hyperuricemia: A Dose–Response Meta-Analysis. Nutrients, 17(9), 1462. https://doi.org/10.3390/nu17091462