
Anthropometric Trajectories and Dietary Compliance During a Personalized Ketogenic Program


 , and
, and
Abstract
:1. Introduction
2. Materials and Methods
2.1. Study Design and Setting and Study Period
2.2. Selection Criteria
2.3. Recruitment and Screening Process
2.4. Ethical Approval and Informed Consent
2.5. Baseline Sample Characterization
2.6. Dietary Intervention: Ketogenic Diet
- −
- For participants with BMI < 40 kg/m2, the actual body weight was used.
- −
- For participants with BMI ≥ 40 kg/m2, an adjusted weight was employed using the formula:
- −
- Men: BMR = (10 × weight [kg]) + (6.25 × height [cm]) − (5 × age [years]) + 5
- −
- Women: BMR = (10 × weight [kg]) + (6.25 × height [cm]) − (5 × age [years]) − 161
2.7. Adherence Monitoring and Ketosis Status
2.8. Data Analysis
3. Results
3.1. Participant Characteristics at Baseline
3.2. Longitudinal Changes in Body Weight and Body Mass Index
3.3. Evolution of Body Composition Metrics
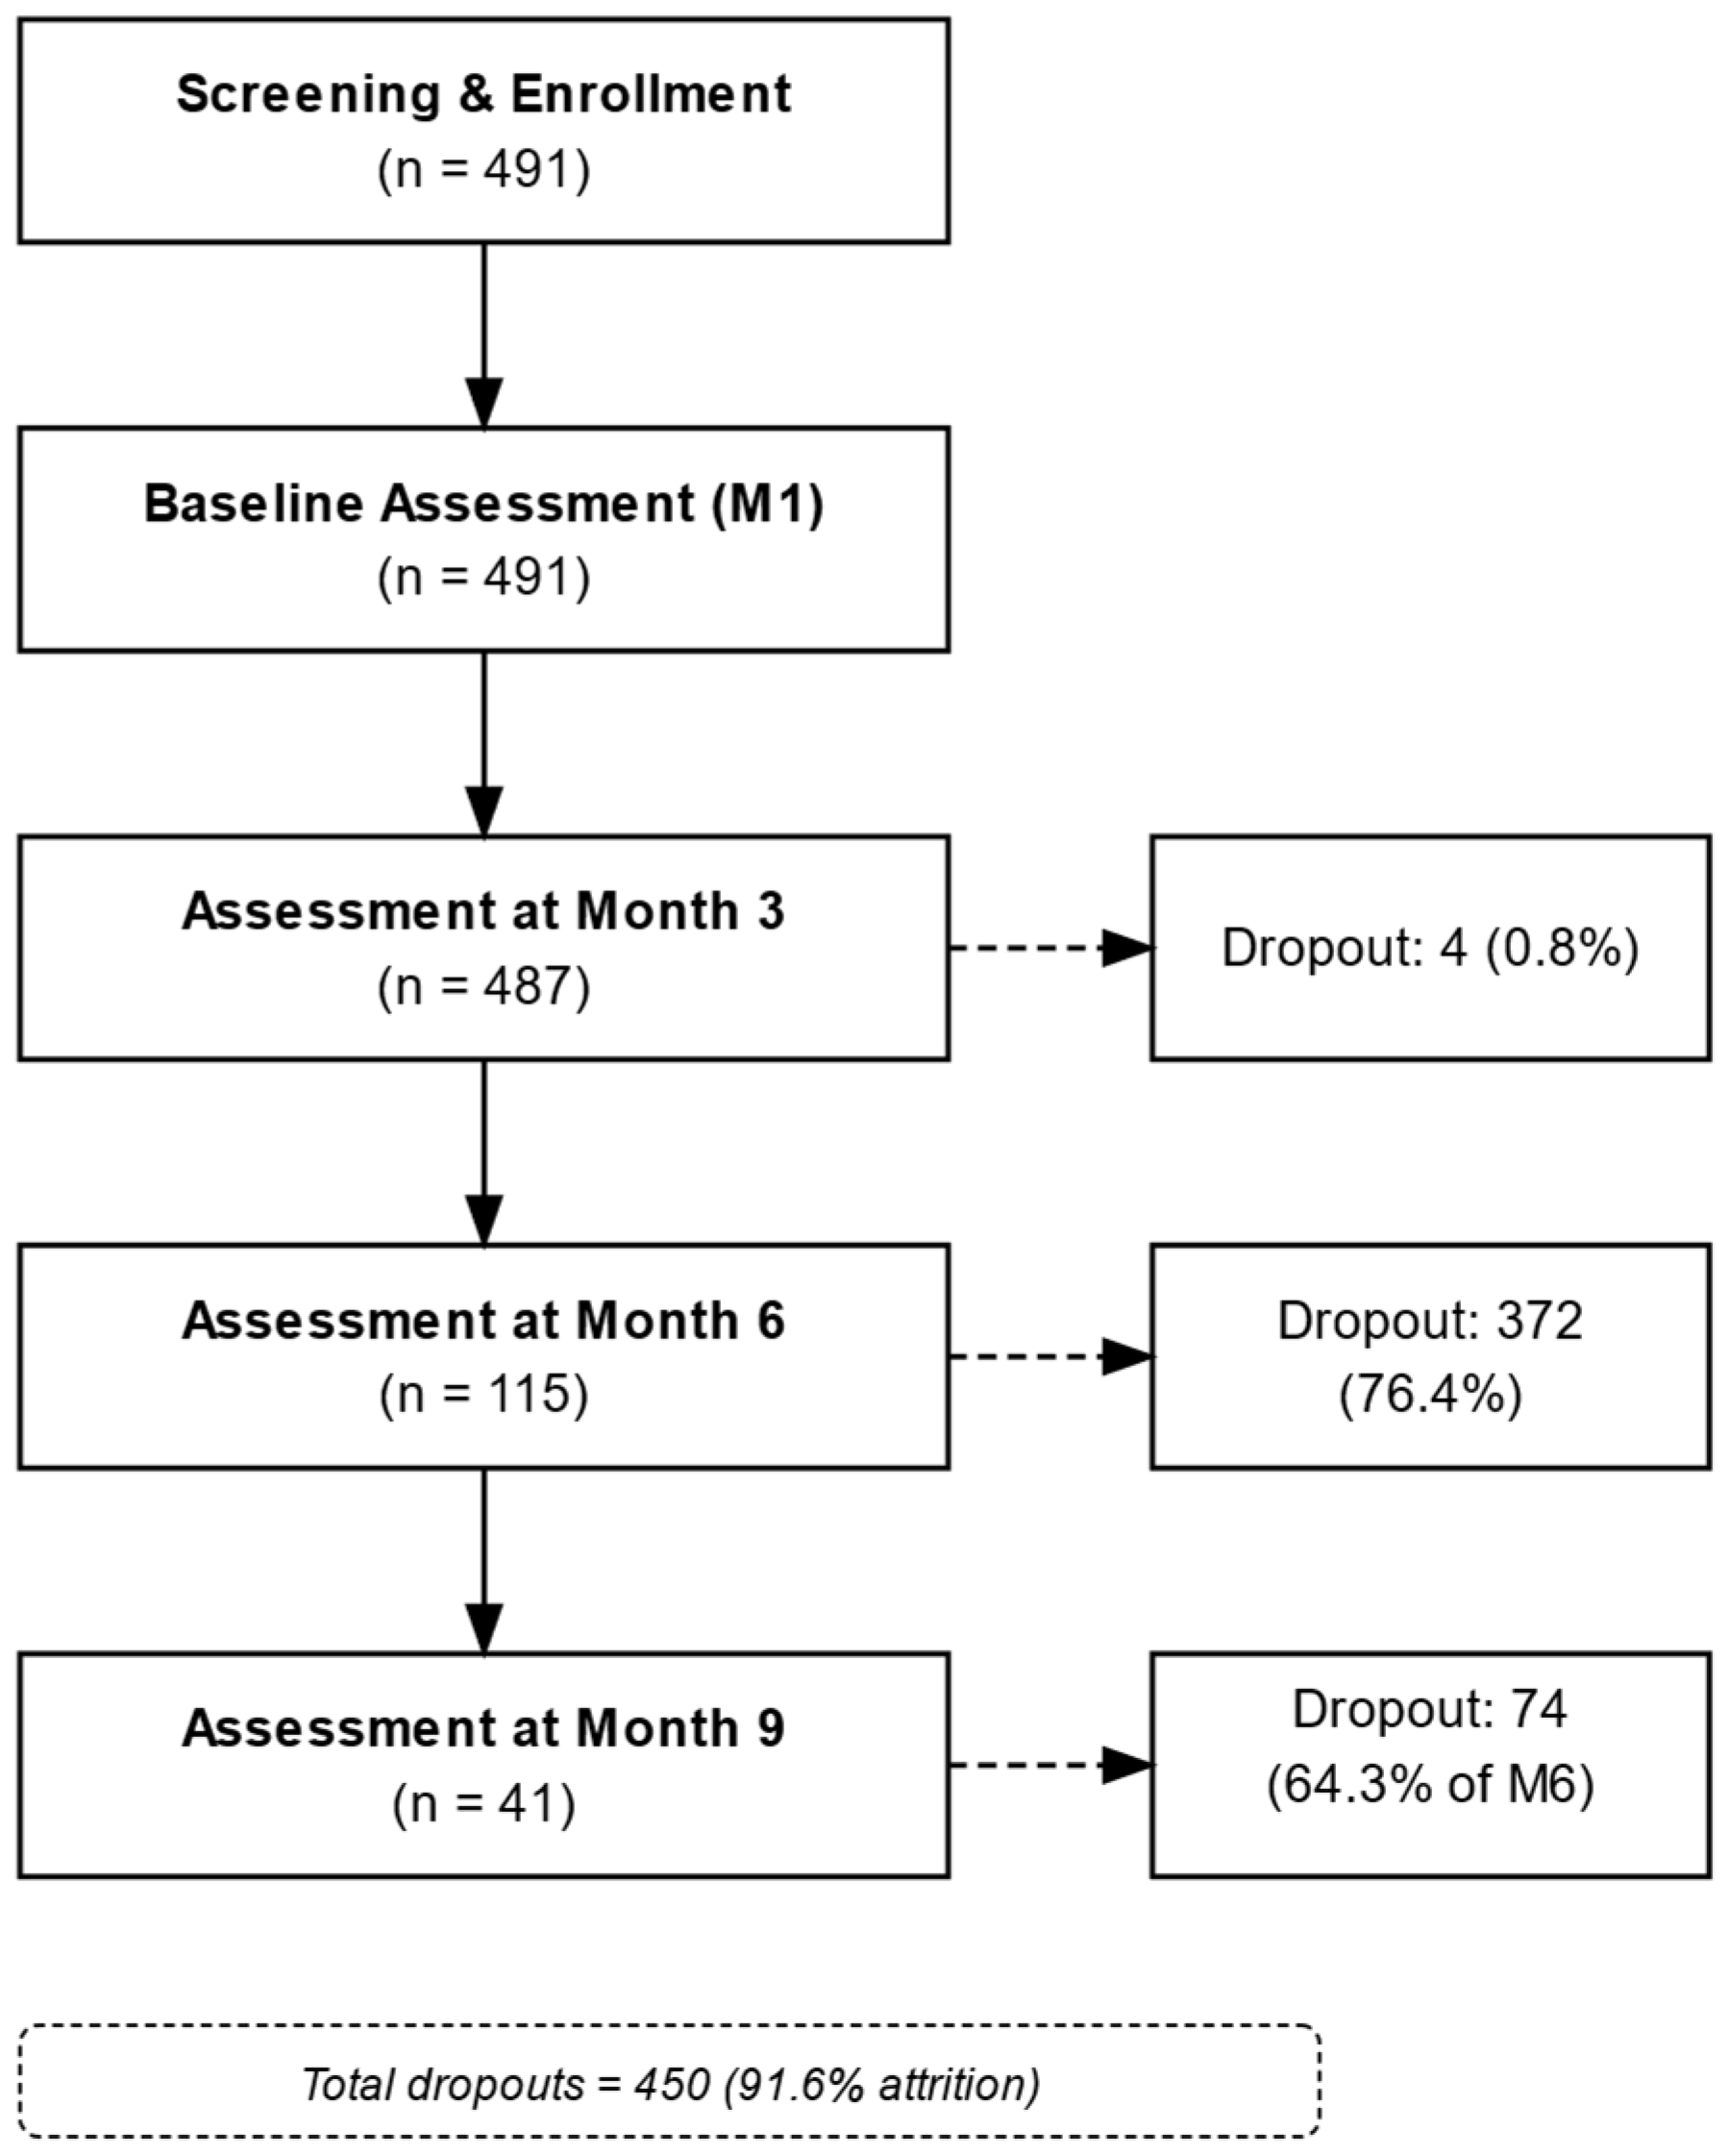
3.4. Dietary Adherence and Dropout Patterns
3.5. Intention-to-Treat Analysis with Baseline Observation Carried Forward (BOCF)
4. Discussion
4.1. Anthropometric Changes
4.2. Adherence and Long-Term Sustainability
4.3. Limitations and Impact of Attrition
5. Conclusions
Author Contributions
Funding
Institutional Review Board Statement
Informed Consent Statement
Data Availability Statement
Conflicts of Interest
References
- Said, S.; Mukherjee, D.; Whayne, T.F. Interrelationships with Metabolic Syndrome, Obesity and Cardiovascular Risk. Curr. Vasc. Pharmacol. 2016, 14, 415–425. [Google Scholar] [CrossRef]
- GBD 2015 Obesity Collaborators; Afshin, A.; Forouzanfar, M.H.; Reitsma, M.B.; Sur, P.; Estep, K.; Lee, A.; Marczak, L.; Mokdad, A.H.; Moradi-Lakeh, M.; et al. Health Effects of Overweight and Obesity in 195 Countries. N. Engl. J. Med. 2017, 377, 1495–1497. [Google Scholar]
- Dowis, K.; Banga, S. The Potential Health Benefits of the Ketogenic Diet: A Narrative Review. Nutrients 2021, 13, 1654. [Google Scholar] [CrossRef]
- Zhu, H.; Bi, D.; Zhang, Y.; Kong, C.; Du, J.; Wu, X.; Wei, Q.; Qin, H. Ketogenic diet for human diseases: The underlying mechanisms and potential for clinical implementations. Signal Transduct Target Ther. 2022, 7, 11. [Google Scholar] [CrossRef]
- Longo, R.; Peri, C.; Cricrì, D.; Coppi, L.; Caruso, D.; Mitro, N.; De Fabiani, E.; Crestani, M. Ketogenic Diet: A New Light Shining on Old but Gold Biochemistry. Nutrients 2019, 11, 2497. [Google Scholar] [CrossRef]
- Kalamian, M. The Therapeutic Ketogenic Diet: Harnessing Glucose, Insulin, and Ketone Metabolism. In Integrative and Functional Medical Nutrition Therapy; Springer International Publishing: Cham, Switzerland, 2020; pp. 335–365. [Google Scholar]
- Valenzuela, P.L.; Castillo-García, A.; Lucia, A.; Naclerio, F. Effects of Combining a Ketogenic Diet with Resistance Training on Body Composition, Strength, and Mechanical Power in Trained Individuals: A Narrative Review. Nutrients 2021, 13, 3083. [Google Scholar] [CrossRef]
- Astrup, A.; Larsen, T.M.; Harper, A. Atkins and Other Low-Carbohydrate Diets: Hoax or an Effective Tool for Weight Loss? Lancet 2004, 364, 897–899. [Google Scholar] [CrossRef]
- Sukkar, S.G.; Muscaritoli, M. A Clinical Perspective of Low Carbohydrate Ketogenic Diets: A Narrative Review. Front. Nutr. 2021, 8, 642628. [Google Scholar] [CrossRef]
- Watanabe, M.; Tuccinardi, D.; Ernesti, I.; Basciani, S.; Mariani, S.; Genco, A.; Manfrini, S.; Lubrano, C.; Gnessi, L. Scientific Evidence Underlying Contraindications to the Ketogenic Diet: An Update. Obes. Rev. 2020, 21, e13053. [Google Scholar] [CrossRef] [PubMed]
- Bueno, N.B.; de Melo, I.S.V.; de Oliveira, S.L.; da Rocha Ataide, T. Very-Low-Carbohydrate Ketogenic Diet vs. Low-Fat Diet for Long-Term Weight Loss: A Meta-Analysis of Randomized Controlled Trials. Br. J. Nutr. 2013, 110, 1178–1187. [Google Scholar] [CrossRef] [PubMed]
- Thabane, L.; Ma, J.; Chu, R.; Cheng, J.; Ismaila, A.; Rios, L.P.; Robson, R.; Thabane, M.; Giangregorio, L.; Godlsmith, C.H. A Tutorial on Pilot Studies: The What, Why and How. BMC Med. Res. Methodol. 2010, 10, 1–10. [Google Scholar] [CrossRef]
- Wang, M.; Ma, H.; Shi, Y.; Ni, H.; Qin, C.; Ji, C. Single-Arm Clinical Trials: Design, Ethics, Principles. BMJ Support. Palliat. Care 2025, 15, 46–54. [Google Scholar] [CrossRef]
- Schork, N.J.; Goetz, L.H. Single-Subject Studies in Translational Nutrition Research. Annu. Rev. Nutr. 2017, 37, 395–422. [Google Scholar] [CrossRef] [PubMed]
- Lupianez-Barbero, A.; Blanco, C.G.; de Leiva Hidalgo, A. Spanish food composition tables and databases: Need for a gold standard for healthcare professionals. Endocrinol. Diabetes Nutr. (Engl. Ed.) 2018, 65, 361–373. [Google Scholar] [CrossRef]
- Weaver, C.M.; Miller, J.W. Challenges in Conducting Clinical Nutrition Research. Nutr. Rev. 2017, 75, 491–499. [Google Scholar] [CrossRef]
- Emanuel, E.J. What Makes Clinical Research Ethical? JAMA 2000, 283, 2701. [Google Scholar] [CrossRef]
- World Medical Association. Declaration of Helsinki. JAMA 2013, 310, 2191. [Google Scholar]
- Leibel, R.L.; Rosenbaum, M.; Hirsch, J. Changes in Energy Expenditure Resulting from Altered Body Weight. N. Engl. J. Med. 1995, 332, 621–628. [Google Scholar] [CrossRef]
- Romero-Corral, A.; Somers, V.K.; Sierra-Johnson, J.; Korenfeld, Y.; Boarin, S.; Korinek, J.; Jensen, M.D.; Parati, G.; Lopez-Jimenez, F. Normal Weight Obesity: A Risk Factor for Cardiometabolic Dysregulation and Cardiovascular Mortality. Eur. Heart J. 2010, 31, 737–746. [Google Scholar] [CrossRef]
- De Lorenzo, A.; Martinoli, R.; Vaia, F.; Di Renzo, L. Normal Weight Obese (NWO) Women: An Evaluation of a Candidate New Syndrome. Nutr. Metab. Cardiovasc. Dis. 2006, 16, 513–523. [Google Scholar] [CrossRef]
- Mohorko, N.; Černelič-Bizjak, M.; Poklar-Vatovec, T.; Grom, G.; Kenig, S.; Petelin, A.; Jenko-Pražnikar, Z. Weight loss, improved physical performance, cognitive function, eating behavior, and metabolic profile in a 12-week ketogenic diet in obese adults. Nutr. Res. 2019, 62, 64–77. [Google Scholar] [CrossRef] [PubMed]
- Ruderman, N.; Chisholm, D.; Pi-Sunyer, X.; Schneider, S. The Metabolically Obese, Normal-Weight Individual Revisited. Diabetes 1998, 47, 699–713. [Google Scholar] [CrossRef]
- Di Bonito, P.; Sanguigno, E.; Forziato, C.; Saitta, F.; Iardino, M.R.; Capaldo, B. Fasting Plasma Glucose and Clustering of Cardiometabolic Risk Factors in Normoglycemic Outpatient Children and Adolescents. Diabetes Care 2011, 34, 1412–1414. [Google Scholar] [CrossRef] [PubMed]
- Choi, J.; Young, T.L.; Chartier, L.B. Recurrent Acute Pancreatitis during a Ketogenic Diet—A Case Report and Literature Review. Int. J. Emerg. Med. 2021, 14, 1–5. [Google Scholar] [CrossRef] [PubMed]
- Shanti, I.; Samardali, M.; Alhusari, L. Acute Pancreatitis Associated with Ketogenic Diet: A Case Report. Cureus 2024, 16, e57547. [Google Scholar] [CrossRef]
- Mistry, S.; Eschler, D.C. Euglycemic Diabetic Ketoacidosis Caused by SGLT2 Inhibitors and a Ketogenic Diet: A Case Series and Review of Literature. AACE Clin. Case Rep. 2021, 7, 17–19. [Google Scholar] [CrossRef]
- Houttu, V.; Grefhorst, A.; Cohn, D.M.; Levels, J.H.M.; Roeters van Lennep, J.; Stroes, E.S.G.; Groen, A.K.; Tromp, T.R. Severe Dyslipidemia Mimicking Familial Hypercholesterolemia Induced by High-Fat, Low-Carbohydrate Diets: A Critical Review. Nutrients 2023, 15, 962. [Google Scholar] [CrossRef]
- Sussman, D.; van Eede, M.; Wong, M.D.; Adamson, S.L.; Henkelman, M. Effects of a Ketogenic Diet during Pregnancy on Embryonic Growth in the Mouse. BMC Pregnancy Childbirth 2013, 13, 109. [Google Scholar] [CrossRef]
- Nnodum, B.N.; Oduah, E.; Albert, D.; Pettus, M. Ketogenic Diet-Induced Severe Ketoacidosis in a Lactating Woman: A Case Report and Review of the Literature. Case Rep. Nephrol. 2019, 2019, 1214208. [Google Scholar]
- Marinescu, S.C.; Apetroaei, M.M.; Nedea, M.I.; Arsene, A.L.; Velescu, B.Ș.; Hîncu, S.; Stancu, E.; Pop, A.L.; Drăgănescu, D.; Udeanu, D.I. Dietary Influence on Drug Efficacy: A Comprehensive Review of Ketogenic Diet–Pharmacotherapy Interactions. Nutrients 2024, 16, 1213. [Google Scholar] [CrossRef]
- Van Cauter, E.; Shapiro, E.T.; Tillil, H.; Polonsky, K.S. Circadian Modulation of Glucose and Insulin Responses to Meals: Relationship to Cortisol Rhythm. Am. J. Physiol. Endocrinol. Metab. 1992, 262, E467–E475. [Google Scholar] [CrossRef] [PubMed]
- Klonek, G.; Zydek, G.; Roczniok, R.; Panek, M.; Zając, A.; Michalczyk, M.M. Effects of a 12-Week Ketogenic Diet Intervention on Obese and Overweight Females with Glucose and Lipid Metabolism Disturbance. Nutrients 2024, 16, 4218. [Google Scholar] [CrossRef] [PubMed]
- Sofer, S.; Eliraz, A.; Kaplan, S.; Voet, H.; Fink, G.; Kima, T.; Madar, Z. Greater Weight Loss and Hormonal Changes after 6 Months Diet with Carbohydrates Eaten Mostly at Dinner. Obesity 2011, 19, 2006–2014. [Google Scholar] [CrossRef]
- Zajac, A.; Poprzecki, S.; Maszczyk, A.; Czuba, M.; Michalczyk, M.; Zydek, G. The Effects of a Ketogenic Diet on Exercise Metabolism and Physical Performance in Off-Road Cyclists. Nutrients 2014, 6, 2493–2508. [Google Scholar] [CrossRef] [PubMed]
- Paoli, A.; Rubini, A.; Volek, J.S.; Grimaldi, K.A. Beyond Weight Loss: A Review of the Therapeutic Uses of Very-Low-Carbohydrate (Ketogenic) Diets. Eur. J. Clin. Nutr. 2013, 67, 789–796. [Google Scholar] [CrossRef]
- Kang, J.; Ratamess, N.A.; Faigenbaum, A.D.; Bush, J.A. Ergogenic Properties of Ketogenic Diets in Normal-Weight Individuals: A Systematic Review. J. Am. Coll. Nutr. 2020, 39, 665–675. [Google Scholar] [CrossRef]
- Stenvers, D.J.; Scheer, F.A.J.L.; Schrauwen, P.; la Fleur, S.E.; Kalsbeek, A. Circadian Clocks and Insulin Resistance. Nat. Rev. Endocrinol. 2019, 15, 75–89. [Google Scholar] [CrossRef]
- Sutton, E.F.; Beyl, R.; Early, K.S.; Cefalu, W.T.; Ravussin, E.; Peterson, C.M. Early Time-Restricted Feeding Improves Insulin Sensitivity, Blood Pressure, and Oxidative Stress Even Without Weight Loss in Men with Prediabetes. Cell Metab. 2018, 27, 1212–1221.e3. [Google Scholar] [CrossRef]
- Anton, S.D.; Moehl, K.; Donahoo, W.T.; Marosi, K.; Lee, S.A.; Mainous, A.G.; Leeuwenburgh, C.; Mattson, M.P. Flipping the Metabolic Switch: Understanding and Applying the Health Benefits of Fasting. Obesity 2018, 26, 254–268. [Google Scholar] [CrossRef]
- Patterson, R.E.; Laughlin, G.A.; LaCroix, A.Z.; Hartman, S.J.; Natarajan, L.; Senger, C.M.; Martínez, M.E.; Villaseñor, A. Intermittent Fasting and Human Metabolic Health. J. Acad. Nutr. Diet. 2015, 115, 1203–1212. [Google Scholar] [CrossRef]
- Huang, Z.; Huang, L.; Waters, M.J.; Chen, C. Insulin and Growth Hormone Balance: Implications for Obesity. Trends Endocrinol. Metab. 2020, 31, 642–654. [Google Scholar] [CrossRef] [PubMed]
- Pell, J.M.; Bates, P.C. The Nutritional Regulation of Growth Hormone Action. Nutr. Res. Rev. 1990, 3, 163–192. [Google Scholar] [CrossRef] [PubMed]
- Kong, Z.; Sun, S.; Shi, Q.; Zhang, H.; Tong, T.K.; Nie, J. Short-Term Ketogenic Diet Improves Abdominal Obesity in Overweight/Obese Chinese Young Females. Front. Physiol. 2020, 11, 856. [Google Scholar] [CrossRef]
- Li, Z.; Heber, D. Ketogenic Diets. JAMA 2020, 323, 386. [Google Scholar] [CrossRef]
- Westman, E.C.; Feinman, R.D.; Mavropoulos, J.C.; Vernon, M.C.; Volek, J.S.; Wortman, J.A.; Yancy, W.S.; Phinney, S.D. Low-Carbohydrate Nutrition and Metabolism. Am. J. Clin. Nutr. 2007, 86, 276–284. [Google Scholar] [CrossRef]
- Boden, G.; Sargrad, K.; Homko, C.; Mozzoli, M.; Stein, T.P. Effect of a Low-Carbohydrate Diet on Appetite, Blood Glucose Levels, and Insulin Resistance in Obese Patients with Type 2 Diabetes. Ann. Intern. Med. 2005, 142, 403. [Google Scholar] [CrossRef]
- Jiang, Z.; Yin, X.; Wang, M.; Chen, T.; Wang, Y.; Gao, Z.; Wang, Z. Effects of Ketogenic Diet on Neuroinflammation in Neurodegenerative Diseases. Aging Dis. 2022, 13, 1146. [Google Scholar] [CrossRef] [PubMed]
- Gasior, M.; Rogawski, M.A.; Hartman, A.L. Neuroprotective and Disease-Modifying Effects of the Ketogenic Diet. Behav. Pharmacol. 2006, 17, 431–439. [Google Scholar] [CrossRef]
- Sawicka-Gutaj, N.; Gruszczyński, D.; Guzik, P.; Mostowska, A.; Walkowiak, J. Publication Ethics of Human Studies in the Light of the Declaration of Helsinki—A Mini-Review. J. Med. Sci. 2022, 91, e700. [Google Scholar] [CrossRef]
- General Data Protection Regulation (GDPR). All legal and ethical standards, including data protection regulations, were strictly followed to ensure confidentiality and anonymity. Off. J. Eur. Union 2016, L119, 1–88. [Google Scholar]
- Cabañas Armesilla, M.D.; Marrodán Serrano, M.D.; Soriano del Castillo, J.M. Manual de Antropometría Aplicada a la Salud para el Certificado de la Sociedad Internacional para la Antropometría Aplicada al Deporte y la Salud (SIAnADS); Universitat de Valencia: Valencia, Spain, 2025. [Google Scholar]
- Diggle, P.J.; Taylor-Robinson, D. Longitudinal Data Analysis. In Handbook of Epidemiology; Springer New York: New York, NY, USA, 2024; pp. 1–34. [Google Scholar]
- Kim, S.Y.; Park, Y.J.; Park, Y.B.; Kim, S.Y.; Park, Y.J.; Park, Y.B. Review on predictors of dropout and weight loss maintenance in weight loss interventions. J. Korean Med. 2016, 37, 62–73. [Google Scholar] [CrossRef]
- Whelton, P.K.; Carey, R.M.; Aronow, W.S.; Casey, D.E.; Collins, K.J.; Himmelfarb, C.D.; DePalma, S.M.; Gidding, S.; Jamerson, K.A.; Jones, D.W.; et al. 2017 ACC/AHA/AAPA/ABC/ACPM/AGS/APhA/ASH/ASPC/NMA/PCNA Guideline for the Prevention, Detection, Evaluation, and Management of High Blood Pressure in Adults: Executive Summary. Hypertension 2018, 71, 1269–1324. [Google Scholar] [CrossRef]
- Cryer, P.E.; Axelrod, L.; Grossman, A.B.; Heller, S.R.; Montori, V.M.; Seaquist, E.R.; Service, F.J. Evaluation and Management of Adult Hypoglycemic Disorders: An Endocrine Society Clinical Practice Guideline. J. Clin. Endocrinol. Metab. 2009, 94, 709–728. [Google Scholar] [CrossRef] [PubMed]
- Kalra, S.; Mukherjee, J.; Venkataraman, S.; Bantwal, G.; Shaikh, S.; Saboo, B.; Das, A.K.; Ramachandran, A. Hypoglycemia: The Neglected Complication. Indian J. Endocrinol. Metab. 2013, 17, 819. [Google Scholar] [CrossRef] [PubMed]
- Morton, R.W.; Murphy, K.T.; McKellar, S.R.; Schoenfeld, B.J.; Henselmans, M.; Helms, E.; Aragon, A.A.; Devries, M.C.; Banfield, L.; Krieger, J.W.; et al. A Systematic Review, Meta-Analysis and Meta-Regression of the Effect of Protein Supplementation on Resistance Training-Induced Gains in Muscle Mass and Strength in Healthy Adults. Br. J. Sports Med. 2018, 52, 376–384. [Google Scholar] [CrossRef]
- Lichtenstein, A.H.; Appel, L.J.; Vadiveloo, M.; Hu, F.B.; Kris-Etherton, P.M.; Rebholz, C.M.; Sacks, F.M.; Thorndike, A.N.; Van Horn, L.; Wylie-Rosett, J. 2021 Dietary Guidance to Improve Cardiovascular Health: A Scientific Statement from the American Heart Association. Circulation 2021, 144, e472–e487. [Google Scholar] [CrossRef]
- Fats and Fatty Acids in Human Nutrition. Report of an Expert Consultation. FAO Food Nutr. Pap. 2010, 91, 1–166.
- Harris, W.S.; Mozaffarian, D.; Rimm, E.; Kris-Etherton, P.; Rudel, L.L.; Appel, L.J.; Engler, M.M.; Sacks, F. Omega-6 Fatty Acids and Risk for Cardiovascular Disease. Circulation 2009, 119, 902–907. [Google Scholar] [CrossRef] [PubMed]
- Wijendran, V.; Hayes, K.C. Dietary n-6 and n-3 Fatty Acid Balance and Cardiovascular Health. Annu. Rev. Nutr. 2004, 24, 597–615. [Google Scholar] [CrossRef]
- Simopoulos, A.P.; DiNicolantonio, J.J. The Importance of a Balanced ω-6 to ω-3 Ratio in the Prevention and Management of Obesity. Open Heart 2016, 3, e000385. [Google Scholar] [CrossRef]
- García, C.G.; Sebastià, N.; Blasco, E.; Soriano, J.M. Dietopro.com: A New Tool for Dietotherapeutical Management Based on Cloud Computing Technology. Nutr. Hosp. 2014, 30, 678–685. [Google Scholar] [PubMed]
- Harris, J.A.; Benedict, F.G. A Biometric Study of Human Basal Metabolism. Proc. Natl. Acad. Sci. USA 1918, 4, 370–373. [Google Scholar] [CrossRef]
- Ainsworth, B.E.; Haskell, W.L.; Whitt, M.C.; Irwin, M.L.; Swartz, A.M.; Strath, S.J.; O’Brien, W.L.; Bassett, D.R.; Schmitz, K.H.; Emplaincourt, P.O.; et al. Compendium of Physical Activities: An Update of Activity Codes and MET Intensities. Med. Sci. Sports Exerc. 2000, 32, S498–S516. [Google Scholar] [CrossRef]
- Rosenbaum, M.; Hirsch, J.; Gallagher, D.A.; Leibel, R.L. Long-Term Persistence of Adaptive Thermogenesis in Subjects Who Have Maintained a Reduced Body Weight. Am. J. Clin. Nutr. 2008, 88, 906–912. [Google Scholar] [CrossRef]
- Westerterp, K.R. Diet Induced Thermogenesis. Nutr. Metab. 2004, 1, 5. [Google Scholar] [CrossRef] [PubMed]
- Paddon-Jones, D.; Westman, E.; Mattes, R.D.; Wolfe, R.R.; Astrup, A.; Westerterp-Plantenga, M. Protein, Weight Management, and Satiety. Am. J. Clin. Nutr. 2008, 87, 1558S–1561S. [Google Scholar] [CrossRef] [PubMed]
- Müller, M.J.; Bosy-Westphal, A.; Kutzner, D.; Heller, M. Metabolically Active Components of Fat-Free Mass and Resting Energy Expenditure in Humans: Recent Lessons from Imaging Technologies. Obes. Rev. 2002, 3, 113–122. [Google Scholar] [CrossRef]
- Madden, A.M.; Mulrooney, H.M.; Shah, S. Estimation of Energy Expenditure Using Prediction Equations in Overweight and Obese Adults: A Systematic Review. J. Hum. Nutr. Diet. 2016, 29, 458–476. [Google Scholar] [CrossRef]
- Frankenfield, D.; Roth-Yousey, L.; Compher, C. Comparison of Predictive Equations for Resting Metabolic Rate in Healthy Nonobese and Obese Adults: A Systematic Review. J. Am. Diet. Assoc. 2005, 105, 775–789. [Google Scholar] [CrossRef]
- Keesey, R.E.; Hirvonen, M.D. Body Weight Set-Points: Determination and Adjustment. J. Nutr. 1997, 127, 1875S–1883S. [Google Scholar] [CrossRef]
- Weigle, D.S.; Breen, P.A.; Matthys, C.C.; Callahan, H.S.; Meeuws, K.E.; Burden, V.R.; Purnell, J.Q. A High-Protein Diet Induces Sustained Reductions in Appetite, Ad Libitum Caloric Intake, and Body Weight Despite Compensatory Changes in Diurnal Plasma Leptin and Ghrelin Concentrations. Am. J. Clin. Nutr. 2005, 82, 41–48. [Google Scholar] [CrossRef]
- Byrne, N.M.; Sainsbury, A.; King, N.A.; Hills, A.P.; Wood, R.E. Intermittent Energy Restriction Improves Weight Loss Efficiency in Obese Men: The MATADOR Study. Int. J. Obes. 2018, 42, 129–138. [Google Scholar] [CrossRef]
- Roekenes, J.; Martins, C. Ketogenic diets and appetite regulation. Curr. Opin. Clin. Nutr. Metab. Care 2021, 24, 359–363. [Google Scholar] [CrossRef]
- Westman, E.C.; Yancy, W.S.; Edman, J.S.; Tomlin, K.F.; Perkins, C.E. Effect of 6-Month Adherence to a Very Low Carbohydrate Diet Program. Am. J. Med. 2002, 113, 30–36. [Google Scholar] [CrossRef] [PubMed]
- Yancy, W.S.; Olsen, M.K.; Guyton, J.R.; Bakst, R.P.; Westman, E.C. A Low-Carbohydrate, Ketogenic Diet versus a Low-Fat Diet to Treat Obesity and Hyperlipidemia. Ann. Intern. Med. 2004, 140, 769–777. [Google Scholar] [CrossRef] [PubMed]
- Archer, E.; Hand, G.A.; Blair, S.N. Validity of U.S. Nutritional Surveillance: National Health and Nutrition Examination Survey Caloric Energy Intake Data, 1971–2010. PLoS ONE 2013, 8, e76632. [Google Scholar] [CrossRef] [PubMed]
- Taboulet, P.; Deconinck, N.; Thurel, A.; Haas, L.; Manamani, J.; Porcher, R.; Schmit, C.; Fontaine, J.-P.; Gautier, J.-F. Correlation between Urine Ketones (Acetoacetate) and Capillary Blood Ketones (3-Beta-Hydroxybutyrate) in Hyperglycaemic Patients. Diabetes Metab. 2007, 33, 135–139. [Google Scholar] [CrossRef]
- Kreitzman, S.; Coxon, A.; Szaz, K. Glycogen Storage: Illusions of Easy Weight Loss, Excessive Weight Regain, and Distortions in Estimates of Body Composition. Am. J. Clin. Nutr. 1992, 56, 292S–293S. [Google Scholar] [CrossRef]
- Androutsos, O.; Gerasimidis, K.; Karanikolou, A.; Reilly, J.J.; Edwards, C.A. Impact of Eating and Drinking on Body Composition Measurements by Bioelectrical Impedance. J. Hum. Nutr. Diet. 2015, 28, 165–171. [Google Scholar] [CrossRef]
- Dixon, C.B.; LoVallo, S.J.; Andreacci, J.L.; Goss, F.L. The Effect of Acute Fluid Consumption on Measures of Impedance and Percent Body Fat Using Leg-to-Leg Bioelectrical Impedance Analysis. Eur. J. Clin. Nutr. 2006, 60, 142–146. [Google Scholar] [CrossRef]
- Westman, E.C.; Yancy, W.S.; Mavropoulos, J.C.; Marquart, M.; McDuffie, J.R. The Effect of a Low-Carbohydrate, Ketogenic Diet versus a Low-Glycemic Index Diet on Glycemic Control in Type 2 Diabetes Mellitus. Nutr. Metab. 2008, 5, 36. [Google Scholar] [CrossRef] [PubMed]
- Simopoulos, A.P. The Importance of the Ratio of Omega-6/Omega-3 Essential Fatty Acids. Biomed. Pharmacother. 2002, 56, 365–379. [Google Scholar] [CrossRef] [PubMed]
- Stewart, W.K.; Fleming, L.W. Features of a Successful Therapeutic Fast of 382 Days’ Duration. Postgrad. Med. J. 1973, 49, 203–209. [Google Scholar] [CrossRef]
- Ashtary-Larky, D.; Bagheri, R.; Bavi, H.; Baker, J.S.; Moro, T.; Mancin, L.; Paoli, A. Ketogenic Diets, Physical Activity and Body Composition: A Review. Br. J. Nutr. 2022, 127, 1898–1920. [Google Scholar] [CrossRef] [PubMed]
- Ahmad, Y.; Seo, D.S.; Jang, Y. Metabolic Effects of Ketogenic Diets: Exploring Whole-Body Metabolism in Connection with Adipose Tissue and Other Metabolic Organs. Int. J. Mol. Sci. 2024, 25, 7076. [Google Scholar] [CrossRef]
- Nordmann, A.J.; Nordmann, A.; Briel, M.; Keller, U.; Yancy, W.S.; Brehm, B.J.; Bucher, H.C. Effects of Low-Carbohydrate vs. Low-Fat Diets on Weight Loss and Cardiovascular Risk Factors. Arch. Intern. Med. 2006, 166, 285. [Google Scholar] [CrossRef]
- Vargas-Molina, S.; Petro, J.L.; Romance, R.; Kreider, R.B.; Schoenfeld, B.J.; Bonilla, D.A.; Benítez-Porres, J. Effects of a Ketogenic Diet on Body Composition and Strength in Trained Women. J. Int. Soc. Sports Nutr. 2020, 17, 1–10. [Google Scholar] [CrossRef]
- Cai, H.; Zhang, J.; Liu, C.; Le, T.N.; Lu, Y.; Feng, F.; Zhao, M. High-Fat Diet-Induced Decreased Circulating Bile Acids Contribute to Obesity Associated with Gut Microbiota in Mice. Foods 2024, 13, 699. [Google Scholar] [CrossRef]
- Burén, J.; Svensson, M.; Liv, P.; Sjödin, A. Effects of a Ketogenic Diet on Body Composition in Healthy, Young, Normal-Weight Women: A Randomized Controlled Feeding Trial. Nutrients 2024, 16, 2030. [Google Scholar] [CrossRef]
- Gomez-Arbelaez, D.; Crujeiras, A.B.; Castro, A.I.; Martinez-Olmos, M.A.; Canton, A.; Ordoñez-Mayan, L.; Sajoux, I.; Galban, C.; Bellido, D.; Casanueva, F.F. Resting Metabolic Rate of Obese Patients Under Very Low Calorie Ketogenic Diet. Nutr. Metab. 2018, 15, 18. [Google Scholar] [CrossRef]
- Paoli, A.; Bianco, A.; Moro, T.; Mota, J.F.; Coelho-Ravagnani, C.F. The Effects of Ketogenic Diet on Insulin Sensitivity and Weight Loss, Which Came First: The Chicken or the Egg? Nutrients 2023, 15, 3120. [Google Scholar] [CrossRef] [PubMed]
- Basolo, A.; Magno, S.; Santini, F.; Ceccarini, G. Ketogenic Diet and Weight Loss: Is There an Effect on Energy Expenditure? Nutrients 2022, 14, 1814. [Google Scholar] [CrossRef] [PubMed]
- Li, X.; Zhang, D.; Vatner, D.F.; Goedeke, L.; Hirabara, S.M.; Zhang, Y.; Perry, R.J.; Scgulman, G.J. Mechanisms by Which Adiponectin Reverses High Fat Diet-Induced Insulin Resistance in Mice. Proc. Natl. Acad. Sci. USA 2020, 117, 32584–32593. [Google Scholar] [CrossRef] [PubMed]
- Olsson, K.; Saltin, B. Variation in Total Body Water with Muscle Glycogen Changes in Man. Acta Physiol. Scand. 1970, 80, 11–18. [Google Scholar] [CrossRef]
- Evans, M.; Cogan, K.E.; Egan, B. Metabolism of Ketone Bodies During Exercise and Training: Physiological Basis for Exogenous Supplementation. J. Physiol. 2017, 595, 2857–2871. [Google Scholar] [CrossRef]
- Bertoli, S.; Trentani, C.; Ferraris, C.; De Giorgis, V.; Veggiotti, P.; Tagliabue, A. Long-Term Effects of a Ketogenic Diet on Body Composition and Bone Mineralization in GLUT-1 Deficiency Syndrome: A Case Series. Nutrition 2014, 30, 726–728. [Google Scholar] [CrossRef]
- Pot, G.K.; Battjes-Fries, M.C.; Patijn, O.N.; Pijl, H.; Witkamp, R.F.; de Visser, M.; van der Zijl, N.; de Vries, M.; Voshol, P.J. Nutrition and Lifestyle Intervention in Type 2 Diabetes: Pilot Study in the Netherlands Showing Improved Glucose Control and Reduction in Glucose Lowering Medication. BMJ Nutr. Prev. Health 2019, 2, 43–50. [Google Scholar] [CrossRef]
- Wing, R.R.; Jeffery, R.W. Benefits of Recruiting Participants with Friends and Increasing Social Support for Weight Loss and Maintenance. J. Consult. Clin. Psychol. 1999, 67, 132–138. [Google Scholar] [CrossRef]
- Gilhooly, C.H.; Das, S.K.; Golden, J.K.; McCrory, M.A.; Dallal, G.E.; Saltzman, E.; Kramer, F.M.; Roberts, S.B. Food Cravings and Energy Regulation: The Characteristics of Craved Foods and Their Relationship with Eating Behaviors and Weight Change During 6 Months of Dietary Energy Restriction. Int. J. Obes. 2007, 31, 1849–1858. [Google Scholar] [CrossRef]
- Dalle Grave, R.; Calugi, S.; Centis, E.; El Ghoch, M.; Marchesini, G. Cognitive-Behavioral Strategies to Increase the Adherence to Exercise in the Management of Obesity. J. Obes. 2011, 2011, 348293. [Google Scholar] [CrossRef]
- Galgani, J.E.; Moro, C.; Ravussin, E. Metabolic Flexibility and Insulin Resistance. Am. J. Physiol. Endocrinol. Metab. 2008, 295, E1009–E1017. [Google Scholar] [CrossRef]
- Marentes-Castillo, M.; Castillo, I.; Tomás, I.; Álvarez, O. Towards a Healthy Diet in an Adolescent Population: The Mediating Role of Motivation and Perceived Barriers Between Self-Efficacy and Weight Regulation. Healthcare 2024, 12, 1454. [Google Scholar] [CrossRef]
- Hashim, S.A.; VanItallie, T.B. Ketone Body Therapy: From the Ketogenic Diet to the Oral Administration of Ketone Ester. J. Lipid Res. 2014, 55, 1818–1826. [Google Scholar] [CrossRef]
- Johns, D.J.; Hartmann-Boyce, J.; Jebb, S.A.; Aveyard, P. Diet or Exercise Interventions vs. Combined Behavioral Weight Management Programs: A Systematic Review and Meta-Analysis of Direct Comparisons. J. Acad. Nutr. Diet. 2014, 114, 1557–1568. [Google Scholar] [CrossRef] [PubMed]
- Burke, L.E.; Wang, J.; Sevick, M.A. Self-Monitoring in Weight Loss: A Systematic Review of the Literature. J. Am. Diet. Assoc. 2011, 111, 92–102. [Google Scholar] [CrossRef] [PubMed]
- Bostock, E.C.S.; Kirkby, K.C.; Taylor, B.V.; Hawrelak, J.A. Consumer Reports of “Keto Flu” Associated With the Ketogenic Diet. Front. Nutr. 2020, 7, 20. [Google Scholar] [CrossRef] [PubMed]
- Hall, K.D.; Chen, K.Y.; Guo, J.; Lam, Y.Y.; Leibel, R.L.; Mayer, L.E.; Reitman, M.L.; Rosenbaum, M.; Smith, S.R.; Walsh, B.T.; et al. Energy Expenditure and Body Composition Changes After an Isocaloric Ketogenic Diet in Overweight and Obese Men. Am. J. Clin. Nutr. 2016, 104, 324–333. [Google Scholar] [CrossRef]
- Palmblad, J.; Levi, L.; Burger, A.; Melander, A.; Westgren, U.; von Schenck, H.; Skude, G. Effects of Total Energy Withdrawal (Fasting) on the Levels of Growth Hormone, Thyrotropin, Cortisol, Adrenaline, Noradrenaline, T4, T3, and rT3 in Healthy Males. Acta Med. Scand. 1977, 201, 15–22. [Google Scholar] [CrossRef]
- Veldhorst, M.A.; Westerterp-Plantenga, M.S.; Westerterp, K.R. Gluconeogenesis and Energy Expenditure After a High-Protein, Carbohydrate-Free Diet. Am. J. Clin. Nutr. 2009, 90, 519–526. [Google Scholar] [CrossRef]
- Manninen, A.H. Very-Low-Carbohydrate Diets and Preservation of Muscle Mass. Nutr. Metab. 2006, 3, 9. [Google Scholar] [CrossRef]
- Greaves, C.J.; Sheppard, K.E.; Abraham, C.; Hardeman, W.; Roden, M.; Evans, P.H.; Schwarz, P.; The IMAGE Study Group. Systematic Review of Reviews of Intervention Components Associated with Increased Effectiveness in Dietary and Physical Activity Interventions. BMC Public Health 2011, 11, 119. [Google Scholar] [CrossRef] [PubMed]
- Teixeira, P.J.; Carraça, E.V.; Marques, M.M.; Rutter, H.; Oppert, J.M.; De Bourdeaudhuij, I.; Lakerveld, J.; Brug, J. Successful Behavior Change in Obesity Interventions in Adults: A Systematic Review of Self-Regulation Mediators. BMC Med. 2015, 13, 84. [Google Scholar] [CrossRef]
- LaFountain, R.A.; Miller, V.J.; Barnhart, E.C.; Hyde, P.N.; Crabtree, C.D.; McSwiney, F.T.; Beeler, M.K.; Buga, A.; Sapper, T.N.; Short, A.A.; et al. Extended Ketogenic Diet and Physical Training Intervention in Military Personnel. Mil. Med. 2019, 184, e538–e547. [Google Scholar] [CrossRef]
- Carter, M.C.; Burley, V.J.; Nykjaer, C.; Cade, J.E. Adherence to a Smartphone Application for Weight Loss Compared to Website and Paper Diary: Pilot Randomized Controlled Trial. J. Med. Internet Res. 2013, 15, e32. [Google Scholar] [CrossRef] [PubMed]
- Gudzune, K.A.; Doshi, R.S.; Mehta, A.K.; Chaudhry, Z.W.; Jacobs, D.K.; Vakil, R.M.; Lee, C.J.; Bleich, S.N.; Clark, J.M. Efficacy of Commercial Weight-Loss Programs. Ann. Intern. Med. 2015, 162, 501–512. [Google Scholar] [CrossRef] [PubMed]
- Hu, T.; Bazzano, L.A. The Low-Carbohydrate Diet and Cardiovascular Risk Factors: Evidence from Epidemiologic Studies. Nutr. Metab. Cardiovasc. Dis. 2014, 24, 337–343. [Google Scholar] [CrossRef]
- Hall, K.D.; Bemis, T.; Brychta, R.; Chen, K.Y.; Courville, A.; Crayner, E.J.; Goodwin, S.; Guo, J.; Howard, L.; Knuth, N.D.; et al. Calorie for Calorie, Dietary Fat Restriction Results in More Body Fat Loss than Carbohydrate Restriction in People with Obesity. Cell Metab. 2015, 22, 427–436. [Google Scholar] [CrossRef]
- Goodpaster, B.H.; Sparks, L.M. Metabolic Flexibility in Health and Disease. Cell Metab. 2017, 25, 1027–1036. [Google Scholar] [CrossRef]
- Applewhite, B.; Penninx, B.W.; Young, A.H.; Schmidt, U.; Himmerich, H.; Keeler, J.L. The Effect of a Low-Calorie Diet on Depressive Symptoms in Individuals with Overweight or Obesity: A Systematic Review and Meta-Analysis of Interventional Studies. Psychol. Med. 2024, 54, 1671–1683. [Google Scholar] [CrossRef]
- Patsalos, O.; Keeler, J.; Schmidt, U.; Penninx, B.W.J.H.; Young, A.H.; Himmerich, H. Diet, Obesity, and Depression: A Systematic Review. J. Pers. Med. 2021, 11, 176. [Google Scholar] [CrossRef]
- Linardon, J.; Wade, T.D.; de la Piedad Garcia, X.; Brennan, L. The Efficacy of Cognitive-Behavioral Therapy for Eating Disorders: A Systematic Review and Meta-Analysis. J. Consult. Clin. Psychol. 2017, 85, 1080–1094. [Google Scholar] [CrossRef] [PubMed]
- Heo, Y.A.; Duggan, S.T. Lisdexamfetamine: A Review in Binge Eating Disorder. CNS Drugs 2017, 31, 1015–1022. [Google Scholar] [CrossRef] [PubMed]
- Arbaizar, B.; Gómez-Acebo, I.; Llorca, J. Efficacy of Topiramate in Bulimia Nervosa and Binge-Eating Disorder: A Systematic Review. Gen. Hosp. Psychiatry 2008, 30, 471–475. [Google Scholar] [CrossRef]
- Popoviciu, M.S.; Păduraru, L.; Yahya, G.; Metwally, K.; Cavalu, S. Emerging Role of GLP-1 Agonists in Obesity: A Comprehensive Review of Randomised Controlled Trials. Int. J. Mol. Sci. 2023, 24, 10449. [Google Scholar] [CrossRef] [PubMed]
- Jastreboff, A.M.; Aronne, L.J.; Ahmad, N.N.; Wharton, S.; Connery, L.; Alves, B.; Kiyosue, A.; Zhang, S.; Liu, B.; Bunck, M.C.; et al. Tirzepatide Once Weekly for the Treatment of Obesity. N. Engl. J. Med. 2022, 387, 205–216. [Google Scholar] [CrossRef]
- Tarnopolsky, M.A.; Atkinson, S.A.; MacDougall, J.D.; Chesley, A.; Phillips, S.; Schwarcz, H.P. Evaluation of Protein Requirements for Trained Strength Athletes. J. Appl. Physiol. 1992, 73, 1986–1995. [Google Scholar] [CrossRef]
- Mavropoulos, J.C.; Yancy, W.S.; Hepburn, J.; Westman, E.C. The Effects of a Low-Carbohydrate, Ketogenic Diet on the Polycystic Ovary Syndrome: A Pilot Study. Nutr. Metab. 2005, 2, 35. [Google Scholar] [CrossRef]
- Wadden, T.A.; Butryn, M.L.; Wilson, C. Lifestyle Modification for the Management of Obesity. Gastroenterology 2007, 132, 2226–2238. [Google Scholar] [CrossRef]
- Gibson, A.A.; Seimon, R.V.; Lee, C.M.Y.; Ayre, J.; Franklin, J.; Markovic, T.P.; Caterson, I.D.; Sainsbury, A. Do Ketogenic Diets Really Suppress Appetite? A Systematic Review and Meta-Analysis. Obes. Rev. 2015, 16, 64–76. [Google Scholar] [CrossRef]
- Dansinger, M.L.; Gleason, J.A.; Griffith, J.L.; Selker, H.P.; Schaefer, E.J. Comparison of the Atkins, Ornish, Weight Watchers, and Zone Diets for Weight Loss and Heart Disease Risk Reduction. JAMA 2005, 293, 43. [Google Scholar] [CrossRef]
- Herman, C.P.; Polivy, J. External Cues in the Control of Food Intake in Humans: The Sensory-Normative Distinction. Physiol. Behav. 2008, 94, 722–728. [Google Scholar] [CrossRef] [PubMed]
- Urbain, P.; Bertz, H. Monitoring for Compliance with a Ketogenic Diet: What Is the Best Time of Day to Test for Urinary Ketosis? Nutr. Metab. 2016, 13, 77. [Google Scholar] [CrossRef]
- Moroshko, I.; Brennan, L.; O’Brien, P. Predictors of Dropout in Weight Loss Interventions: A Systematic Review of the Literature. Obes. Rev. 2011, 12, 912–934. [Google Scholar] [CrossRef]
- Elfhag, K.; Rössner, S. Who Succeeds in Maintaining Weight Loss? A Conceptual Review of Factors Associated with Weight Loss Maintenance and Weight Regain. Obes. Rev. 2005, 6, 67–85. [Google Scholar] [CrossRef] [PubMed]
- Brehm, B.J.; Seeley, R.J.; Daniels, S.R.; D’Alessio, D.A. A Randomized Trial Comparing a Very Low Carbohydrate Diet and a Calorie-Restricted Low Fat Diet on Body Weight and Cardiovascular Risk Factors in Healthy Women. J. Clin. Endocrinol. Metab. 2003, 88, 1617–1623. [Google Scholar] [CrossRef]
- Aaseth, J.; Ellefsen, S.; Alehagen, U.; Sundfør, T.M.; Alexander, J. Diets and drugs for weight loss and health in obesity–An update. Biomed. Pharmacother. 2021, 140, 111789. [Google Scholar] [CrossRef]
- Johnston, B.C.; Kanters, S.; Bandayrel, K.; Wu, P.; Naji, F.; Siemieniuk, R.A.; Ball, G.D.C.; Busse, J.W.; Throlund, K.; Guyatt, G.; et al. Comparison of Weight Loss Among Named Diet Programs in Overweight and Obese Adults. JAMA 2014, 312, 923. [Google Scholar] [CrossRef]
- Volek, J.S.; Phinney, S.D.; Forsythe, C.E.; Quann, E.E.; Wood, R.J.; Puglisi, M.J.; Kraemer, W.J.; Bibus, D.M.; Fernandez, M.L.; Feinman, R.D. Carbohydrate Restriction Has a More Favorable Impact on the Metabolic Syndrome Than a Low Fat Diet. Lipids 2009, 44, 297–309. [Google Scholar] [CrossRef] [PubMed]
- Kose, J.; Duquenne, P.; Robert, M.; Debras, C.; Galan, P.; Péneau, S.; Hercberg, S.; Touvier, M.; Andreeva, V.A. Associations of Overall and Specific Carbohydrate Intake with Anxiety Status Evolution in the Prospective NutriNet-Santé Cohort. Sci. Rep. 2022, 12, 21647. [Google Scholar] [CrossRef]
- Wei, N.L.; Quan, Z.F.; Zhao, T.; Yu, X.-D.; Xie, Q.; Zeng, J.; Ma, F.-K.; Wang, F.; Tang, Q.-S.; Wu, H.; et al. Chronic Stress Increases Susceptibility to Food Addiction by Increasing the Levels of DR2 and MOR in the Nucleus Accumbens. Neuropsychiatr. Dis. Treat. 2019, 15, 1211–1229. [Google Scholar] [CrossRef]
- Włodarczyk, A.; Cubała, W.J.; Wielewicka, A. Ketogenic Diet: A Dietary Modification as an Anxiolytic Approach? Nutrients 2020, 12, 3822. [Google Scholar] [CrossRef] [PubMed]
- Dietch, D.M.; Kerr-Gaffney, J.; Hockey, M.; Marx, W.; Ruusunen, A.; Young, A.H.; Berk, M.; Mondelli, V. Efficacy of Low Carbohydrate and Ketogenic Diets in Treating Mood and Anxiety Disorders: Systematic Review. BJPsych Open 2023, 9, e70. [Google Scholar] [CrossRef] [PubMed]
- Woelber, J.P.; Tennert, C.; Ernst, S.F.; Vach, K.; Ratka-Krüger, P.; Bertz, H.; Urbain, P. Effects of a Non-Energy-Restricted Ketogenic Diet on Clinical Oral Parameters. An Exploratory Pilot Trial. Nutrients 2021, 13, 4229. [Google Scholar] [CrossRef]
- Brinkworth, G.D.; Noakes, M.; Buckley, J.D.; Keogh, J.B.; Clifton, P.M. Long-Term Effects of a Very-Low-Carbohydrate Weight Loss Diet Compared with an Isocaloric Low-Fat Diet After 12 Months. Am. J. Clin. Nutr. 2009, 90, 23–32. [Google Scholar] [CrossRef]
- McKenzie, A.L.; Hallberg, S.J.; Creighton, B.C.; Volk, B.M.; Link, T.M.; Abner, M.K.; Glon, R.M.; McCarter, J.P.; Volek, J.S.; Phinney, S.D. A Novel Intervention Including Individualized Nutritional Recommendations Reduces Hemoglobin A1c Level, Medication Use, and Weight in Type 2 Diabetes. JMIR Diabetes 2017, 2, e5. [Google Scholar] [CrossRef]
- Fothergill, E.; Guo, J.; Howard, L.; Kerns, J.C.; Knuth, N.D.; Brychta, R.; Chen, K.Y.; Skarulis, M.C.; Walter, M.; Walter, P.J.; et al. Persistent Metabolic Adaptation Six Years After “The Biggest Loser” Competition. Obesity 2016, 24, 1612–1619. [Google Scholar] [CrossRef] [PubMed]
- Müller, M.J.; Bosy-Westphal, A.; Heymsfield, S.B. Is There Evidence for a Set Point That Regulates Human Body Weight? F1000 Med. Rep. 2010, 2, 59. [Google Scholar] [CrossRef]
- Kolivas, D.; Fraser, L.; Schweitzer, R.; Brukner, P.; Moschonis, G. Effectiveness of a Digitally Delivered Continuous Care Intervention (Defeat Diabetes) on Type 2 Diabetes Outcomes: A 12-Month Single-Arm, Pre–Post Intervention Study. Nutrients 2023, 15, 2153. [Google Scholar] [CrossRef]
- Bland, J.M.; Altman, D.G. Statistics Notes: Some Examples of Regression Towards the Mean. BMJ 1994, 309, 780. [Google Scholar] [CrossRef]
- Ho, P.M.; Peterson, P.N.; Masoudi, F.A. Evaluating the Evidence. Circulation 2008, 118, 1675–1684. [Google Scholar] [CrossRef]
- Eldridge, S.M.; Chan, C.L.; Campbell, M.J.; Bond, C.M.; Hopewell, S.; Thabane, L.; Lancaster, G.A. CONSORT 2010 Statement: Extension to Randomised Pilot and Feasibility Trials. BMJ 2016, 355, i5239. [Google Scholar] [CrossRef] [PubMed]


| Protocol Component | Description | Criteria/Thresholds | Reference(s) |
|---|---|---|---|
| Calculation of basal metabolic rate (BMR) | BMR was calculated using the Harris–Benedict equation. For men: BMR = (10 × weight [kg]) + (6.25 × height [cm]) − (5 × age [years]) + 5; for women: BMR = (10 × weight [kg]) + (6.25 × height [cm]) − (5 × age [years]) − 161. | N/A | [65,66,72] |
| Total energy expenditure (TEE) | TEE was estimated by multiplying BMR by an activity factor based on self-reported physical activity: 1.2 (sedentary), 1.375 (lightly active), or 1.55 (moderately active). | TEE = BMR × activity factor | [66,72] |
| Weight adjustment point determination | The ‘weight adjustment point’ is defined as the stage at which a participant’s weight stabilizes under constant caloric intake, with concurrent confirmation of ketosis via blood and urine measurements. | Weight variation <1% over 2 consecutive weeks; blood ketones: 0.6–3.0 mmol/L; urine ketones: 0.5–3.0 mmol/L | [19,73] |
| Dynamic adjustments to energy prescription | In cases where a plateau in weight loss is observed, menus were adjusted dynamically by reducing daily calories by a maximum of 200 kcal or by increasing protein intake to approximately 1.62 g/kg/day to optimize thermogenesis and satiety. | Maximum reduction: 200 kcal; protein intake: ~1.62 g/kg/day | [69,70,71,72,73,74] |
| Adherence monitoring | Adherence was monitored through biweekly blood ketone measurements using a Gluco-Men® device (A. Menarini Diagnostics, Florence, Italy) and weekly urine ketone testing via Ketostix® (Bayer AG, Leverkusen, Germany). In addition, participants reported their weight 1–2 times per week. | Blood ketones: 0.6–3.0 mmol/L; urine ketone color scale corresponding to 0.5–3.0 mmol/L; consistent weekly weight reports required | – |
| Variable | Time Point | Total n | Mean ± Standard Deviation |
|---|---|---|---|
| Age (years) | M1 | 491 | 47 ± 11 |
| Height (cm) | M1 | 491 | 165 ± 10 |
| Weight (kg) | M1 | 491 | 93.0 ± 19.2 |
| M3 | 487 | 80.3 ± 17.6 | |
| M6 | 115 | 80.3 ± 17.3 | |
| M9 | 41 | 85.3 ± 16.1 | |
| BMI (kg/m2) | M1 | 491 | 34.3 ± 6.3 |
| M3 | 487 | 29.6 ± 5.8 | |
| M6 | 115 | 29.6 ± 5.5 | |
| M9 | 41 | 30.9 ± 4.4 | |
| Total body water (L) | M1 | 491 | 38.7 ± 8.4 |
| M3 | 487 | 36.9 ± 8.0 | |
| M6 | 115 | 36.9 ± 7.8 | |
| M9 | 41 | 38.5 ± 8.6 | |
| Skeletal muscle mass (kg) | M1 | 491 | 29.3 ± 6.9 |
| M3 | 487 | 27.8 ± 6.6 | |
| M6 | 115 | 27.7 ± 6.4 | |
| M9 | 41 | 28.9 ± 7.0 | |
| Fat mass (kg) | M1 | 491 | 40.3 ± 12.4 |
| M3 | 487 | 30.1 ± 12.0 | |
| M6 | 115 | 30.0 ± 11.0 | |
| M9 | 41 | 32.7 ± 9.5 | |
| % Fat mass (%) | M1 | 491 | 43.0 ± 7.3 |
| M3 | 487 | 36.7 ± 9.1 | |
| M6 | 115 | 36.6 ± 8.0 | |
| M9 | 41 | 38.2 ± 7.8 | |
| Fat free mass (kg) | M1 | 491 | 52.7 ± 11.4 |
| M3 | 487 | 50.3 ± 10.9 | |
| M6 | 115 | 52.2 ± 11.4 | |
| M9 | 41 | 53.7 ± 12.8 |
| Variable | Time Point | Total n | ANOVA (p-Value) | Rate of Change * | % Change * | Effect Size (Cohen’s d) | Coefficient of Variation (%) |
|---|---|---|---|---|---|---|---|
| Weight (kg) | M1 | 491 | 20.7 | ||||
| M3 | 487 | <0.001 | −12.7 kg | −13.6 | 0.7 | 21.8 | |
| M6 | 115 | −0.0 kg | −0.0 | 0.0 | 21.5 | ||
| M9 | 41 | +4.9 kg | +6.1 | −0.3 | 18.9 | ||
| BMI (kg/m2) | M1 | 491 | 18.4 | ||||
| M3 | 487 | <0.001 | −4.7 kg/m2 | −13.7 | 0.7 | 19.6 | |
| M6 | 115 | −0.0 kg/m2 | −0.1 | 0.0 | 18.4 | ||
| M9 | 41 | +1.4 kg/m2 | +4.6 | −0.2 | 14.2 | ||
| Total body water (L) | M1 | 491 | 21.8 | ||||
| M3 | 487 | <0.001 | −1.8 L | −4.7 | 0.2 | 21.8 | |
| M6 | 115 | +0.0 L | +0.1 | −0.0 | 31.2 | ||
| M9 | 41 | +1.6 L | +4.3 | −0.2 | 22.4 | ||
| Skeletal muscle mass (kg) | M1 | 491 | 23.6 | ||||
| M3 | 487 | <0.001 | −1.6 kg | −5.3 | 0.2 | 23.8 | |
| M6 | 115 | −0.1 kg | −0.2 | 0.0 | 23.2 | ||
| M9 | 41 | +1.3 kg | +4.5 | −0.2 | 24.2 | ||
| Fat mass (kg) | M1 | 491 | 30.6 | ||||
| M3 | 487 | <0.001 | −10.3 kg | −25.4 | 0.8 | 39.9 | |
| M6 | 115 | −0.1 kg | −0.3 | 0.0 | 36.7 | ||
| M9 | 41 | +2.7 kg | +9.1 | −0.3 | 29.1 | ||
| Fat mass (%) | M1 | 491 | 17.1 | ||||
| M3 | 487 | <0.001 | −6.3% | −14.6 | 0.8 | 24.9 | |
| M6 | 115 | −0.1% | −0.2 | 0 | 21.9 | ||
| M9 | 41 | +1.5% | +4.2 | −0.2 | 20.3 | ||
| Fat free mass (kg) | M1 | 491 | 21.7 | ||||
| M3 | 487 | <0.001 | −2.4 kg | −4.6 | 0.2 | 21.7 | |
| M6 | 115 | +1.9 kg | +3.9 | −0.2 | 21.7 | ||
| M9 | 41 | +1.5 kg | +2.8 | −0.1 | 23.8 |
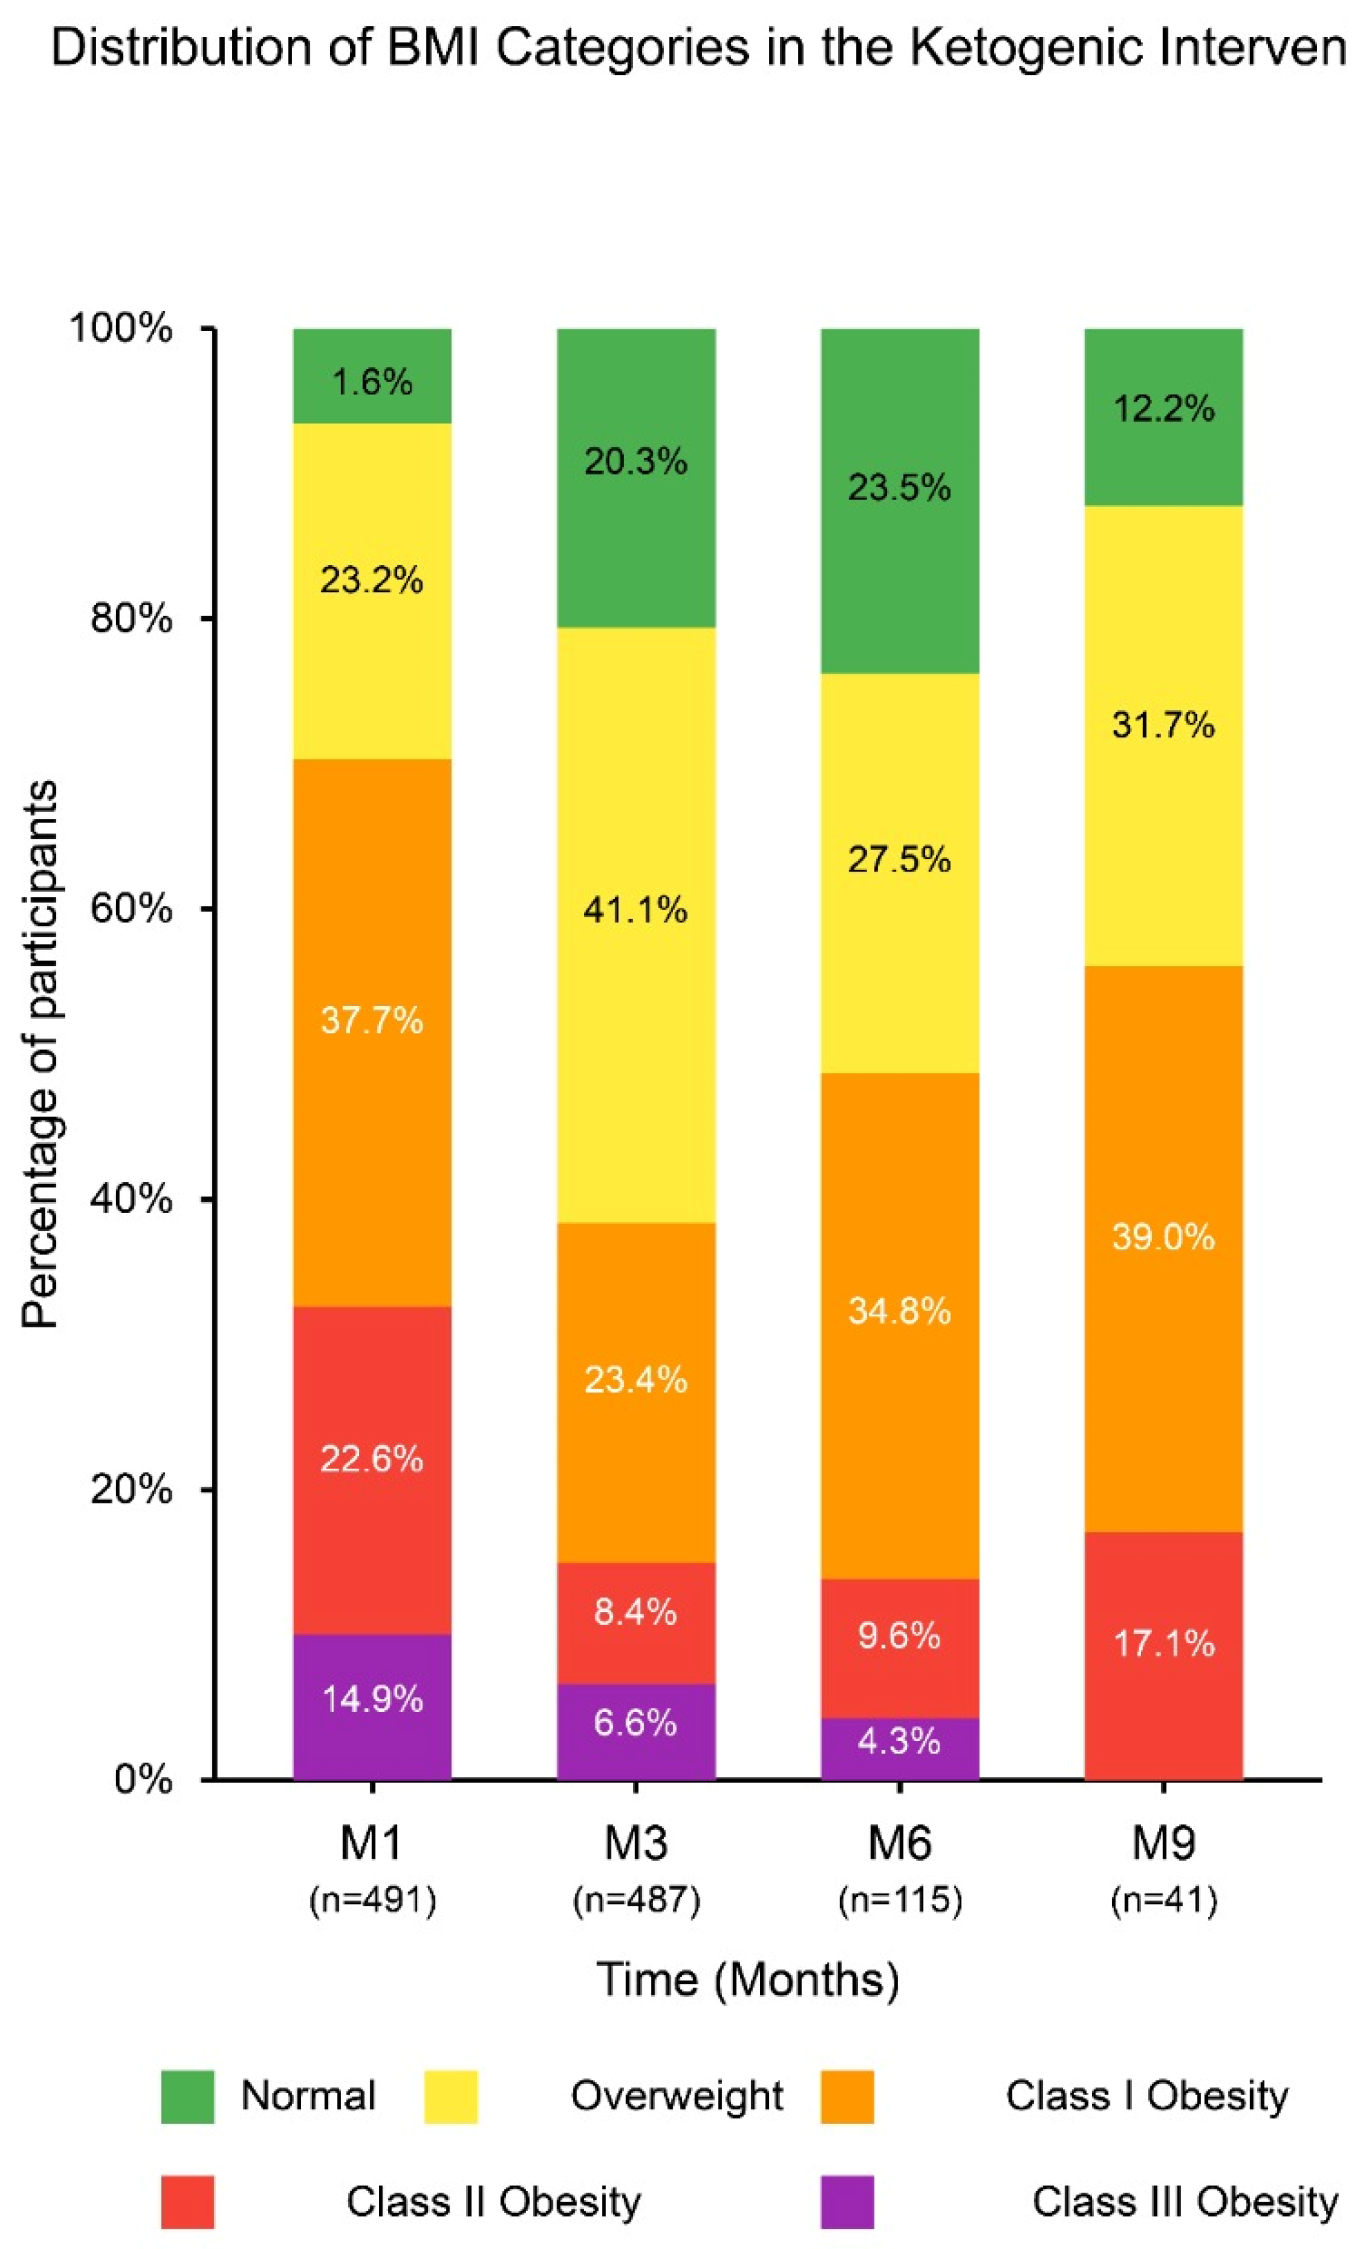
| Time Point | Total n (%) | Underweight <18.5 kg/m2 | Normal Weight 18.5–24.9 kg/m2 | Overweight 25–29.9 kg/m2 | Grade 1 Obesity 30–34.9 kg/m2 | Grade 2 Obesity 35–39.9 kg/m2 | Grade 3 Obesity ≥ 40 kg/m2 |
|---|---|---|---|---|---|---|---|
| M1 | 491 (100) | 0 (0) | 8 (1.6) | 114 (23.2) | 185 (37.7) | 111 (22.6) | 73 (14.9) |
| M3 | 487 (100) | 1 (0.2) | 99 (20.3) | 200 (41.1) | 114 (23.4) | 41 (8.4) | 32 (6.6) |
| M6 | 115 (100) | 0 (0) | 27 (23.5) | 32 (27.5) | 40 (34.8) | 11 (9.6) | 5 (4.3) |
| M9 | 41 (100) | 0 (0) | 5 (12.2) | 13 (31.7) | 16 (39.0) | 7 (17.1) | 0 (0) |
| Weight | Mean Weight Change (kg) | Standard Deviation (kg) | % Change from Baseline |
|---|---|---|---|
| M1 | 0.0 | 0.0 | 0.0 |
| M3 | −12.6 | 4.1 | −13.6 |
| M6 | −13.7 | 6.2 | −14.7 |
| M9 | −14.1 | 6.8 | −15.2 |
Disclaimer/Publisher’s Note: The statements, opinions and data contained in all publications are solely those of the individual author(s) and contributor(s) and not of MDPI and/or the editor(s). MDPI and/or the editor(s) disclaim responsibility for any injury to people or property resulting from any ideas, methods, instructions or products referred to in the content. |
© 2025 by the authors. Licensee MDPI, Basel, Switzerland. This article is an open access article distributed under the terms and conditions of the Creative Commons Attribution (CC BY) license (https://creativecommons.org/licenses/by/4.0/).
Share and Cite
García-Gorrita, C.; Soriano, J.M.; Merino-Torres, J.F.; San Onofre, N. Anthropometric Trajectories and Dietary Compliance During a Personalized Ketogenic Program. Nutrients 2025, 17, 1475. https://doi.org/10.3390/nu17091475
García-Gorrita C, Soriano JM, Merino-Torres JF, San Onofre N. Anthropometric Trajectories and Dietary Compliance During a Personalized Ketogenic Program. Nutrients. 2025; 17(9):1475. https://doi.org/10.3390/nu17091475
Chicago/Turabian StyleGarcía-Gorrita, Cayetano, Jose M. Soriano, Juan F. Merino-Torres, and Nadia San Onofre. 2025. "Anthropometric Trajectories and Dietary Compliance During a Personalized Ketogenic Program" Nutrients 17, no. 9: 1475. https://doi.org/10.3390/nu17091475
APA StyleGarcía-Gorrita, C., Soriano, J. M., Merino-Torres, J. F., & San Onofre, N. (2025). Anthropometric Trajectories and Dietary Compliance During a Personalized Ketogenic Program. Nutrients, 17(9), 1475. https://doi.org/10.3390/nu17091475