Article

Reducing Feature Size in Laser Implantation Texturing †

by
Bart Ettema
,
Dave Matthews
and
Gert-Willem Römer
*
Faculty of Engineering Technology, University of Twente, Drienerloolaan 5, 7522 NB Enschede, The Netherlands
*
Author to whom correspondence should be addressed.
This paper is an extended version of our paper published in the Proceedings of the Lasers in Manufacturing Conference 2023, Munich, Germany, 26–29 June 2023.
Micromachines 2024, 15(8), 958; https://doi.org/10.3390/mi15080958
Submission received: 27 June 2024 / Revised: 18 July 2024 / Accepted: 24 July 2024 / Published: 27 July 2024
(This article belongs to the Special Issue Laser Micro/Nano Fabrication, Second Edition)

Abstract

:
Embossing rolls are used in a variety of sectors to transfer surface textures to a product. Textures on the rolls are typically achieved by material-removal techniques, resulting in craters in the surface of the roll. The wear resistance of the surfaces is improved by additional coating technologies. A novel process offering improved surface design freedom and which negates the need for post-coating techniques is the embedding of micro-meter-sized ceramic particles in the surface of the roll. This can be achieved through micro-additive processing. This work presents and discusses experimental results of surface texturing through locally derived laser-induced melt pools in which ceramic particles are dissolved. This process is termed laser implantation, or laser dispersing. Using this technology, dome-shaped surface structures with significantly increased hardness compared to the bare steel can be achieved. Reported results in the literature focus on implantations with diameters ranging from 150 μ m to 400 μ m and heights ranging from 10 μ m to 30 μ m. However, features with smaller diameters and heights are desired for technology adoption to permit a wider range of surface roughness. This paper presents and discusses the experimental results of implantations with a diameter smaller than 150 µm, with heights between 1 μ m and 15 μ m. For that purpose, a Nd:YAG laser source (focal diameter 70 μ m, pulse durations from 3 to 15 ms, pulse power from 20 to 50 W average) was used to induce a melt pool driving the particle embedding.

1. Introduction

Textured metal sheets are typically finished through the process of skin pass rolling [1]. Here, the skin pass roll serves a dual function, namely both as a roller and a die, which transfers its surface pattern onto the surface of the metal sheet. The potential for variations in this surface texture on the sheet depends on how the inverse texture on the skin pass roll is produced. The longevity of the roll, as well as the quality of the resultant sheet texture, are directly impacted by the wear rate of the texture on the skin pass roll throughout a rolling sequence [2].
Current roll texturing techniques, such as shot blasting [3] and electrical discharge texturing (EDT) [4], involve removal and/or redistribution of material at the roll’s surface. The textures obtained through these techniques are often stochastic in nature. A common enhancement step in the production of skin pass rolls involves the application of hard chrome plating, increasing its wear resistance [5,6]. Due to environmental concerns, the use of chrome has been restricted in many industrial contexts [7].
In addition to wear-resistant rolls, there is a growing necessity for more design freedom of the roll’s surface texture and inturn of the metal strip. The stochastic texturing techniques discussed above do not offer this design freedom. Research by Gorbunov et al. [3] evaluated five texturing methodologies, which generate textures that can be perceived as (pseudo-)deterministic on the skin pass rolls. These methods predominantly depend on removal or material redistribution at the microscopic scale. The authors concluded that additive material techniques for texture creation are promising for rolls in steel sheet production. Additive manufacturing not only promises greater design flexibility, but might also enhance the texture’s durability and therefore the roll’s lifespan.
The additive manufacturing technique termed “laser implantation texturing” (LITex) [8], allows for strategically depositing a deterministic texture on a substrate, characterized by a sequence of “implants”. Another term commonly associated with this technique is “laser dispersing” [9]. By specifically selecting the material to be dispersed, the hardness of the surface texture of the roll can be improved, potentially eliminating the need for a chrome coating.
The LITex process unfolds in three steps, illustrated schematically in Figure 1. During the first step (Figure 1b), a layer, with a thickness of about 100 μ m, is deposited onto the substrate. Typically, the layer comprises a compound of micro-meter-sized ceramic particles suspended in a binder (for example polyvinylbutyral (PVB)). The layer is applied using, for example, a mask with the intended layer thickness and spread with a knife edge [10]. For the implantation to be wear resistant, the selected particles must exhibit a hardness higher than the substrate and have a melting point which is higher than that of the tool steel (substrate). Concurrently, the chosen particles should exhibit a minimal thermal expansion coefficient to prevent stress formation during solidification. To ensure the success of the implantation, particle diameters must be notably less than the desired implant diameter. In the subsequent step (Figure 1), the powder layer is exposed to a pulsed laser beam, which causes the binder to evaporate and the substrate to melt, enabling the particles to submerge (sink) into the melt pool. Following the solidification of the melt pool after the laser pulse, the particles are anchored within the substrate, creating a protruding “implant”. In the final step (Figure 1c), a cleaning process removes excess slurry surrounding the implants. This implantation routine can be repeated, either by repositioning the laser beam or adjusting the substrate’s position, to generate patterns of implants. Frequently used abbreviations are listed at the end of this paper.
Hilgenberg and Steinhof [8,11] developed this methodology to successfully produce implant diameters spanning from 150 μ m to 400 μ m and implant height between 10 μ m and 30 μ m. Their findings, achieved using laser powers ranging from 40 W to 180 W, a focal spot diameter of 105 μ m, pulse durations between 3 ms and 15 ms, and a 100 μ m-thick powder layer composed of ceramic particles sized between 5 μ m and 13 μ m, show a texture hardness of up to 1800 Hv when applied to an AISI D2 substrate.
In industrial contexts, particularly for skin rolls, there is a pressing need for implantation diameters smaller than 150 μ m [3], i.e., smaller than the implants achieved in [8,11]. In recent years, advances in laser implantation have been reported [12,13]. However, these studies focus the application of laser-implanted textures on stamping tools, instead of aiming to decrease the size of the laser-implanted textures. Decreasing the feature size in LITex will enable a greater degree of surface design freedom, as well as making the process viable to a wider range of engineering sectors. The research detailed in this article presents and discusses efforts to achieve reduced implantation diameters without compromising the enhanced hardness imparted by ceramic particles. To that end, we established a laser process window for one type of ceramic particles (WC), including factors such as layer thickness and spot size, among others, as well as an assessment of the hardness of the smaller implants.

2. Methodologies

2.1. Experimental Setup

A schematic representation of the experimental setup is shown in Figure 2. This setup incorporates an Nd:YAG fiber laser source (JK100FL of JK Lasers, West Bromwich UK). This laser source emits a beam with a wavelength of 1080 nm. The emitted beam is transported through a single-mode optical fiber, into a collimator with a focal length of 76 mm.
A non-polarizing 50:50 beam splitter (CCM1-BS014/M from Thorlabs Inc., Newton, NJ, USA) was integrated in the beam path. The splitter is combined with a beam dump to enable the laser source to operate efficiently and stable at elevated power levels while modulating the emitted power to the power levels needed for the process. Following the beam splitter, a focus lens (provided by JK Lasers, West Bromwich, UK) with a focal length of 300 mm is utilized to focus the laser beam to a diameter of 70 μ m. The latter diameter was measured using a MicroSpotMonitor (MSM+ of Primes GmbH Pfungstadt, Pfungstadt, Germany). From the caustic measurements using this tool, a beam quality of M 2 = 1.23 was found. Additionally, to inhibit oxidation during laser processing, argon is supplied at a rate of 10 L/min via a nozzle (inner diameter of 6 mm) situated at about 20 mm to the laser material interaction zone, at an angle of about 45 degrees to the normal on the substrate surface. The sample is positioned relative to the stationary beam using an XY stage consisting of two DDS100/M (Thorlabs Inc., Newton, NJ, USA). The repeatability accuracy of these stages are ±1.5 μ m. During the experiments, laser pulse powers were varied between 20 W and 50 W using pulse durations ranging from 3 ms to 20 ms. Processing parameters are presented and discussed in Section 2.5.

2.2. Materials

The substrate utilized comprised slabs of X100CrMoV5 (procured from Udeholm, Amsterdam, The Netherlands) tool steel, each measuring 30 × 30 mm2 and having a thickness of 6 mm. The chemical composition of this steel is presented in Table 1. X100CrMoV5 is a common choice of tool steel for skin pass rolls, due to the chromium carbides within this ledeburitic steel. These carbides result in superior wear resistance.
The substrate’s surface underwent a polishing procedure using sandpaper with decreasing grit sizes to achieve a final roughness value of Ra = 0.2 µm. Subsequent heat treatments, including vacuum hardening and annealing, were applied to the samples, culminating in a hardness measure of 600 Hv0.2 ± 30. Other material properties are listed in Table 2.

2.3. Powder Particles

The chosen particles to be implanted were tungsten carbide (WC) and titanium diboride (TiB2), with average diameters below 2 μ m and 10 μ m, procured from Sigma-Aldrich (Saint Louis USA), because of their high hardness and melting point. The material properties as provided by the manufacturer are summarized in Table 3.
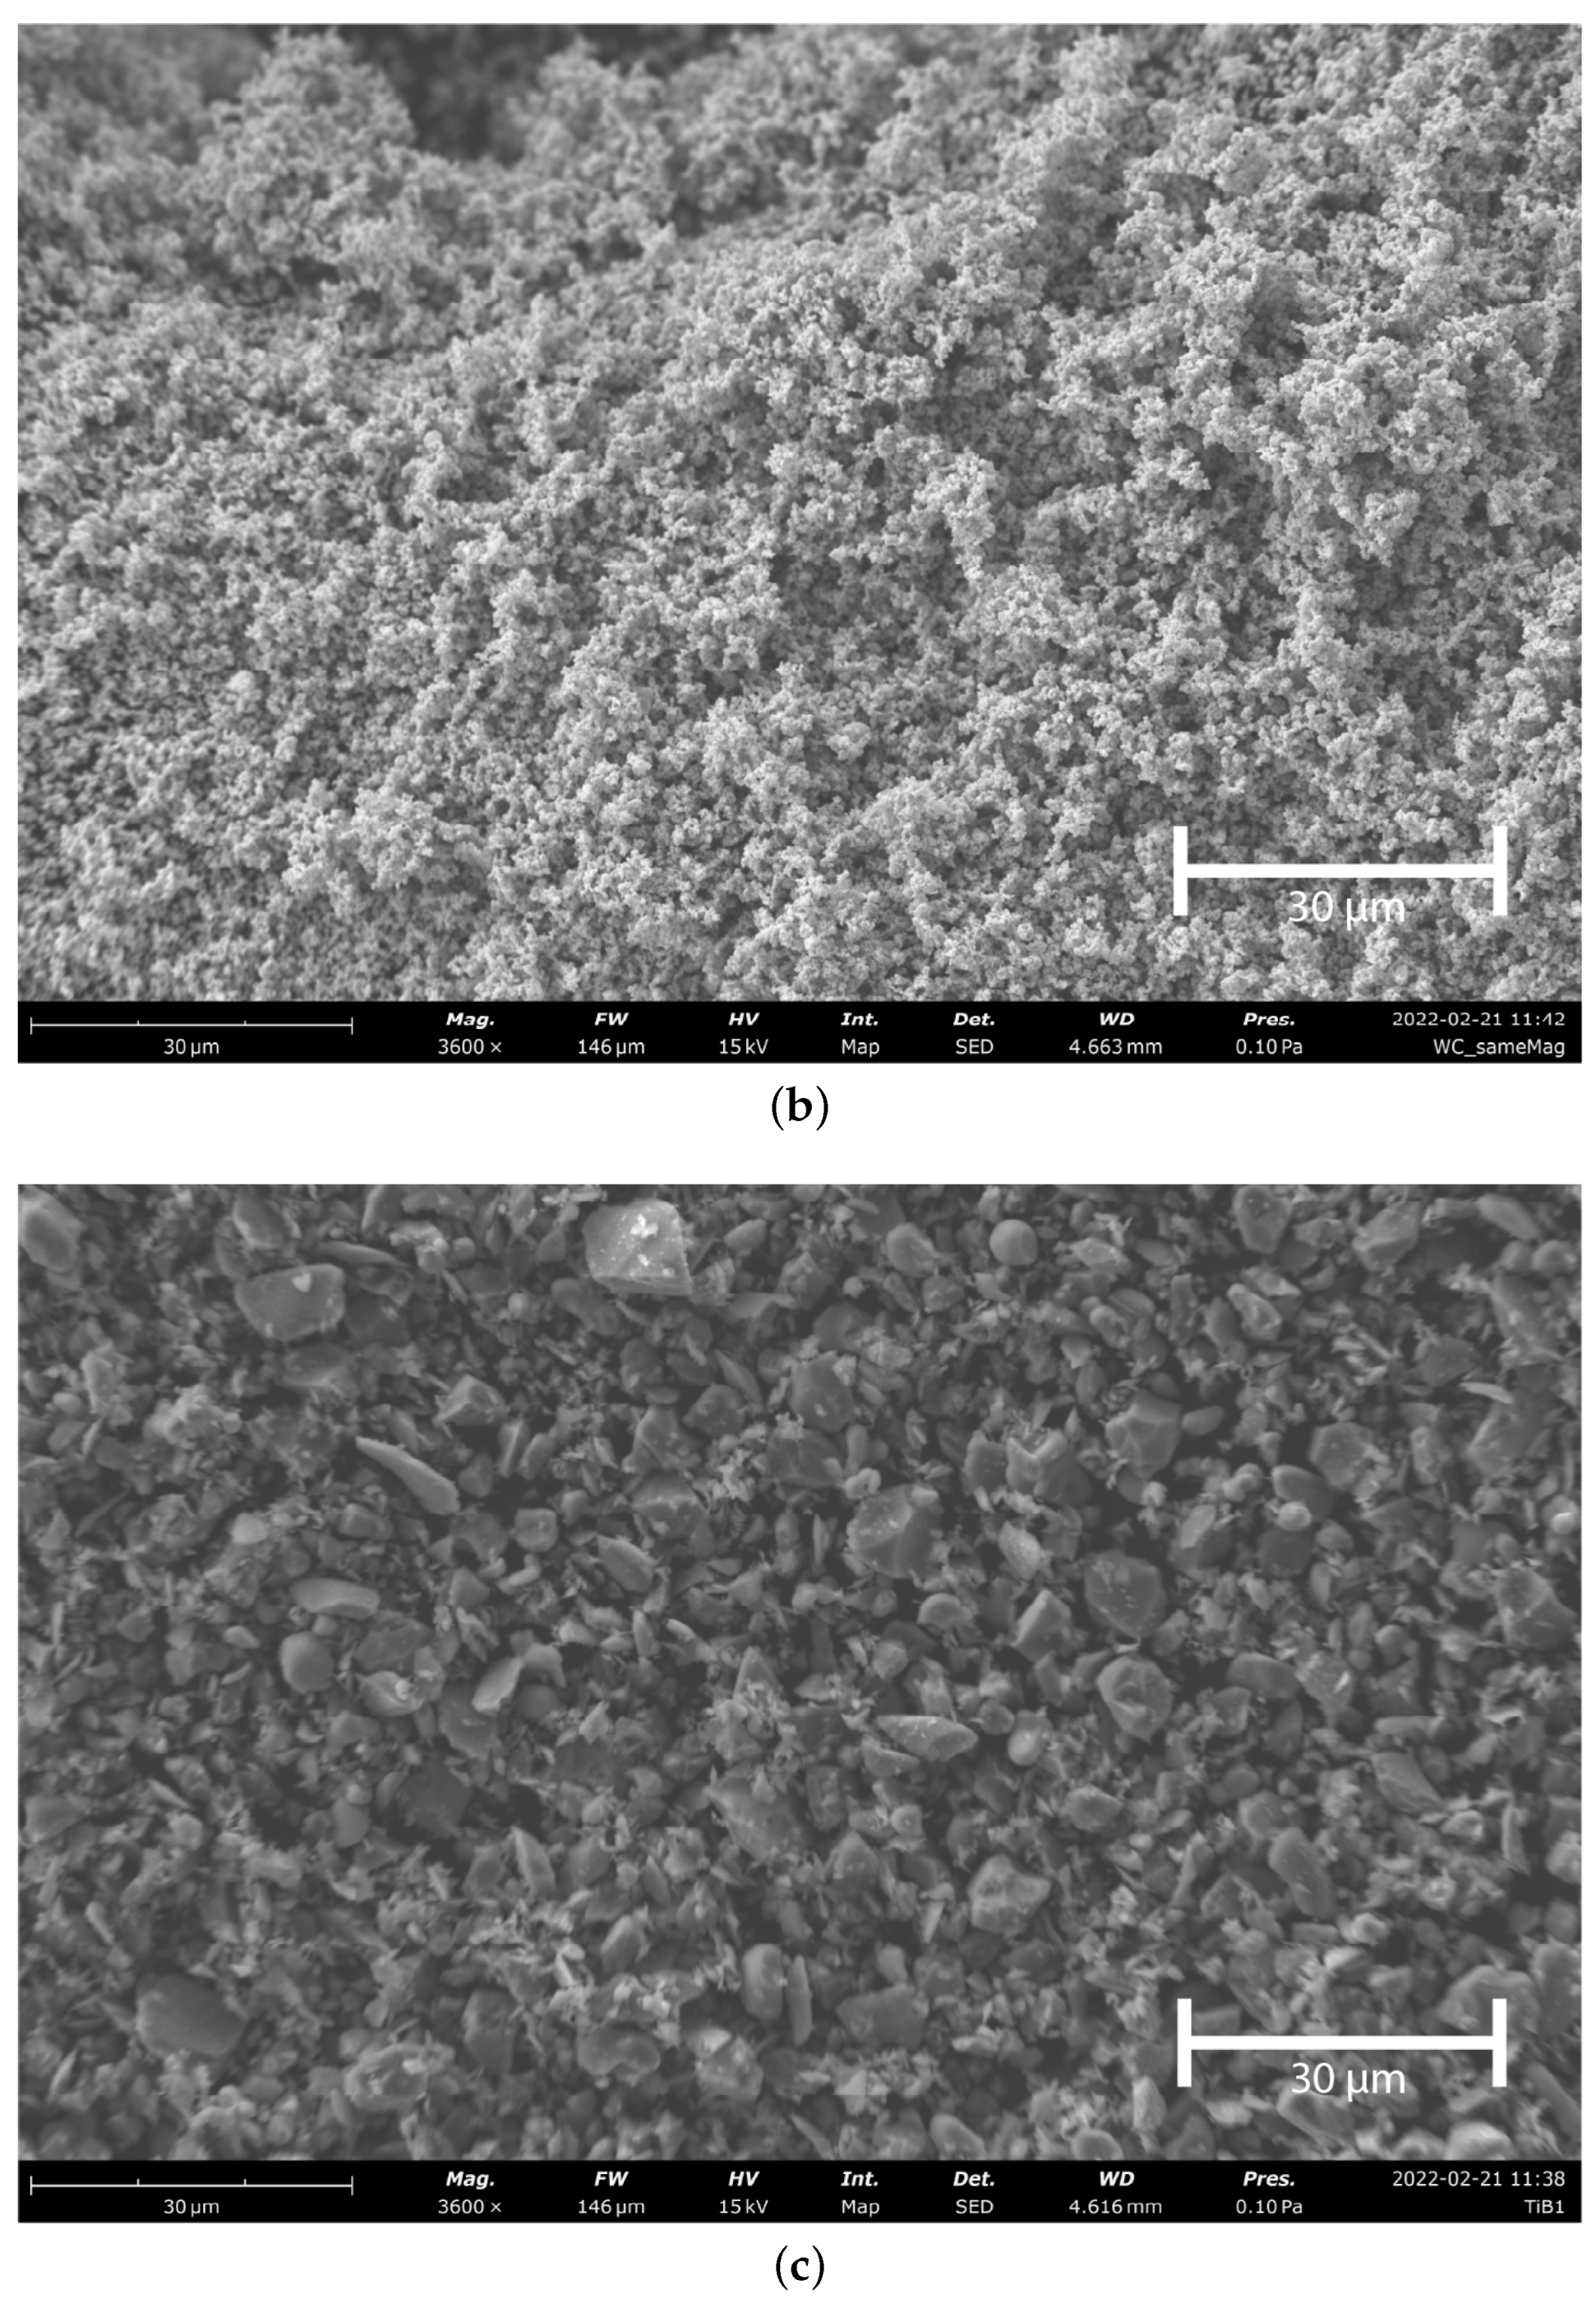
However, laser diffraction measurements of the particles, using a Sympatec HELOS H4766 (form Sympatec Clausthal-Zellerfeld Germany), show a significant deviation of the average specified diameters see (Figure 3a). Also, SEM imaging Figure 3b shows the conglomerating nature of the small WC particles, which is common for micro-meter-sized particles [20] and decreases the reliability of depositing layers of uniform thickness on the substrate. Furthermore, SEM imaging of the TiB2 particles shows sharp and fractured features, but shows less conglomerations due to their larger average diameters of about 4.23 μ m (see Figure 3c).
As an adhesive agent to bind the particles, polyvinyl butyral (PVB, Mowital 30H procured from Kuraray, Tokyo, Japan), combined with an ethanol solvent, was employed to yield a paste mixed by hand-stirring in an erlenmeyer consisting of 18.6 wt.% ethanol, 77.5 wt.% particles, and 3.9 wt.% PVB. The evaporation temperature of the PVB is several magnitudes lower than the substrate’s melting temperature, meaning that the binder fully evaporates during the laser material interaction. This paste was applied on the substrate, using a mask and a knife-edge technique to ensure a layer of uniform thickness as mentioned in the introduction, Figure 1b. Masks with thickness of 50 μ m and 75 μ m, respectively, were used. After air drying for six hours, the ethanol solvent is fully evaporated, resulting in a uniformly distributed layer of 94 wt.% particles and 6 wt.% PVB. Subsequently, powder layers of 50 and 75 μ m were formed on the substrates, with measured deviations not exceeding 10 % of the layer thickness.

2.4. Analysis Tools

To evaluate the geometric characteristics of the implants, a scanning electron microscope (JSM-7200F, JEOL, Tokyo, Japan) was utilized. Subsequent EDX imaging, facilitated by a sensor from Oxford instruments (Abingdon, UK), was conducted to characterize the spatial distribution and concentration particles elements within these implants.
An average hardness was determined by performing macro indentation using a hardness tester, Leco Inc., (Sint Joseph, MI, USA) LM 100, employing an indentation force of 200 gf. This indentation force results in indention diameters between 17 μ m and 30 μ m. Therefore, the indentation size is small compared to the implantation diameters and significantly larger that the particle size of the ceramic particles. The macro indentations were preformed in the center of the implants as a flat surface is required for accurate hardness measurements.
Confocal microscopy images were made (S neox, Sensofar Tech S.L., Barcelona, Spain) for determination of the implant’s dimensions, specifically its diameter and (average) height. For implants exhibiting an elliptical shape, the diameter D i was determined by averaging the lengths of both the major and minor axes (see Figure 4a). Analogously, an implant’s height H i was deduced by averaging the peak heights observed along these two axes for the dome-shaped implants. The heights of the ring-shaped implants are determined by averaging over the circle drawn on top of the ring, as shown in Figure 4b.
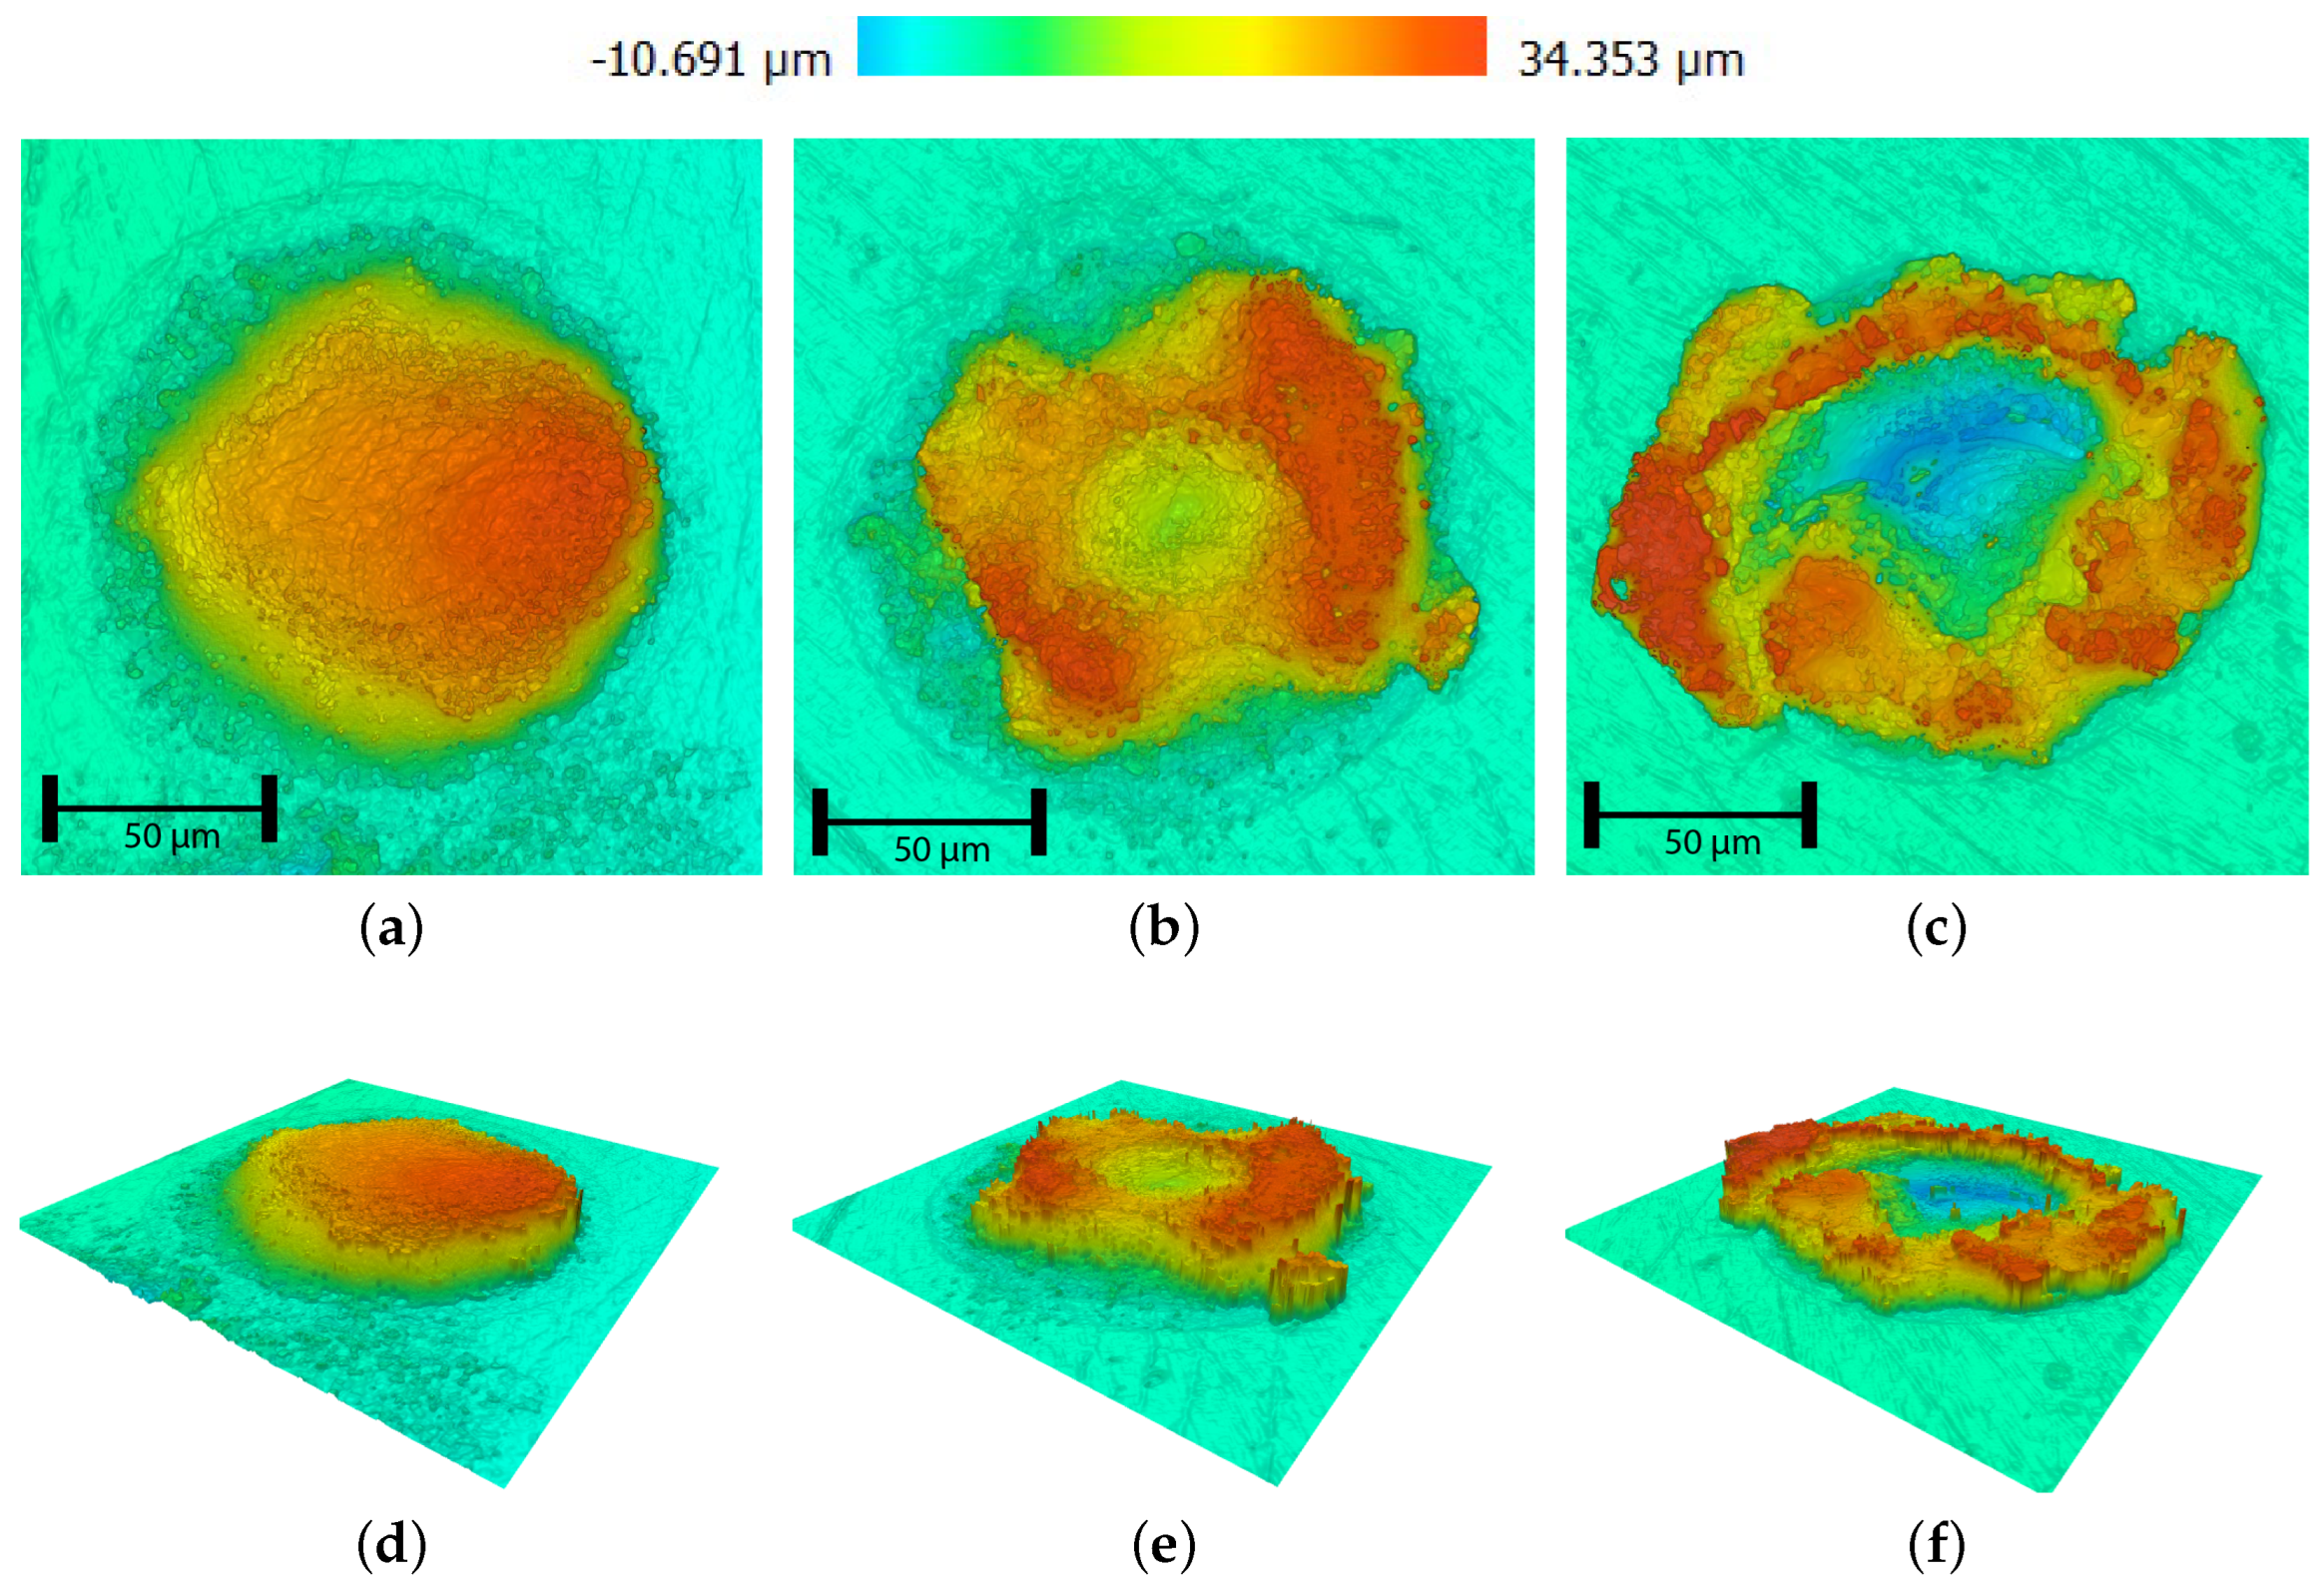
A distinction is made between dome-shaped implants (Figure 5a) and ring-shaped implants (Figure 5b), as both dome- and ring-shaped implants are considered relevant for surface-texturing patterns. As reported in the literature, ring-shaped implantation geometry forms at increased laser intensity [21]. Keyhole effects and failed implantation occur for higher laser intensities (Figure 5c).

2.5. Methods

After preliminary experiments in which the laser power, pulse time, and powder layer thickness were varied, an experimental processing window was found. It was found that a decreased powder layer thickness is found to be pivotal in creating smaller implantations. Within this processing window, dome, ring, and failed implants could be created with a sub-150- μ m diameter. Therefore, in this experimental study, the laser power during each pulse was adjusted to range between 20 and 50 W (see Table 4). This table also shows the range of corresponding average laser intensity levels from the laser power in the pulse and the focal spot size of 70 μ m. The laser pulse duration was varied within a range of 3 ms to 20 ms. As mentioned, two powder layer thicknesses of 50 μ m and 75 μ m for both WC and TiB2 were employed. For every set of processing parameters, nine experiments were conducted to evaluate the reproducability of the implantation process. That is, for each set of processing parameters, both the mean dimensions and standard deviations of the implants were determined based on nine experiments.

3. Results and Discussion

3.1. TiB2 Implantations

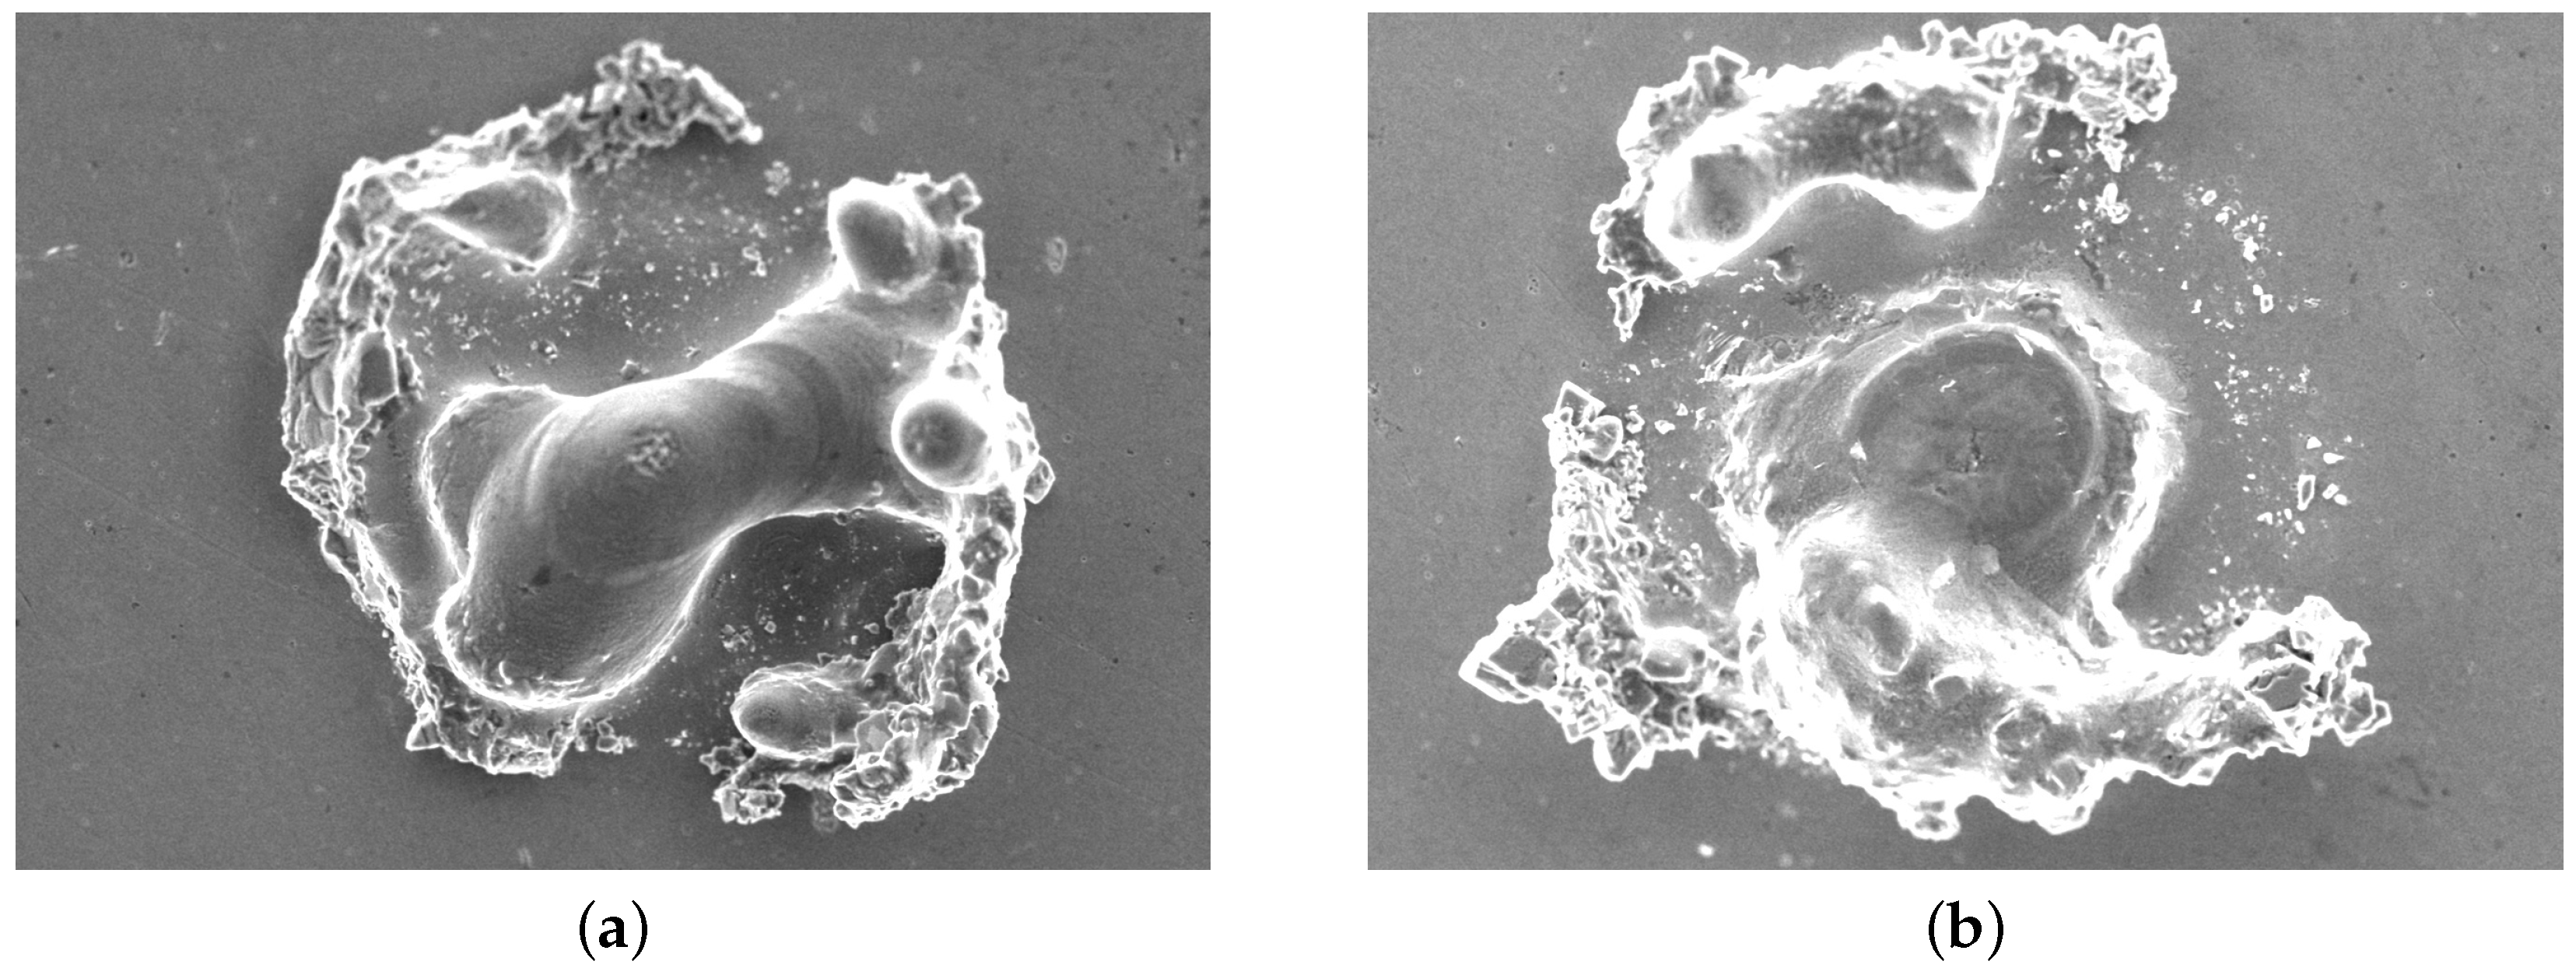
Implantation using relatively large TiB2 particles at intensities ranging from 500 to 1300 kW/m2 and a spot radius of 70 μ m fails to reliably generate dome- or ring-shaped implants, as illustrated by Figure 3c. The latter is attributed to the ratio of the particles to the layer height being too large, hindering the mixing and implantation of the TiB2 particles. In turn, this leads to poor reproducibility of implantation geometries. Additionally, in the case of the 50 μ m powder layer, keyholing occurs in the center of the implantation zone (see Figure 6b). When using TiB2 particles, none of the laser-processing parameters resulted in reproducible dome or ring-shaped implantations. Therefore this powder is excluded from further analysis in this study.

3.2. WC Implantations

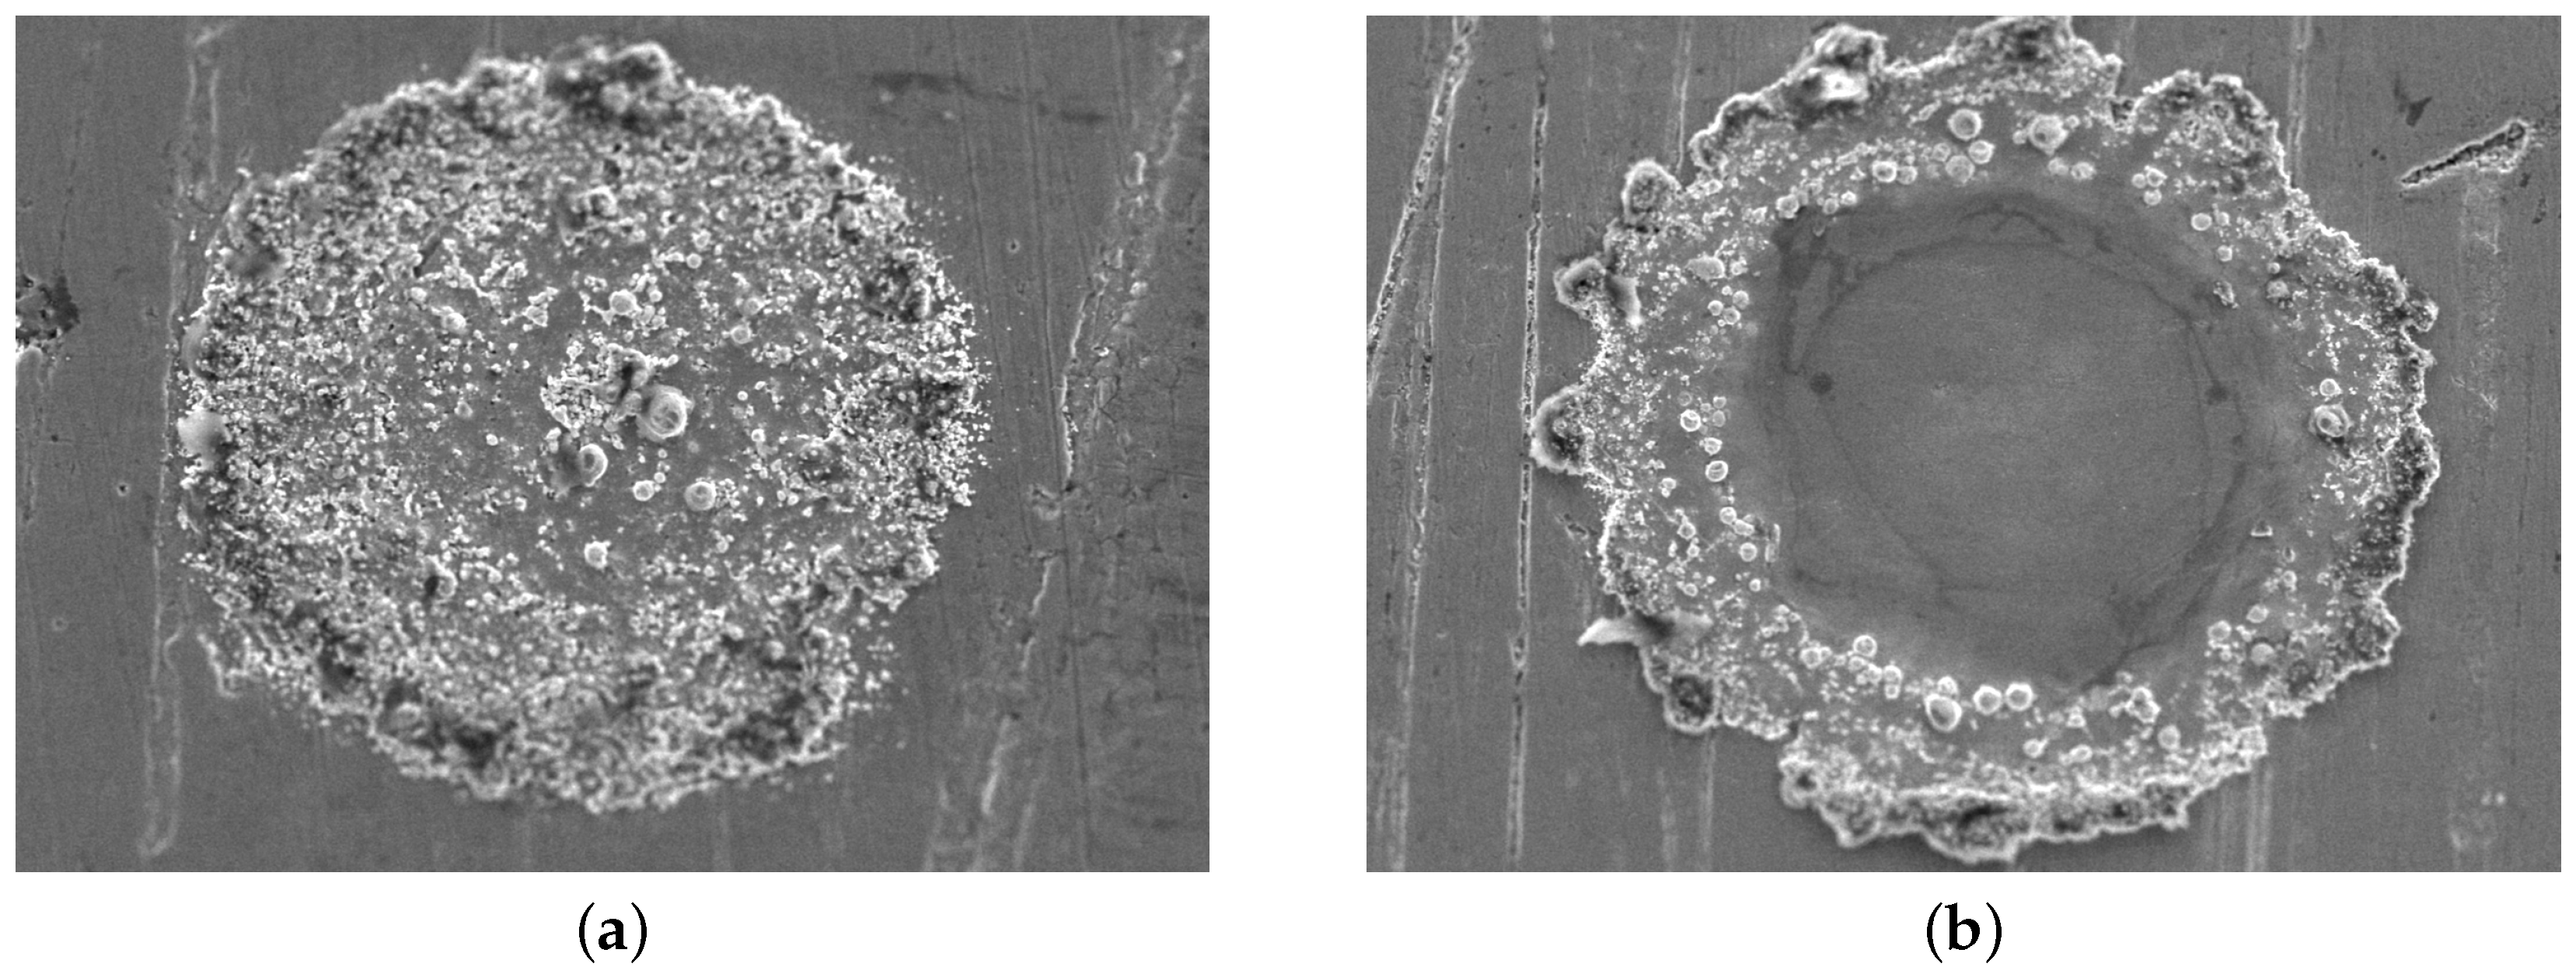
Figure 7 shows SEM micrographs of both dome- and ring-shaped WC implants. In these images, the sharp WC particles can be observed at the surface of the implants. Also, the figure shows a typical dome-shaped implant (Figure 7a) and a ring-shaped implant (Figure 7b). The latter forms typically increased at laser intensities.
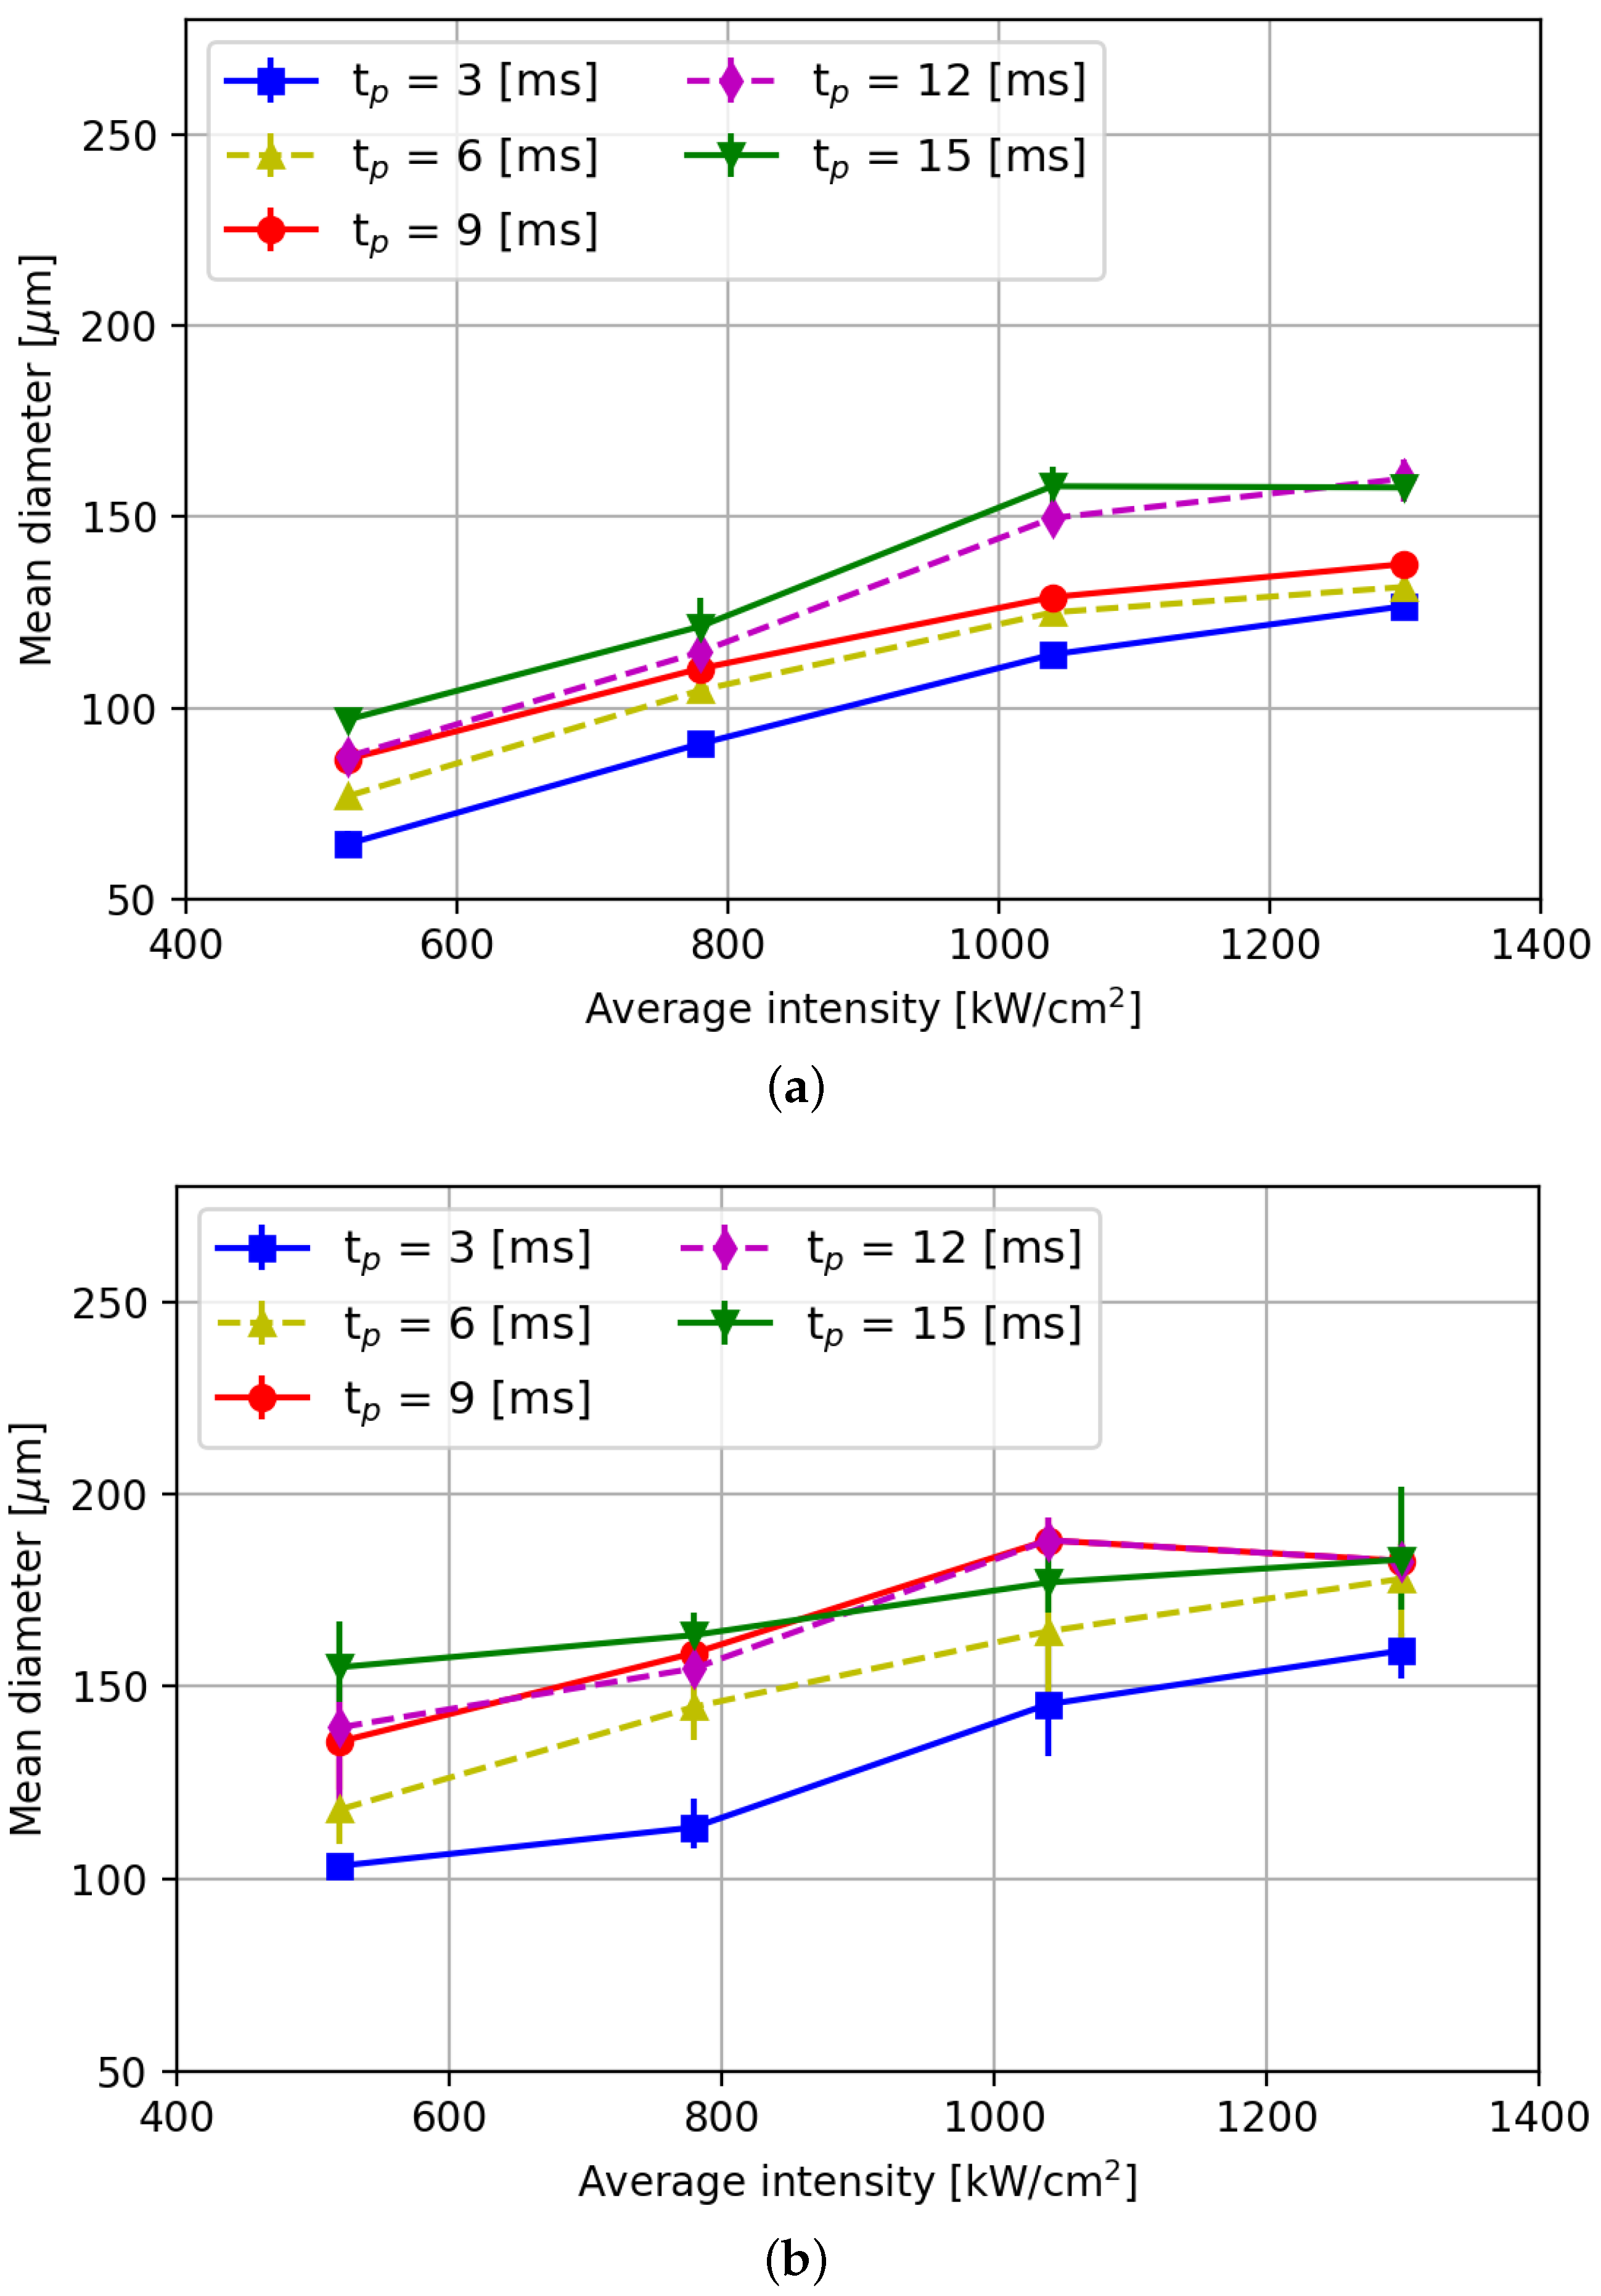
Figure 8 shows the corresponding averaged diameters and Figure 9 shows the height of implantations as function of the laser intensity. As can be observed from Figure 8a, the implantation diameter decreases with decreasing laser pulse power. It can also be concluded from this graph that decreasing the pulse duration leads to a decrease in the implantation diameter. The latter can be attributed to the lower total energy over time that the melt pool is exposed to. Furthermore, the geometry of the implantation is dome-shaped (Figure 7a) for average intensities up to 780 kW/cm2 and ring-shaped at 1040 kW/cm2 and higher (Figure 7b).
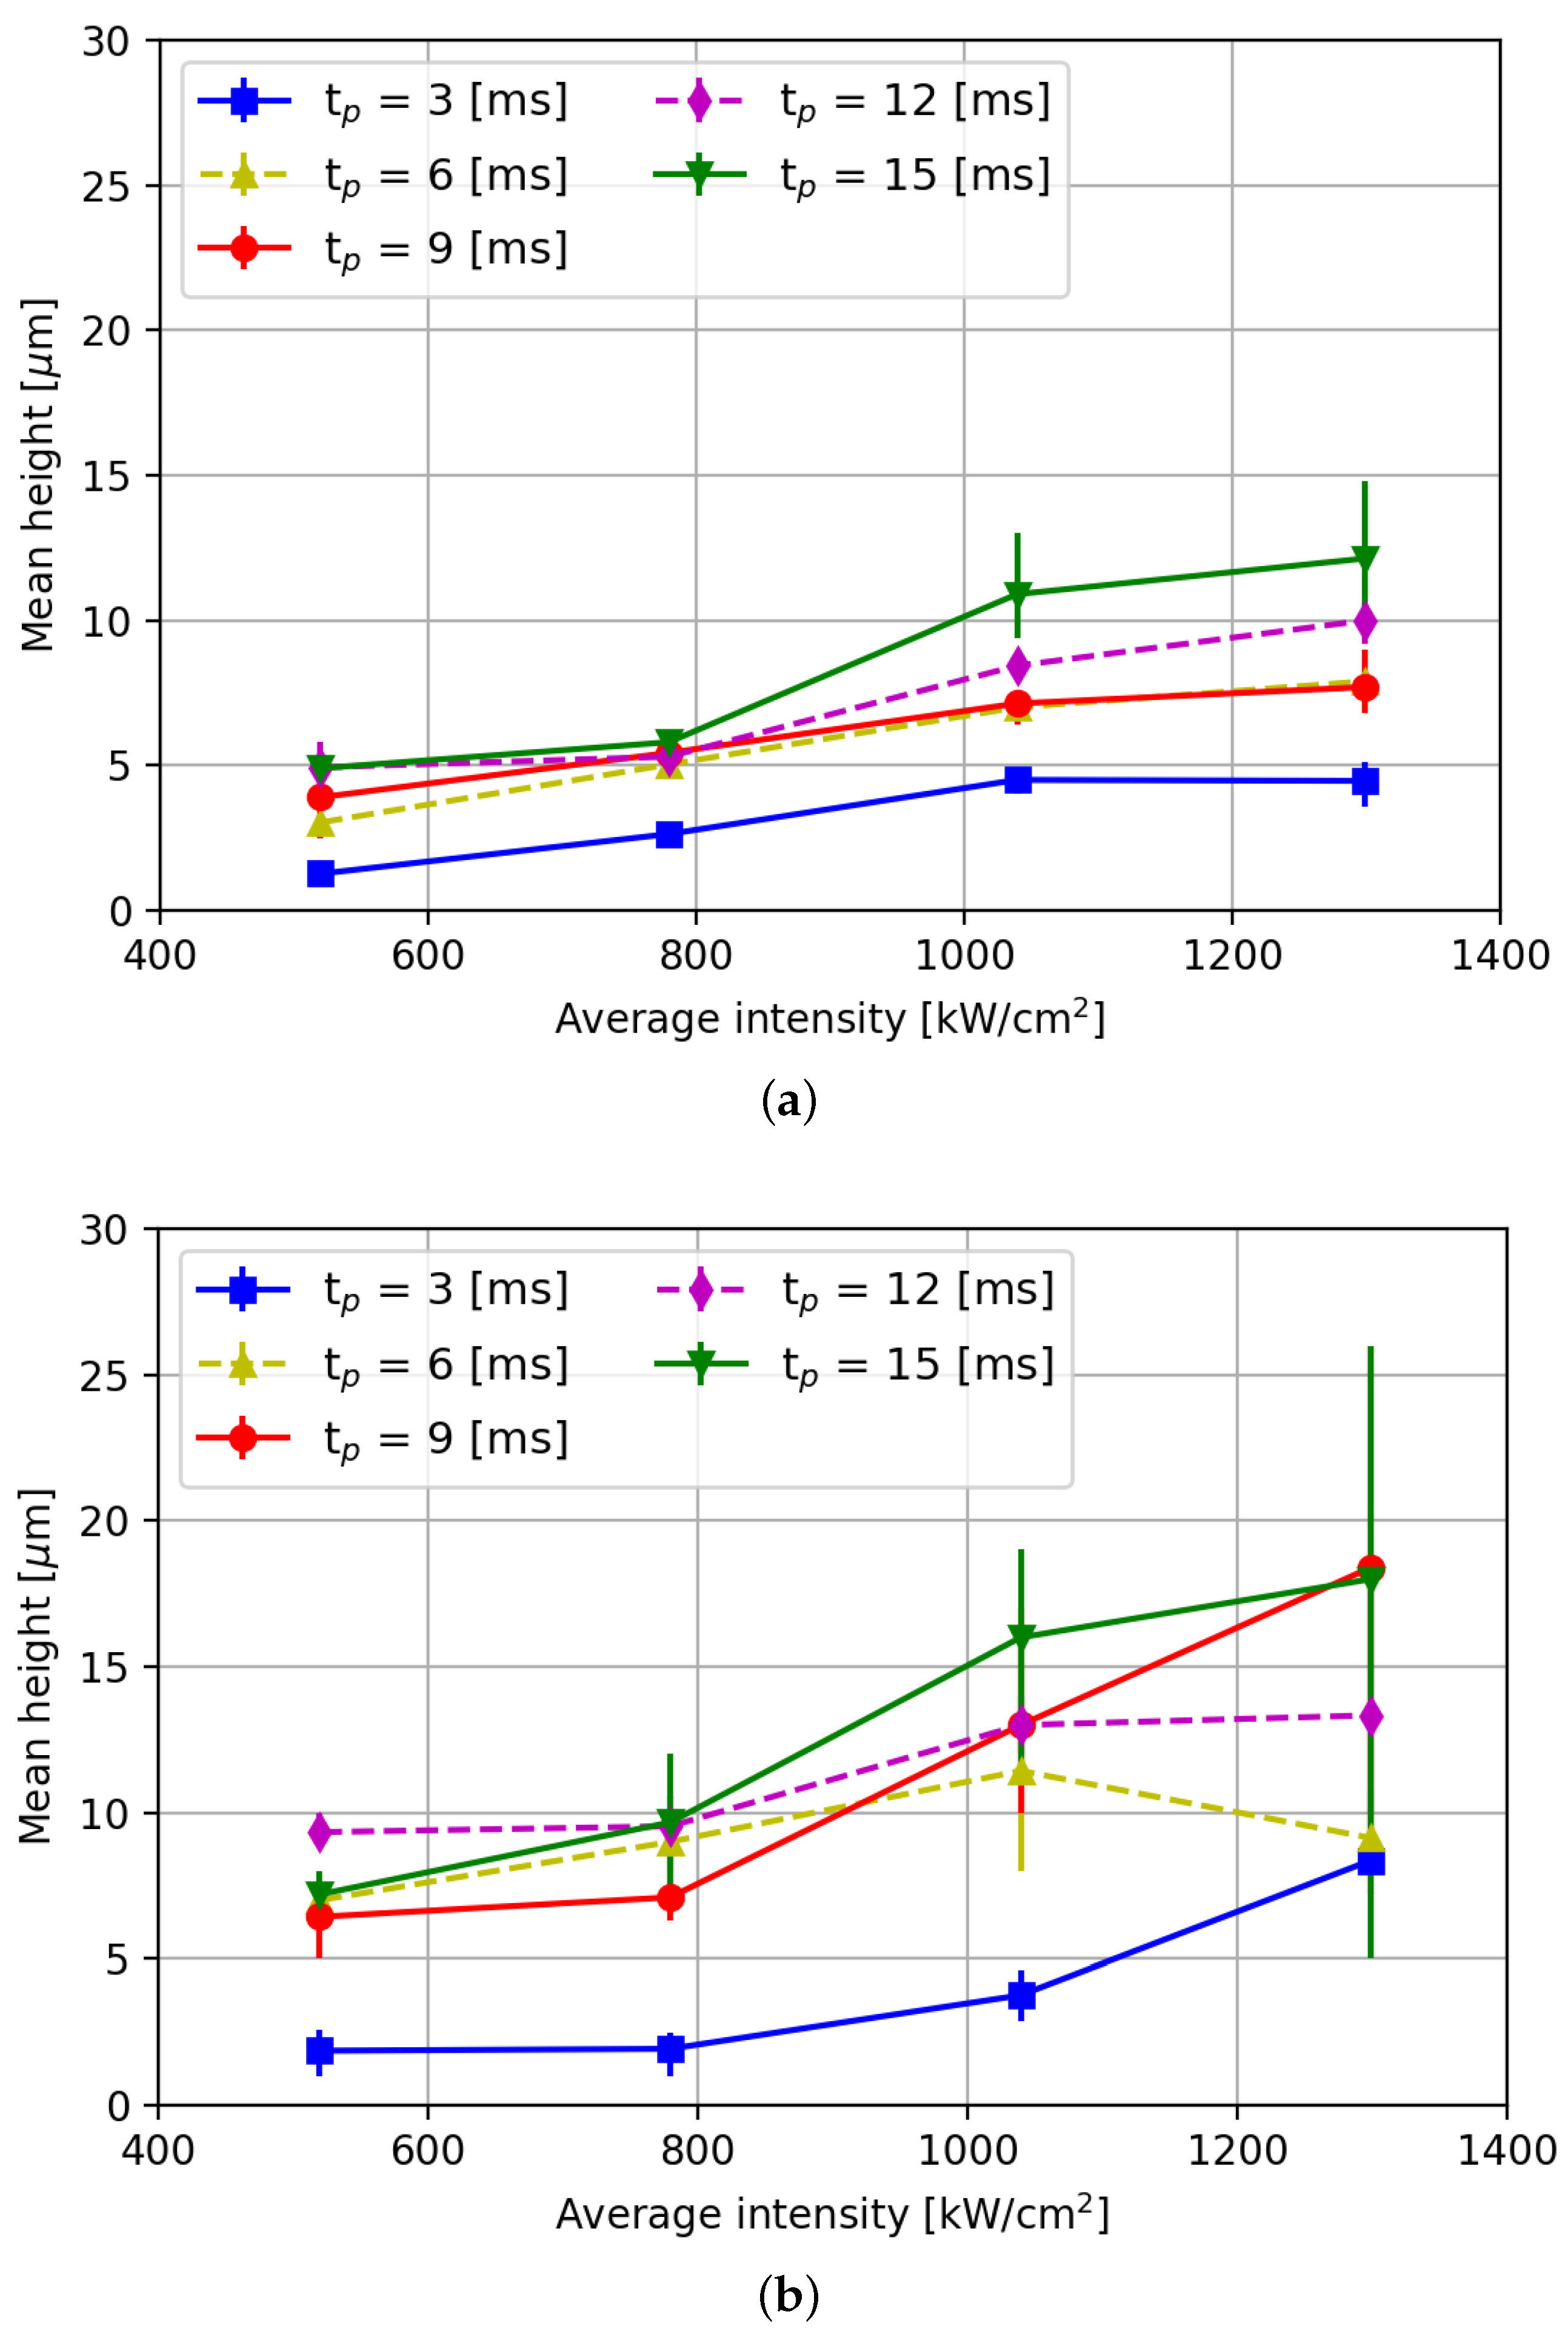
As can be concluded from the error bars in Figure 9, the variability in the height values of implants is found to be larger than the variability in implant diameter (Figure 8), particularly when using a pulse duration of 15 ms. For laser intensities of 780 kW/cm2 and below, the variation in implant height is comparatively smaller than for higher laser intensities across all pulse durations. Moreover, the difference in height of implants formed when using pulse durations between 3 ms and 6 ms is more pronounced than that between 6 ms and 12 ms. It is evident from the graph that reducing the pulse duration leads to a decrease in implant height. This phenomenon can be attributed to lower temperatures in the melt pool, resulting in increased viscosity and reduced surface tension in and on the melt pool [22,23].
It is noteworthy that at a pulse duration of 15 ms and an intensity of 1040 kW/cm2, the achieved implant height closely aligns with height values reported in the literature [8,11,24,25]. However, when using this parameter combination, the minimum implant diameter (Figure 8a) is smaller than the diameters reported in the literature. Therefore, by reducing laser intensity, powder layer thickness, and pulse duration, it is possible not only to achieve smaller implants, but also possible to create implants with an aspect ratio where the diameter is several times larger then the height. The latter is desirable to avoid large forces exerted on the implants that could lead to implant break-off during rolling. It is essential to note that smaller implants are only obtained when using a layer height of 50 μ m and not when using 75 μ m layers. Figure 8b and Figure 9b reveal that thicker layer heights (75 μ m) yield implantation dimensions similar to those reported in the literature, in which a 100 μ m layer height and a 105 μ m spot diameter were reported [25]. This suggests that layer height significantly influences implantation diameter. All in all, it can be concluded from this graph that significantly smaller implant diameter than reported in literature can be reliably achieved, provided a low(er) layer thickness and a smaller spot diameter (here h l = 50 and 75 μ m, F s = 70 μ m) than typically applied ( h l = 150–400 μ m, F s = 105 μ m [26,27]) are chosen. Similarly, the average height of the implants also shows a decreasing trend when decreasing the laser power, as can be concluded from Figure 9a.

3.3. Dispersion of WC Particles

Figure 10 shows an SEM micrograph of a typical WC implant, after the cleaning step. In this figure, the (size of the) laser spot is visualized by a red dotted circle. In this SEM image, the implant shows an outer diameter larger than the laser spot diameter, characterized by the light gray perimeter outside the laser spot. Hence, it can be concluded that the diameter of the melt pool during the implantation process is larger than the diameter of the laser spot. This is attributed to either conduction or the shoulders of the laser spot or a combination of both.
Figure 11 shows the EDX analysis of the WC implants, clearly showing tungsten concentration, especially in the perimeter of the implant. From this EDX analysis, it can also be concluded that the diameter of the melt pool was larger than the diameter of the laser spot. The EDX image suggests that in the ring-shaped implant, WC is mainly found in the perimeter of the implant, and not or at least in a reduced concentration in the center of the implant. The latter can be attributed to the increased energy in the ring-shaped melt pool, leading to melting of the WC particles.
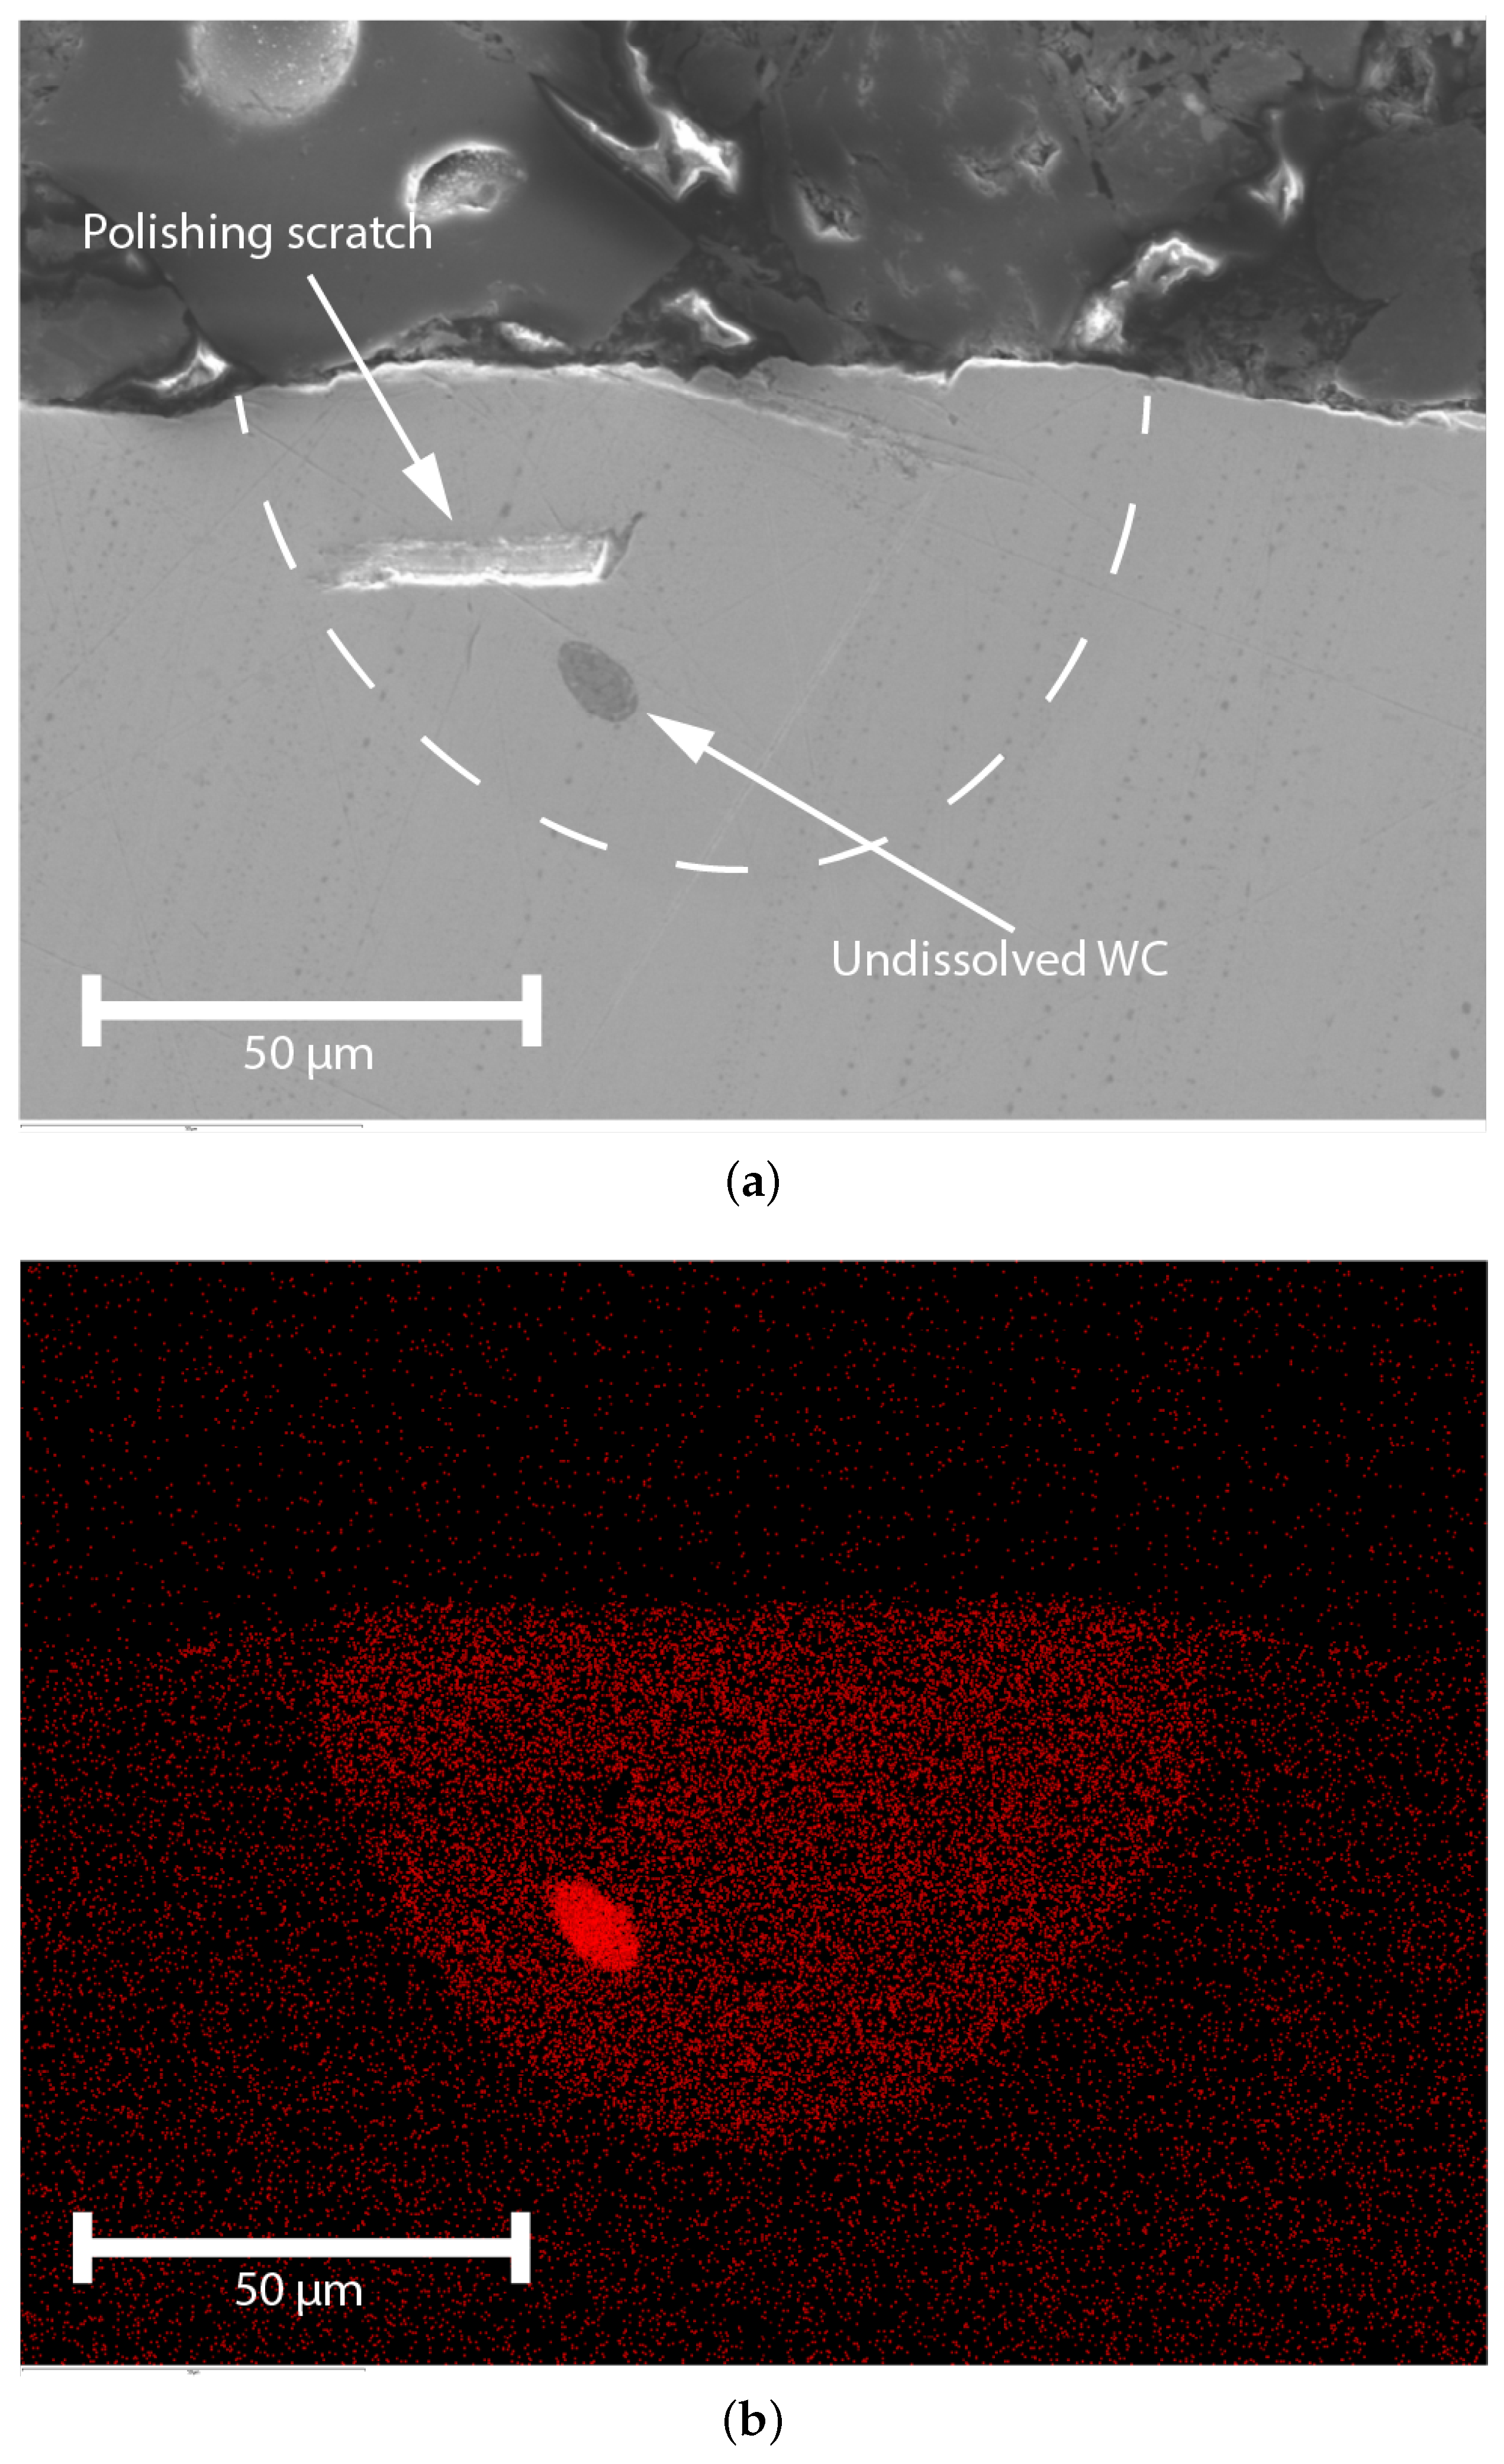
Additionally, a cross-section EDX micrograph (Figure 11b) reveals increased Tungsten concentration caused by the homogeneously dissolved WC particles in the laser-induced melt pool. High concentrations of tungsten are found in the LIZ because WC particles do not fully dissolve. A single large “lump” of WC can be observed in Figure 12a,b. This lump might be caused by a large WC particle which did not fully dissolve, or by conglomeration of smaller particles.
The results per element of the cross-section shown in Figure 12, are presented in Table 5. The results reveal the significant presence of tungsten in the implants.

3.4. Hardness WC Implants

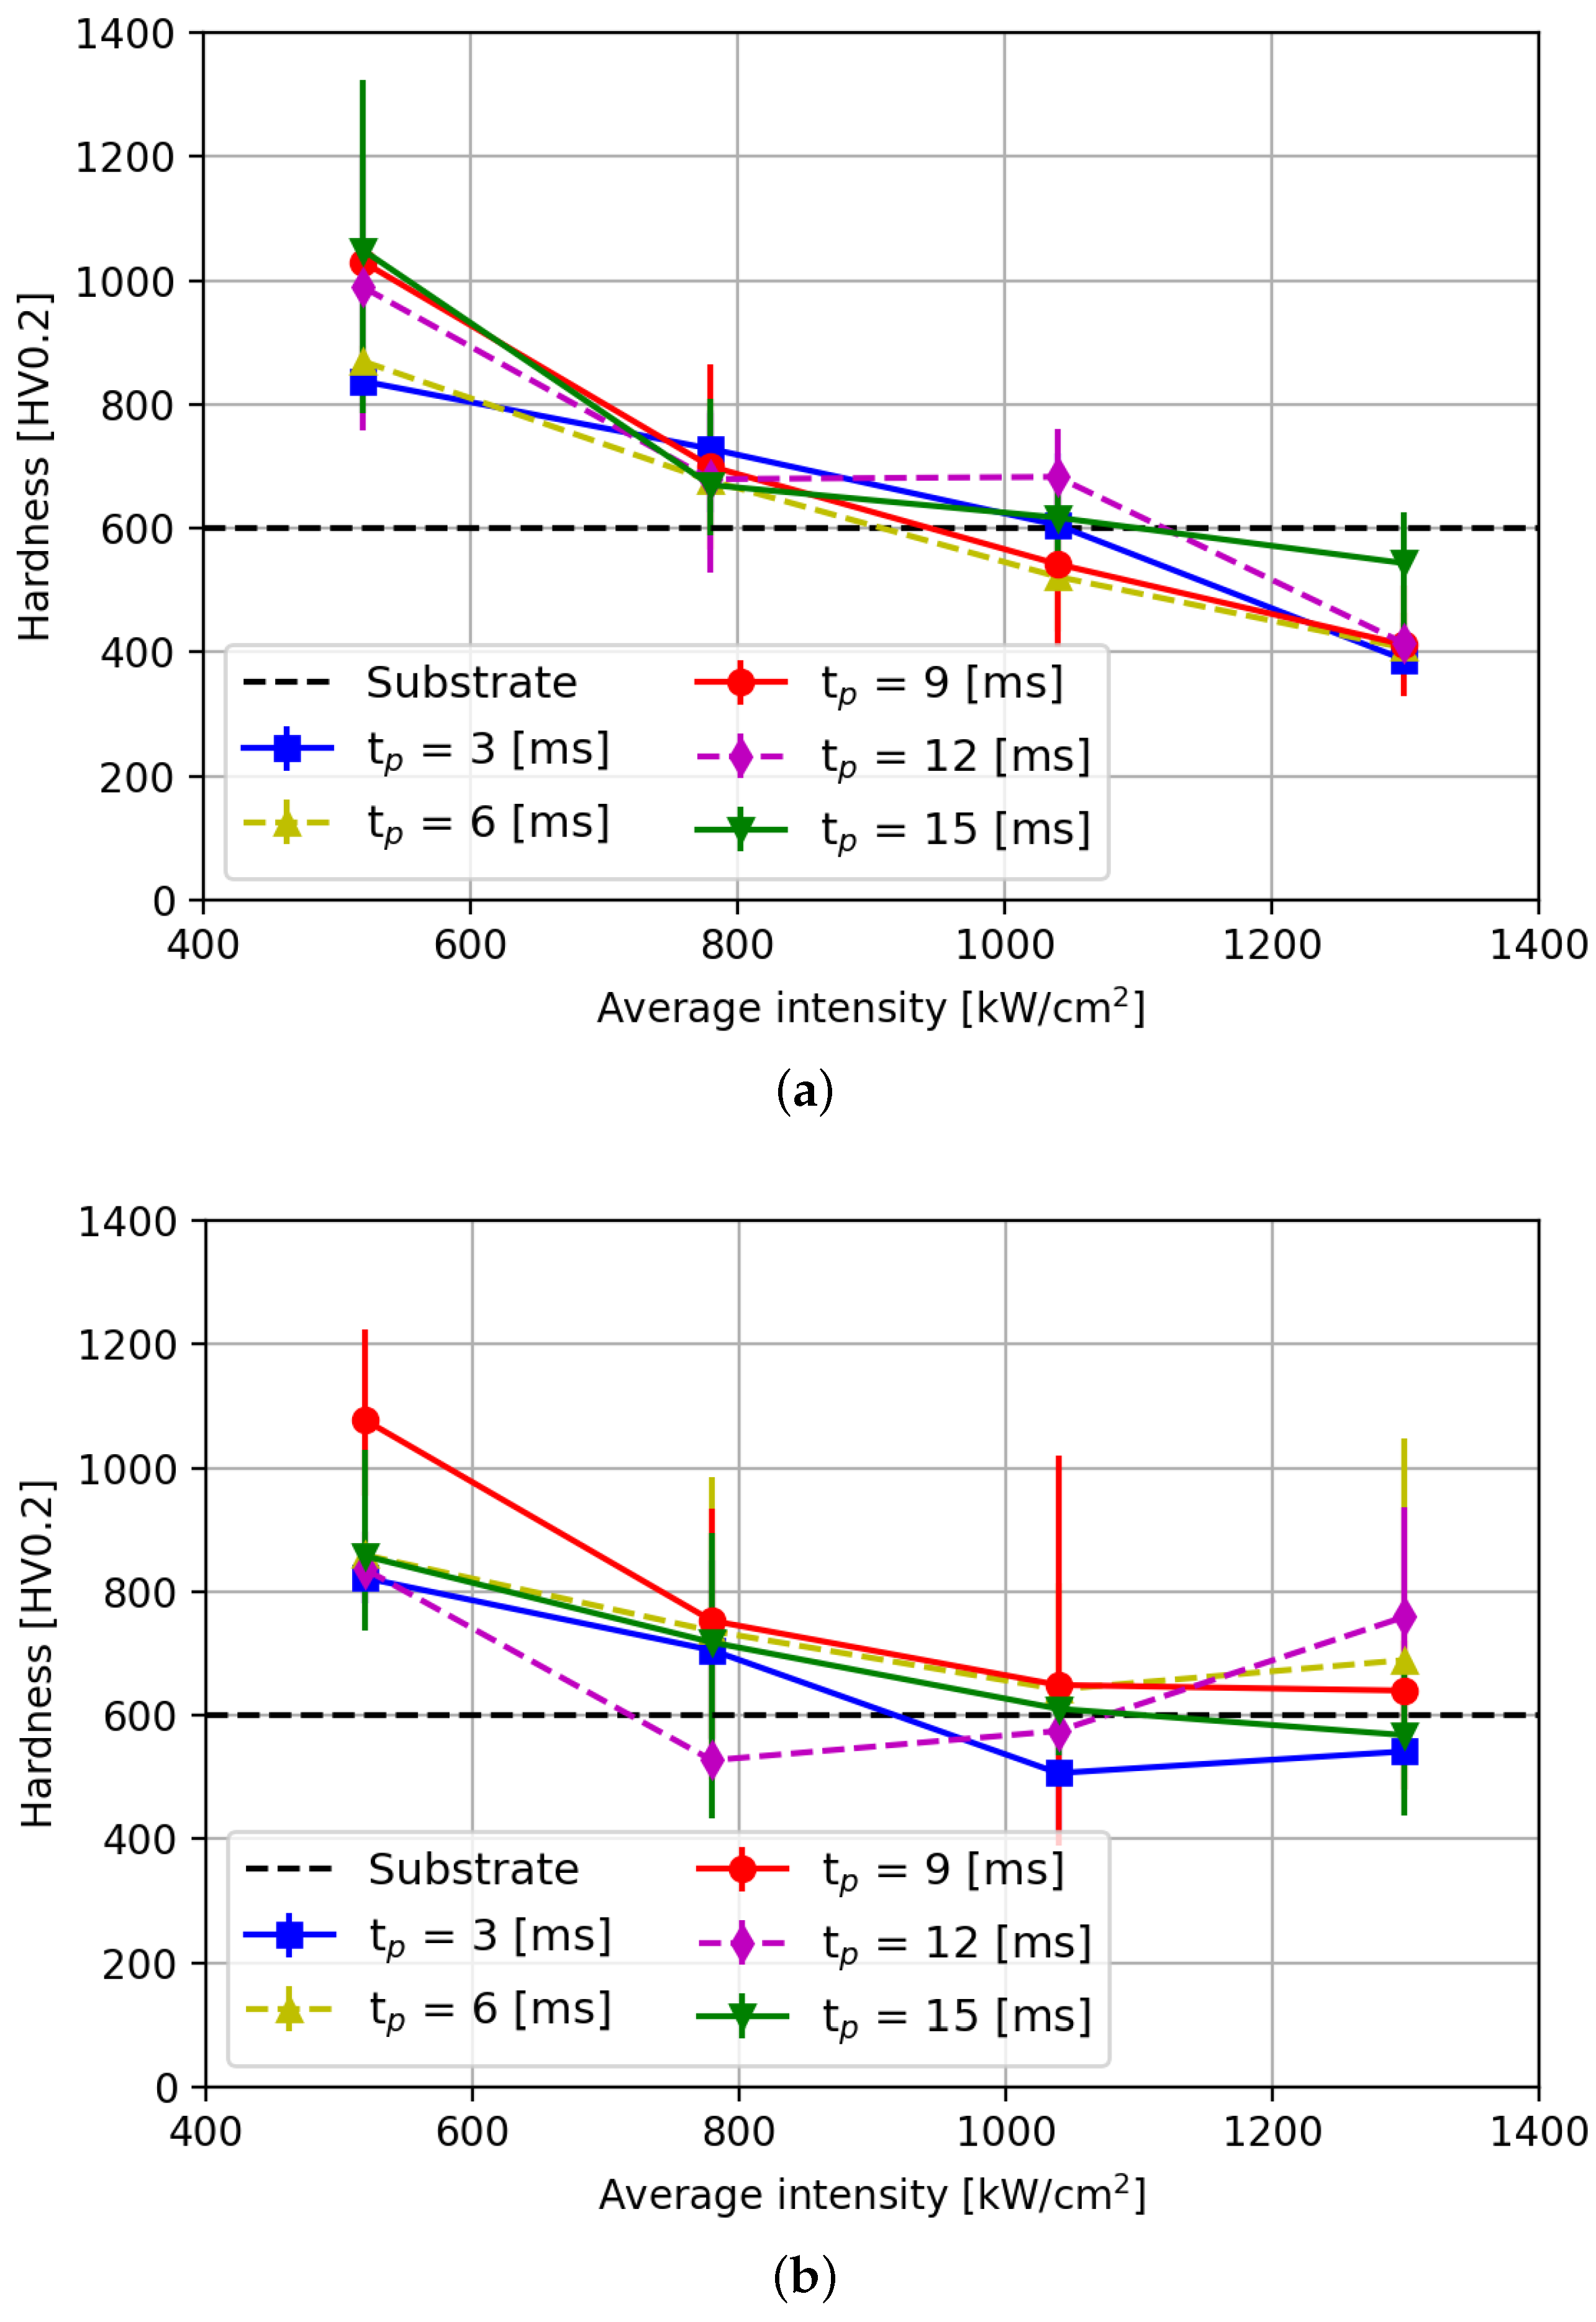
Before implantation, the hardness of the bare substrate was measured and found to equal 600 Hv0.2 (see Table 2). Next, the hardness of the laser–material interaction zone of the substrate was measured. That is, the bare surface, without a powder layer, was melted by exposing it to a laser pulse power of 20 W and a pulse duration of 9 ms using the same spot diameter of 70 μ m. After resolidification, the average hardness of the resulting laser–material interaction zone was found to equal 690 Hv0.2, which is harder than the hardness of the as-received substrate. The increased hardness is due to rapid laser solidification after the laser pulse [28]. Therefore, any hardness in WC implants exceeding 690 Hv0.2 can be attributed to the implantation of WC particles. Figure 13 shows the average hardness measured in the center of the implants using the Leco LM 100.
The average hardness of the implants as high as 1154 Hv0.2 can be achieved with a laser intensity of 500 kW/cm2 and pulse duration of 9 ms or longer. The latter is similar to the hardness values reported by Spranger [26], but with decreased implantation dimensions. As can be concluded from the increasing intensity, the hardness in the center of the implants drops. The latter is attributed to a lower concentration of dissolved WC particles in the center of the implants. The tungsten concentration is the main contribution to the increased hardness of the micro-structure within the implantations [29].
Implants created at laser intensities above 1040 kW/cm2 show a similar or lower hardness than the substrate hardness. This is attributed to the fact that hardness is measured in the center of the implants; and ring-shaped implants have a lower tungsten concentration in their center (see Figure 11b). These centers yield lower hardness than the substrate hardness; this is attributed to annealing of the material and absence of dissolved tungsten [30]. The hardness of the outer diameter is expected to yield similar results to the hardness of implants forming at lower intensity. However, accurate hardness measurements are unfeasible due to the lack of a significant flat surface to preform indentations on.

4. Conclusions

Experimental results of laser dispersing or laser implantation texturing (LITex) using tungsten carbide (WC) particles (d50 = 1.15 μ m) in a 50 μ m powder layer on a tool steel substrate and a Nd:YAG laser (pulse power 20 W to 50 W, pulse duration, 3 ms to 15 ms, focal diameter 70 μ m) were analyzed. Dimensional analysis of the implants showed implant diameters ranging from 64 μ m to 159 μ m, with heights ranging from 1 μ m to 13 μ m. Also from the analysis, the following conclusions are drawn:
  • a laser spot intensity of 500 kW/cm2 creates dome-shaped implants,
  • a laser spot intensity above 500 kW/cm2 yields ring-shaped implants,
  • decreasing the laser pulse power decreases the dimensions of the implants,
  • increasing the laser pulse time increases the dimensions of the implants,
  • and implantation diameters as small as 64 μ m and heights as small as 1 μ m could be produced.
However, the reproducibility of the LITex process reduces if laser pulse powers of more than 30 W are applied. The observed diameters of implants obtained at less than 30 W are smaller than implant dimensions reported in literature. These smaller dimensions are essential for the applicability of LITex as a laser patterning technique in the texturing of skin pass rolls in the steel industry. Micro-hardness measurements of the implants show an average hardness as high as 1152 Hv0.2, which is well above the hardness of 600 Hv0.2 of the virgin tool steel substrate. The higher hardness of the implants is expected contribute to the wear resistance of the steel surface.

Author Contributions

Conceptualization, B.E.; Validation, B.E.; Investigation, B.E.; Writing—original draft, B.E.; Writing—review & editing, G.-W.R. and D.M.; Supervision, G.-W.R. and D.M. All authors have read and agreed to the published version of the manuscript.

Funding

The project has received funding through the Top consortium for Knowledge and Innovation (TKI) program of the Dutch ministry of Economic Affairs. Additionally the authors declare that this study received funding from Tata Steel Nederland Technology B.V. The funder had the following involvement with the study: reviewing of obtained results.

Data Availability Statement

The original contributions presented in the study are included in the article, further inquiries can be directed to the corresponding author.

Conflicts of Interest

The authors declare no conflict of interest.

Abbreviations

The following abbreviations are used in this manuscript:
LITexLaser implantation texturing
SBTShot blast texturing
EDTElectron discharge texturing
ECDElectro-chemical deposition
EBTElectron beam texturing
LTLaser texturing
EDXEnergy dispersive X-Ray
HAZHeat-effected zone
LIZLaser-implanted zone
SEMScanning electron microscopy

References

  1. Hideo, K. Mechanism of Roughness Profile Transfer in Skin-pass Rolling of Thin Steel Strip. In Proceedings of the Engineering, Materials Science 2018, Darmstadt, Germany, 26–28 September 2018. [Google Scholar]
  2. Simão, J.; Aspinwall, D. Hard chromium plating of EDT mill work rolls. J. Mater. Process. Technol. 1999, 92–93, 281–287. [Google Scholar] [CrossRef]
  3. Gorbunov, A.V.; Belov, V.K.; Begletsov, D.O. Texturing of rollers for the production of auto-industry sheet. Steel Transl. 2009, 39, 696. [Google Scholar] [CrossRef]
  4. Thomas, J.; Morgan, B. A review of the development of the use of electro discharge textured and hard chromium plated work rolls within British Steel Strip Products. In Proceedings of the Rolls 2000 Conference; Institute of Materials: Birmingham, UK, 1996; pp. 176–185. [Google Scholar]
  5. Simao, J.; Aspinwall, D.; Wieltsch, M. Electrical Discharge Texturising of Mill Rolls and the Effect of Hard Chromium Plating/TiN Coating on Roll Surface Topography and Integrity. VDI Berichte 1998, 1405, 359–368. [Google Scholar]
  6. Kleinz, H.; Urlberger, H. Hard-chromed work rolls for the production of cold-rolled sheet. Metall. Plant Tech 1992, 6, 76–82. [Google Scholar]
  7. Gaspard, C.; Bolt, H.; Bertrandie, J.; Vanhumbeeck, J.; Evans, G.; Bixquert, F.; Dietsch, H.; Debrabandere, D.; Batazzi, D.; Uijtdebroeks, H.; et al. Substitution of Chrome Plating for the Rolls of Skin-Pass Mill (CRFREEROLLS); Directorate-General for Research and Innovation (European Commission): Brussels, Belgium, 2016. [Google Scholar]
  8. Hilgenberg, K.; Behler, K.; Steinhoff, K. Localized dispersing of ceramic particles in tool steel surfaces by pulsed laser radiation. Appl. Surf. Sci. 2014, 305, 575–580. [Google Scholar] [CrossRef]
  9. Li, N.; Liu, W.; Wang, Y.; Zhao, Z.; Yan, T.; Zhang, G.; Xiong, H. Laser Additive Manufacturing on Metal Matrix Composites: A Review. Chin. J. Mech. Eng. 2021, 34, 38. [Google Scholar] [CrossRef]
  10. Tseng, W.; Aoh, J. Simulation study on laser cladding on preplaced powder layer with a tailored laser heat source. Opt. Laser Technol. 2013, 48, 141–152. [Google Scholar] [CrossRef]
  11. Hilgenberg, K.; Steinhoff, K. Texturing of skin-pass rolls by pulsed laser dispersing. J. Mater. Process. Technol. 2015, 225, 84–92. [Google Scholar] [CrossRef]
  12. Spranger, F.; de Oliveira Lopes, M.; Schirdewahn, S.; Degner, J.; Merklein, M.; Hilgenberg, K. Microstructural evolution and geometrical properties of TiB2 metal matrix composite protrusions on hot work tool steel surfaces manufactured by laser implantation. Int. J. Adv. Manuf. Technol. 2020, 106, 481–501. [Google Scholar] [CrossRef]
  13. Schirdewahn, S.; Carstensen, N.; Hilgenberg, K.; Merklein, M. Laser Implantation of Titanium-Based Particles into Hot Stamping Tools for Improving the Tribological Performance During Hot Sheet Metal Forming. In Proceedings of the 14th International Conference on the Technology of Plasticity—Current Trends in the Technology of Plasticity, Napoule, France, 24–29 September 2023; pp. 301–309. [Google Scholar] [CrossRef]
  14. Uddeholm. Uddeholm Rigor. Available online: https://www.uddeholm.com/app/uploads/sites/49/2017/09/Tech-Uddeholm-Rigor-EN.pdf (accessed on 5 June 2024).
  15. Kron, P. Verschleissschutz Durch Laseroberflächenbehandlung von Kalt- und Warmarbeitsstählen. Ph.D. Thesis, RWTH Aachen University, Aachen, Germany, 1996. [Google Scholar]
  16. Sigma-Aldrich. Product Specification Tungsten Carbide. Available online: https://www.sigmaaldrich.com/specification-sheets/340/429/241881-BULK_______ALDRICH__.pdf (accessed on 3 April 2024).
  17. Lengauer, W. Transition Metal Carbides, Nitrides, and Carbonitrides. In Handbook of Ceramic Hard Materials; John Wiley & Sons, Inc.: Hoboken, NJ, USA, 2000. [Google Scholar] [CrossRef]
  18. Munro, R. Material Properties of Titanium Diboride. J. Res. Natl. Inst. Stand. Technol. 2000, 105, 709. [Google Scholar] [CrossRef] [PubMed]
  19. Mowital, K. Mowital B Technical Data Sheet. Available online: https://www.mowital.com/fileadmin/Dateien/TDS_Mowital_R__B__BA__G__SB/TDS_Mowital_B-EN.pdf (accessed on 5 March 2024).
  20. Evans, D.; Wennerström, H. The Colloidal Domain: Where Physics, Chemistry, Biology, and Technology Meet; VCH Publishers: Weinheim, Germany, 1994. [Google Scholar]
  21. Hilgenberg, K.; Spranger, F.; Bachmann, M. Localized laser dispersing of titanium-di-boride with pulsed fiber laser. In Proceedings of the ICALEO 2017: 36th International Congress on Applications of Lasers & Electro-Optics, Atlanta, GA, USA, 22–26 October 2017. [Google Scholar] [CrossRef]
  22. Hibiya, T.; Ozawa, S. Marangoni Flow and Surface Tension of High Temperature Melts. In High-Temperature Measurements of Materials; Fukuyama, H., Waseda, Y., Eds.; Springer: Berlin/Heidelberg, Germany, 2009; pp. 39–59. [Google Scholar] [CrossRef]
  23. Le, T.N.; Lo, Y.L. Effects of sulfur concentration and Marangoni convection on melt-pool formation in transition mode of selective laser melting process. Mater. Des. 2019, 179, 107866. [Google Scholar] [CrossRef]
  24. Spranger, F.; Hilgenberg, K. Dispersion behavior of TiB2 particles in AISI D2 tool steel surfaces during pulsed laser dispersing and their influence on material properties. Appl. Surf. Sci. 2018, 467–468, 493–504. [Google Scholar] [CrossRef]
  25. Schirdewahn, S.; Spranger, F.; Hilgenberg, K.; Merklein, M. Localized dispersing of TiB2 and TiN particles via pulsed laser radiation for improving the tribological performance of hot stamping tools. Procedia CIRP 2020, 94, 901–904. [Google Scholar] [CrossRef]
  26. Spranger, F.; Hilgenberg, K. Laser Implantation: An Innovative Technique for Surface Texturing. PhotonicsViews 2019, 16, 38–41. [Google Scholar] [CrossRef]
  27. Spranger, F.; Schirdewahn, S.; de Oliveira Lopes, M.; Merklein, M.; Hilgenberg, K. Investigations on TaC Localized Dispersed X38CrMoV5-3 Surfaces with Regard to the Manufacturing of Wear Resistant Protruded Surface Textures. Lasers Manuf. Mater. Process. 2020, 7, 38–58. [Google Scholar] [CrossRef]
  28. Vilar, R.; Colaço, R.; Almeida, A. Laser Surface Treatment of Tool Steels. Opt. Quantum Electron. 1995, 27, 1273–1289. [Google Scholar] [CrossRef]
  29. Peng, Y.; Zhang, W.; Li, T.; Zhang, M.; Liu, B.; Liu, Y.; Wang, L.; Hu, S. Effect of WC content on microstructures and mechanical properties of FeCoCrNi high-entropy alloy/WC composite coatings by plasma cladding. Surf. Coat. Technol. 2020, 385, 125326. [Google Scholar] [CrossRef]
  30. Huber, F.; Bischof, C.; Hentschel, O.; Heberle, J.; Zettl, J.; Nagulin, K.Y.; Schmidt, M. Laser beam melting and heat-treatment of 1.2343 (AISI H11) tool steel –microstructure and mechanical properties. Mater. Sci. Eng. A 2019, 742, 109–115. [Google Scholar] [CrossRef]
Figure 1. Schematic representation of the various steps in the laser implantation process: (a) application of a powder layer, (b) application of a powder layer and (c) removal of excess powder.
Micromachines 15 00958 g001
Figure 2. Schematic representation laser implantation setup.
Micromachines 15 00958 g002
Figure 3. Characteristics of ceramic particles. (a) Particle-size distribution of WC and TiB2 powder (measured with Sympatec HELOS (H4766) and RODOS/T4, R2+R4 l). (b) SEM micrograph of WC. (c) SEM micrograph of TiB2.
Micromachines 15 00958 g003aMicromachines 15 00958 g003b
Figure 4. Paths used for height determination of implants using confocal microscopy images. (a) Average height determined along cross paths for dome-shaped implants. (b) Average height determined along circle path for ring shaped implants.
Micromachines 15 00958 g004
Figure 5. Confocal microscopy images of WC implants, H l = 75 μ m, pulse time tp = 6 ms. (a) Dome shape obtained at 20 W. (b) Ring shape obtained at 40 W. (c) Failed obtained at 60 W. (d) Dome shape obtained at 20 W. (e) Ring shape obtained at 40 W. (f) Failed obtained at 60 W.
Micromachines 15 00958 g005
Figure 6. SEM micrographs of TiB2 implants after the cleaning step, t p = 3 ms, pulse power = 30 W. (a) Implant using H l = 75 μ m. (b) Implant using H l = 50 μ m.
Micromachines 15 00958 g006
Figure 7. SEM micrographs of WC implants, layer height H l = 50 μ m and pulse time t p = 3 ms. (a) Pulse power = 20 W. (b) Pulse power = 50 W.
Micromachines 15 00958 g007
Figure 8. Measured mean diameters of WC implants as function of average laser intensity. (a) Layer height H L = 50 μ m. (b) Layer height H L = 75 μ m.
Micromachines 15 00958 g008
Figure 9. Measured mean height of WC implants as function of average laser intensity. (a) Layer height H L = 50 μ m. (b) Layer height H L = 75 μ m.
Micromachines 15 00958 g009
Figure 10. SEM micrograph (top view) showing the diameters of WC implants (pulse power = 30 W and layer H L = 50 μ m) to different pulse durations. The red dotted circle indicates the laser spot. (a) t p = 3 ms, dome shaped. (b) t p = 9 ms, ring shaped.
Micromachines 15 00958 g010
Figure 11. EDX micrograph (top view) showing tungsten concentration at the surface pulse power = 30 W. Same implants as Figure 10. (a) t p = 3 ms, dome shaped. (b) t p = 9 ms, ring shaped.
Micromachines 15 00958 g011
Figure 12. SEM micrograph and EDX cross-section of a dome-shaped implant, pulse power = 30 W, t p = 3 ms, and layer H L = 50 μ m. (a) SEM micrograph cross-section, the white dotted line indicates the perimeter of the LIZ. (b) EDX micrograph cross-section.
Micromachines 15 00958 g012
Figure 13. Measured micro-hardness of implants as function of the average laser intensity. The black dashed line indicates the hardness of the bare substrate. (a) Layer height H L = 50 μ m. (b) Layer height H L = 75 μ m.
Micromachines 15 00958 g013
Table 1. Chemical composition substrate material in wt.% [14].
CSiMnCrMoV
1%0.3%0.16%5.3%1.1%0.2%
Table 2. Material properties substrate [14,15].
X100CrMoV5
Density [kg/m3]7860
Melting point [°C]1424
Hardness [Hv]600
Table 3. Properties of ceramic powders [16,17,18] and binder [19].
WCTiB2Mowital 30H
Specified particle size d50 [ μ m]210-
Measured d50 [ μ m]1.154.23-
Density [kg/m3]156045201080
Hardness [Hv]22003400-
Melting point [°C]27853230165
Table 4. Experimental laser-processing parameters.
WCTiB2
Layer height [ μ m]50, 7550, 75
Laser pulse duration [ms]3–203–20
Laser pulse power [W]20–5020–50
Laser spot diameter [ μ m]7070
Average laser intensity [kW/cm2]520–1300520–1300
Table 5. Quantitative analysis of EDX cross-section in Figure 12b.
ElementFeWCCrMoSiVCa
wt.%75.69.29.14.60.90.30.20.1
Disclaimer/Publisher’s Note: The statements, opinions and data contained in all publications are solely those of the individual author(s) and contributor(s) and not of MDPI and/or the editor(s). MDPI and/or the editor(s) disclaim responsibility for any injury to people or property resulting from any ideas, methods, instructions or products referred to in the content.