
The Differential Clinical Impacts of Cachexia and Sarcopenia on the Prognosis of Advanced Pancreatic Cancer

 , ,
, ,
Abstract
:Simple Summary
Abstract
1. Introduction
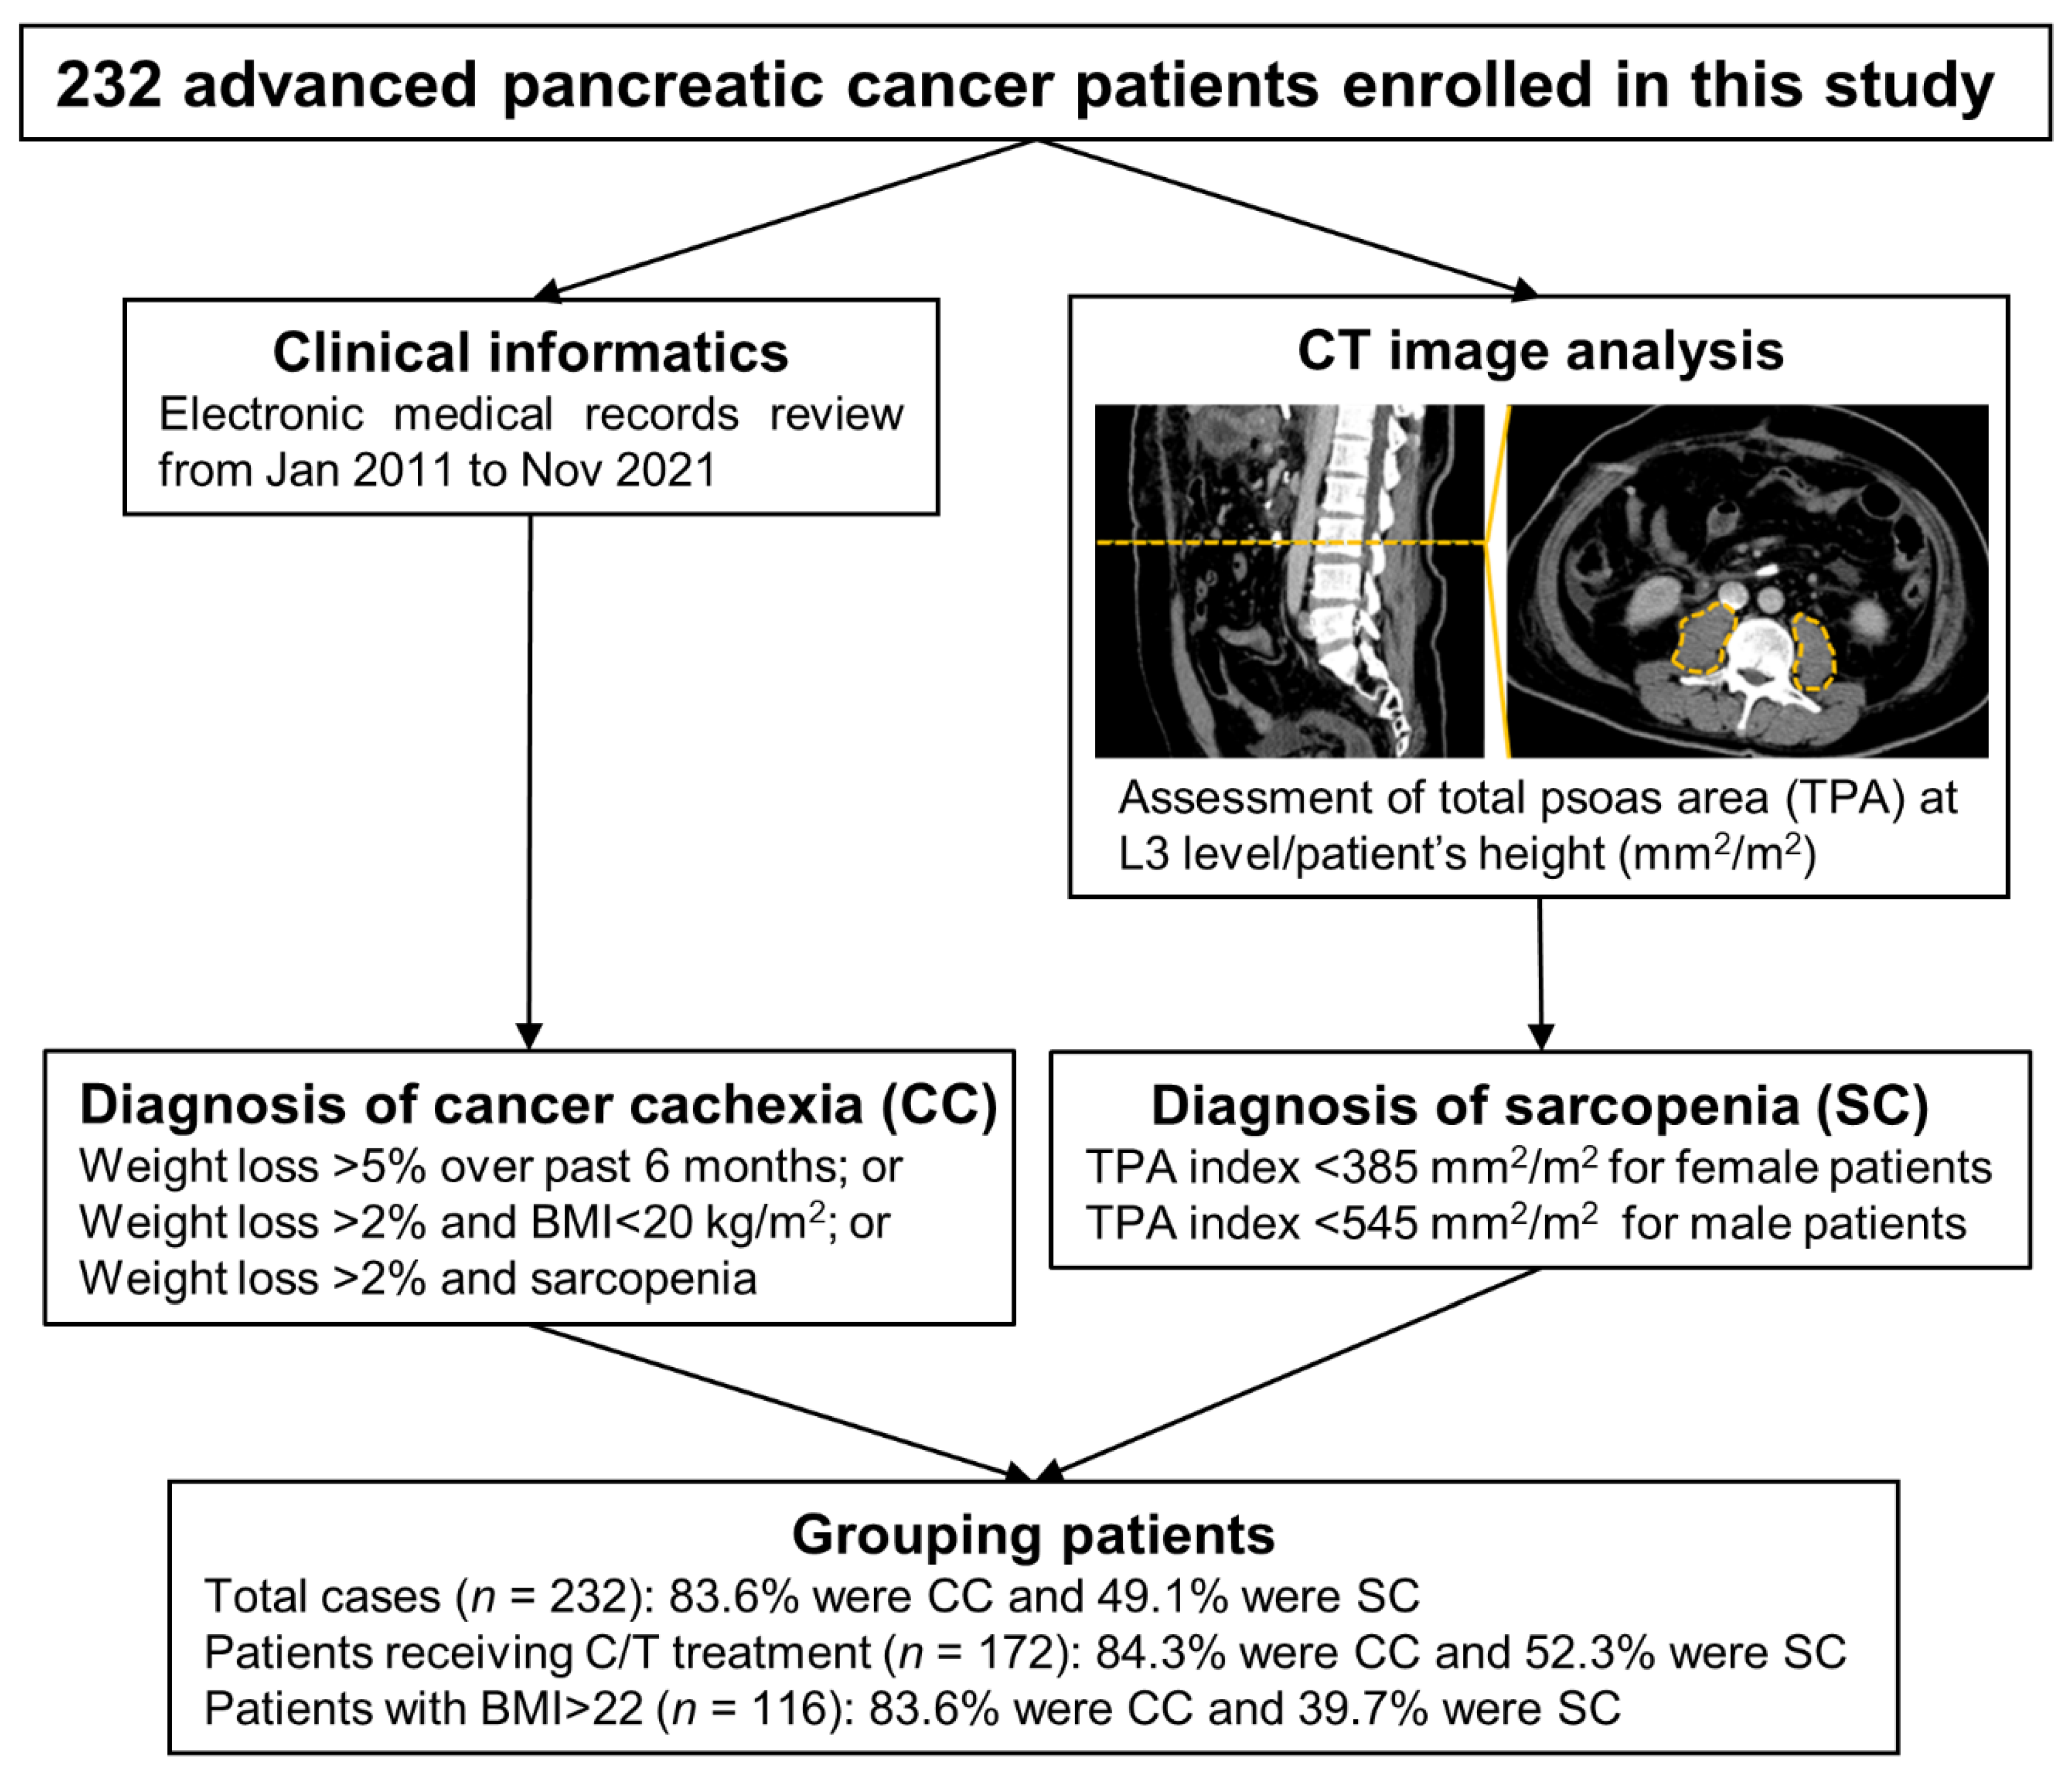
2. Materials and Methods
2.1. Clinical Informatics Collection and CC or SC Definition
2.2. Computed Tomography (CT) Image Analysis and TPA Index Calculation
2.3. Overlap Assessment of CC, SC, and Their Associated Factors
2.4. Statistical Analysis
3. Results
3.1. Survival Rates in Advanced PC Patients According to Clinical and Pathological Characteristics
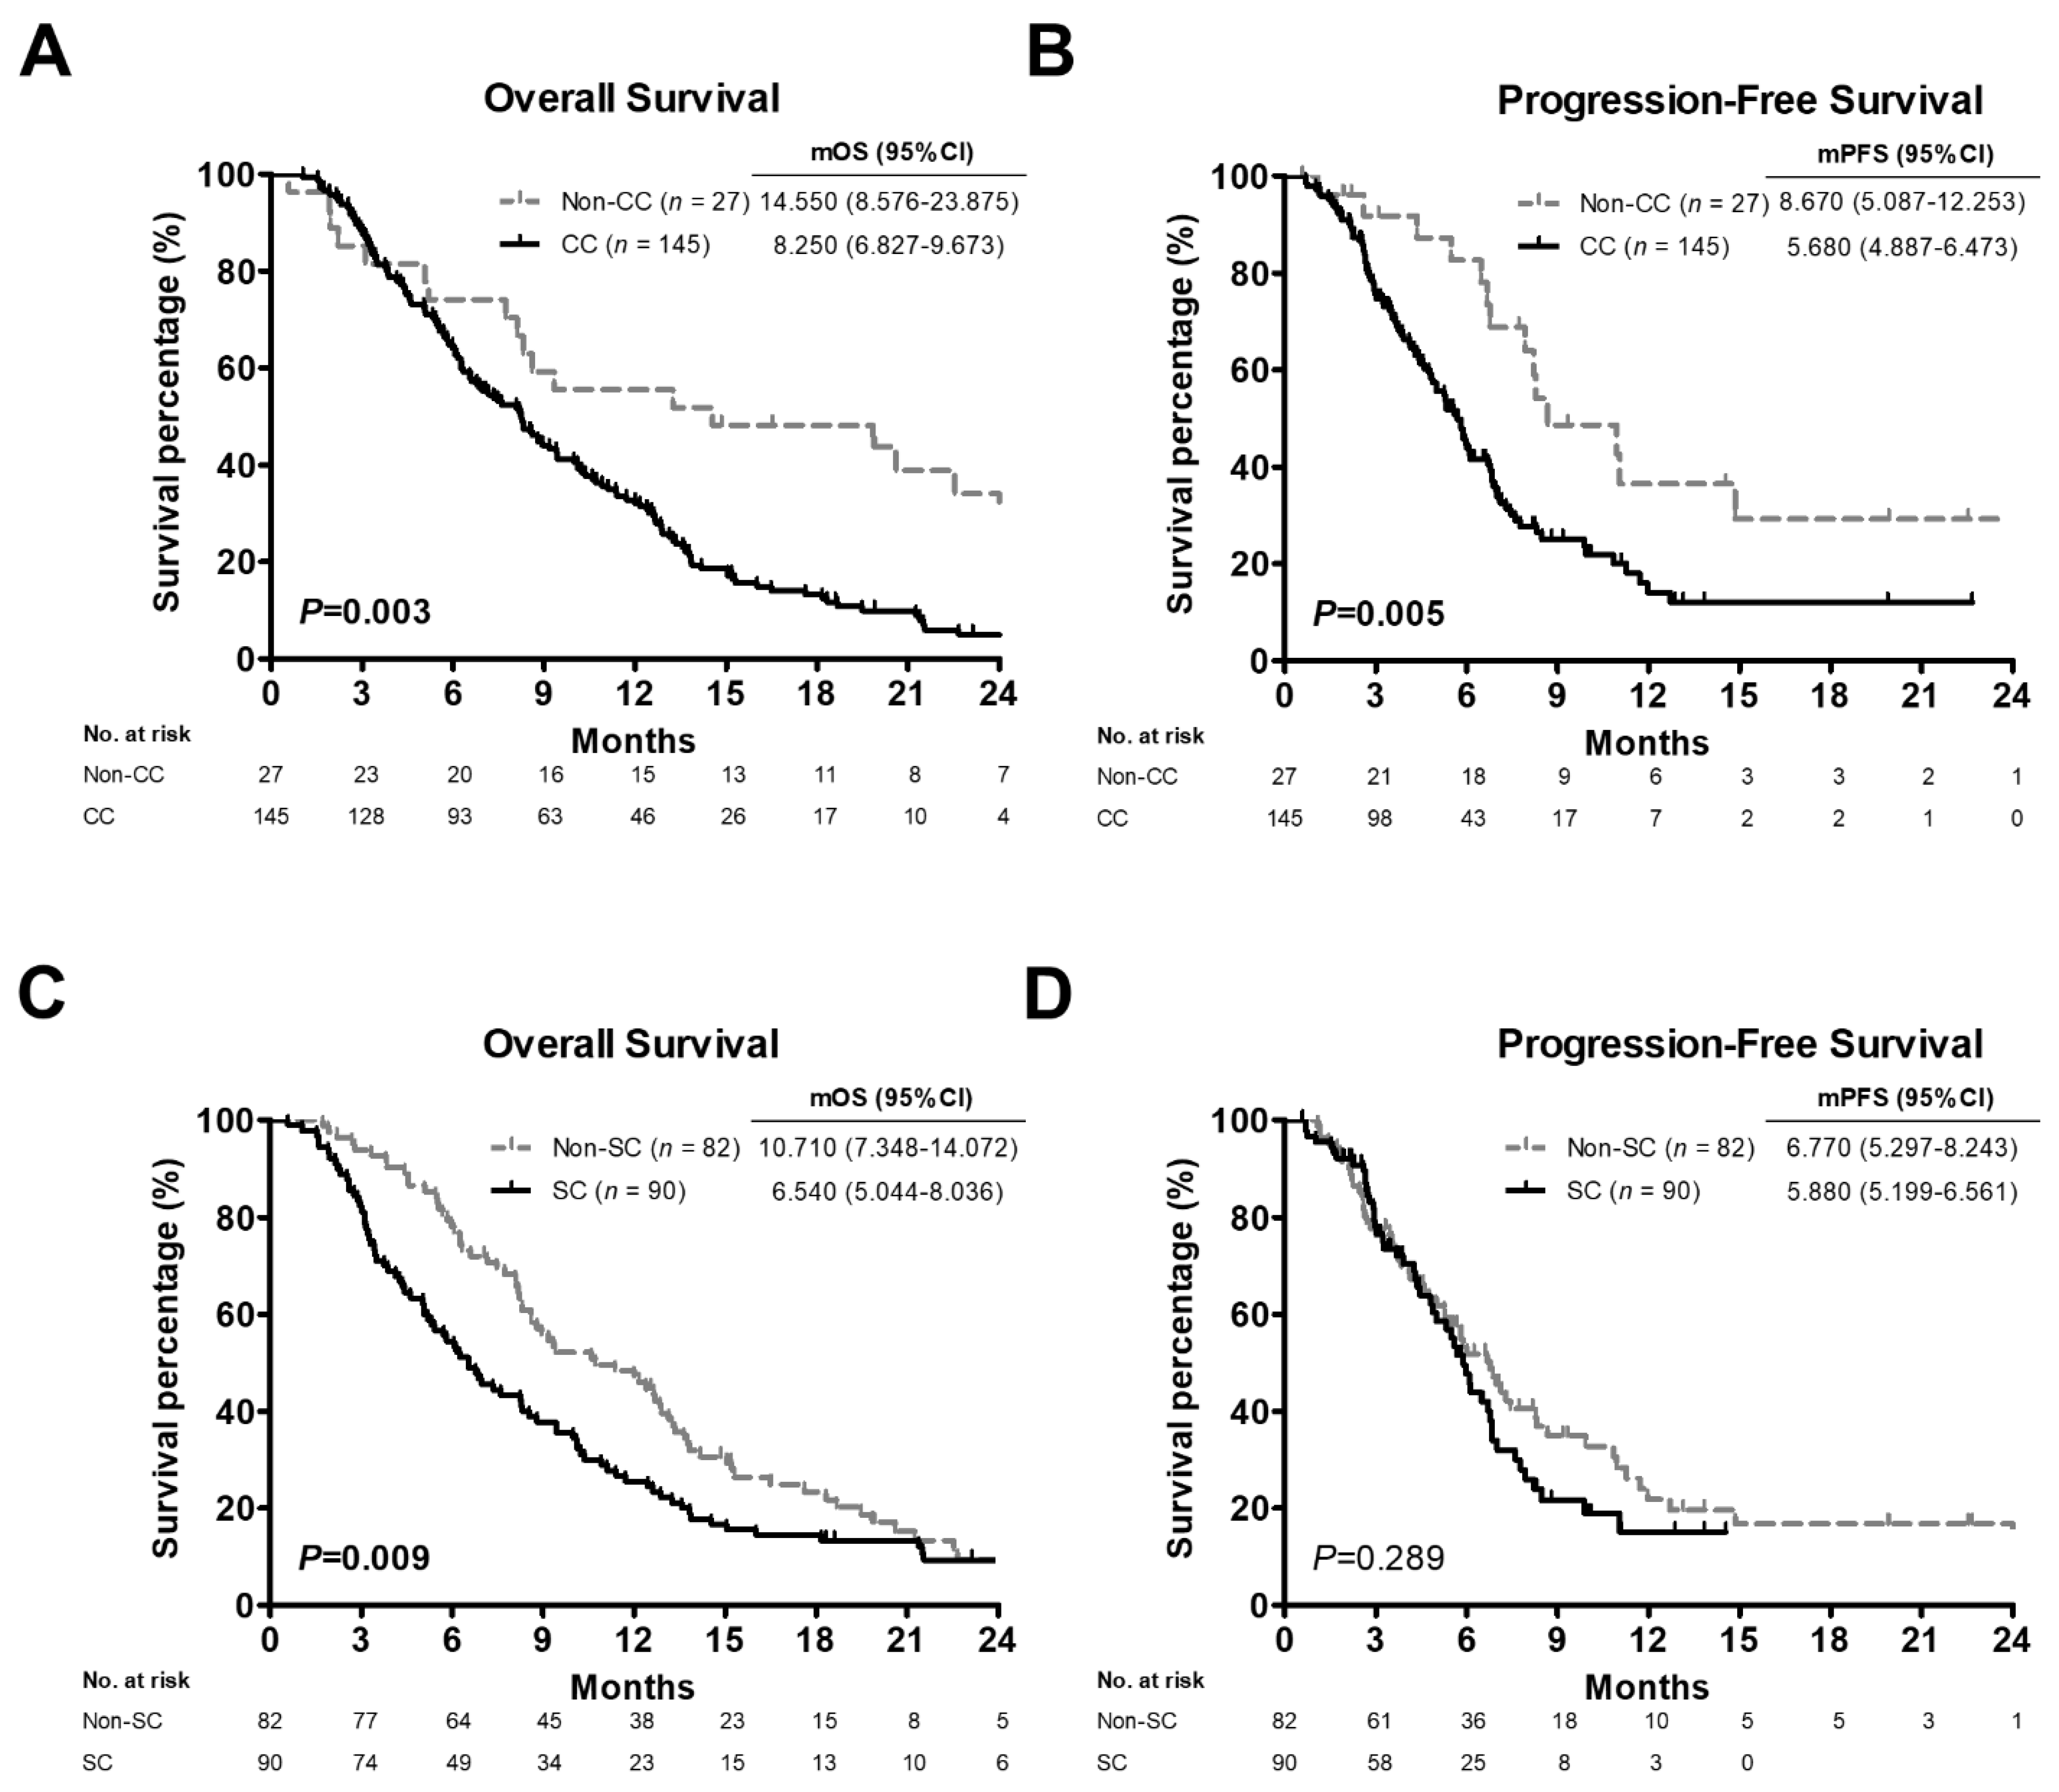
3.2. Comparison of Survival Outcomes among Advanced PC Patients, Patients with C/T Treatment or High BMI Values Stratified by CC or SC Status
3.3. Comparison of Clinical Characteristics and Significance Levels Based on CC and SC
3.4. Prognostic Significance of Clinical Factors and CC or SC Presence
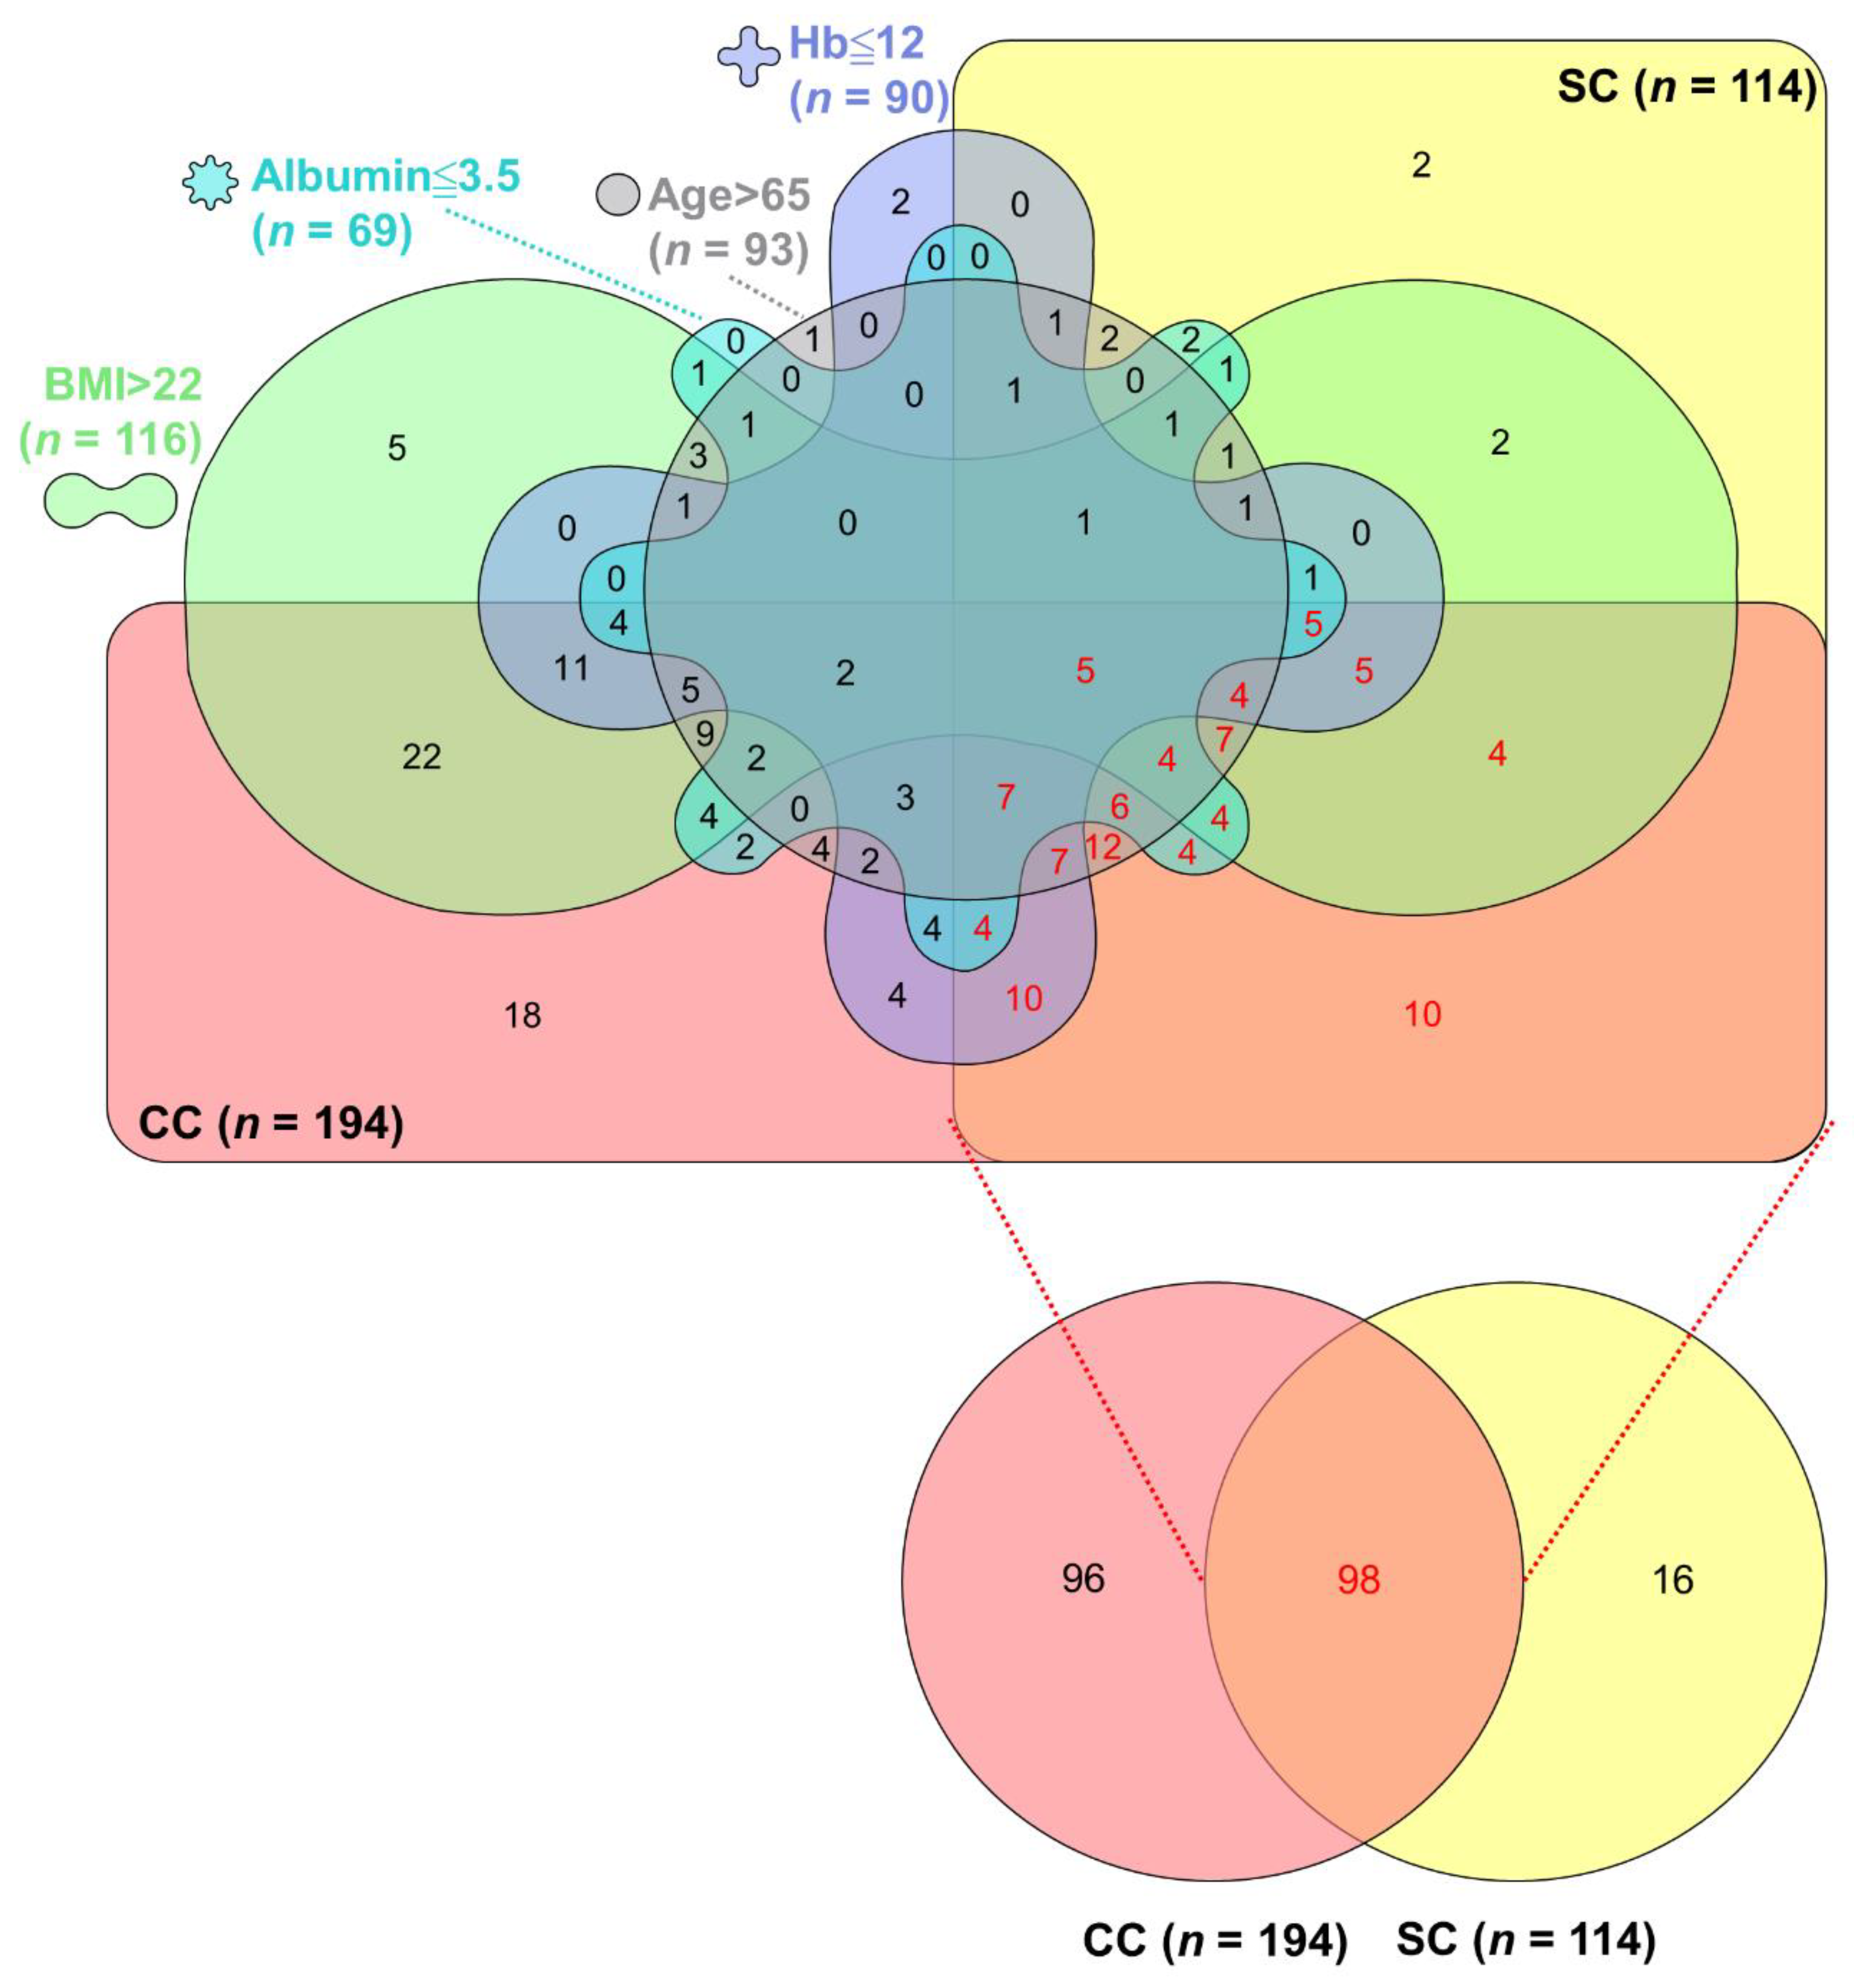
3.5. Overlaps among CC, SC, and Their Associated Factors in Advanced PC
4. Discussion
5. Conclusions
Author Contributions
Funding
Institutional Review Board Statement
Informed Consent Statement
Data Availability Statement
Acknowledgments
Conflicts of Interest
Abbreviations
| BMI | body mass index |
| C/T | chemotherapy |
| C/T + local R/T | combined chemotherapy and local radiotherapy |
| CA19-9 | carbohydrate antigen 19-9 |
| CC | cancer cachexia |
| CI | confidence interval |
| CS + adj | conversion surgery with pre- or post-operative adjuvant chemotherapy |
| CT | computed tomography |
| EMRs | electronic medical records |
| Hb | hemoglobin |
| HR | hazard ratio |
| HU | hounsfield unit |
| IRB | Institutional Review Board |
| L3 | the third lumbar vertebrae |
| mOS | median overall survival |
| mPFS | median progression-free survival |
| Non-CC | negative cancer cachexia status |
| Non-SC | negative sarcopenia status |
| OR | odds ratio |
| OS | overall survival |
| PC | pancreatic cancer |
| PFS | progression-free survival |
| SC | sarcopenia |
| SO | sarcopenic obesity |
| TPA | total psoas area |
References
- Sung, H.; Ferlay, J.; Siegel, R.L.; Laversanne, M.; Soerjomataram, I.; Jemal, A.; Bray, F. Global Cancer Statistics 2020: GLOBOCAN Estimates of Incidence and Mortality Worldwide for 36 Cancers in 185 Countries. CA Cancer J. Clin. 2021, 71, 209–249. [Google Scholar] [CrossRef] [PubMed]
- Parkin, D.M. Global cancer statistics in the year 2000. Lancet Oncol. 2001, 2, 533–543. [Google Scholar] [CrossRef]
- Ducreux, M.; Cuhna, A.S.; Caramella, C.; Hollebecque, A.; Burtin, P.; Goéré, D.; Seufferlein, T.; Haustermans, K.; Van Laethem, J.L.; Conroy, T.; et al. Cancer of the pancreas: ESMO Clinical Practice Guidelines for diagnosis, treatment and follow-up. Ann. Oncol. 2015, 26 (Suppl. S5), v56–v68. [Google Scholar] [CrossRef]
- Baracos, V.E.; Martin, L.; Korc, M.; Guttridge, D.C.; Fearon, K.C.H. Cancer-associated cachexia. Nat. Rev. Dis. Prim. 2018, 4, 17105. [Google Scholar] [CrossRef] [PubMed]
- Argiles, J.M.; Busquets, S.; Stemmler, B.; López-Soriano, F.J. Cancer cachexia: Understanding the molecular basis. Nat. Cancer 2014, 14, 754–762. [Google Scholar] [CrossRef] [PubMed]
- Larsson, L.; Degens, H.; Li, M.; Salviati, L.; Lee, Y.I.; Thompson, W.; Kirkland, J.L.; Sandri, M. Sarcopenia: Aging-Related Loss of Muscle Mass and Function. Physiol. Rev. 2019, 99, 427–511. [Google Scholar] [CrossRef]
- Fearon, K.C. Cancer Cachexia and Fat–Muscle Physiology. N. Engl. J. Med. 2011, 365, 565–567. [Google Scholar] [CrossRef]
- Ryan, A.M.; Sullivan, E.S. Impact of musculoskeletal degradation on cancer outcomes and strategies for management in clinical practice. Proc. Nutr. Soc. 2020, 80, 73–91. [Google Scholar] [CrossRef] [PubMed]
- Hou, Y.-C.; Wang, C.-J.; Chao, Y.-J.; Chen, H.-Y.; Wang, H.-C.; Tung, H.-L.; Lin, J.-T.; Shan, Y.-S. Elevated Serum Interleukin-8 Level Correlates with Cancer-Related Cachexia and Sarcopenia: An Indicator for Pancreatic Cancer Outcomes. J. Clin. Med. 2018, 7, 502. [Google Scholar] [CrossRef] [PubMed] [Green Version]
- Shachar, S.S.; Williams, G.R.; Muss, H.B.; Nishijima, T.F. Prognostic value of sarcopenia in adults with solid tumours: A meta-analysis and systematic review. Eur. J. Cancer 2016, 57, 58–67. [Google Scholar] [CrossRef] [PubMed]
- Mintziras, I.; Miligkos, M.; Wächter, S.; Manoharan, J.; Maurer, E.; Bartsch, D.K. Sarcopenia and sarcopenic obesity are significantly associated with poorer overall survival in patients with pancreatic cancer: Systematic review and meta-analysis. Int. J. Surg. 2018, 59, 19–26. [Google Scholar] [CrossRef] [PubMed]
- Bossi, P.; Delrio, P.; Mascheroni, A.; Zanetti, M. The Spectrum of Malnutrition/Cachexia/Sarcopenia in Oncology According to Different Cancer Types and Settings: A Narrative Review. Nutrients 2021, 13, 1980. [Google Scholar] [CrossRef] [PubMed]
- Laird, B.; Fallon, M. Treating cancer cachexia: An evolving landscape. Ann. Oncol. 2017, 28, 2055–2056. [Google Scholar] [CrossRef]
- Schneider, S.M.; Correia, M.I.T. Epidemiology of weight loss, malnutrition and sarcopenia: A transatlantic view. Nutrition 2019, 69, 110581. [Google Scholar] [CrossRef]
- Schwarz, S.; Prokopchuk, O.; Esefeld, K.; Gröschel, S.; Bachmann, J.; Lorenzen, S.; Friess, H.; Halle, M.; Martignoni, M.E. The clinical picture of cachexia: A mosaic of different parameters (experience of 503 patients). BMC Cancer 2017, 17, 130. [Google Scholar] [CrossRef] [PubMed] [Green Version]
- Fearon, K.; Strasser, F.; Anker, S.D.; Bosaeus, I.; Bruera, E.; Fainsinger, R.L.; Jatoi, A.; Loprinzi, C.; MacDonald, N.; Mantovani, G.; et al. Definition and classification of cancer cachexia: An international consensus. Lancet Oncol. 2011, 12, 489–495. [Google Scholar] [CrossRef]
- Prado, C.M.; Lieffers, J.R.; McCargar, L.J.; Reiman, T.; Sawyer, M.B.; Martin, L.; Baracos, V.E. Prevalence and clinical implications of sarcopenic obesity in patients with solid tumours of the respiratory and gastrointestinal tracts: A population-based study. Lancet Oncol. 2008, 9, 629–635. [Google Scholar] [CrossRef]
- Heberle, H.; Meirelles, G.V.; Da Silva, F.R.; Telles, G.P.; Minghim, R. InteractiVenn: A Web-Based Tool for the Analysis of Sets through Venn Diagrams. BMC Bioinform. 2015, 16, 169. [Google Scholar] [CrossRef] [PubMed]
- Pin, F.; Barreto, R.; Couch, M.E.; Bonetto, A.; O’Connell, T.M. Cachexia induced by cancer and chemotherapy yield distinct perturbations to energy metabolism. J. Cachex- Sarcopenia Muscle 2019, 10, 140–154. [Google Scholar] [CrossRef] [Green Version]
- Campelj, D.; Goodman, C.; Rybalka, E. Chemotherapy-Induced Myopathy: The Dark Side of the Cachexia Sphere. Cancers 2021, 13, 3615. [Google Scholar] [CrossRef]
- Ninomiya, G.; Fujii, T.; Yamada, S.; Yabusaki, N.; Suzuki, K.; Iwata, N.; Kanda, M.; Hayashi, M.; Tanaka, C.; Nakayama, G.; et al. Clinical impact of sarcopenia on prognosis in pancreatic ductal adenocarcinoma: A retrospective cohort study. Int. J. Surg. 2017, 39, 45–51. [Google Scholar] [CrossRef]
- Kordes, M.; Larsson, L.; Engstrand, L.; Löhr, J.-M. Pancreatic cancer cachexia: Three dimensions of a complex syndrome. Br. J. Cancer 2021, 124, 1623–1636. [Google Scholar] [CrossRef]
- Daly, L.; Prado, C.M.; Ryan, A.M. A window beneath the skin: How computed tomography assessment of body composition can assist in the identification of hidden wasting conditions in oncology that profoundly impact outcomes. Proc. Nutr. Soc. 2018, 77, 135–151. [Google Scholar] [CrossRef] [PubMed]
- Zalite, I.O.; Zykus, R.; Gonzalez, M.F.; Saygili, F.; Pukitis, A.; Gaujoux, S.; Charnley, R.; Lyadov, V. Influence of cachexia and sarcopenia on survival in pancreatic ductal adenocarcinoma: A systematic review. Pancreatology 2015, 15, 19–24. [Google Scholar] [CrossRef] [PubMed]
- Hendifar, A.E.; Chang, J.I.; Huang, B.Z.; Tuli, R.; Wu, B.U. Cachexia, and not obesity, prior to pancreatic cancer diagnosis worsens survival and is negated by chemotherapy. J. Gastrointest. Oncol. 2018, 9, 17–23. [Google Scholar] [CrossRef] [PubMed] [Green Version]
- Cruz-Jentoft, A.J.; Baeyens, J.P.; Bauer, J.M.; Boirie, Y.; Cederholm, T.; Landi, F.; Martin, F.C.; Michel, J.-P.; Rolland, Y.; Schneider, S.M.; et al. Sarcopenia: European consensus on definition and diagnosis: Report of the European Working Group on Sarcopenia in Older People. Age Ageing 2010, 39, 412–423. [Google Scholar] [CrossRef] [PubMed] [Green Version]
- Uemura, S.; Iwashita, T.; Ichikawa, H.; Iwasa, Y.; Mita, N.; Shiraki, M.; Shimizu, M. The impact of sarcopenia and decrease in skeletal muscle mass in patients with advanced pancreatic cancer during FOLFIRINOX therapy. Br. J. Nutr. 2020, 125, 1140–1147. [Google Scholar] [CrossRef] [PubMed]
- Kays, J.K.; Shahda, S.; Stanley, M.; Bell, T.; O’Neill, B.H.; Kohli, M.D.; Couch, M.E.; Koniaris, L.G.; Zimmers, T.A. Three cachexia phenotypes and the impact of fat-only loss on survival in FOLFIRINOX therapy for pancreatic cancer. J. Cachex- Sarcopenia Muscle 2018, 9, 673–684. [Google Scholar] [CrossRef] [PubMed]
- Kurita, Y.; Kobayashi, N.; Tokuhisa, M.; Goto, A.; Kubota, K.; Endo, I.; Nakajima, A.; Ichikawa, Y. Sarcopenia is a reliable prognostic factor in patients with advanced pancreatic cancer receiving FOLFIRINOX chemotherapy. Pancreatology 2018, 19, 127–135. [Google Scholar] [CrossRef] [PubMed]
- Dalal, S.; Hui, D.; Bidaut, L.; Lem, K.; Del Fabbro, E.; Crane, C.; Reyes-Gibby, C.C.; Bedi, D.; Bruera, E. Relationships Among Body Mass Index, Longitudinal Body Composition Alterations, and Survival in Patients With Locally Advanced Pancreatic Cancer Receiving Chemoradiation: A Pilot Study. J. Pain Symptom Manag. 2012, 44, 181–191. [Google Scholar] [CrossRef]
- Facciorusso, A.; Antonino, M.; Muscatiello, N. Sarcopenia represents a negative prognostic factor in pancreatic cancer patients undergoing EUS celiac plexus neurolysis. Endosc. Ultrasound 2020, 9, 238–244. [Google Scholar] [CrossRef] [PubMed]
- Basile, D.; Parnofiello, A.; Vitale, M.G.; Cortiula, F.; Gerratana, L.; Fanotto, V.; Lisanti, C.; Pelizzari, G.; Ongaro, E.; Bartoletti, M.; et al. The IMPACT study: Early loss of skeletal muscle mass in advanced pancreatic cancer patients. J. Cachex- Sarcopenia Muscle 2019, 10, 368–377. [Google Scholar] [CrossRef] [PubMed] [Green Version]
- Kim, I.-H.; Choi, M.H.; Lee, I.S.; Hong, T.H.; Lee, M.A. Clinical significance of skeletal muscle density and sarcopenia in patients with pancreatic cancer undergoing first-line chemotherapy: A retrospective observational study. BMC Cancer 2021, 21, 1–9. [Google Scholar] [CrossRef] [PubMed]
- Tan, B.H.; Birdsell, L.A.; Martin, L.; Baracos, V.E.; Fearon, K.C. Sarcopenia in an Overweight or Obese Patient Is an Adverse Prognostic Factor in Pancreatic Cancer. Clin. Cancer Res. 2009, 15, 6973–6979. [Google Scholar] [CrossRef] [PubMed] [Green Version]
- Chan, M.Y.; Chok, K.S.H. Sarcopenia in pancreatic cancer—effects on surgical outcomes and chemotherapy. World J. Gastrointest. Oncol. 2019, 11, 527–537. [Google Scholar] [CrossRef] [PubMed]
- Sandini, M.; Patino, M.; Ferrone, C.R.; Alvarez-Pérez, C.A.; Honselmann, K.C.; Paiella, S.; Catania, M.; Riva, L.; Tedesco, G.; Casolino, R.; et al. Association Between Changes in Body Composition and Neoadjuvant Treatment for Pancreatic Cancer. JAMA Surg. 2018, 153, 809–815. [Google Scholar] [CrossRef] [PubMed]
- Naumann, P.; Eberlein, J.; Farnia, B.; Liermann, J.; Hackert, T.; Debus, J.; Combs, S.E. Cachectic Body Composition and Inflammatory Markers Portend a Poor Prognosis in Patients with Locally Advanced Pancreatic Cancer Treated with Chemoradiation. Cancers 2019, 11, 1655. [Google Scholar] [CrossRef] [PubMed] [Green Version]
- Frontera, W.R.; Zayas, A.R.; Rodriguez, N. Aging of Human Muscle: Understanding Sarcopenia at the Single Muscle Cell Level. Phys. Med. Rehabil. Clin. N. Am. 2012, 23, 201–207. [Google Scholar] [CrossRef] [PubMed] [Green Version]
- Daly, L.E.; Bhuachalla, B.N.; Power, D.G.; Cushen, S.J.; James, K.; Ryan, A.M. Loss of skeletal muscle during systemic chemotherapy is prognostic of poor survival in patients with foregut cancer. J. Cachexia- Sarcopenia Muscle 2018, 9, 315–325. [Google Scholar] [CrossRef] [Green Version]
- Dennison, E.; Sayer, A.A.; Cooper, C. Epidemiology of sarcopenia and insight into possible therapeutic targets. Nat. Rev. Rheumatol. 2017, 13, 340–347. [Google Scholar] [CrossRef] [PubMed] [Green Version]
- Solheim, T.S.; Laird, B.J.; Balstad, T.R.; Stene, G.B.; Bye, A.; Johns, N.; Pettersen, C.H.; Fallon, M.; Fayers, P.; Fearon, K.; et al. A randomized phase II feasibility trial of a multimodal intervention for the management of cachexia in lung and pancreatic cancer. J. Cachex- Sarcopenia Muscle 2017, 8, 778–788. [Google Scholar] [CrossRef] [PubMed]
- Liu, X.-Y.; Zhang, X.; Ruan, G.-T.; Zhang, K.-P.; Tang, M.; Zhang, Q.; Song, M.-M.; Zhang, X.-W.; Ge, Y.-Z.; Yang, M.; et al. One-Year Mortality in Patients with Cancer Cachexia: Association with Albumin and Total Protein. Cancer Manag. Res. 2021, ume 13, 6775–6783. [Google Scholar] [CrossRef]
- Zhang, X.-W.; Zhang, Q.; Song, M.-M.; Zhang, K.-P.; Zhang, X.; Ruan, G.-T.; Yang, M.; Ge, Y.-Z.; Tang, M.; Li, X.-R.; et al. The prognostic effect of hemoglobin on patients with cancer cachexia: A multicenter retrospective cohort study. Support. Care Cancer 2021, 30, 875–885. [Google Scholar] [CrossRef] [PubMed]
- Aversa, Z.; Costelli, P.; Muscaritoli, M. Cancer-induced muscle wasting: Latest findings in prevention and treatment. Ther. Adv. Med. Oncol. 2017, 9, 369–382. [Google Scholar] [CrossRef] [PubMed] [Green Version]
- Birgegård, G.; Aapro, M.S.; Bokemeyer, C.; Dicato, M.; Drings, P.; Hornedo, J.; Krzakowski, M.; Ludwig, H.; Pecorelli, S.; Schmoll, H.-J.; et al. Cancer-Related Anemia: Pathogenesis, Prevalence and Treatment. Oncology 2005, 68, 3–11. [Google Scholar] [CrossRef] [PubMed]
- Hirani, V.; Naganathan, V.; Blyth, F.; Le Couteur, D.; Seibel, M.; Waite, L.M.; Handelsman, D.J.; Hsu, B.; Cumming, R. Low Hemoglobin Concentrations Are Associated With Sarcopenia, Physical Performance, and Disability in Older Australian Men in Cross-sectional and Longitudinal Analysis: The Concord Health and Ageing in Men Project. J. Gerontol. Ser. A 2016, 71, 1667–1675. [Google Scholar] [CrossRef] [Green Version]
- Visser, M.; Kritchevsky, S.B.; Newman, A.B.; Goodpaster, B.H.; Tylavsky, F.A.; Nevitt, M.C.; Harris, T.B. Lower serum albumin concentration and change in muscle mass: The Health, Aging and Body Composition Study. Am. J. Clin. Nutr. 2005, 82, 531–537. [Google Scholar] [CrossRef] [PubMed] [Green Version]


| Variable | Patients (%) | Overall Survival | Progression-Free Survival | ||
|---|---|---|---|---|---|
| Median (Months) | p Value | Median (Months) | p Value | ||
| Age | |||||
| ≤65 years | 139 (59.9) | 10.580 | 0.114 | 6.110 | 0.254 |
| >65 years | 93 (40.1) | 8.310 | 7.000 | ||
| Gender | |||||
| Male | 149 (64.2) | 10.220 | 0.853 | 6.930 | 0.147 |
| Female | 83 (35.8) | 10.090 | 5.880 | ||
| Stage | |||||
| III | 60 (25.9) | 14.920 | 0.000 | 8.480 | 0.050 |
| IV | 172 (74.1) | 8.610 | 6.470 | ||
| Tumor location | |||||
| Head/neck/uncinate process | 93 (40.1) | 10.150 | 0.880 | 6.830 | 0.774 |
| Body/tail | 139 (59.9) | 10.120 | 6.110 | ||
| Tumor grade | |||||
| Well diff. | 15 (6.5) | 11.990 | 0.426 | 6.540 | 0.968 |
| Moderately diff. | 85 (36.6) | 11.070 | 6.800 | ||
| Poorly diff. | 43 (18.5) | 8.110 | 6.670 | ||
| Unknown | 89 (38.4) | 10.220 | 6.700 | ||
| Treatment | |||||
| CS + adj | 24 (10.3) | 25.590 | 0.000 | 9.430 | 0.039 |
| C/T | 172 (74.1) | 8.310 | 6.080 | ||
| C/T + local R/T | 36 (15.5) | 11.560 | 5.950 | ||
| CA19-9 | |||||
| ≤100 U/mL | 72 (31.0) | 12.160 | 0.019 | 6.970 | 0.067 |
| >100 U/ml | 160 (69.0) | 9.170 | 6.670 | ||
| BMI | |||||
| ≤22 kg/m2 | 116 (50.0) | 11.700 | 0.006 | 6.900 | 0.181 |
| >22 kg/m2 | 116 (50.0) | 8.310 | 5.880 | ||
| Hemoglobin | |||||
| ≤12 g/dL | 90 (38.8) | 8.280 | 0.002 | 5.950 | 0.258 |
| >12 g/dL | 142 (61.2) | 12.160 | 6.930 | ||
| Albumin | |||||
| ≤3.5 g/dL | 69 (29.7) | 5.720 | 0.000 | 7.260 | 0.859 |
| >3.5 g/dL | 163 (70.3) | 12.910 | 6.540 | ||
| Variable | Cancer Cachexia (%) | Sarcopenia (%) | ||||
|---|---|---|---|---|---|---|
| No (n = 38) | Yes (n = 194) | p Value | No (n = 118) | Yes (n = 114) | p Value | |
| Age | ||||||
| ≤65 years | 24 (63.2) | 115 (59.3) | 0.655 | 85 (72.0) | 54 (47.4) | 0.000 |
| >65 years | 14 (36.8) | 79 (40.7) | 33 (28.0) | 60 (52.6) | ||
| Gender | ||||||
| Male | 25 (65.8) | 124 (63.9) | 0.826 | 84 (71.2) | 65 (57.0) | 0.024 |
| Female | 13 (34.2) | 70 (36.1) | 34 (28.8) | 49 (43.0) | ||
| Stage | ||||||
| III | 5 (13.2) | 55 (28.4) | 0.051 | 28 (23.7) | 32 (28.1) | 0.450 |
| IV | 33 (86.8) | 139 (71.6) | 90 (76.3) | 82 (71.9) | ||
| Tumor location | ||||||
| Head/neck/uncinate process | 15 (39.5) | 78 (40.2) | 0.933 | 44 (37.3) | 49 (43.0) | 0.376 |
| Body/tail | 23 (60.5) | 116 (59.8) | 74 (62.7) | 65 (57.0) | ||
| Tumor grade | ||||||
| Well diff. | 2 (5.3) | 13 (6.7) | 0.461 | 9 (7.6) | 6 (5.3) | 0.902 |
| Moderately diff. | 18 (47.4) | 67 (34.5) | 43 (36.4) | 42 (36.8) | ||
| Poorly diff. | 7 (18.4) | 36 (18.6) | 22 (18.6) | 21 (18.4) | ||
| Unknown | 11 (28.9) | 78 (40.2) | 44 (37.3) | 45 (39.5) | ||
| Treatment | ||||||
| CS + adj | 3 (7.9) | 21 (10.8) | 0.544 | 13 (11.0) | 11 (9.6) | 0.197 |
| C/T | 27 (71.1) | 145 (74.7) | 82 (69.5) | 90 (78.9) | ||
| C/T + local R/T | 8 (21.1) | 28 (14.4) | 23 (19.5) | 13 (11.4) | ||
| CA19-9 | ||||||
| ≤100 U/mL | 13 (34.2) | 59 (30.4) | 0.644 | 37 (31.4) | 35 (30.7) | 0.914 |
| >100 U/mL | 25 (65.8) | 135 (69.6) | 81 (68.6) | 79 (69.3) | ||
| BMI | ||||||
| ≤22 kg/m2 | 19 (50.0) | 97 (50.0) | 1.000 | 48 (40.7) | 68 (59.6) | 0.004 |
| >22 kg/m2 | 19 (50.0) | 97 (50.0) | 70 (59.3) | 46 (40.4) | ||
| Hemoglobin | ||||||
| ≤12 g/dL | 8 (21.1) | 82 (42.3) | 0.014 | 38 (32.2) | 52 (45.6) | 0.036 |
| >12 g/dL | 30 (78.9) | 112 (57.7) | 80 (67.8) | 62 (54.4) | ||
| Albumin | ||||||
| ≤3.5 g/dL | 9 (23.7) | 60 (30.9) | 0.372 | 23 (19.5) | 46 (40.4) | 0.001 |
| >3.5 g/dL | 29 (76.3) | 134 (69.1) | 95 (80.5) | 68 (59.6) | ||
| Variable | Univariate Analysis | Multivariate Analysis | ||
|---|---|---|---|---|
| OR (95% CI) | p Value | OR (95% CI) | p Value | |
| Factor influencing cancer cachexia | ||||
| Hemoglobin (≤12/>12 g/dL) | 2.746 (1.197–6.298) | 0.017 | 2.718 (1.156–6.391) | 0.022 |
| Factors influencing sarcopenia | ||||
| Age (>65/≤65 years) | 2.862 (1.660–4.935) | 0.000 | 2.745 (1.534–4.913) | 0.001 |
| Gender (female/male) | 1.862 (1.081–3.210) | 0.025 | 1.450 (0.797–2.637) | 0.224 |
| BMI (≤22/>22 kg/m2) | 2.156 (1.276–3.642) | 0.004 | 2.492 (1.409–4.405) | 0.002 |
| Hemoglobin (≤12/>12 g/dL) | 1.766 (1.035–3.011) | 0.037 | 1.396 (0.770–2.531) | 0.271 |
| Albumin (≤3.5/>3.5 g/dL) | 2.794 (1.550–5.038) | 0.001 | 2.648 (1.401–5.004) | 0.003 |
| Variable | Univariate Analysis | Multivariate Analysis | ||
|---|---|---|---|---|
| HR (95% CI) | p Value | HR (95% CI) | p Value | |
| Overall Survival | ||||
| Stage (IV/III) | 1.837 (1.321–2.556) | 0.000 | 1.744 (1.240–2.453) | 0.001 |
| Treatment (C/T/CS + adj) | 3.685 (1.941–6.996) | 0.000 | 3.214 (1.678–6.157) | 0.000 |
| Treatment (C/T + local R/T/CS + adj) | 2.702 (1.334–5.472) | 0.006 | 1.964 (0.958–4.025) | 0.065 |
| CA19-9 (>100/≤100 U/mL) | 1.442 (1.059–1.963) | 0.020 | 1.336 (0.971–1.839) | 0.075 |
| BMI (>22/≤22 kg/m2) | 1.478 (1.118–1.956) | 0.006 | 1.656 (1.240–2.211) | 0.001 |
| Hemoglobin (≤12/>12 g/dL) | 1.555 (1.170–2.065) | 0.002 | 1.305 (0.972–1.752) | 0.076 |
| Albumin (≤3.5/>3.5 g/dL) | 2.508 (1.855–3.390) | 0.000 | 2.330 (1.693–3.207) | 0.000 |
| CC (yes/no) in all patients | 1.738 (1.176–2.568) | 0.006 | 2.232 (1.474–3.379) | 0.000 |
| SC (yes/no) in all patients | 1.256 (0.951–1.660) | 0.108 | 1.210 (0.908–1.613) | 0.193 |
| CC (yes/no) in patients with C/T | 2.001 (1.256–3.189) | 0.004 | 2.037 (1.273–3.261) | 0.003 |
| SC (yes/no) in patients with C/T | 1.517 (1.104–2.085) | 0.010 | 1.533 (1.116–2.106) | 0.008 |
| CC (yes/no) in patients with BMI > 22 | 1.840 (1.075–3.151) | 0.026 | 1.919 (1.112–3.313) | 0.019 |
| SC (yes/no) in patients with BMI > 22 | 1.488 (1.001–2.212) | 0.049 | 1.537 (1.035–2.282) | 0.033 |
| Progression-Free Survival | ||||
| Stage (IV/III) | 1.426 (0.997–2.040) | 0.052 | 1.465 (1.005–2.135) | 0.047 |
| Treatment (C/T/CS + adj) | 1.877 (1.104–3.193) | 0.020 | 1.678 (0.969–2.906) | 0.065 |
| Treatment (C/T + local R/T/CS + adj) | 2.076 (1.138–3.785) | 0.017 | 1.795 (0.976–3.303) | 0.060 |
| CA19-9 (>100/≤100 U/mL) | 1.388 (0.975–1.975) | 0.069 | 1.356 (0.950–1.937) | 0.094 |
| CC (yes/no) in all patients | 1.586 (1.026–2.451) | 0.038 | 1.723 (1.103–2.692) | 0.017 |
| SC (yes/no) in all patients | 1.107 (0.805–1.523) | 0.531 | 1.094 (0.793–1.510) | 0.583 |
| CC (yes/no) in patients with C/T | 2.212 (1.247–3.923) | 0.007 | 2.183 (1.230–3.874) | 0.008 |
| SC (yes/no) in patients with C/T | 1.233 (0.836–1.817) | 0.290 | 1.189 (0.807–1.752) | 0.382 |
| CC (yes/no) in patients with BMI > 22 | 2.187 (1.084–4.409) | 0.029 | 2.164 (1.073–4.363) | 0.031 |
| SC (yes /no) in patients with BMI > 22 | 1.237 (0.774–1.976) | 0.373 | 1.208 (0.756–1.930) | 0.430 |
Publisher’s Note: MDPI stays neutral with regard to jurisdictional claims in published maps and institutional affiliations. |
© 2022 by the authors. Licensee MDPI, Basel, Switzerland. This article is an open access article distributed under the terms and conditions of the Creative Commons Attribution (CC BY) license (https://creativecommons.org/licenses/by/4.0/).
Share and Cite
Hou, Y.-C.; Chen, C.-Y.; Huang, C.-J.; Wang, C.-J.; Chao, Y.-J.; Chiang, N.-J.; Wang, H.-C.; Tung, H.-L.; Liu, H.-C.; Shan, Y.-S. The Differential Clinical Impacts of Cachexia and Sarcopenia on the Prognosis of Advanced Pancreatic Cancer. Cancers 2022, 14, 3137. https://doi.org/10.3390/cancers14133137
Hou Y-C, Chen C-Y, Huang C-J, Wang C-J, Chao Y-J, Chiang N-J, Wang H-C, Tung H-L, Liu H-C, Shan Y-S. The Differential Clinical Impacts of Cachexia and Sarcopenia on the Prognosis of Advanced Pancreatic Cancer. Cancers. 2022; 14(13):3137. https://doi.org/10.3390/cancers14133137
Chicago/Turabian StyleHou, Ya-Chin, Chien-Yu Chen, Chien-Jui Huang, Chih-Jung Wang, Ying-Jui Chao, Nai-Jung Chiang, Hao-Chen Wang, Hui-Ling Tung, Hsiao-Chun Liu, and Yan-Shen Shan. 2022. "The Differential Clinical Impacts of Cachexia and Sarcopenia on the Prognosis of Advanced Pancreatic Cancer" Cancers 14, no. 13: 3137. https://doi.org/10.3390/cancers14133137