Article

Recurrent NOMO1 Gene Deletion Is a Potential Clinical Marker in Early-Onset Colorectal Cancer and Is Involved in the Regulation of Cell Migration

by
Jésica Pérez-García
1,2,3,†,
Abel Martel-Martel
1,2,4,†,
Paula García-Vallés
1,2,
Luis A. Corchete
3,5,6,
Juan L. García
1,3,
Nerea Gestoso-Uzal
1,2,
Rosario Vidal-Tocino
1,4,
Óscar Blanco
1,7,
Lucía Méndez
1,8,
Manuel Sánchez-Martín
1,8,
Manuel Fuentes
9,10,
Ana B. Herrero
1,2,3,
Andreana N. Holowatyj
11,
José Perea
1 and
Rogelio González-Sarmiento
1,2,3,*
1
Institute of Biomedical Research of Salamanca (IBSAL), SACYL-University of Salamanca-CSIC, 37007 Salamanca, Spain
2
Molecular Medicine Unit, Department of Medicine, University of Salamanca, 37007 Salamanca, Spain
3
Institute of Molecular and Cellular Biology of Cancer (IBMCC), University of Salamanca-CSIC, 37007 Salamanca, Spain
4
Medical Oncology Department, Complejo Asistencial Universitario de Salamanca-IBSAL, 37007 Salamanca, Spain
5
Hematology Department, Complejo Asistencial Universitario de Salamanca-IBSAL, 37007 Salamanca, Spain
6
Centro de Investigación Biomédica en Red de Cáncer (CIBERONC), 28029 Madrid, Spain
7
Anatomy Pathology Service, University Hospital of Salamanca, 37007 Salamanca, Spain
8
Transgenic Service, Nucleus, University of Salamanca, 37007 Salamanca, Spain
9
Department of Medicine and Cytometry General Service-Nucleus, CIBERONC, Cancer Research Centre (IBMCC/CSIC/USAL/IBSAL), 37007 Salamanca, Spain
10
Proteomics Unit, Cancer Research Centre (IBMCC/CSIC/USAL/IBSAL), 37007 Salamanca, Spain
11
Department of Medicine, Vanderbilt University Medical Center, Nashville, TN 37232, USA
*
Author to whom correspondence should be addressed.
These authors contributed equally to this work.
Cancers 2022, 14(16), 4029; https://doi.org/10.3390/cancers14164029
Submission received: 13 July 2022 / Revised: 16 August 2022 / Accepted: 19 August 2022 / Published: 20 August 2022

Abstract

:

Simple Summary

The incidence of EOCRC (age < 50 years at diagnosis) with unknown causes is rising worldwide, necessitating the mechanistical analysis of its molecular basis. The NOMO1 gene is deleted in a high number of EOCRC tumors compared to LOCRC. In this work, we aimed to test the NOMO1 gene mutational profile in EOCRC tumors and to characterize the effect of NOMO1 loss in different CRISPR/cas9-edited cell lines, as well as in murine models. Here, we show that the NOMO1 gene can be inactivated not only by deletion but also by pathogenic mutations in EOCRC. Our results indicate that NOMO1 loss could be a passenger mutation in the development of EOCRC, although it contributes significantly to colon cancer cell migration.

Abstract

The incidence of early-onset colorectal cancer (EOCRC; age younger than 50 years) has been progressively increasing over the last decades globally, with causes unexplained. A distinct molecular feature of EOCRC is that compared with cases of late-onset colorectal cancer, in EOCRC cases, there is a higher incidence of Nodal Modulator 1 (NOMO1) somatic deletions. However, the mechanisms of NOMO1 in early-onset colorectal carcinogenesis are currently unknown. In this study, we show that in 30% of EOCRCs with heterozygous deletion of NOMO1, there were pathogenic mutations in this gene, suggesting that NOMO1 can be inactivated by deletion or mutation in EOCRC. To study the role of NOMO1 in EOCRC, CRISPR/cas9 technology was employed to generate NOMO1 knockout HCT-116 (EOCRC) and HS-5 (bone marrow) cell lines. NOMO1 loss in these cell lines did not perturb Nodal pathway signaling nor cell proliferation. Expression microarrays, RNA sequencing, and protein expression analysis by LC–IMS/MS showed that NOMO1 inactivation deregulates other signaling pathways independent of the Nodal pathway, such as epithelial–mesenchymal transition and cell migration. Significantly, NOMO1 loss increased the migration capacity of CRC cells. Additionally, a gut-specific conditional NOMO1 KO mouse model revealed no subsequent tumor development in mice. Overall, these findings suggest that NOMO1 could play a secondary role in early-onset colorectal carcinogenesis because its loss increases the migration capacity of CRC cells. Therefore, further study is warranted to explore other signalling pathways deregulated by NOMO1 loss that may play a significant role in the pathogenesis of the disease.

1. Introduction

Colorectal cancer (CRC) is the third-most-common cancer diagnosed in men and women worldwide, estimated to have accounted for 1 in every 10 new cancer cases in 2020 [1]. Despite a reduction in the absolute numbers of patients diagnosed with CRC, there has been an increase in CRC incidence among individuals diagnosed before 50 years of age (early-onset CRC, or EOCRC) that is not well understood [2]. Indeed, the pathogenesis of EOCRC is well characterized among individuals with hereditary CRC. However, the majority (over 80%) of EOCRC cases do not carry a germline mutation associated with cancer predisposition (sporadic EOCRC) [3,4]. Thus, it is important to elucidate the molecular etiologies of sporadic EOCRC to accelerate the translation of research findings into clinical application, and reduce the burden of this disease.
An increasing body of evidence suggests that EOCRC has a clinical, pathologic, and molecular presentation distinct from those of CRCs from cases diagnosed at age 50+ years (late-onset CRC, or LOCRC) [5,6,7,8,9]. For example, from a clinical point of view, sporadic early-onset tumors have a worse prognosis than the late-onset ones: they are more aggressive, develop early metastasis, and therefore are associated with poorer survival. From a molecular point of view, EOCRCs show poor differentiation, signet-ring cells, and mucinous histology, typical features of tumors associated with Lynch syndrome. Moreover, in comparison with LOCRC, these tumors show substantial dissimilarities regarding the CIN pattern [10,11].
Assessment of DNA copy number alterations (CNAs) between EOCRC and LOCRC cases has also yielded intriguing observations for further study. We previously identified a recurrent deletion in the short arm of chromosome 16 (16p13.12-p13.11) that presented alone or in combination with other gains or losses of genetic material, and was more frequent in EOCRC than LOCRC cases (33% vs. 16.3%, respectively) [12]. Importantly, in this chromosomal region was located the Nodal Modulator 1 (NOMO1) gene—which was subsequently found to be deleted in 70% of EOCRC cases. However, among late-onset CRCs, only 4.5% of cases carried a NOMO1 deletion. Together, these findings suggest that NOMO1 may be a promising molecular feature distinct to EOCRC cases for further molecular study [13].
The NOMO1 gene encodes a 130 kDa transmembrane protein located in the endoplasmic reticulum that forms a protein complex together with Nicalin (NCLN) and the Transmembrane Protein 147 (TMEM147) that inhibits Nodal signaling during embryonic development [14,15]. Importantly, the Nodal pathway is a signal transduction pathway critical for differentiation during embryonic development, and for the maintenance of pluripotency in human embryonic stem cells [16,17,18,19]. The ligand, Nodal, propagates its signal by binding the type I Activin receptor ALK4/7 (ACVR1B/ACVR1C) and type II ACTRIIA/ACTRIIB (ACVR2A/ACVR2B) in cooperation with its co-receptor Cripto-1 [16,17,20]. This co-receptor binds ALK4 and promotes the recruitment of ACTRIIA/B, helping form the receptor signaling complex. Once activated, the receptor phosphorylates Smad proteins (P-Smads), which bind to a common intermediate, SMAD4 (Co-Smad), allowing the translocation of the complex to the nucleus, where it regulates the transcription of target genes [20]. Although Nodal is not active in most adult tissues, its re-expression and signaling have been linked to multiple types of human cancers [21]. Nodal signaling maintains the self-renewal capacity of cancer stem cells (CSCs) and promotes the invasiveness of several solid tumors, including melanoma, breast, colon, ovarian, prostate, endometrial, and pancreas tumors [18,21,22,23]. In addition, other complex components, including co-receptor Cripto-1, have been found to be overexpressed in a variety of human tumors and human cancer cell lines, whereas low or undetectable levels of expression were detected in normal adult tissues and in non-transformed normal cell lines [16]. Despite the growing importance of Nodal signaling in carcinogenesis, the role of NOMO1 in the pathogenesis or progression of CRC, particularly EOCRC, remains unexplored.
In the study presented here, we used CRISPR/Cas9 technology to delete endogenous NOMO1 in multiple independent cell lines bearing the wild type (WT) gene. We also used a gut-specific conditional knockout (KO) mouse model of Nomo1 to study subsequent tumor development. Specifically, the characterization of the NOMO1-KO clones revealed that NOMO1 loss did not affect either the Nodal signaling pathway activity or cell proliferation. Importantly, NOMO1 inactivation deregulated the epithelial–mesenchymal transition (EMT) process and increased CRC cell migration. Deletion of Nomo1 using in vivo models also did not lead to subsequent tumor development. Together, these findings suggest that NOMO1 is not a driver of early-onset colorectal carcinogenesis and that other signaling pathways deregulated by its loss may play a relevant role in the pathogenesis of EOCRC.

2. Materials and Methods

2.1. Human Tissue Samples

In this study, 26 formalin-fixed paraffin-embedded (FFPE) blocks of tumors isolated from EOCRC patients diagnosed at the 12 October University Hospital (Madrid), and at the University Hospital of Salamanca, were included. All tumors were from patients under 50 years of age who had previously shown heterozygous deletion of the NOMO1 gene [13]. In all cases, clinicopathological data, microsatellite instability (MSI) status, and mismatch repair (MMR) gene mutation status were analyzed. All tumor samples were confirmed to be microsatellite stable (MSS)/sporadic and to carry WT MMR genes.

2.2. Cell Lines and Culture Conditions

The colon cancer cell line HCT-116 (age 48) and the human stromal cell line HS-5 (age 30) were acquired from American Type Culture Collection (ATCC). The cell lines were cultured in Dulbecco’s modified Eagle’s medium (DMEM) (Sigma-Aldrich, Darmstadt, Germany) supplemented with 10% fetal bovine serum (FBS) (Sigma-Aldrich) and 1% penicillin/streptomycin (Gibco Life Technologies, Grand Island, NY, USA). All cells were incubated at 37 °C in a 5% CO2 atmosphere. The presence of mycoplasma was routinely checked with the MycoAlert kit (Lonza, Basel, Switzerland), and only mycoplasma-free cells were used in all subsequent experiments.

2.3. DNA Extraction and DNA Quality Evaluation

DNA was isolated from 10 µm sections from each FFPE block. FFPE sections were treated with a deparaffinization solution (Qiagen, Heidelberg, Germany), and DNA was extracted using the QIAamp DNA FFPE Tissue kit (Qiagen, Heidelberg, Germany) according to the manufacturer’s instructions. The Illumina Custom DNA Panel Reference Guide (Illumina, San Diego, CA, USA) was used to measure the DNA quality by comparing FFPE-gDNA amplification potential with a reference non-FFPE gDNA (QCT). To predict the dilution required for each sample, delta Cq values were calculated using qPCR.

2.4. Quantitative PCR (qPCR) and Quantitative Reverse Transcription PCR (qRT-PCR)

For real-time quantification, real-time polymerase chain reaction (RT-PCR) was performed using FastStart Universal SYBR Green Master (ROX) in a StepOnePlus™ Real-Time PCR System (Life Technologies-Invitrogen, Carlsbad, CA, USA). The primers used for gene amplification are detailed in Supplementary Table S1. For all cases, a fragment of the LEMD3 gene (single-copy gene) was amplified from the same DNA sample to be used as internal control. PCR experiments were performed using Applied Biosystems StepOnePlus®, and analysis was carried out using RQ Manager® software. Three replicates were used for each PCR reaction. The comparative Ct method (2−∆∆Ct) was applied to calculate the relative expression levels of each amplicon using LEMD3 as the reference gene for normalization. RT-PCR specificity of each PCR reaction was verified by melting curve analysis.

2.5. NOMO1 Sequencing

Optimal-quality DNA samples were used to sequence NOMO1 within a panel of genes by next-generation sequencing (NGS), according to the manufacturer’s instructions. Briefly, this process included the following steps: NOMO1 was hybridized with the oligo pool. Unbound oligos were removed. NOMO1 was extended and ligated with bound oligos. The libraries were amplified. Finally, the libraries were cleaned up by magnetic beads. PCR products were quantified using a Qubit fluorometer (Invitrogen, Carlsbad, CA, USA), and the libraries were normalized at 4 nM in a final pool. Sequencing was performed by a MiSeq System (Illumina, San Diego, CA, USA). Variant Studio Software (Illumina, San Diego, USA) was used for subsequent analysis. Somatic variants with >10% frequency, with a quality score > 500 in the bi-directional sequencing quality filter, and that met the software PASS filter, were reported. To predict the pathogenicity of variants of uncertain significance (VUS), in silico analyses were performed using the prediction programs PolyPhen (Polymorphism Phenotyping), Sift (Sorting Intolerant From Tolerant), and CADD (Combined Annotation Dependent Depletion).

2.6. CRISPR/Cas9-Mediated Generation of NOMO1 Knockout Cells

Exon 3 and adjacent intronic regions of the NOMO1 gene were selected as target sequences for the CRISPR-Cas9 design. This is because it is the first exon of the gene where the last nucleotide of its coding sequence encodes a codon with the first two nucleotides of the next exon. Therefore, removing this fragment from exon 3 could produce an early truncated NOMO1 protein. Three sgRNAs (sgRNA1, sgRNA2, and sgRNA3) were designed with the Spanish National Biotechnology Centre (CNB)-CSIC web tool [24]. Three complementary oligonucleotides corresponding to sgRNAs were designed, including two 4-bp overhang sequences (NOMO1 UP and LOW oligonucleotides; Supplementary Table S2). Each pair of oligonucleotides was phosphorylated, annealed, digested with Bpil enzyme (NEB), and ligated to the pSpCas9(BB)-2A-GFP (PX458), also digested with the same enzyme [25].
Subsequently, 50 μL of E. coli DH5α cells was transformed with 2 μL of ligated plasmids. Single colonies were grown, and plasmid DNA was extracted and purified using the Danagene plasmid miniprep kit, as per manufacturer protocol (DANAGEN-BIOTED S.L.). Sanger sequencing (data not shown) confirmed the correct insertion of the sgRNAs into the vector. Cell lines were transfected with a combination of two different NOMO1 CRISPR-Cas9 KO plasmids (4 μg each) or 8 μg of control CRISPR-Cas9 plasmid (empty PX458).
Transfection for the HCT-116 cell line was carried out using the Amaxa Cell Line Nucleofector Kit V, the Amaxa Nucleofector device (Lonza) with the T-016 program. The HS-5 cell line was transfected by lipofection, as per the manufacturer’s instructions (PolyJetTM In Vitro DNA Transfection Reagent, SignaGen). Single GFP+ cells were sorted into 96-well plates 48 h after transfection using a BD FACSAriaTM III flow cytometer. Isolated clones were expanded in culture over a period of 3 weeks, and then genomic DNA was extracted by the phenol-chloroform method. We confirmed the NOMO1 status of each clone by PCR using the NOMO1 exon/intron 3 primers (Forward: 5′-CAGTGCTCAGTACCATGTAG-3′; Reverse: 5′-GGGAGGAATACAAACCCTC-3′). At least two NOMO1-KO clones and two controls (WT cell line or clones generated after transfection with the empty plasmid) were assayed for each cell line. The NOMO1-KO clones were also confirmed by qPCR and Western blotting (WB).

2.7. Western Blotting

Cells were resuspended in RIPA buffer containing protease inhibitors (Complete, Roche Applied Science, Indianapolis), and the protein concentration was measured using the Bradford assay (BioRad). In all, 30 μg of protein samples were separated on an 8% or 12% SDS-PAGE gel (depending on protein size), transferred to an Immobilon-P membrane (Millipore), and incubated with primary specific antibodies overnight (Supplementary Table S3). The following day, secondary antibodies were added and immunoblots were incubated for 1 h at room temperature and developed using enhanced chemiluminescence WB detection reagents (Thermo Fisher Scientific, Waltham, MA, USA). β-actin was used as a loading control.

2.8. Cell Viability Assay

An MTT assay was used to quantify cell viability and metabolic activity. Metabolically active cells were marked using 3-(4,5-dimethylthiazol-2-yl)-2,5-diphenyl-2H-tetrazolium bromide (Sigma-Aldrich). A total of 5000 cells/well from the NOMO1-KO and control clones of the two cell lines were seeded in a 96-well plate. We measured the viability of the cells by cellular metabolic function at 0 (control), 24, 48, and 72 h, adding to each well 10 μL of MTT and incubating for 1 h at 37 °C. The percentage of growth was determined by statistical analysis with SPSS-IBM software.

2.9. Wound Healing Assay

A total of 106 cells per well were seeded in 6-well plates containing three well silicone inserts with two defined cell-free gaps (Ibidi, Fitchburg, WI, USA, Inc.). A minimal concentration of FBS was added to the culture medium to maintain survival but inhibit cell proliferation (2% for HCT-116 and HS-5 cell lines). After cell attachment (24 h), culture-inserts were removed creating a scratch. Each experiment was performed in triplicate. Photos of a determined region of each scratch (three wounds/replica) were taken every 10 min for 48 h using a camera attached to a Mikon ECLIPSE TE-2000-E microscope. The ImageJ® program was used in combination with the MRI Wound Healing Tool to calculate the percentage of migration (shown on the Y-axis) for each time reference at 0, 12, 24, and 36 or 48 h (shown on the X-axis). The SPSS/IBM software was used to calculate migration percentages for NOMO1-KO and control clones.

2.10. Transwell Migration Assay

For the Transwell migration assay, 4 × 10⁴ cells of two HCT-116 and HS-5 NOMO1-KO clones and two control clones were suspended in 300 µL of serum-free DMEM. This cell suspension was added to the upper chamber of a 24-multiwell insert system with an 8 µm pore (SARSTEDT), and 600 µL of DMEM with 10% FBS was added to each lower well. After 24 h of incubation, migratory cells were fixed with 3.7% paraformaldehyde for 5 min and stained with 1% crystal violet solution for 15 min. Microscopy pictures were taken for each well with a 10x objective lens, and the stained area was quantified with ImageJ® software.

2.11. RNA Extraction, Microarray Data Analysis, and RNA Sequencing

Total RNA was extracted from three NOMO1-KO clones and three control clones for HCT-116 and HS-5 using RNeasy Mini Kit (Qiagen, Hilden, Germany), according to the manufacturer’s instructions. DNA was removed from the samples using RNase-free DNase Set (Qiagen, Hilden, Germany). RNA integrity was assessed using the Agilent 2100 Bioanalyzer (Agilent, Palo Alto, Santa Clara, CA, USA).
For the microarray analysis, labeling and hybridizations were performed according to protocols from Affymetrix. Washing and scanning were performed using the Affymetrix GeneChip System (GeneChip Hybridization Oven 645, GeneChip Fluidics Station 450, and GeneChip Scanner 7G). The Robust Multi-Array Average (RMA) procedure was used to quantile normalize, background correct, and log2 transform raw microarray data [26] in the oligo R package (v.1.54.1) using a custom cdf reference from BrainArray (v.25.0.0) [27]. Differential gene expression analyses were carried out with the limma package (v.3.46.0). Microarray batch-effects were adjusted through the ComBat function from the sva package.
For RNA sequencing (RNA-seq), 0.5 µg of total RNA was used to construct cDNA libraries with TruSeq stranded total RNA with the Ribo-Zero kit (Illumina, San Diego, CA, USA). Then, cDNA libraries were sequenced with NovaSeq 6000 (paired-end 150bp × 2) with a range of 61.8–78.7 M reads/sample, according to the manufacturer’s instructions. The library was constructed and sequenced by Macrogen Inc. (Macrogen, Seoul, Korea). Adapter sequences and low-quality bases were trimmed using Trimmomatic (v.0.39). Raw and trimmed read quality was assessed with the FASTQC tool (v.0.11.9). The surviving paired reads after trimming were mapped to the hg19 human genome with the STAR aligner (v.2.7.9a). The reference genome sequence (hg19, Genome Reference Consortium GRCh37) and annotation data (v.87) were downloaded from the Ensembl website (https://www.ensembl.org (accessed on 27 January 2022)). Gene level counts were calculated using the union mode from the HTSeq package (v.0.12.4). Gene expression count was normalized using the median of ratios method [28], and differential gene expression was analyzed using the DESeq2 R package (v.1.30.1). Batch-effects were adjusted through the ComBat_seq function from the sva R package (v.3.38.0).
Microarray and RNA-seq data have been deposited into the Gene Expression Omnibus (GEO) (http://www.ncbi.nlm.nih.gov/gds/ (accessed on 10 March 2022)) with the accession number GSE198383. For both assays, the false discovery rate (FDR) was controlled by adjusting p-values with the Benjamini–Hochberg method. Genes with an absolute value of the fold change (FC) greater than 1.5 (over-expressed) and lower than −1.5 (under-expressed) were selected for further analysis. Gene expression values of the selected genes were visualized using a heatmap with the pheatmap R package (v.4.0.5). The WebGestalt tool (WEB-based Gene set analysis toolkit) [29] was used for pathway enrichment analyses. Hallmarks standards were used to identify the biological processes that could be affected by the NOMO1 inactivation.

2.12. Proteome Analysis by Liquid Chromatography-Mass Spectrometry (LC-IMS/MS)

Liquid chromatography–mass spectrometry (LC–IMS/MS) was used to analyze changes in protein expression profiles after NOMO1 inactivation. Four samples of NOMO1-WT and NOMO1-KO clones were compared for the HCT-116 and HS-5 cell lines. All purified cells (2000–3000 cells) were processed by lysis solution and phosphates protease inhibitors [30]. In all, 0.5 µg of total protein was reduced with 10 mM dithiothreitol (DTT) + 55 mM iodiacetamide at room temperature for 45 min. Protein was digested with trypsin (1:50 w/w) at 37 °C for 18 h. Then, the peptide mixture was acidified with 0.1% TFA and desalted with C18 StageTips. Samples were stored at −20 °C until LC–IMS/MS tests were performed. The mass spectrometry proteomics data have been deposited at the ProteomeXchange Consortium (http://proteomecentral.proteomexchange.org (accessed on 4 May 2022)) via the PRIDE partner repository with the dataset identifier PXD033636. For the LC–IMS/MS analysis, a nanoUPLC system (NanoElute, Bruker) was used with a C18 column 15 cm × 75 µm, with 1.6 µm C18 particles (Ion Optics Inc., Waltham, MA, USA) and 120 min gradient (3–50% of ACN at 300 nL/min), coupled to a TimsTOF Pro (Bruker). The TimsTOF Pro was operated in PASEF mode (Parallel Accumulation Serial Fragmentation) using Compass Hystar 5.036.0. Settings for the method using 11 samples per day were as follows: mass range 100 to 1700 m/z, 1/K0 start 0.6 V⋅s/cm2 and end 1.6 V⋅s/cm2, ramp time 110.1 ms, lock duty cycle 100%, capillary vol. 1600 V, dry gas 3 L/min, dry temp 180 °C, PASEF settings 10 MS/MS scans (total cycle 1.27 sec), charge range 0–5, active exclusion 0.4 min, Schedul Target intensity 10000, intensity threshold 2500, and CID collision energy 42 eV [31]. All raw files were analyzed by MaxQuant v1.6.6.0 software using the integrated Andromeda search engine. Data search was against the Human Uniprot Reference Proteome with isoforms (latest version available) and a separated reverse decoy database using a strict trypsin specificity allowing up to two missed cleavages. The minimum peptide length was set to 7αα’carbamidomethylation of cysteine as a fixed modification, and N-acetylation and oxidation of methionine as variable modifications. The first search for peptide tolerance was started at 70 ppm, and the main search was set at 30 ppm. Single-shot samples were set as “to”, and fractions were set as “from”. For each peptide, the maximum peptide mass (Da) was fixed at 8000. All other global or group parameters were predetermined by MaxQuant. PTMS screening was carried out following PTMScan Direct PTMScan® m (Cell Signaling Technology, Danvers, MA, USA) with the slight modifications described [32,33].

2.13. Mouse Strains, Adenovirus Injection, and Histological Analysis

A conditional mouse mutant for Nomo1 has been previously described [34]. In summary, to avoid Nomo1 expression in C57BL/6J mouse intestine cells, 8 week old Nomo1flox/flox and Nomo1flox/+ mice were infected with a single injection of 300 MOI of Cre adenovirus (Ad5CMVCre-eGFP) administered into the colon area. The infected mice were named Nomo1flox/flox CreAdV and Nomo1flox/+ CreAdV. We used Nomo1flox/flox, Nomo1flox/+, and Nomo1+/+ uninfected mice as a control group. For CCR tumor observation, all groups were euthanized at 20 months old. PCRs were performed using the mNomo1-F- and mNomo1-R-specific primers (Supplementary Table S1) of genomic DNA from mice colons to demonstrate whether Cre activity effectively removes Nomo1 exon 3, achieving homozygous or heterozygous Nomo1 null alleles. Specifically, the animals were housed according to EU guidelines at the Animal Experimentation Service of the University of Salamanca. All mice received a standard diet and were subjected to a 12 h/12 h light/dark cycle. They were maintained in pathogen-free individual cages, under temperature and ventilation control. After animal necropsy, the digestive tract was removed and fixed in formol 10% solution. All samples were processed into serial paraffin sections and stained with haematoxylin-eosin. Subsequently, a pathological analysis of the digestive tract of all mice was carried out at the Pathology Service of the University Hospital of Salamanca.

2.14. Statistical Analysis

Data were analyzed using IBM/SPSS software v26 (SPSS Inc., Chicago, IL, USA). All quantitative data are shown as the mean ± standard deviation (SD). Student’s t-test was used to compared differences between two groups when they had a normal distribution (test Kolmogorov–Smirnov; p-value > 0.05). A p-value ≤ 0.05 was considered statistically significant.

3. Results

3.1. Quantitative PCR Reveals a Single NOMO Gene

The presence of three highly similar genes, named NOMO1, NOMO2, and NOMO3, has been previously reported in a region of duplication located on the p-arm of chromosome 16 [35]. These genes encode closely related proteins with a 99.6% homology that may have identical functions. The RT-qPCR method was used to confirm the existence of three NOMO genes [36]. A specific pair of oligonucleotides was designed to amplify the NOMO genes. Using these primers, a DNA fragment that contains part of exon 4 and part of intron 4 (whose sequence is 100% similar to that of the three reported NOMO genes) was amplified. Several oligonucleotides were also designed to amplify and quantify different controls (Supplementary Table S1). To further quantify the NOMO content, we amplified another fragment of the NOMO gene, one which contains part of exon 1, a sequence that is 100% identical across the three reported NOMO genes. As an internal control, we amplified part of exon 1 of the single-copy gene LEMD3 (two alleles), a DNA fragment between exon 2-intron 2 of RBFOX1, a gene located in proximity to the NOMO genes on the same chromosomal region (two alleles), and a fragment of exon 30 of PKD1 that has no homology with any pseudogene (two alleles). We also amplified exon 13 of PKD1, which has a pseudogene that contains a 100% homologous sequence (4 alleles), as a duplication control gene and exon 5 of the STS gene, located on chromosome X, which has only one allele in males. Our results showed that the amount of NOMO DNA amplified by RT-qPCR was similar to single-copy genes LEMD3, RBFOX1, and exon 30 of PKD1, whereas this amount was half that of PKD1 exon 13 and two times that of STS exon 5 (Figure 1).
Next, we compared the three reported NOMO gene coding regions and found that they differ in 20 nucleotides. These nucleotides correspond to 13 silent and seven missense mutations (Table 1). Only one of these missense mutations (c.26C>T/p.L9P) has not been included in the dSNP database [37] https://www.ncbi.nlm.nih.gov/snp (accessed on 29 July 2021). The allele frequency of these mutations obtained from the ExAC aggregated population [38] showed that most of the NOMO WT alleles have a population frequency near 100%. As the presence of two genes would yield a 50% frequency of the mutated allele, these results strongly suggest that there is a single NOMO gene.

3.2. NOMO1 Is Frequently Inactivated by Deletion or Mutation in EOCRC

We have previously reported that a high proportion of EOCRCs carry a homozygous deletion of the NOMO1 gene [13]. To expand upon these findings, we sequenced the NOMO1 gene in 26 EOCRC tumors. Mutational profiling obtained through next-generation sequencing showed that four of the 26 (15.3%) tumors carried a pathogenic mutation (nonsense mutations) in the NOMO1 gene. In addition, six VUS were identified and classified by prediction programs as possibly pathogenic and three of the 10 (30%) tumors with heterozygous deletion of the NOMO1 gene harbored a pathogenic mutation in the remaining allele (Table 2). Together, these results indicate that NOMO1 is frequently inactivated in EOCRC, either through deletion or through mutation.

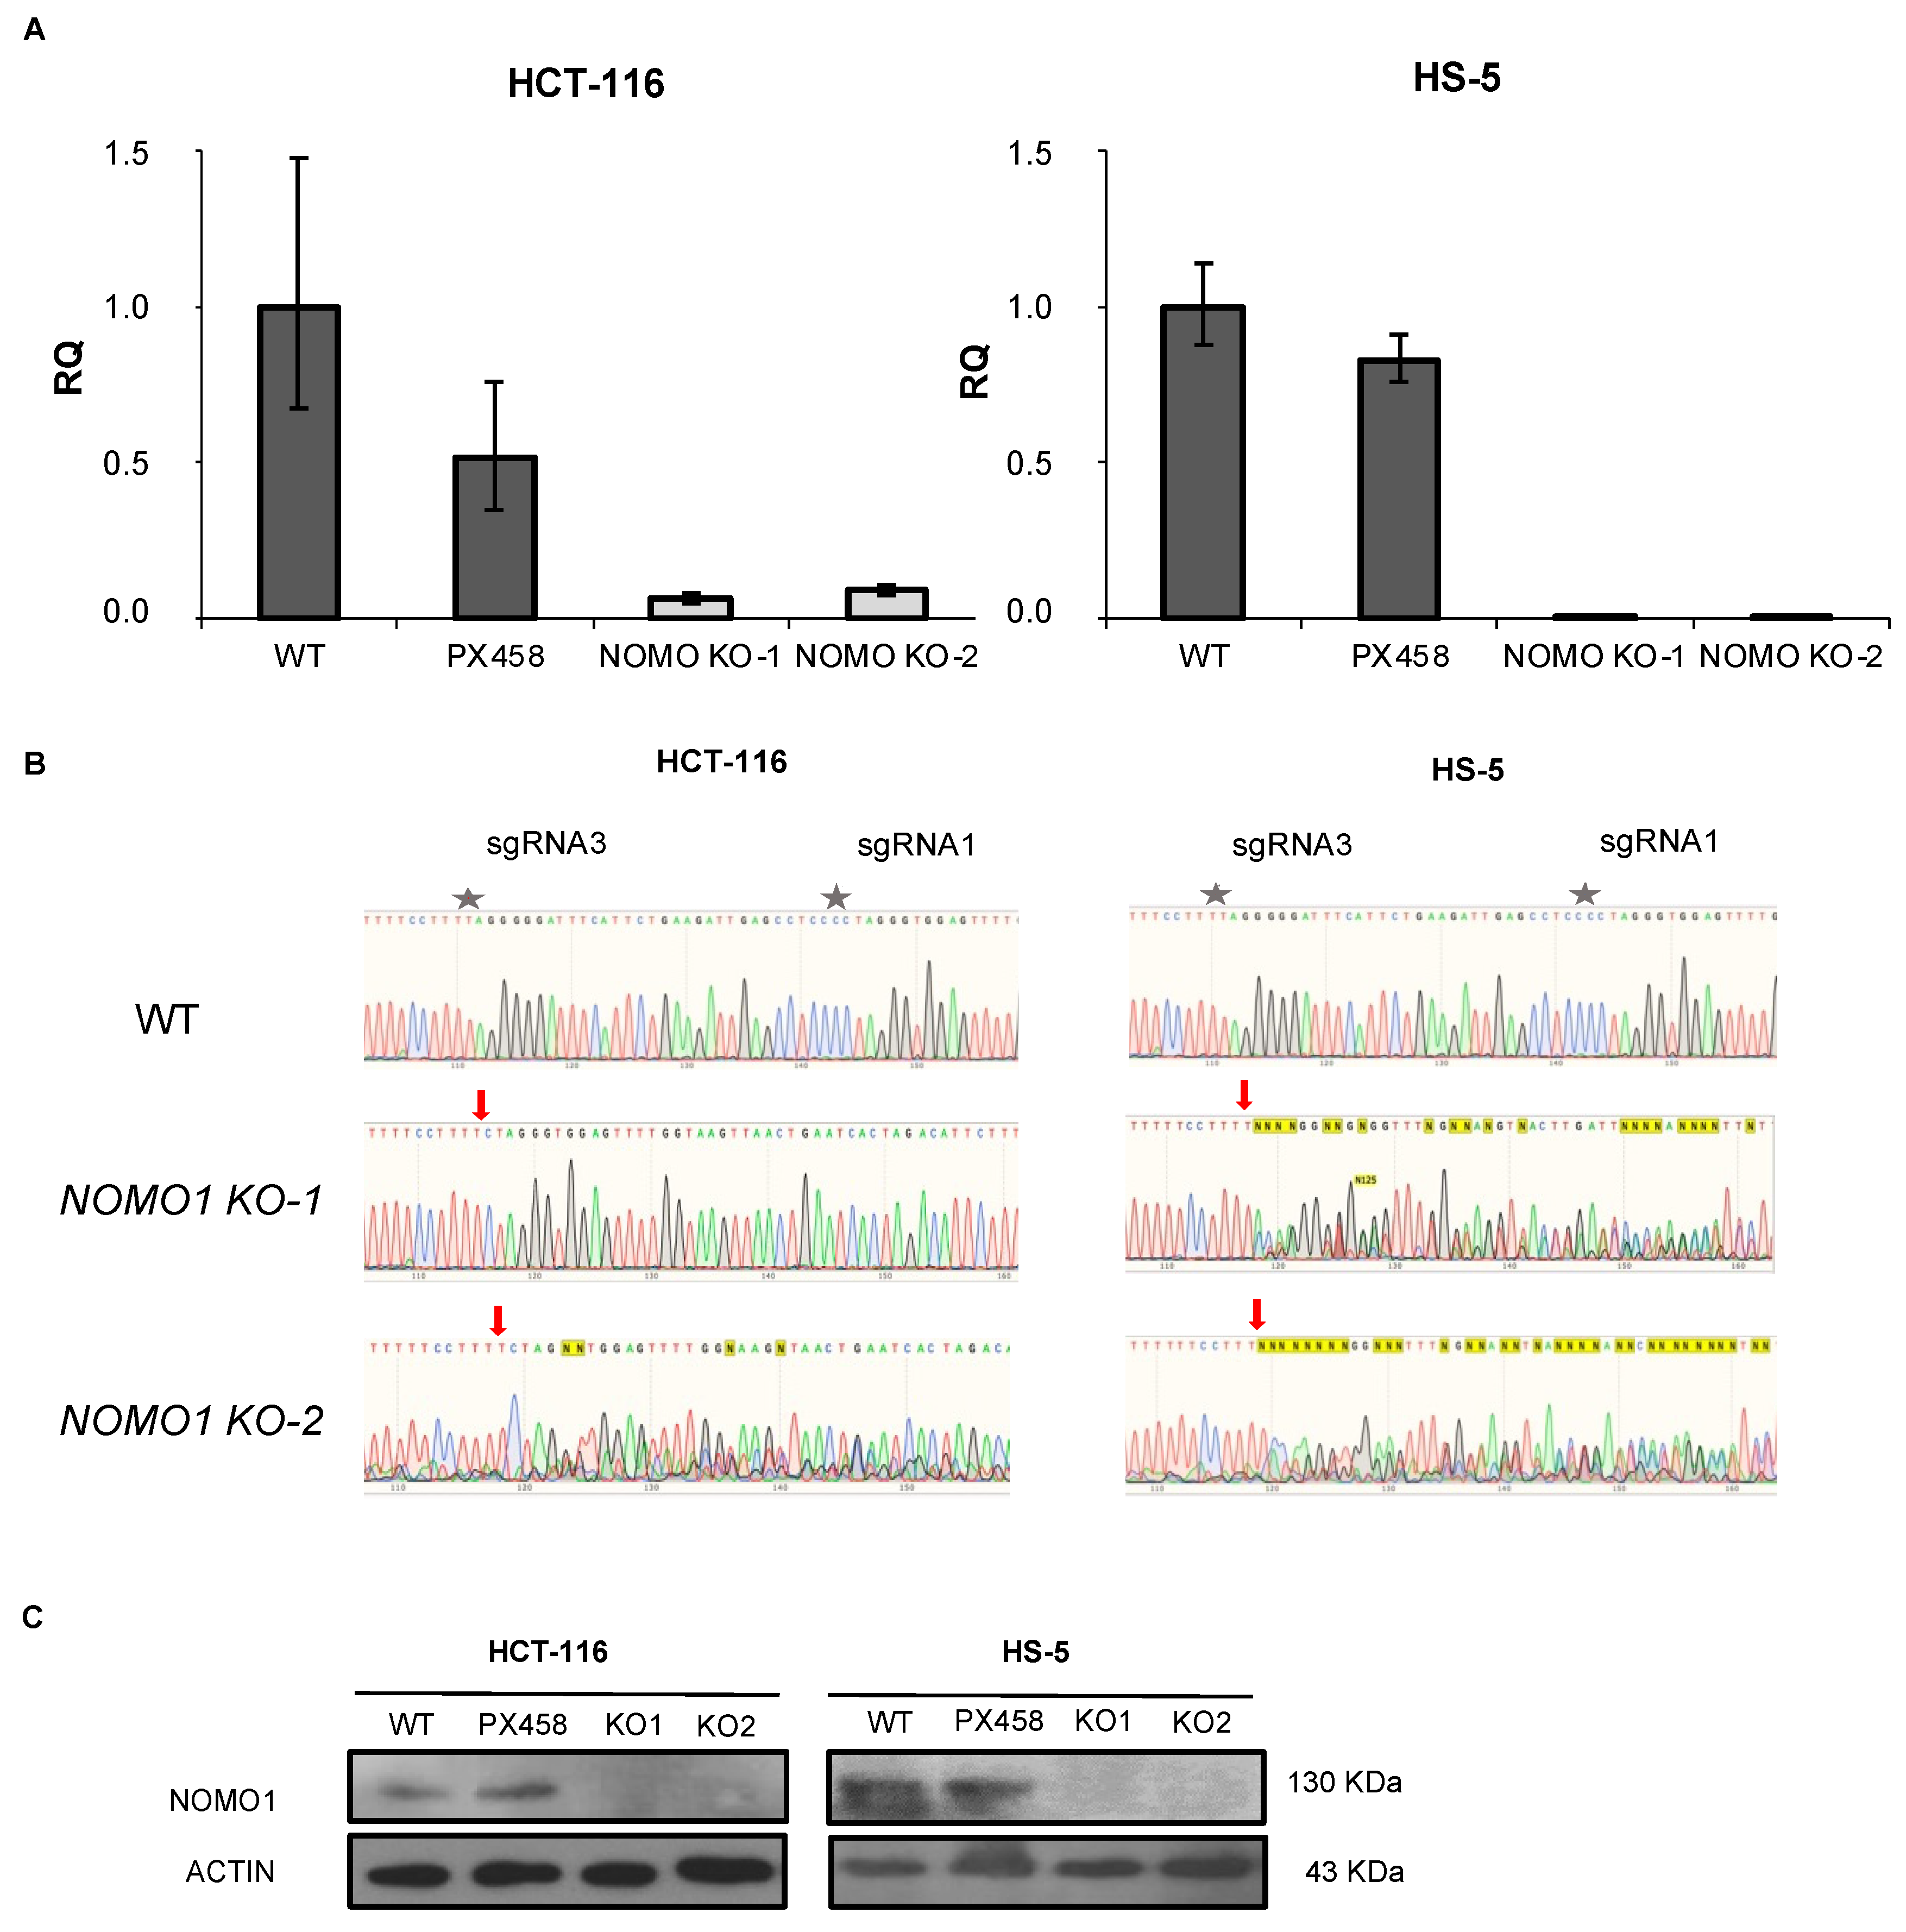
3.3. CRISPR/Cas9 Technology Efficiently Inactivates NOMO1

To investigate the consequences of NOMO1 inactivation, we constructed NOMO1-KO cell lines using CRISPR/Cas9 technology. We deleted endogenous NOMO1 in one cell line derived from EOCRC (HCT-116) and in a bone-marrow-derived non-cancerous mesenchymal cell line (HS-5). Each cell line was transfected with a combination of two plasmids (Supplementary Figure S1). Cell lines were also transfected with the PX458 empty plasmid. After single-cell sorting of GFP+ cells, clones were expanded and screened by RT-qPCR (Figure 2A), PCR-Sanger sequencing (Figure 2B), and WB (Figure 2C). At least two NOMO1-KO clones and two control clones for each cell line were efficiently generated and selected for further studies.

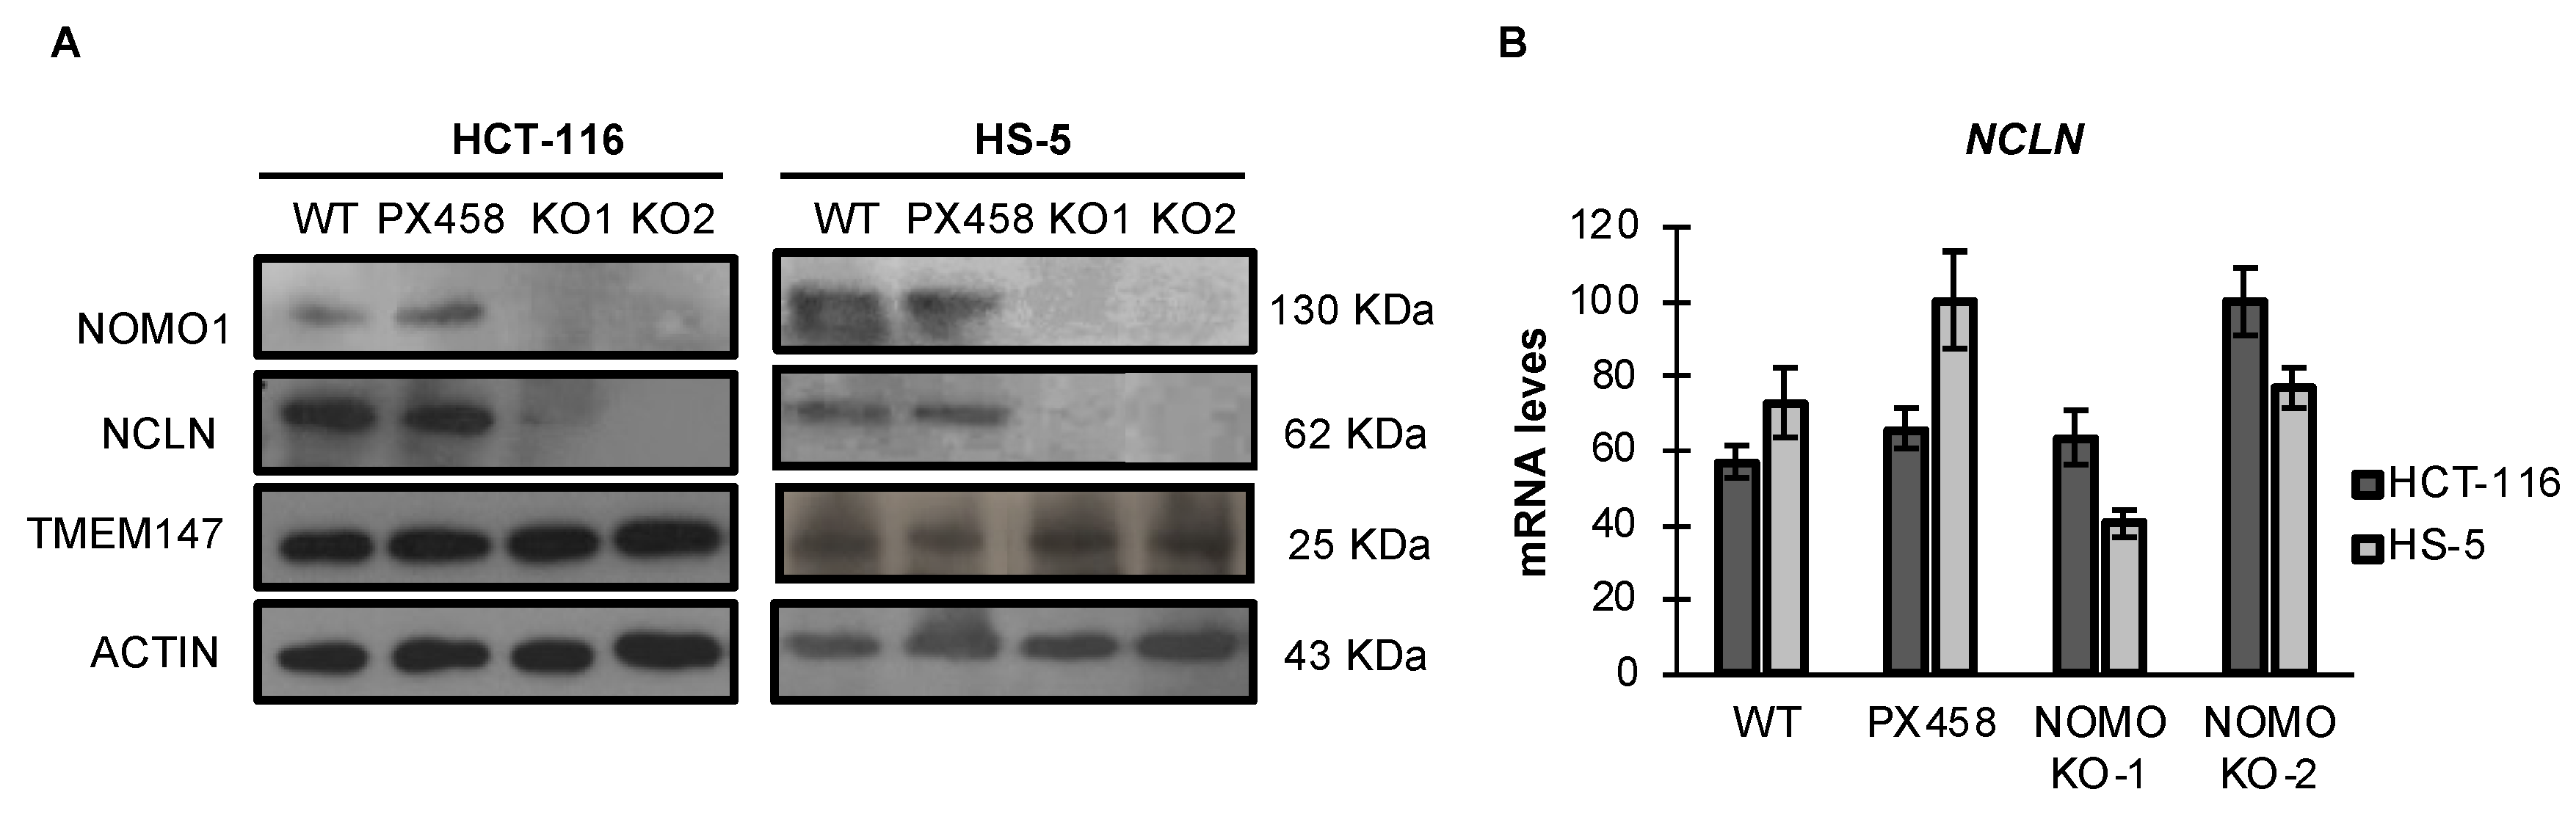
3.4. NOMO1 Inactivation Significantly Reduces the Expression of NCLN in Cell Lines

NOMO1 reportedly forms a protein complex with NCLN and TMEM147, and the complex is located in the endoplasmic reticulum [14,39]. Using an RNA interference approach, previous studies have demonstrated that NCLN and NOMO1 become unstable and, therefore, the expression of NOMO1 decreases in the absence of the respective binding partner, suggesting that complex formation has a stabilizing effect [39]. Similarly, it was later shown that TMEM147 expression is strongly reduced in NCLN and NOMO1 knockdown cells [14]. Here, we found that TMEM147 expression was not affected by NOMO1 loss (Figure 3A and Figure S6). In contrast, NCLN expression was strongly reduced in NOMO1-KO cells across both cell lines tested. As the reduction in NCLN levels was not accompanied by a significative decline in the corresponding mRNA expression levels, as determined by qRT-PCR, these results suggest that protein is reduced by a post-transcriptional mechanism (Figure 3B).

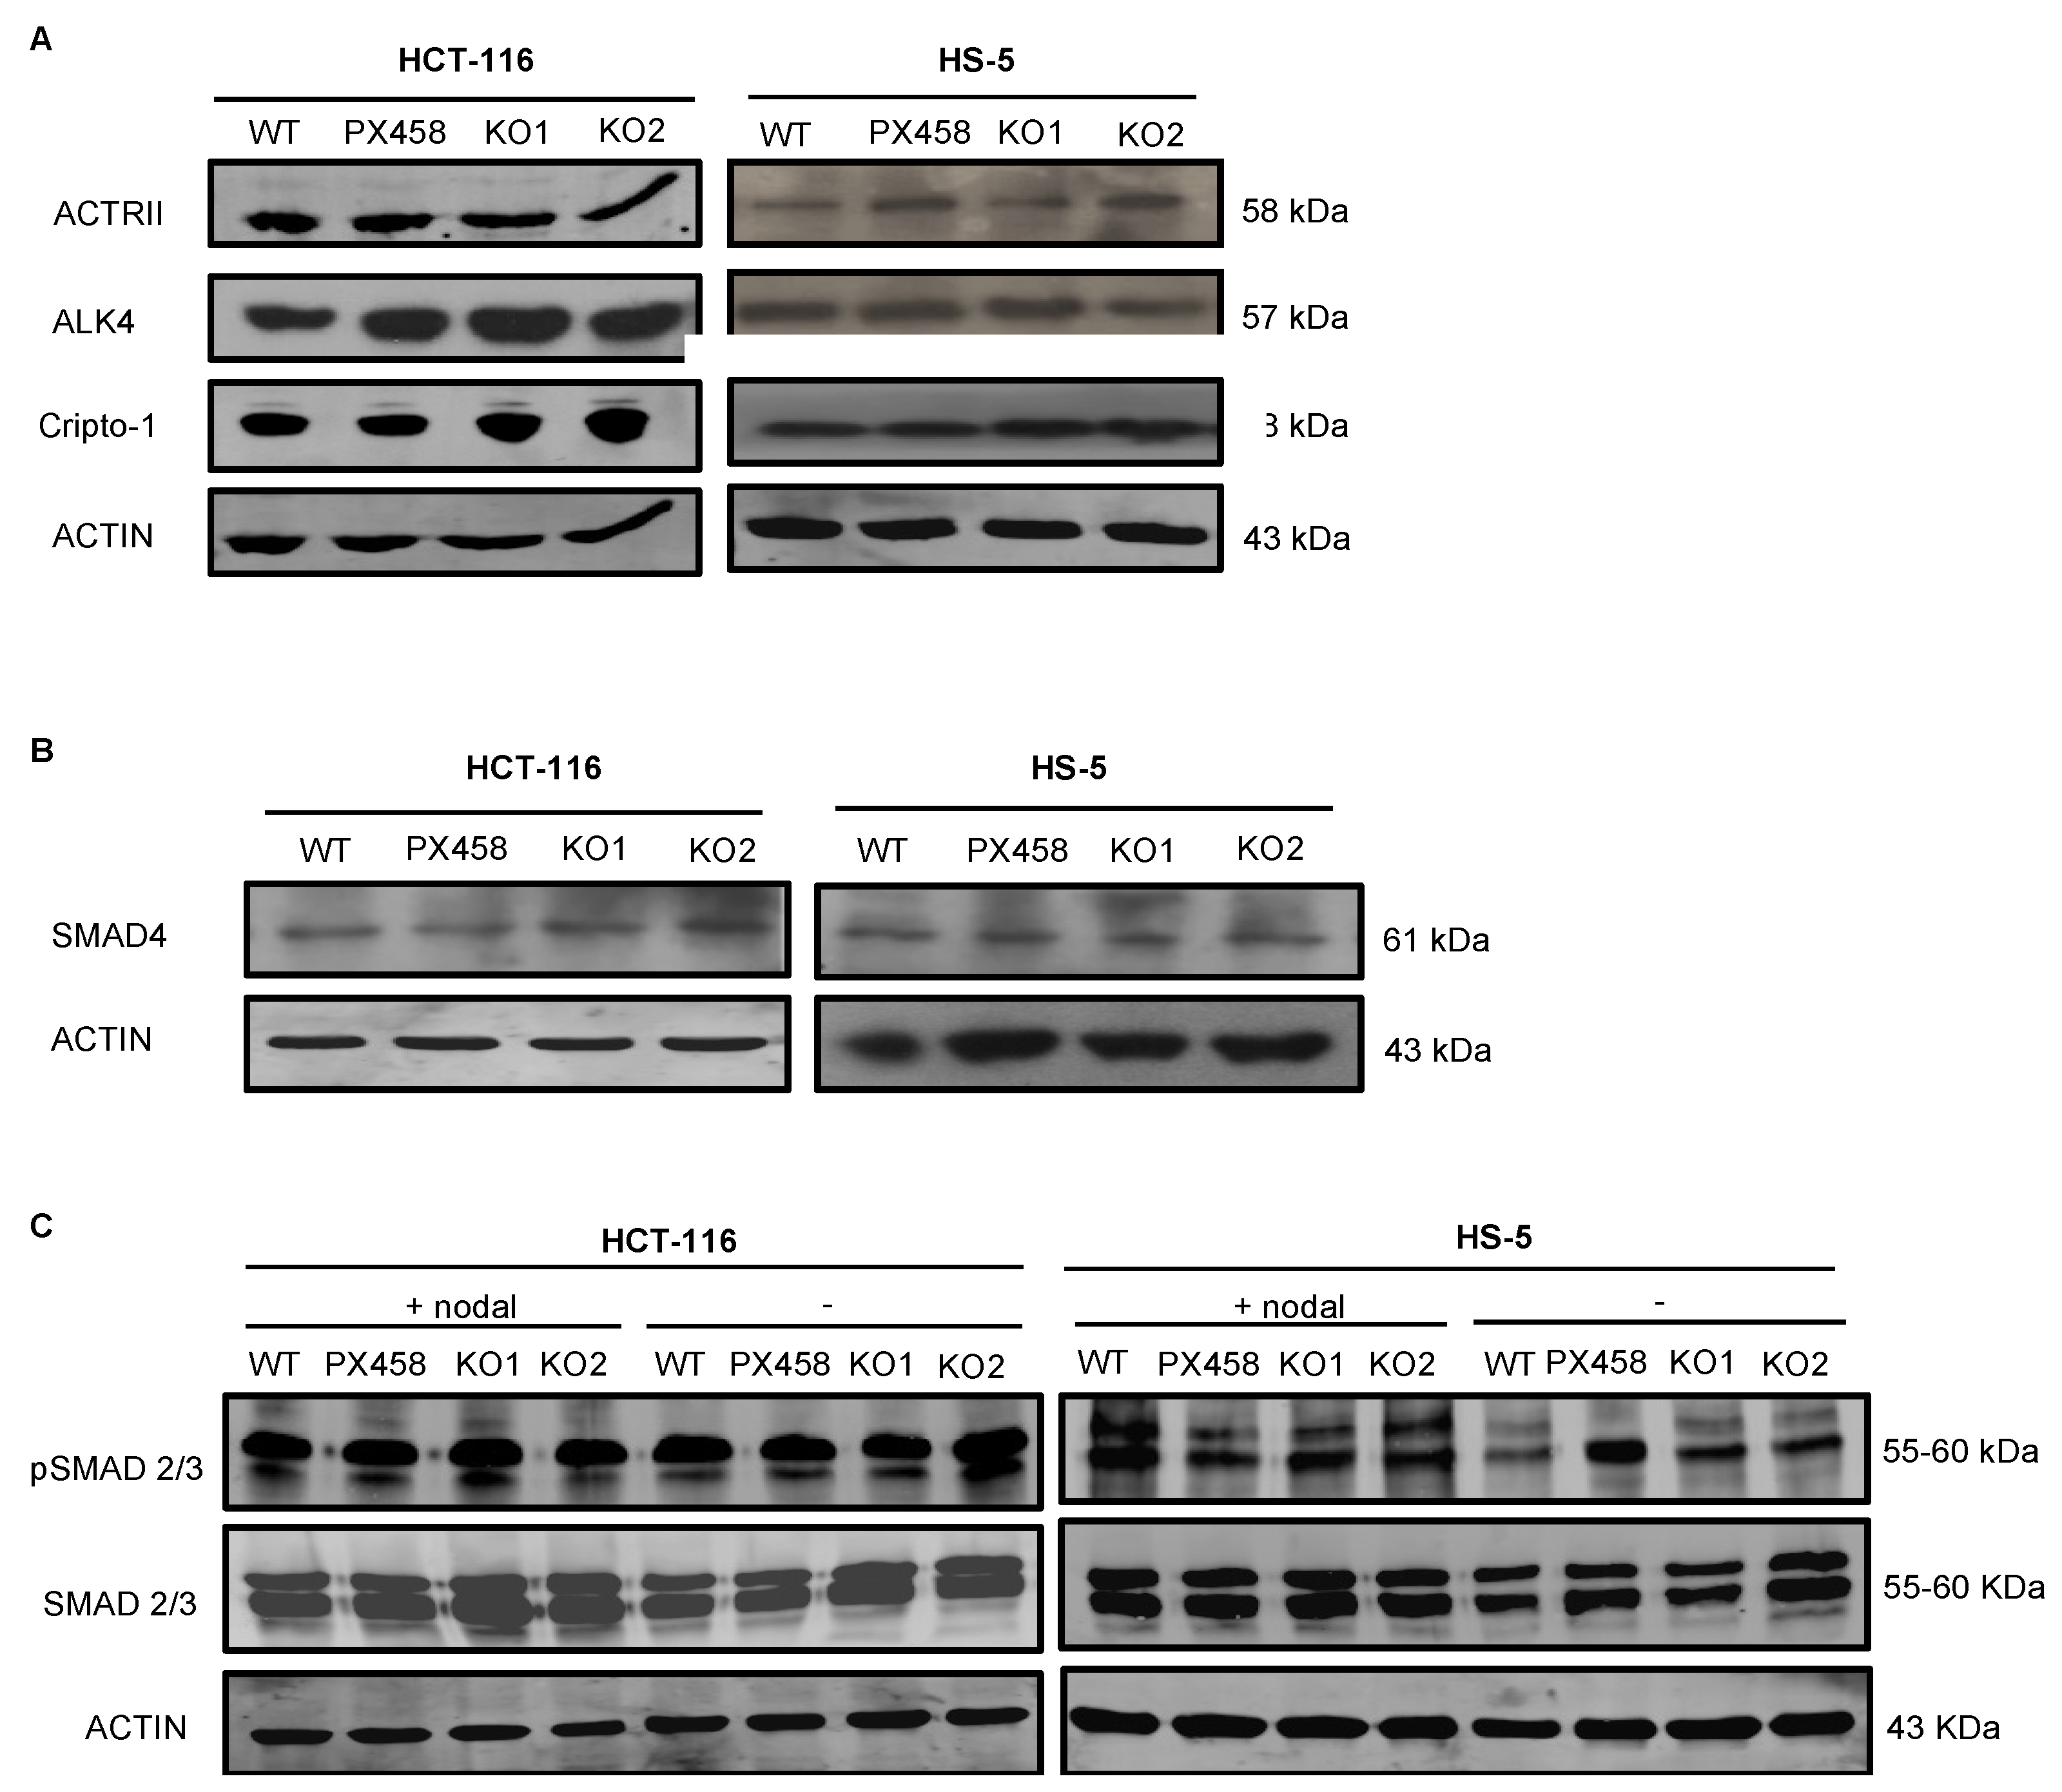
3.5. NOMO1 Inactivation Does Not Affect the Nodal Signaling Pathway Activity or Cell Proliferation

The NOMO1–NCLN–TMEM147 complex has been shown to modulate Nodal signaling in developing zebrafish embryos by an unknown mechanism [14,15,39]. Therefore, we next analyzed the abundance of several members of the Nodal pathway in NOMO1-KO and control cells. First, we used WB to quantify the protein expression of receptors ALK4 and ACTRII and the co-receptor Cripto-1 [18,23]. We observed no alterations in the abundance of any of these proteins after NOMO1 inactivation (Figure 4A). Once activated by the Nodal ligand, the receptors phosphorylate the Smad2 and Smad3 proteins that bind to Smad4 (Co-Smad). We found that Smad4 expression was not affected by NOMO1 inactivation in any of the cell lines analyzed (Figure 4B). To further examine whether NOMO1 loss affects the activity of the Nodal signaling pathway, we analyzed Smad2/3 and p-Smad2/3 levels in the presence or absence of recombinant human Nodal (rhNodal) (R&D Systems). Smad2/3 and p-Smad2/3 protein expression was found to be similar in WT and NOMO1-KO clones (Figure 4C). This strongly indicates that the Nodal pathway activity is not affected by NOMO1 inactivation.
To determine whether NOMO1 loss affects cell growth rates, WT and NOMO1-KO clones were cultured and cell proliferation was measured by MTT assays. No significant differences (p >0.05) were found between the growth rates of the NOMO1-KO and control clones (Supplementary Figure S2).

3.6. Gene Expression Profiling in NOMO1-KO Cell Lines

Although our results indicate that NOMO1 inactivation does not affect Nodal pathway activity, we aimed to test whether NOMO1 loss affects gene expression profiles. Total RNAs were extracted from NOMO1-KO and WT clones and processed for expression microarray and RNA sequencing (RNA-seq). For both analyses, an FC greater than 1.5 was considered for up-regulated genes, and an FC lower than −1.5 for down-regulated genes.
According to the microarray analysis, 126 genes common to the two cell lines (HCT-116 and HS-5) were found to be deregulated when the four NOMO1-KO clones were compared to the four NOMO1-WT clones (FC > 1.5; FC < −1.5). A total of 81 genes were up-regulated and 45 genes were down-regulated in NOMO1-KO clones, compared to WT (Supplementary Figure S3A; Table S4). According to the RNA-seq data, 592 genes common to the two cell lines were found to be deregulated (FDR < 0.05) when the six NOMO1-KO clones were compared to the six control clones. A total of 108 genes were significantly up-regulated and 213 were down-regulated in NOMO1-KO clones, compared to WT (Supplementary Figure S3B; Table S5). Gene Set Enrichment Analysis (GSEA) revealed the existence of 18 and 20 signaling pathways to be enriched by the deregulated genes associated with NOMO1 loss in the microarray and the RNA-seq assay, respectively (Supplementary Figure S4A,B).
The transcriptional profiling data indicated that NOMO1-deficient cell lines presented deregulated genes related to the TNFα (tumor necrosis factor α) pathway, as well as to the inflammatory and blood vessel formation processes, among others. These pathways are often disrupted during inflammatory bowel disease (IBD), which is an important risk factor for the development of CRC. Interestingly, microarray and RNA-seq approaches showed that commonly deregulated genes in NOMO1-KO cells perturb the EMT process by deregulating VCAN, CXCL8, PTX3, EDIL3, LOXL1, BDNF, QSOX1, LUM, PCOLCE, CAPG, POSTN, CCN1, CCN2, CD44, SERPINE2, THBS1, and VEGFA. These genes are also involved in altering cell migration [40,41,42,43,44,45,46,47,48,49]. In addition, an over-representation analysis (ORA) of the genes mentioned above indicated that different biological processes are affected by cell migration (Supplementary Figure S4C). Therefore, altering these two processes could help increase the metastatic capacity of NOMO1-KO cells. To identify whether NOMO1 inactivation affects these processes, we first studied the protein expression of the typical EMT-associated markers E-Cadherin and Vimentin and the expression of β-catenin due to its relationship with cell migration, invasion, and metastasis. However, the protein expression of these markers did not show significant changes when comparing NOMO1-KO and control clones (Supplementary Figure S4D).
Taken together, microarray and RNA-seq approaches showed a differential expression profile and a set of affected signaling pathways by NOMO1 loss, specially EMT and cell migration.

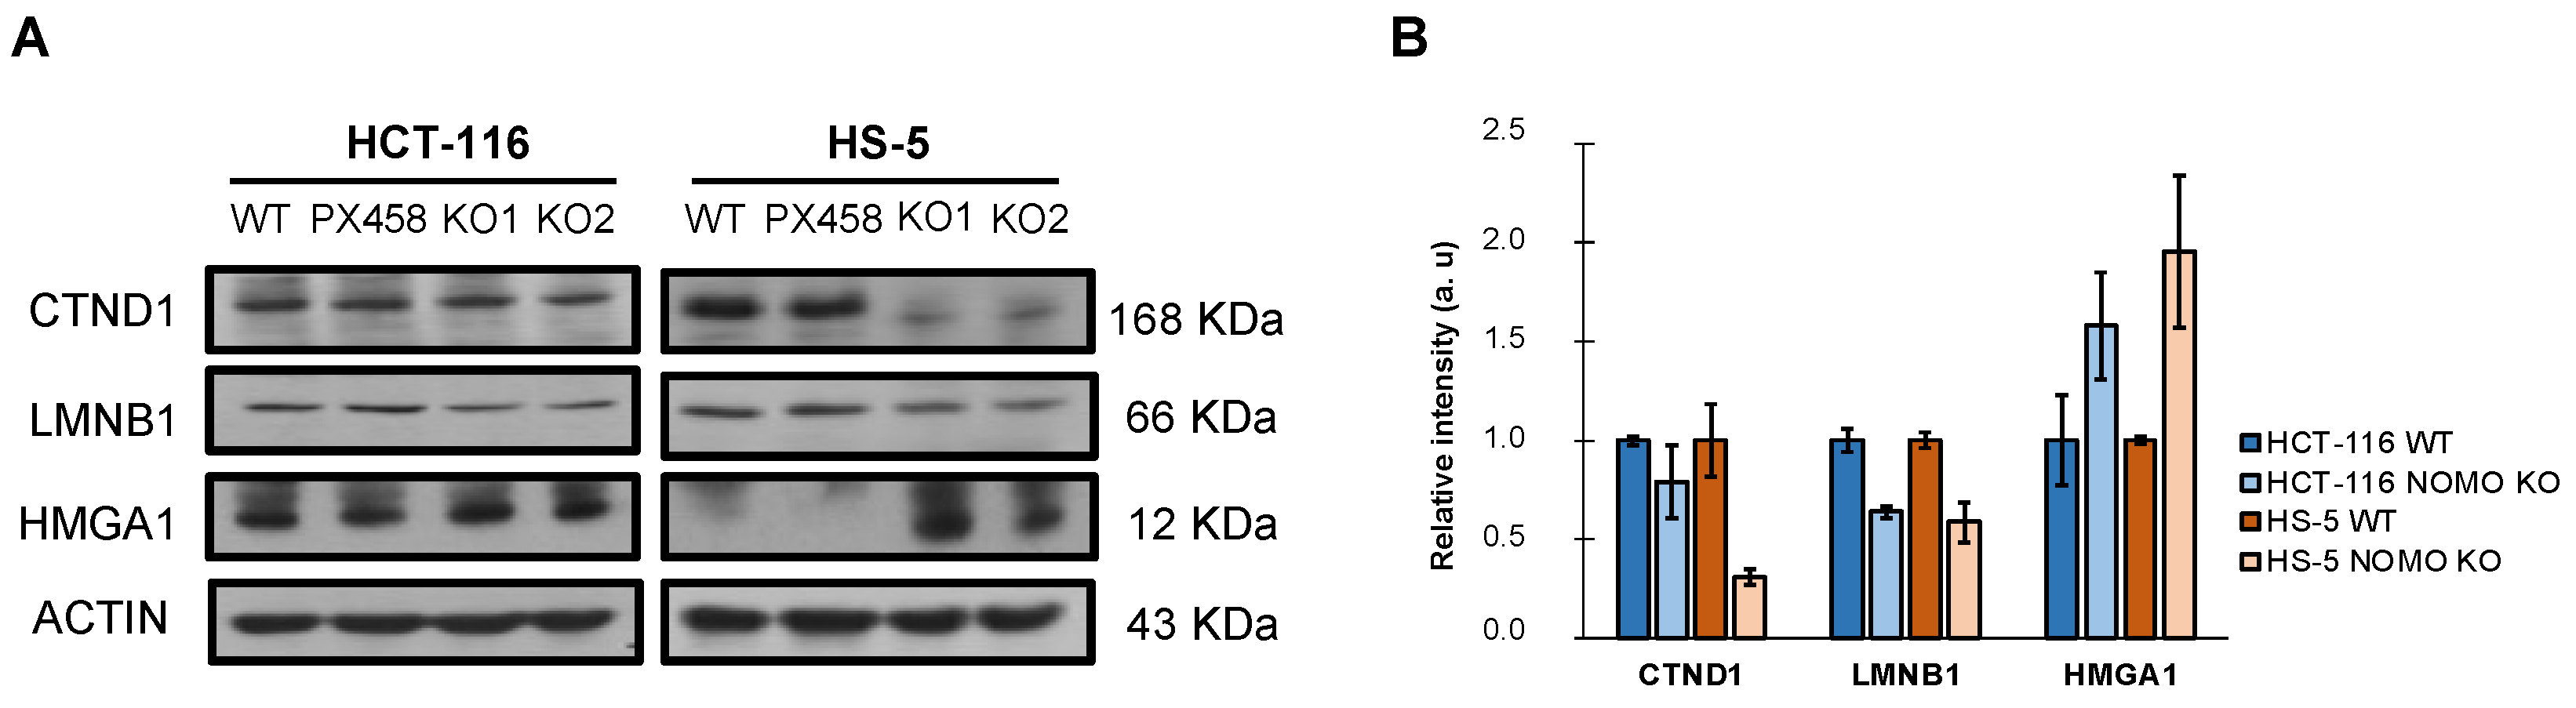
3.7. Protein Expression Profiling in NOMO1-KO Cell Lines

To elucidate the protein expression profile changes after NOMO1 inactivation in the two cell lines (HCT-116 and HS-5), an LC–IMS/MS analysis was performed. Four samples of a NOMO1-WT and NOMO1-KO clones were compared for the two cell lines using 0.5 µg of total protein of each clone. The proteome quantification data of 3227 proteins revealed 357 and 486 deregulated proteins (p < 0.05) in HCT-116 and HS-5 NOMO1-KO cell lines, respectively. A total of 205 up-regulated and 152 down-regulated proteins were found in the HCT-116 NOMO1-KO clone. In HS-5, 182 proteins were up-regulated and 304 proteins were down-regulated in the NOMO1-KO clone, compared to WT. When we compared commonly deregulated proteins in all the NOMO1-KO clones vs. all control clones, we identified 12 up-regulated and 16 down-regulated proteins across the two cell lines (Supplementary Table S6). GSEA revealed the existence of two pathways (apical junction and cholesterol homeostasis) enriched (FDR < 0.05) by the deregulated proteins associated with NOMO1 loss.
In addition, WB detected and confirmed differentially expressed cell-migration-associated proteins in the LC–IMS/MS analysis (CTND1, LMNB1, and HMGA1) (Figure 5). These results justify the alteration of the processes observed in the transcriptome (EMT and cell migration) and suggest that NOMO1 loss could influence the migratory capability in CRC cells.

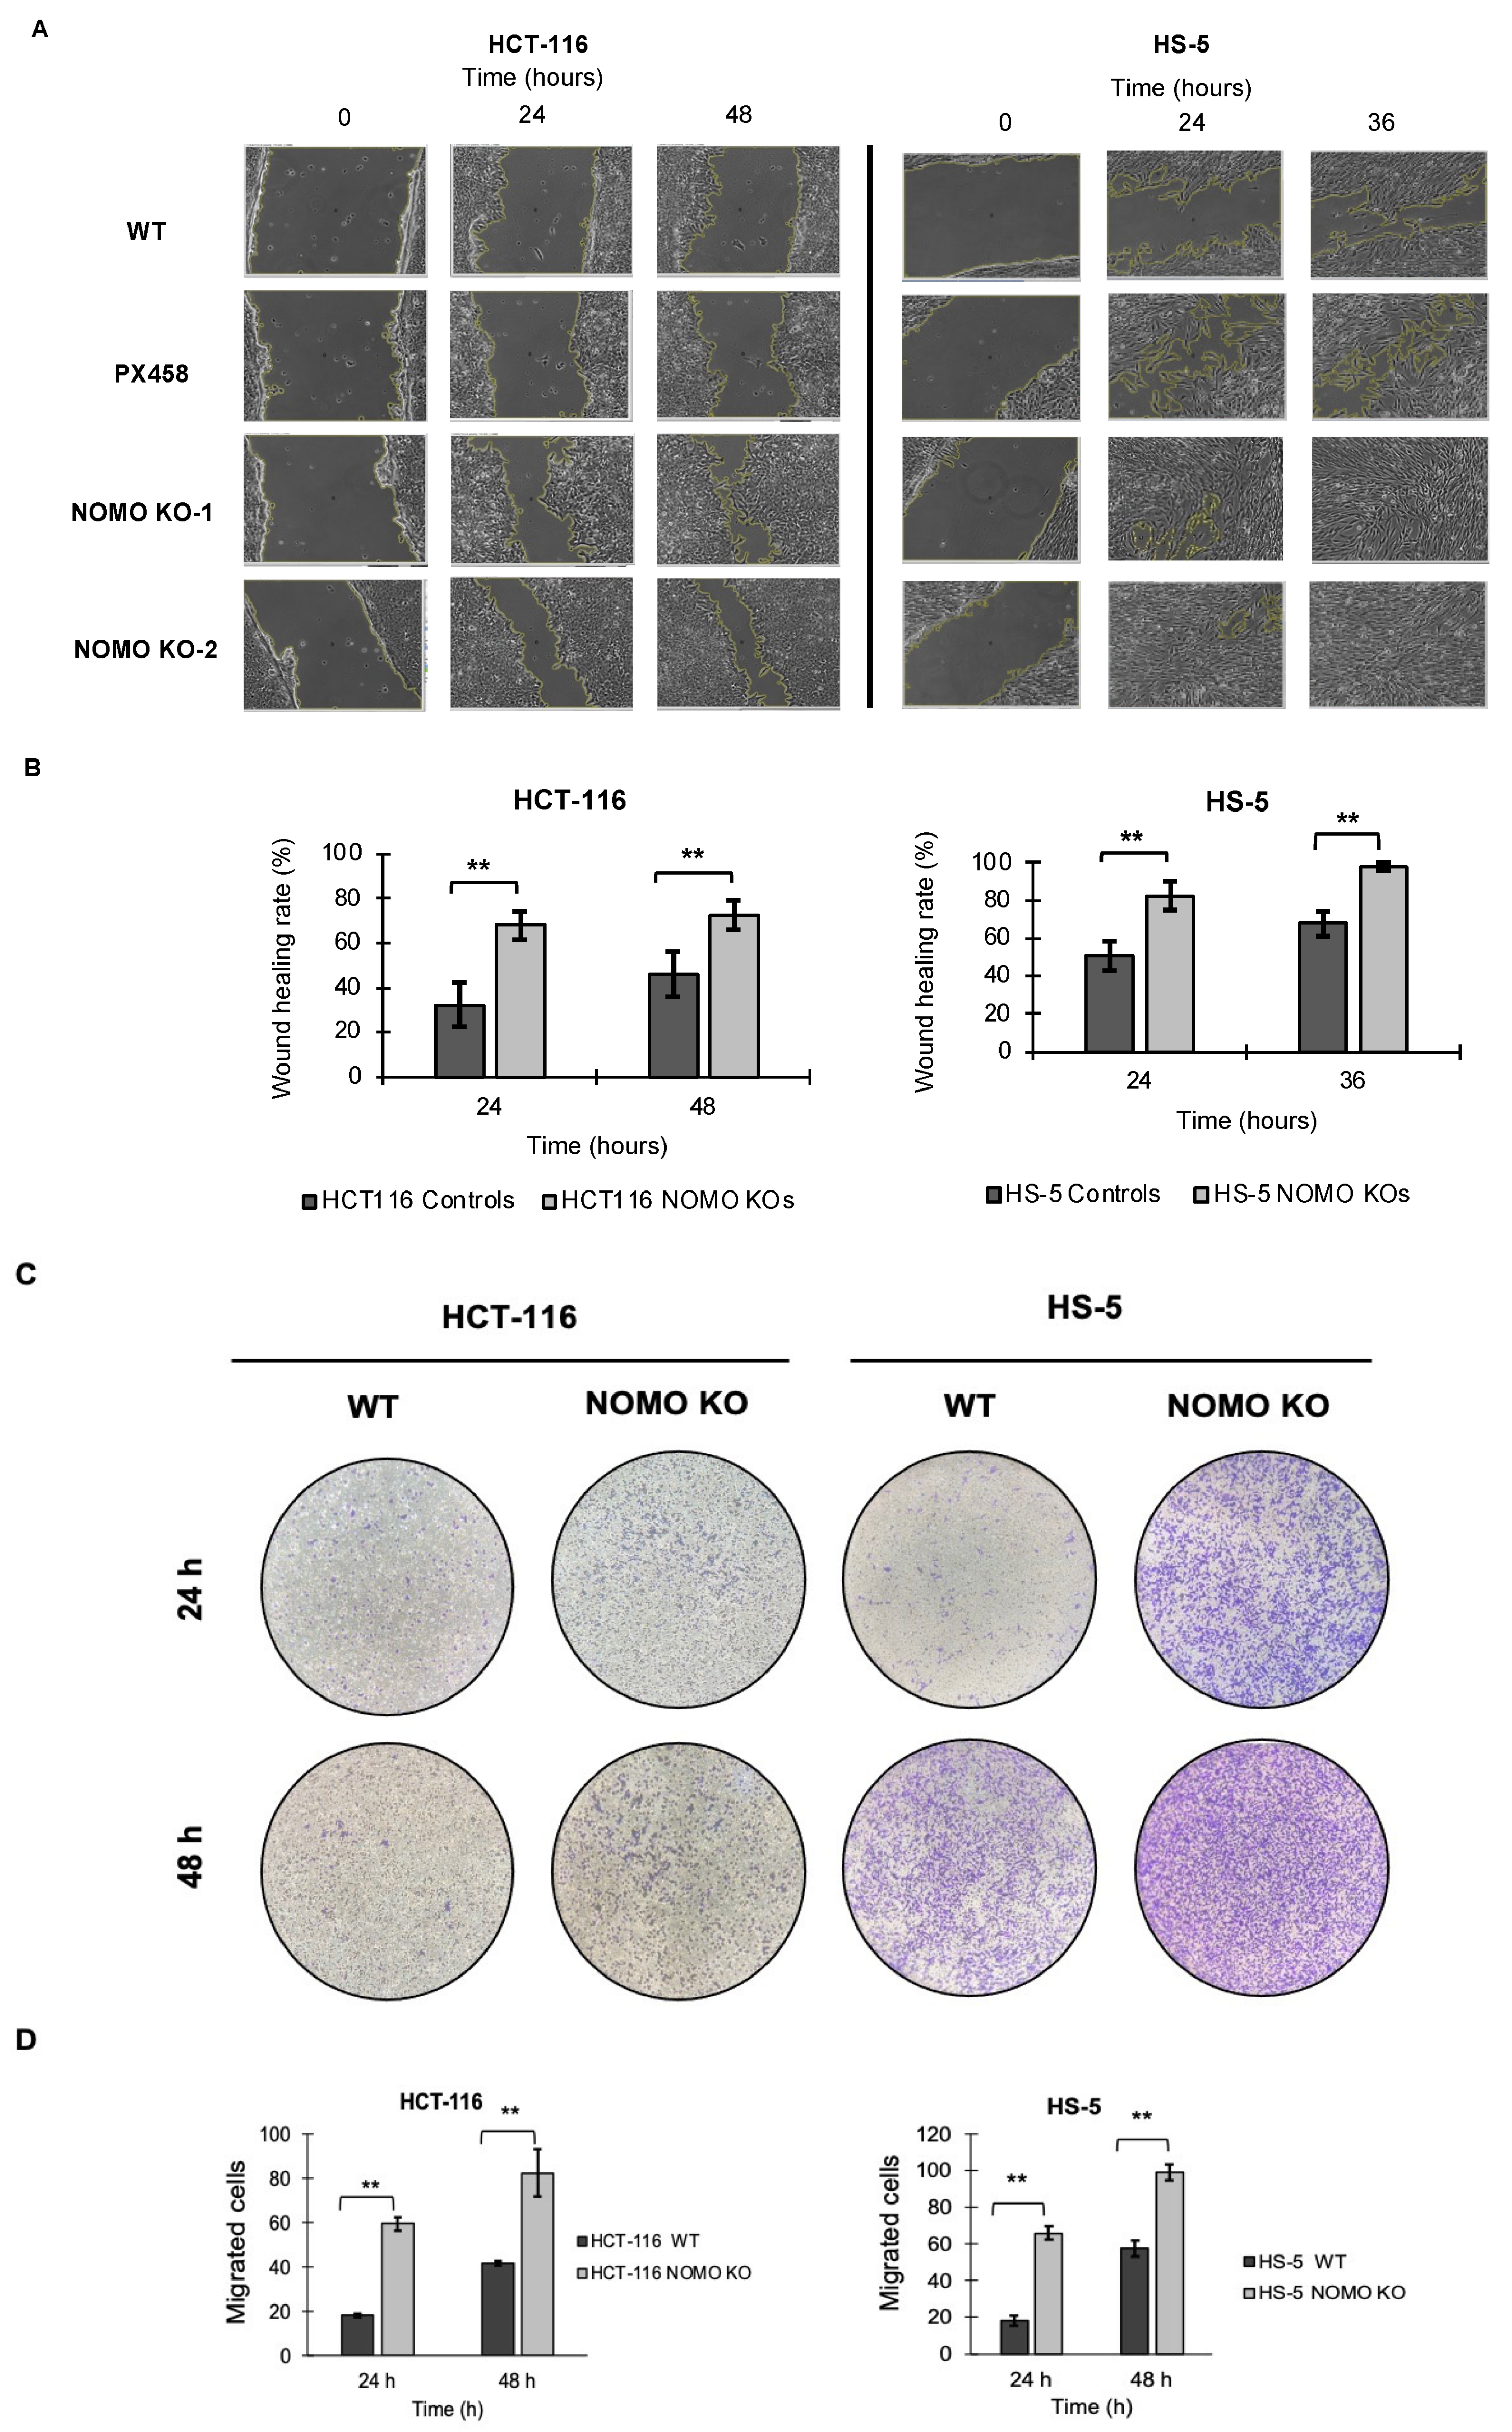
3.8. NOMO1 Inactivation Promotes Cell Migration

To determine whether NOMO1 has an important role in cell migration, we tested the migration capacity of colon cancer cells in the absence of this gene. We performed wound healing and Transwell migration assays to compare the cell migration ability of WT and NOMO1-KO clones in both cell lines. For the HCT-116 cell line, the recolonized area was calculated at 24 and 48 h. For the HS-5 cell line, it was calculated at 24 and 36 h (in the wound healing assay), since at 36 h, all the wounds were closed. Consistent across all cell lines, our results showed that the percentage of migration was significantly higher in the NOMO1-KO clones compared to controls (t-test, p < 0.01) (Figure 6). Therefore, NOMO1 loss promotes cell migration.

3.9. Nomo1 Deficiency in Mouse Colon Cells Does Not Modify the Susceptibility of Developing EOCRC

To see the effect of the somatic deletion of NOMO1 in EOCRC, and considering that this gene could be a tumor suppressor, we decided to silence Nomo1 expression in the mouse colon cells using a conditional mouse model [34]. The selection of a conditional mouse model allowed us to induce a Nomo1 deletion at a specific time and in a specific cellular context. A total of nine mice (8 weeks old) were colon injected with a Cre adenovirus: 6 Nomo1flox/flox, 2 Nomo1flox/+, and 1 Nomo1+/+. As a control group, we used 2 Nomo1flox/flox and 1 Nomo1flox/+. All mice were monitored for tumor development until 20 months after Cre activation, when they were euthanized for histological analysis of the gastrointestinal tract. PCR was used to check for Nomo1 exon 3 deletion in genomic DNA from mice of experimental and control groups. Nomo1flox/flox; CreAdV and Nomo1flox/+; CreAdV showed a fragment of 482 bp corresponding with the Nomo1 exon 3 ablation (Supplementary Figure S5). The pathological study of both transduced and control mice showed the absence of lesions in the digestive tract compatible with the development of CRC or other tumors. This result indicates that Nomo1 deficiency could not be a driver for the development of CRC tumors in mice.

4. Discussion

The rising burden of EOCRC with unknown etiologies is a global epidemic—particularly given that EOCRC is characterized by more aggressive phenotypes and poorer prognostic outcomes, compared with late-onset disease [10]. Despite initial advances in understanding the distinct disease burden (with clinical, pathological, and molecular phenotypes), few studies have explored the mechanistic underpinnings of this malignancy [50,51,52]. Such studies of EOCRC etiology may help translate research findings into clinical advances to improve outcomes specifically for this growing population. Our study is one of the first mechanistic studies of EOCRC biology with a focus on the role of NOMO1 in colorectal carcinogenesis among young individuals. We applied the CRISPR/Cas9 technology to delete endogenous NOMO1 in multiple independent cell lines, and used a NOMO1 gut-specific conditional mouse model to study subsequent tumor development. Characterization of the NOMO1-KO clones revealed that though NOMO1 loss did not affect Nodal signaling pathway activity or cell proliferation, it increased CRC cell migration. There was also no subsequent tumor development on deleting Nomo1 using in vivo models. Together, these findings suggest that other signaling pathways deregulated by the loss of NOMO1 may play a relevant role in the pathogenesis of EOCRC.
Until now, three NOMO genes had been described, NOMO1, NOMO2, and NOMO3, with a sequence homology of more than 96%. In this work, we observed that the amount of NOMO gene amplified by qPCR was the same as that amplified for different single-copy genes. These results, together with (i) an observed frequency of NOMO1 WT alleles close to 100% and (ii) the finding that across different species, including the mouse, there is only one NOMO gene, strongly suggest the existence of a single NOMO gene. Thus, it is possible that alternative NOMO alleles are either a rare mutation or a sequence annotation error.
In an earlier study, we reported that more than 70% of EOCRCs examined had lost the NOMO1 gene [13]. In this study, we expanded upon these findings to investigate the NOMO1 mutational profile in EOCRC and found that 15.3% of the samples presented a mutation that generated a premature stop codon, resulting in a truncated protein. In addition, six unknown clinical significance variants were identified and classified as probably pathogenic. Thus, we demonstrated that in early-onset colorectal tumors, this gene can be inactivated not only by deletion but also by mutation, which highlights the recurrence of NOMO1 inactivation in the pathogenesis or progression of EOCRC. To date, the TCGA-COAD database has reported only 3.4% of the NOMO1 gene mutations in EOCRC, 4.5-fold lower than that observed in our study. This higher incidence of NOMO1 gene mutations observed in our cohort could be associated with its clinicopathological characteristics, where 90% of the tumors had MSS [13]. This mutational profile could also be related to the environmental influence, given that EOCRC has been shown to exhibit disparities in etiology according to race, sex, and geographic area [53]. Therefore, our data show the existence of NOMO1 gene pathogenic mutations associated with EOCRC and suggest that this gene may function as a tumor suppressor.
NOMO1 forms a protein complex with NCLN and TMEM147, and the complex is located in the endoplasmic reticulum and inhibits Nodal signaling—a signal transduction pathway that maintains pluripotency in human embryonic stem cells [14,39]. Previous studies have shown that the formation of the NOMO1–NCLN–TMEM147 protein complex is limited by a post-transcriptional regulation mechanism that originates from the assembly of the complexes [14]. The incorporation of these monomeric components in the protein complex stabilizes them, significantly increasing their half-lives [39]. Although the assembly mode of the complex is not well understood, Dettmer et al. (2010) showed the critical role that NCLN plays in the formation of the protein complex by controlling the cellular steady-state levels of NOMO1 and TMEM147, which are synthesized in excess and their monomeric forms subjected to rapid proteolytic degradation [14]. The inactivation of any of the three proteins resulted in a strong reduction in the other two. However, NOMO1 and TMEM147 overexpression, alone or in combination, did not yield increased levels of NCLN expression, suggesting that NCLN may be the limiting factor in this protein complex formation [14,39].
In this work, we also observed that NOMO1 inactivation strongly reduced NCLN protein expression, while the levels of TMEM147 were not modified in any of the cell lines studied herein. These results confirm protein complex destabilization by the modification of NOMO1 expression levels. However, our results are inconsistent with the reported reduction in TMEM147 levels by NOMO1 inactivation [14]. We hypothesize that although the protein complex is not correctly assembled, the unbound TMEM147 is not degraded by the proteasome, potentially due to its stability in the monomeric form across the analyzed cell lines. Microarrays, RNA-seq, and qRT-PCR analyses also showed that the destabilization of NCLN in the absence of NOMO1 was not accompanied by a reduction in its mRNA. These results indicate that protein reduction is caused by a post-transcriptional mechanism, in agreement with the data published by Dettmer et al. [14].
After elucidating the effect of NOMO1 loss in the NOMO1–NCLN–TMEM147 complex, we evaluated its role in activating the Nodal signaling pathway, essential for cellular differentiation during embryonic development [20] and reactivation in multiple tumor types [21], where it has been related to increased proliferation and invasion [18,54]. We found that NOMO1 inactivation did not perturb the expression of any proteins involved in the Nodal signaling pathway, including both p-Smad2 and p-Smad3, whose levels should be elevated upon signaling pathway activation. These results suggest that the possible carcinogenic effect of NOMO1 loss is not related to its described role as an inhibitor of the Nodal pathway. Further investigation is essential to identify other biological pathways that might be regulated by NOMO1 inactivation in EOCRC.
To determine the role of NOMO1 in EOCRC, we analyzed the transcriptional and protein expression profiles of WT and NOMO1-KO cell lines. Our results revealed a differential expression profile of genes commonly deregulated across the HCT-116 and HS-5 cell lines due to NOMO1 inactivation, with the involvement of several genes associated with cell migration, invasion, and EMT processes. For this reason, we first studied the protein expression of E-Cadherin, Vimentin, and β-Catenin. However, these markers did not show significant changes after NOMO1 inactivation, suggesting that other proteins may be involved in the deregulation of EMT and cell migration. In this sense, LC–IMS/MS analysis revealed a set of proteins communally deregulated, and associated with migration, invasion, and EMT processes, and that could respond to NOMO1 inactivation by contributing to the increased migratory capacity.
For example, CTND1 (under-expressed in both cell lines) has been associated with the stabilization of E-Cadherin and the maintenance of cell adherent junctions [55], consistent with the deregulated pathways associated with our proteome analysis. Moreover, CTND1 is involved in the Wnt/beta-catenin/CTNNB1 signaling pathway by regulating cell proliferation, migration, and differentiation of endothelial cells in tumor growth [56]. According to other studies, CTND1 loss is associated with poor prognosis and metastasis in ductal breast cancer and is considered a tumor suppressor [57]. In head and neck squamous carcinoma (HNSCC) and oral squamous cell carcinoma (OSCC) cell lines, loss of CTND1 increases migration and invasion and favors EMT [58,59]. Lamin B1 (LMNB1), under-expressed in both cell lines in our study, has been described as a tumor suppressor in lung cancer. LMNB1 knockdown in lung epithelial cells promoted EMT, cell migration, tumor growth, and metastasis by activating RET/p38 signaling [60]. HMGA1, up-regulated in NOMO1-KO cells, is overexpressed in cervical cancer tissues and is positively correlated with lymph node metastasis and advanced clinical stage. In addition, HMGA1 overexpression enhances tumor growth and accelerates cell migration and invasion in cervical cancer cell lines [61].
Previous studies have shown that Nodal expression can increase invasive and metastatic capacity of tumor cells [21]. Although we did not find increased activation of the Nodal signaling pathway upon NOMO1 loss, we investigated the effect of NOMO1 inactivation on cellular migration capacity due to the alteration of the cell-migration-associated proteins (CTND1, LMNB1, and HMGA1), discussed above. Strikingly, we found that NOMO1 inactivation increased the migration ability of all cell lines analyzed. Taken together, these data provide a possible explanation for the increased migration capacity exhibited by the NOMO1-KO clones, and further study is warranted on the role of these genes in EOCRC development. Although increased migration induced by NOMO1 loss could contribute to colorectal carcinogenesis, we cannot exclude the possibility of other signaling pathways deregulated by NOMO1 deficiency playing a relevant role in the pathogenesis of the disease.
To study the role of NOMO1 in colorectal carcinogenesis, a conditional Nomo1 mouse model was used to analyze this gene function in a rigorous and specific way that avoids embryonic lethality [34]. This animal model, which uses the Cre-loxp system to delete a specific gene in a particular tissue, has been efficiently tested by other groups [62,63]. For example, Huang et al. used this method to study tumor formation in the colon [64]. Our in vivo models indicate that the loss of Nomo1 does not directly contribute to the development of colorectal tumors in mice after 20 months of follow-up. In this case, we think that the cellular and environmental influence on the mouse colon cells differ from the cellular context in human colon during colorectal carcinogenesis.

5. Conclusions

In conclusion, our data suggest that, despite being deleted in 70% of EOCRC cases [13] and promoting colon cancer cell migration, NOMO1 might play a secondary role in the development of this disease. The data also suggest that other coding or non-coding genes located in the same chromosomal region (16p13.11-13.12) could act as driver genes in early-onset colorectal carcinogenesis. Consequently, further mechanistic studies are needed to understand the role of this putative tumor suppressor in EOCRC and the distinct mechanistic underpinnings of early-onset colorectal carcinogenesis.

Supplementary Materials

The following supporting information can be downloaded at https://www.mdpi.com/article/10.3390/cancers14164029/s1: Figure S1: Nucleotide sequences corresponding to each sgRNA used (sgRNA1, sgRNA2, and sgRNA3) and their binding sites; Figure S2: Graphical representation of cell proliferation rates for NOMO1-KO and control clones in HCT-116 and HS-5 cell lines. Ratios of cell proliferation were measured at 24, 48, and 72 h. Data are shown as the mean of three replicates ± standard deviation (SD). No statistically significant differences were detected (p-value > 0.05); Figure S3: Differentially expressed genes after NOMO1 inactivation in the two cell lines (HCT-116 and HS-5). (A) Heatmap of commonly deregulated genes in the expression microarray assay (FC > 1.5; FC < −1.5). (B) Heatmap of commonly deregulated genes in the RNA sequencing analysis (FC > 1.5; FC < −1.5); Figure S4: Deregulated biological processes associated with NOMO1 loss. EMT-associated markers analysis by Western blot. (A) Deregulated signaling pathways common to the two cell lines (HCT-116 and HS-5) in NOMO1-KO clones, including dysregulated genes in the expression microarray analysis (FC > 1.5; FC < −1.5). (B) Deregulated signaling pathways in the absence of NOMO1 common to the two cell lines in NOMO1-KO clones, including dysregulated genes in the RNA sequencing analysis (FC > 1.5; FC < −1.5). (C) Deregulated signaling pathways in the absence of NOMO1 common to the two NOMO1-KO cell lines, including the dysregulated genes that showed to perturb EMT process. (D) Protein expression analysis of E-Cadherin, B-Catenin, and Vimentin by Western blot in NOMO1-KO and wild-type HCT-116 and HS-5 cell lines; Figure S5: Intestinal genomic DNA was isolated from Nomo1flox/flox, Nomo1flox/+, and Nomo1+/+ mice with and without Cre injection. PCR amplification of Nomo1 with exon3 deletion detected a 482 bp band due to Cre activity on Nomo1 floxed locus; Figure S6: Original uncropped Western blots used in this study; Table S1: Primers used to amplify the specific fragment of each target gene; Table S2: Sequences of oligonucleotides designed as sgRNAs (sgRNA1, sgRNA2, and sgRNA3) and corresponding DNA sequences; Table S3: Antibodies used to study proteins expression by Western blot; Table S4: Microarray dysregulated genes in NOMO1-KO clones common to HCT-116 and HS-5 cell lines. Upregulated genes (fold change, FC > 1.5) and downregulated genes (FC < −1.5); Table S5: RNA sequencing dysregulated genes in NOMO1-KO clones common to HCT-116 and HS-5 cell lines. Upregulated genes (fold change, FC > 1.5) and downregulated genes (FC < −1.5); Table S6: Dysregulated proteins associated with NOMO1 loss common to HCT-116 and HS-5 cell lines. Protein expression levels are showed as >1 or <1 for upregulated downregulated proteins, respectively.

Author Contributions

Conceptualization, J.P. and R.G.-S.; formal analysis, L.A.C. and J.L.G.; funding acquisition, J.P. and R.G.-S.; investigation, L.A.C., J.L.G., and R.G.-S.; methodology, J.P.-G., A.M.-M., P.G.-V., N.G.-U. and M.S.-M.; resources, R.V.-T., Ó.B., L.M., M.S.-M. and M.F.; supervision, R.G.-S.; validation, R.G.-S.; writing––original draft, J.P.-G. and A.M.-M.; writing––review and editing, J.P.-G., A.M.-M., A.B.H., A.N.H., J.P. and R.G.-S. The authors wish it to be known that, in their opinion, the first two authors should be regarded as joint first authors. All authors have read and agreed to the published version of the manuscript.

Funding

This study was supported by the health research program of the Instituto de Salud Carlos III (Spanish Ministry of Economy and Competitiveness, PI20/01569 and PI20/0974), co-funded by FEDER funds, and Mutua Madrileña Foundation (FMM20/001). A.M.-M was supported by a predoctoral research grant from the Dr. Moraza Fundation (FMoraza18/001). P.G.V and N.G.-U were supported by a predoctoral research grant from the Consejería de Educación—Junta de Castilla y León. A.N.H. was supported by the National Institutes of Health K12 HD043483 from the Eunice Kennedy Shriver National Institute of Child Health and Human Development.

Institutional Review Board Statement

The study with animals followed Spanish and European Union guidelines for animal experimentation (RD1201/05, RD 53/2013, and 86/609/CEE). Genetically modified animals were generated at Transgenic Facility, Nucleus, University of Salamanca, and the generation was approved by the Bioethics Committee of the University of Salamanca and “Consejería de Agricultura y Ganadería de la Junta de Castilla y León” (ref 338).

Informed Consent Statement

Informed consent was obtained from all the subjects involved in the study.

Data Availability Statement

The datasets generated and/or analyzed during the current study are available in the GEO (ID GSE198383; http://www.ncbi.nlm.nih.gov/gds/ (accessed on 10 March 2022)) and PRIDE (PXD033636; http://proteomecentral.proteomexchange.org (accessed on 4 May 2022)) repositories.

Acknowledgments

The authors thank the Anatomy Pathology Service from the Hospital University of Salamanca and the Transgenic Service from the University of Salamanca for their assistance.

Conflicts of Interest

The authors declare no conflict of interest.

Abbreviations

ATCCAmerican type culture collection
CADDCombined annotation-dependent depletion
CNAsCopy number alterations
CRCColorectal cancer
CSCCancer stem cell
DMEMDulbecco’s modified eagle’s medium
DTTDithiothreitol
EMTEpithelial-mesenchymal transition
EOCRCEarly-onset colorectal cancer
FBSFetal bovine serum
FDRFalse discovery rate
FFPEFormalin-fixed paraffin-embedded
GSEAGene set enrichment analysis
HNSCCHead and neck squamous carcinoma
KOKnockout
LC-IMS/MSLiquid chromatography-mass spectrometry
LOCRCLate-onset colorectal cancer
MMRMissmatch repair
MSIMicrosatellite instability
MSSMicrosatellite stable
NCLNNicalin
NGSNext-generation sequencing
NOMO1Nodal modulator 1
ORAOver-representation analysis
OSCCOral squamous cell carcinoma
PASEFParallel accumulation serial fragmentation
PolyPhenPolymorphism phenotyping
qPCRQuantitative PCR
qRT-PCRQuantitative reverse transcription PCR
rhNodalRecombinant human nodal
RMARobust multi-array average
RNA-seqRNA sequencing
RT-PCRReal-time PCR
SDStandard deviation
SiftSorting intolerant from tolerant
SPFSpecific pathogen free
TMEM147Transmembrane protein 147
VUSVariants of uncertain significance
WBWestern blot
WebGestaltWEB-based gene set analysis
WTWild type

References

  1. Sung, H.; Ferlay, J.; Siegel, R.L.; Laversanne, M.; Soerjomataram, I.; Jemal, A.; Bray, F. Global Cancer Statistics 2020: GLOBOCAN Estimates of Incidence and Mortality Worldwide for 36 Cancers in 185 Countries. CA Cancer J. Clin. 2021, 71, 209–249. [Google Scholar] [CrossRef] [PubMed]
  2. Arnold, M.; Sierra, M.S.; Laversanne, M.; Soerjomataram, I.; Jemal, A.; Bray, F. Global Patterns and Trends in Colorectal Cancer Incidence and Mortality. Gut 2017, 66, 683–691. [Google Scholar] [CrossRef] [PubMed] [Green Version]
  3. Perea, J.; Rodríguez, Y.; Rueda, D.; Marín, J.C.; Díaz-Tasende, J.; Álvaro, E.; Alegre, C.; Osorio, I.; Colina, F.; Lomas, M.; et al. Early-Onset Colorectal Cancer Is an Easy and Effective Tool to Identify Retrospectively Lynch Syndrome. Ann. Surg. Oncol. 2011, 18, 3285–3291. [Google Scholar] [CrossRef] [PubMed]
  4. Mauri, G.; Sartore-Bianchi, A.; Russo, A.G.; Marsoni, S.; Bardelli, A.; Siena, S. Early-Onset Colorectal Cancer in Young Individuals. Mol. Oncol. 2019, 13, 109–131. [Google Scholar] [CrossRef] [PubMed] [Green Version]
  5. Perea, J.; Rueda, D.; Canal, A.; Rodríguez, Y.; Álvaro, E.; Osorio, I.; Alegre, C.; Rivera, B.; Martínez, J.; Benítez, J.; et al. Age at Onset Should be a Major Criterion for Subclassification of Colorectal Cancer. J. Mol. Diagn. 2014, 16, 116–126. [Google Scholar] [CrossRef]
  6. Budinska, E.; Popovici, V.; Tejpar, S.; D’Ario, G.; Lapique, N.; Sikora, K.O.; Di Narzo, A.F.; Yan, P.; Graeme Hodgson, J.; Weinrich, S.; et al. Gene Expression Patterns Unveil a New Level of Molecular Heterogeneity in Colorectal Cancer. J. Pathol. 2013, 231, 63–76. [Google Scholar] [CrossRef]
  7. Jasmine, F.; Rahaman, R.; Dodsworth, C.; Roy, S.; Paul, R.; Raza, M.; Paul-Brutus, R.; Kamal, M.; Ahsan, H.; Kibriya, M.G. A Genome-Wide Study of Cytogenetic Changes in Colorectal Cancer Using SNP Microarrays: Opportunities for Future Personalized Treatment. PLoS ONE 2012, 7, e31968. [Google Scholar] [CrossRef]
  8. Muzny, D.M.; Bainbridge, M.N.; Chang, K.; Dinh, H.H.; Drummond, J.A.; Fowler, G.; Kovar, C.L.; Lewis, L.R.; Morgan, M.B.; Newsham, I.F.; et al. Comprehensive Molecular Characterization of Human Colon and Rectal Cancer. Nature 2012, 487, 330–337. [Google Scholar] [CrossRef] [Green Version]
  9. Holowatyj, A.N.; Gigic, B.; Herpel, E.; Scalbert, A.; Schneider, M.; Ulrich, C.M.; Achaintre, D.; Brezina, S.; van Duijnhoven, F.J.B.; Gsur, A.; et al. Distinct Molecular Phenotype of Sporadic Colorectal Cancers among Young Patients Based on Multiomics Analysis. Gastroenterology 2020, 158, 1155–1158.e2. [Google Scholar] [CrossRef]
  10. Arriba, M.; Sánchez, C.; Vivas, A.; Nutu, O.A.; Rueda, D.; Tapial, S.; Rodríguez, Y.; Brandáriz, L.; García, J.L.; García-Olmo, D.; et al. Intermediate-Onset Colorectal Cancer: A Clinical and Familial Boundary between Both Early and Late-Onset Colorectal Cancer. PLoS ONE 2019, 14, e0216472. [Google Scholar] [CrossRef]
  11. Di Leo, M.; Zuppardo, R.A.; Puzzono, M.; Ditonno, I.; Mannucci, A.; Antoci, G.; Russo Raucci, A.; Patricelli, M.G.; Elmore, U.; Tamburini, A.M.; et al. Risk Factors and Clinical Characteristics of Early-Onset Colorectal Cancer vs. Late-Onset Colorectal Cancer: A Case-Case Study. Eur. J. Gastroenterol. Hepatol. 2021, 33, 1153–1160. [Google Scholar] [CrossRef] [PubMed]
  12. Arriba, M.; García, J.L.; Inglada-Pérez, L.; Rueda, D.; Osorio, I.; Rodríguez, Y.; Álvaro, E.; Sánchez, R.; Fernández, T.; Pérez, J.; et al. DNA Copy Number Profiling Reveals Different Patterns of Chromosomal Instability within Colorectal Cancer According to the Age of Onset. Mol. Carcinog. 2016, 55, 705–716. [Google Scholar] [CrossRef] [PubMed]
  13. Perea, J.; García, J.L.; Pérez, J.; Rueda, D.; Arriba, M.; Rodríguez, Y.; Urioste, M.; González-Sarmiento, R. NOMO-1 Gene Is Deleted in Early-Onset Colorectal Cancer. Oncotarget 2017, 8, 24429–24436. [Google Scholar] [CrossRef] [PubMed] [Green Version]
  14. Dettmer, U.; Kuhn, P.H.; Abou-Ajram, C.; Lichtenthaler, S.F.; Krüger, M.; Kremmer, E.; Haass, C.; Haffner, C. Transmembrane Protein 147 (TMEM147) Is a Novel Component of the Nicalin-NOMO Protein Complex. J. Biol. Chem. 2010, 285, 26174–26181. [Google Scholar] [CrossRef] [Green Version]
  15. Haffner, C.; Frauli, M.; Topp, S.; Irmler, M.; Hofmann, K.; Regula, J.T.; Bally-Cuif, L.; Haass, C. Nicalin and Its Binding Partner Nomo Are Novel Nodal Signaling Antagonists. EMBO J. 2004, 23, 3041–3050. [Google Scholar] [CrossRef] [Green Version]
  16. Francescangeli, F.; Contavalli, P.; De Angelis, M.L.; Baiocchi, M.; Gambara, G.; Pagliuca, A.; Fiorenzano, A.; Prezioso, C.; Boe, A.; Todaro, M.; et al. Dynamic Regulation of the Cancer Stem Cell Compartment by Cripto-1 in Colorectal Cancer. Cell Death Differ. 2015, 22, 1700–1713. [Google Scholar] [CrossRef] [Green Version]
  17. Kelber, J.A.; Panopoulos, A.D.; Shani, G.; Booker, E.C.; Belmonte, J.C.; Vale, W.W.; Gray, P.C. Blockade of Cripto Binding to Cell Surface GRP78 Inhibits Oncogenic Cripto Signaling via MAPK/PI3K and Smad2/3 Pathways. Oncogene 2009, 28, 2324–2336. [Google Scholar] [CrossRef] [Green Version]
  18. Gong, Y.; Guo, Y.; Hai, Y.; Yang, H.; Liu, Y.; Yang, S.; Zhang, Z.; Ma, M.; Liu, L.; Li, Z.; et al. Nodal Promotes the Self-Renewal of Human Colon Cancer Stem Cells via an Autocrine Manner through Smad2/3 Signaling Pathway. Biomed Res. Int. 2014, 2014, 364134. [Google Scholar] [CrossRef]
  19. Duan, W.; Li, R.; Ma, J.; Lei, J.; Xu, Q.; Jiang, Z.; Nan, L.; Li, X.; Wang, Z.; Huo, X.; et al. Overexpression of Nodal Induces a Metastatic Phenotype in Pancreatic Cancer Cells via the Smad2/3 Pathway. Oncotarget 2015, 6, 1490–1506. [Google Scholar] [CrossRef] [Green Version]
  20. Shen, M.M. Nodal Signaling: Development Roles and Regulation. Development 2007, 134, 1023–1034. [Google Scholar] [CrossRef] [Green Version]
  21. Quail, D.F.; Siegers, G.M.; Jewer, M.; Postovit, L.M. Nodal Signalling in Embryogenesis and Tumourigenesis. Int. J. Biochem. Cell Biol. 2013, 45, 885–898. [Google Scholar] [CrossRef] [PubMed]
  22. Mancino, M.; Strizzi, L.; Wechselberger, C.; Watanabe, K.; Gonzales, M.; Hamada, S.; Normanno, N.; Salomon, D.S.; Bianco, C. Regulation of Human Cripto-1 Gene Expression by TGF-Β1 and BMP-4 in Embryonal and Colon Cancer Cells. J. Cell. Physiol. 2008, 215, 192–203. [Google Scholar] [CrossRef] [PubMed]
  23. Bodenstine, T.M.; Chandler, G.S.; Seftor, R.E.B.; Seftor, E.A.; Hendrix, M.J.C. Plasticity Underlies Tumor Progression: Role of Nodal Signaling. Cancer Metastasis Rev. 2016, 35, 21–39. [Google Scholar] [CrossRef] [PubMed] [Green Version]
  24. Oliveros, J.C.; Franch, M.; Tabas-Madrid, D.; San-León, D.; Montoliu, L.; Cubas, P.; Pazos, F. Breaking-Cas: Off-Targets-Free GRNAs for CRISPR/Cas Technology. Available online: https://bioinfogp.cnb.csic.es/tools/breakingcas/?gset=4x2_GENOMES_EnsemblGenomes_47 (accessed on 29 July 2021).
  25. Ran, F.A.; Hsu, P.D.; Wright, J.; Agarwala, V.; Scott, D.A.; Zhang, F. Genome Engineering Using the CRISPR-Cas9 System. Nat. Protoc. 2013, 8, 2281–2308. [Google Scholar] [CrossRef] [PubMed] [Green Version]
  26. Irizarry, R.A.; Hobbs, B.; Collin, F.; Beazer-Barclay, Y.D.; Antonellis, K.J.; Scherf, U.; Speed, T.P. Exploration, Normalization, and Summaries of High Density Oligonucleotide Array Probe Level Data. Biostatistics 2003, 4, 249–264. [Google Scholar] [CrossRef] [Green Version]
  27. Dai, M.; Wang, P.; Boyd, A.D.; Kostov, G.; Athey, B.; Jones, E.G.; Bunney, W.E.; Myers, R.M.; Speed, T.P.; Akil, H.; et al. Evolving Gene/Transcript Definitions Significantly Alter the Interpretation of GeneChip Data. Nucleic Acids Res. 2005, 33, e175. [Google Scholar] [CrossRef] [Green Version]
  28. Anders, S.; Huber, W. Differential Expression Analysis for Sequence Count Data. Genome Biol. 2010, 11, R106. [Google Scholar] [CrossRef] [Green Version]
  29. Liao, Y.; Wang, J.; Jaehnig, E.J.; Shi, Z.; Zhang, B. WebGestalt 2019: Gene Set Analysis Toolkit with Revamped UIs and APIs. Nucleic Acids Res. 2019, 47, W199–W205. [Google Scholar] [CrossRef] [Green Version]
  30. Díez, P.; Droste, C.; Dégano, R.M.; González-Muñoz, M.; Ibarrola, N.; Pérez-Andrés, M.; Garin-Muga, A.; Segura, V.; Marko-Varga, G.; LaBaer, J.; et al. Integration of Proteomics and Transcriptomics Data Sets for the Analysis of a Lymphoma B-Cell Line in the Context of the Chromosome-Centric Human Proteome Project. J. Proteome Res. 2015, 14, 3530–3540. [Google Scholar] [CrossRef]
  31. Meier, F.; Brunner, A.D.; Koch, S.; Koch, H.; Lubeck, M.; Krause, M.; Goedecke, N.; Decker, J.; Kosinski, T.; Park, M.A.; et al. Online Parallel Accumulation–Serial Fragmentation (PASEF) with a Novel Trapped Ion Mobility Mass Spectrometer. Mol. Cell Proteom. 2018, 17, 2534–2545. [Google Scholar] [CrossRef] [Green Version]
  32. Lawrence, R.T.; Searle, B.C.; Llovet, A.; Villén, J. Plug-and-Play Analysis of the Human Phosphoproteome by Targeted High-Resolution Mass Spectrometry. Nat. Methods 2016, 13, 431–434. [Google Scholar] [CrossRef] [PubMed] [Green Version]
  33. Stokes, M.P.; Farnsworth, C.L.; Moritz, A.; Silva, J.C.; Jia, X.; Lee, K.A.; Guo, A.; Polakiewicz, R.D.; Comb, M.J. PTMScan Direct: Identification and Quantification of Peptides from Critical Signaling Proteins by Immunoaffinity Enrichment Coupled with LC-MS/MS. Mol. Cell. Proteom. 2012, 11, 187–201. [Google Scholar] [CrossRef] [PubMed] [Green Version]
  34. García-Tuñón, I.; Vuelta, E.; Lozano, L.; Herrero, M.; Méndez, L.; Palomero-Hernandez, J.; Pérez-Caro, M.; Pérez-García, J.; González-Sarmiento, R.; Sánchez-Martín, M. Establishment of a Conditional Nomo1 Mouse Model by CRISPR/Cas9 Technology. Mol. Biol. Rep. 2020, 47, 1381–1391. [Google Scholar] [CrossRef] [Green Version]
  35. NOMO1 Gene-GeneCards |NOMO1 Protein| NOMO1 Antibody. Available online: https://www.genecards.org/cgi-bin/carddisp.pl?gene=NOMO1 (accessed on 29 July 2021).
  36. Schmittgen, T.D.; Livak, K.J. Analyzing Real-Time PCR Data by the Comparative CT Method. Nat. Protoc. 2008, 3, 1101–1108. [Google Scholar] [CrossRef] [PubMed]
  37. National Centre for Biotechnological Information Home-SNP-NCBI. Available online: https://www.ncbi.nlm.nih.gov/snp/ (accessed on 29 July 2021).
  38. Exome Aggregate Consortium ExAC Browser. Available online: http://exac.broadinstitute.org/ (accessed on 29 July 2021).
  39. Haffner, C.; Dettmer, U.; Weiler, T.; Haass, C. The Nicastrin-like Protein Nicalin Regulates Assembly and Stability of the Nicalin-Nodal Modulator (NOMO) Membrane Protein Complex. J. Biol. Chem. 2007, 282, 10632–10638. [Google Scholar] [CrossRef] [PubMed] [Green Version]
  40. Geng, Y.; Xu, C.; Wang, Y.; Zhang, L. Quiescin Sulfhydryl Oxidase 1 Regulates the Proliferation, Migration and Invasion of Human Glioblastoma Cells via PI3K/Akt Pathway. Onco. Targets Ther. 2020, 13, 5721–5729. [Google Scholar] [CrossRef] [PubMed]
  41. Malinowski, M.; Pietraszek, K.; Perreau, C.; Boguslawski, M.; Decot, V.; Stoltz, J.F.; Vallar, L.; Niewiarowska, J.; Cierniewski, C.; Maquart, F.X.; et al. Effect of Lumican on the Migration of Human Mesenchymal Stem Cells and Endothelial Progenitor Cells: Involvement of Matrix Metalloproteinase-14. PLoS ONE 2012, 7, e50709. [Google Scholar] [CrossRef] [Green Version]
  42. Wang, S.; Zhong, L.; Li, Y.; Xiao, D.; Zhang, R.; Liao, D.; Lv, D.; Wang, X.; Wang, J.; Xie, X.; et al. Up-Regulation of PCOLCE by TWIST1 Promotes Metastasis in Osteosarcoma. Theranostics 2019, 9, 4342–4353. [Google Scholar] [CrossRef]
  43. Yun, D.P.; Wang, Y.Q.; Meng, D.L.; Ji, Y.Y.; Chen, J.X.; Chen, H.Y.; Lu, D.R. Actin-Capping Protein CapG Is Associated with Prognosis, Proliferation and Metastasis in Human Glioma. Oncol. Rep. 2018, 39, 1011–1022. [Google Scholar] [CrossRef] [Green Version]
  44. Wu, Z.; Dai, W.; Wang, P.; Zhang, X.; Tang, Y.; Liu, L.; Wang, Q.; Li, M.; Tang, C. Periostin Promotes Migration, Proliferation, and Differentiation of Human Periodontal Ligament Mesenchymal Stem Cells. Connect. Tissue Res. 2018, 59, 108–119. [Google Scholar] [CrossRef]
  45. Löbel, M.; Bauer, S.; Meisel, C.; Eisenreich, A.; Kudernatsch, R.; Tank, J.; Rauch, U.; Kü Hl, U.; Schultheiss, H.P.; Volk, H.D.; et al. CCN1: A Novel Inflammation-Regulated Biphasic Immune Cell Migration Modulator. Cell. Mol. Life Sci. 2012, 69, 3101–3113. [Google Scholar] [CrossRef] [PubMed]
  46. Kiwanuka, E.; Andersson, L.; Caterson, E.J.; Junker, J.P.E.; Gerdin, B.; Eriksson, E. CCN2 Promotes Keratinocyte Adhesion and Migration via Integrin A5β1. Exp. Cell Res. 2013, 319, 2938–2946. [Google Scholar] [CrossRef] [PubMed]
  47. Nam, K.S.; Oh, S.; Lee, K.-M.; Yoo, S.A.; Shin, I. CD44 Regulates Cell Proliferation, Migration, and Invasion via Modulation of c-Src Transcription in Human Breast Cancer Cells. Cell. Signal. 2015, 27, 1882–1894. [Google Scholar] [CrossRef] [PubMed]
  48. Shen, Y.; Wang, X.; Xu, J.; Lu, L. SerpinE2, a Poor Biomarker of Endometrial Cancer, Promotes the Proliferation and Mobility of EC Cells. Cancer Biomark. 2017, 19, 271–278. [Google Scholar] [CrossRef]
  49. Oommen, S.; Gupta, S.K.; Vlahakis, N.E. Vascular Endothelial Growth Factor A (VEGF-A) Induces Endothelial and Cancer Cell Migration through Direct Binding to Integrin A9β1: Identification of a Specific A9β1 Binding Site. J. Biol. Chem. 2011, 286, 1083–1092. [Google Scholar] [CrossRef] [Green Version]
  50. Akimoto, N.; Ugai, T.; Zhong, R.; Hamada, T.; Fujiyoshi, K.; Giannakis, M.; Wu, K.; Cao, Y.; Ng, K.; Ogino, S. Rising Incidence of Early-Onset Colorectal Cancer—A Call to Action. Nat. Rev. Clin. Oncol. 2021, 18, 230–243. [Google Scholar] [CrossRef]
  51. Burnett-Hartman, A.N.; Lee, J.K.; Demb, J.; Gupta, S. An Update on the Epidemiology, Molecular Characterization, Diagnosis, and Screening Strategies for Early-Onset Colorectal Cancer. Gastroenterology 2021, 160, 1041–1049. [Google Scholar] [CrossRef]
  52. Willauer, A.N.; Liu, Y.; Pereira, A.A.L.; Lam, M.; Morris, J.S.; Raghav, K.P.S.; Morris, V.K.; Menter, D.; Broaddus, R.; Meric-Bernstam, F.; et al. Clinical and Molecular Characterization of Early-Onset Colorectal Cancer. Cancer 2019, 125, 2002–2010. [Google Scholar] [CrossRef]
  53. Holowatyj, A.N.; Perea, J.; Lieu, C.H. Gut Instinct: A Call to Study the Biology of Early-Onset Colorectal Cancer Disparities. Nat. Rev. Cancer 2021, 21, 339–340. [Google Scholar] [CrossRef]
  54. Elliott, R.L.; Blobe, G.C. Role of Transforming Growth Factor Beta in Human Cancer. J. Clin. Oncol. 2005, 23, 2078–2093. [Google Scholar] [CrossRef]
  55. Venhuizen, J.H.; Jacobs, F.J.C.; Span, P.N.; Zegers, M.M. P120 and E-Cadherin: Double-Edged Swords in Tumor Metastasis. Semin. Cancer Biol. 2020, 60, 107–120. [Google Scholar] [CrossRef]
  56. Duñach, M.; Del Valle-Pérez, B.; García de Herreros, A. P120-Catenin in Canonical Wnt Signaling. Crit. Rev. Biochem. Mol. Biol. 2017, 52, 327–339. [Google Scholar] [CrossRef] [PubMed]
  57. Kurley, S.J.; Tischler, V.; Bierie, B.; Novitskiy, S.V.; Noske, A.; Varga, Z.; Zürrer-Härdi, U.; Brandt, S.; Carnahan, R.H.; Cook, R.S.; et al. A Requirement for P120-Catenin in the Metastasis of Invasive Ductal Breast Cancer. J. Cell Sci. 2021, 134, jcs250639. [Google Scholar] [CrossRef] [PubMed]
  58. Kidacki, M.; Lehman, H.L.; Green, M.V.; Warrick, J.I.; Stairs, D.B. P120-Catenin Downregulation and PIK3CA Mutations Cooperate to Induce Invasion through MMP1 in HNSCC. Mol. Cancer Res. 2017, 15, 1398–1409. [Google Scholar] [CrossRef] [PubMed] [Green Version]
  59. Zhong, C.; Zuo, Z.; Ji, Q.; Feng, D. P120ctn May Participate in Epithelial-Mesenchymal Transition in OSCC. Indian J. Cancer 2016, 53, 20–24. [Google Scholar] [CrossRef]
  60. Jia, Y.; Vong, J.S.L.; Asafova, A.; Garvalov, B.K.; Caputo, L.; Cordero, J.; Singh, A.; Boettger, T.; Günther, S.; Fink, L.; et al. Lamin B1 Loss Promotes Lung Cancer Development and Metastasis by Epigenetic Derepression of RET. J. Exp. Med. 2019, 216, 1377–1395. [Google Scholar] [CrossRef] [PubMed] [Green Version]
  61. Fu, F.; Wang, T.; Wu, Z.; Feng, Y.; Wang, W.; Zhou, S.; Ma, X.; Wang, S. HMGA1 Exacerbates Tumor Growth through Regulating the Cell Cycle and Accelerates Migration/Invasion via Targeting MiR-221/222 in Cervical Cancer Article. Cell Death Dis. 2018, 9, 1–17. [Google Scholar] [CrossRef]
  62. Kim, H.; Kim, M.; Im, S.-K.; Fang, S. Mouse Cre-LoxP System: General Principles to Determine Tissue-Specific Roles of Target Genes. Lab. Anim. Res. 2018, 34, 147–159. [Google Scholar] [CrossRef] [Green Version]
  63. Loesch, R.; Caruso, S.; Paradis, V.; Godard, C.; Gougelet, A.; Renault, G.; Picard, S.; Tanaka, I.; Renoux-Martin, Y.; Perret, C.; et al. Deleting the β-Catenin Degradation Domain in Mouse Hepatocytes Drives Hepatocellular Carcinoma or Hepatoblastoma-like Tumor Growth. J. Hepatol. 2022, 77, 424–435. [Google Scholar] [CrossRef]
  64. Huang, X.D.; Zheng, Y.B.; Yang, Y.J.; Yang, C.; Li, H.L.; Cheng, H.R. Mouse Models for Human Colorectal Cancer with Liver Metastasis. Zhonghua Yi Xue Za Zhi 2019, 99, 2701–2705. [Google Scholar] [CrossRef]
Figure 1. DNA content of the indicated genes determined by q-PCR. Data are presented as the mean of three replicates ± SD. RQ represents the relative expression levels of each amplicon normalized with a control (LEMD3).
Cancers 14 04029 g001
Figure 2. Generation of NOMO1-KO cell lines using CRISPR/Cas9 technology. (A) qPCR amplification of the fragment corresponding to the sgRNAs used in NOMO1-KO and control clones. The RQ was calculated according to the 2−ΔΔCT method, using the WT clones for normalization. Data are shown as the mean ± SD of three replicates. (B) Confirmation by Sanger sequencing of the reading frame change in the nucleotide sequence generated by Cas9 in NOMO1-KO clones. A red arrow marks the Cas9 breakpoint guided by sRNA1/sgRNA3. (C) NOMO1 expression by WB in WT and KO clones in HCT-116 and HS-5 cell lines.
Cancers 14 04029 g002
Figure 3. Expression levels of Nicalin and TMEM147 in the presence or absence of NOMO1 across cell lines. (A) NOMO1, NCLN, and TMEM147 protein levels, determined by WB. (B) mRNA expression of Nicalin determined by qRT-PCR in NOMO1-KO and control clones. The expression of each clone was determined using the 2−ΔΔCT method, and GAPDH was used for normalization. Data are shown as the mean ± SD of three replicates.
Cancers 14 04029 g003
Figure 4. Expression levels of proteins involved in the Nodal signaling pathway in NOMO1-KO and control clones. (A) Expression of ALK4 and ACTRII Nodal pathway receptor proteins and the co-receptor Cripto-1 detected by WB. (B) Protein expression of SMAD4. (C) Levels of Smad2/3 and p-Smad2/3 protein expression in untreated clones or clones treated with rhNodal (300 ng/mL) for 24 h.
Cancers 14 04029 g004
Figure 5. Expression of differentially expressed cell-migration-associated-proteins (CTND1, LMNB1, and HMGA1) in the LC–IMS/MS analysis of the HCT-116 and HS-5 cell lines. (A) Western blot analysis showed the differential expression of CTND1, LMNB1, and HMGA1 in NOMO1 knockout cell lines. (B) The graph shows the normalized quantification of CTND1, LMNB1, and HMGA1, detected by Western blot, named as relative intensity in arbitrary units (au).
Cancers 14 04029 g005
Figure 6. Loss of NOMO1 promotes cell migration of HCT-116 and HS-5 cell lines. (A) Wound healing assay of NOMO1-KO and control clones analyzed at 0, 24, and 36 or 48 h. (B) Wound healing rate (%) representation for NOMO1-KO and control clones. Data are shown as the mean ± SD of the three replicates. Statistically significant differences are indicated by asterisks (** p < 0.01). (C) Transwell assay assessed at 24 and 48 h of NOMO1-KO and control clones. Migrated cells were stained with 1% crystal violet for quantification. (D) Quantification of cells with migration capability represented in the Transwell assay as cells migrated to the two cell lines. Data are shown as the mean ± SD. Statistically significant differences are indicated by asterisks (** p < 0.01).
Cancers 14 04029 g006
Table 1. Allele frequency of nucleotides that differ among the reported NOMO1, NOMO2, and NOMO3 genes. Missense mutations are marked in bold.
GVScNOMO1NOMO2NOMO3Poblation IDSubjectsFREQ. ALE>FREQ. ALE<
c.26AC > T p.(L9P)CTC
c.156T > G p.(S52S)TGT
c.696C > G p.(N232N)CGCExAc7964C = 0.997G = 0.003
c.1185G > A p.(P395P)GGAExAc121,402G = 0.999A = 0.001
c.1210 A > G p.(I404V)AGGExAc121,400A = 0.999G = 0.001
c.1238 A > G p.(Q413R)AGAExAc11,862A = 0.999G = 0.000
c.1260C > G p.(P420P)CGCExAc25,306C = 0.999G = 0.001
c.1374 T > G p.(K458N)TTGExAc27,102T = 0.777G = 0.223
c.1468A > G p.(N490D)AGGExAc23,336A = 0.943G = 0.056
c.1477 A > G p.(M493V)AGGExAc121,206A = 0.999G = 0.001
c.1738 A > G p.(M580V)AGGExAc119,700A = 0.989G = 0.010
c.2187C > T p.(G729G)CTTExAc121,396C = 0.999T = 0.001
c.2211C > T p.(P737P)CCTExAc814T = 0.814C = 0.185
c.2388T > C p.(H796H)TCC
c.2586G > A p.(A862A)GAA
c.2694C > T p.(S898S)CTTExAc121,402C = 0.999T = 0.001
c.3216A > G p.(T1072T)AGGExAc121,310A = 0.999G = 0.001
c.3318C > T p.(D1106D)CTTExAc121,406C = 0.999T = 0.001
c.3583C > G p.(R1195R)CGG
c.3666T > Gp.(T1222T)TGG
Table 2. Pathogenic mutations and variants of uncertain significance (VUS) identified in EOCRC tumors. Classification of VUS by different prediction programs is shown: Sift (scores ≤ 0.05 are called “deleterious”, and scores > 0.05 are called “tolerated”), Polyphen (scores > 0.446 are called “probably damaging”, and scores ≤ 0.446 are called “benign”), and CADD (scores > 30 are called “likely deleterious”, and scores ≤ 30 are called “likely benign”). The text in bold indicates pathogenic mutations.
SAMPLENOMO1 StatusVariantAlellic Frecuency (%)SiftPolyphenCADD Score
Sample 1Heterozygousc.2684T > A/p.(Leu895Ter)22.5--
Sample 2Heterozygousc.3637C > T/p.(Gln1213Ter)27.3--
Sample 3Homozygousc.2833C > T/p.(Gln945Ter)10.5--
Sample 4Heterozygousc.2428G > T/p.(Glu810Ter)17.2--
Sample 5Germinalc.2656G > A/p.(Asp886Asn)33.3deleterious (0.02)probably damaging (0.835)25.8
Sample 6Germinalc.2787G > A/p.(Met929Ile)16.2deleterious (0.01)probably damaging (0.783)26.4
Sample 7Homozygousc.2794G > A/p.(Glu932Lys)32.1deleterious (0)probably damaging (0.977)32.0
Sample 1Heterozygousc.2810C > T/p.(Pro937Leu)52.9deleterious (0)probably damaging (1)29.5
Sample 3Homozygousc.2278G > A/ p.(Gly760Arg)11.5deleterious (0.01)probably damaging (0.992)29.3
Sample 3Homozygousc.3019G > A/ p.(Gly1007Arg)25.0deleterious (0)probably damaging (1)26.0
Publisher’s Note: MDPI stays neutral with regard to jurisdictional claims in published maps and institutional affiliations.

