Simple Summary
Lung cancer is one of the major public health problems in the world. Genetic variation plays an important role in the development of lung cancer. In this study, we screened apaQTL-SNPs that may influence lung cancer development based on a publicly available database. Then we performed a two-stage case-control population susceptibility study. We found a novel apaQTL-SNP, rs10138506, which might affect lung adenocarcinoma (LUAD) risk by modulating the 3′UTR length of CHURC1. At the same time, CHURC1 could function as a suppressor gene in LUAD with APA regulation. Further experiments indicated that CHURC1 has two poly(A) sites (proximal and distal) and different genotypes of rs1127968 which in perfect LD with rs10138506 can mediate changes in the lengths of the 3′UTR of the CHURC1 isoforms by choosing different poly(A) sites. The results of this study may be helpful in providing more genetic basis data for the screening of high-risk populations of lung cancer.
Abstract
Background: Alternative polyadenylation (APA) events may be modulated by single nucleotide polymorphisms (SNPs). Therefore, this study aims to evaluate the association between APA quantitative trait loci (apaQTLs)-related SNPs (apaQTL-SNPs) and non-small-cell lung cancer (NSCLC) risk. Methods: APA-related genes associated with NSCLC (LUAD and LUSC) were first identified, and the respective apaQTL-SNPs of those genes were selected. Then, a two-phase case-control study was performed to evaluate the association between candidate apaQTL-SNPs and NSCLC risk. Results: A total of 7 LUAD- and 21 LUSC-associated apaQTL-SNPs were selected. In the first phase, the apaQTL-SNP rs10138506 was significantly associated with LUAD risk (p < 0.05), whereas the other two apaQTL-SNPs (rs1130698 and rs1130719) were significantly associated with LUSC risk (p < 0.05). In the second phase, the variant G allele of rs10138506 was still significantly associated with an increased risk of LUAD (OR = 1.42, 95%CI = 1.02–1.98, p = 0.038). Functional annotation indicated that the variant G allele of rs10138506 was significantly associated with a higher PDUI value of CHURC1. Meanwhile, 3′RACE experiments verified the presence of two poly(A) sites (proximal and distal) in CHURC1, while qRT-PCR results indicated that different genotypes of rs1127968 which, in perfect LD with rs10138506, can mediate changes in the lengths of the 3′UTR of CHURC1 isoforms. Conclusion: The variant G allele of rs10138506 in CHURC1 was correlated with a longer 3′UTR of CHURC1 mRNA and an increased LUAD risk. Further studies should evaluate the interaction between rs10138506 and different 3′UTR lengths of CHURC1 that regulate LUAD development.
1. Introduction
Lung cancer is the second-most frequently diagnosed cancer and is the first leading cause of cancer-related deaths worldwide [1]. Non-small-cell lung cancer (NSCLC) accounts for approximately 85% of all lung cancer cases, with lung adenocarcinoma (LUAD) and lung squamous cell carcinoma (LUSC) as the most common histological types [2]. In recent years, and although the NSCLC risk is much higher among elderly people, its incidence still shows increasing trends in women and younger adults, especially for LUAD [3]. Additionally, the survival rates of patients with NSCLC remain very low; for instance, the 5-year relative survival rate in the world is 26%, which is higher than that in China (<20%) [4,5,6]. Thus, further exploring the NSCLC etiology might help identify high-risk individuals and reduce its incidence in the general population.
NSCLC is associated with multiple environmental factors, with tobacco smoking as one of its main known factors [7]. Genetic factors also play a vital role in NSCLC development [8], and single nucleotide polymorphism (SNP) is the most common type among them [9]. Although genome-wide association studies (GWASs) have identified numerous SNPs associated with NSCLC risk, their biological functions remain to be elucidated if located in non-coding regions [10,11]. Based on the results of the ENCODE project, >80% of the human genome has been reported to be biochemically active, especially outside the well-studied coding regions [12]. Therefore, exploring the underlying biological functions of SNPs in non-coding regions may provide additional insights in elucidating the etiology and molecular genetic mechanisms of NSCLC.
Polyadenylation is an important post-transcriptional regulation mechanism of gene expression [13]. Additionally, alternative polyadenylation (APA) events commonly exist in approximately 70% of human genes [14]. Recently, Xiang et al. systematically explored the roles of APA events in different cancer types and identified that they were frequently detected in NSCLC (both LUAD and LUSC) and other cancers [15]. APA events indicate that pre-mRNA is cleaved at different poly(A) sites by recognizing different polyadenylation signals (PAS), resulting in the production of diverse mRNA isoforms with longer or shorter lengths of 3′untranslated regions (3′UTRs) [16]. Poly(A) sites are mainly located in the 3′UTR and can be divided into distal and proximal regions, i.e., near and far from the 3′end, respectively [17]. Generally, the percentage of distal poly(A) site usage index (PDUI) values are used to quantify APA events and are calculated by dividing the number of transcripts at the distal poly(A) sites based on the total number of transcripts with distal and proximal poly(A) sites. The PDUI value ranges from 0 to 1, and a PDUI close to 1 indicates that the gene tends to use the distal poly(A) site, which may cleave and express mRNA isoforms with a longer 3′UTR. A PDUI of close to 0 represents that this gene tends to utilize the proximal poly(A) site, which may cleave and express mRNA isoforms with a shorter 3′UTR in turn [18].
Increasing evidence has shown that copious oncogenes in multiple cancer types are accompanied by 3′UTR shortening [19], which is also common in the majority of NSCLC-related oncogenes [20]. For example, the oncogene CSNK1D commonly uses the proximal poly(A) site in LUAD tumor tissues, resulting in a lower PDUI value (shorter 3′UTR) than that in the adjacent normal lung tissues [15]. Different 3′UTR lengths mediated by APA events could affect mRNA stability, transcription and translation [21]. Thus, it is biologically plausible that APA events may modify the expression of certain corresponding genes by affecting the transcripts with different 3′UTR lengths and further influence LUAD and LUSC development. Further studies exploring the APA event regulators and the underlying regulation mechanisms might provide new clues in elucidating the etiology of LUAD and LUSC.
Recent studies have proposed that some SNPs can act as regulators of APA events [22]. Certain SNPs have been associated with the use of different poly(A) sites, which might cause APA dysfunctions. Furthermore, abnormal APA events might regulate gene expression by generating mRNA isoforms with different 3′UTR lengths. Similar to the eQTL analysis, APA quantitative trait loci (apaQTL) analysis can indicate the relationship between different SNP genotypes and PDUI values in certain genes. The proposed novel apaQTL mechanism may provide a novel insight to the interpretation of potential SNP functions in non-coding regions [23]. Recently, by integrating the SNP genotype and APA data (quantified by PDUI values), Yang et al. systematically identified apaQTL-SNPs in 32 cancer types and developed an online database known as SNP2APA [24]. However, apaQTL-SNPs from SNP2APA were obtained by bioinformatics analysis. Further studies with large samples are needed to investigate whether and how apaQTL-SNPs identified by SNP2APA affect NSCLC risk.
In this study, APA-related genes associated with NSCLC (LUAD and LUSC) were firstly obtained from published data by Xiang et al. [15]. Secondly, the respective apaQTL-SNPs for LUAD and LUSC were systematically screened based on these genes. Thirdly, a two-phase case-control study (phase I: 4107 patients with NSCLC and 3710 healthy controls; phase II: 779 patients with NSCLC and 667 healthy controls) was performed to evaluate the association between candidate apaQTL-SNPs and NSCLC (LUAD and LUSC) susceptibility.
2. Materials and Methods
2.1. Study Population
To explore the association between candidate apaQTL-SNPs and NSCLC risk, a two-phase case-control study (phase I and II) was performed. The study participants in phase I were obtained based on the Female Lung Cancer Consortium in Asia (FLCCA) GWAS from the database of Genotypes and Phenotypes (dbGAP), with accession number phs000716.v1.p1. The FLCCA GWAS consisted of 5510 never-smoking female patients with lung cancer and 4544 controls [25]. Among them, 4107 with NSCLC (including 3453 with LUAD and 654 with LUSC) and 3710 controls obtained from 14 studies conducted in mainland China, South Korea, Japan, Singapore, as well as Taiwan, China and Hong Kong, China were available for the present study.
In phase II, 779 patients with NSCLC (576 LUAD and 203 LUSC) and 667 cancer-free healthy controls were included to further validate the association between candidate apaQTL-SNPs and NSCLC risk. Among the samples in this phase, 626 patients with NSCLC and 667 healthy controls were previously described [26]. An additional 153 patients, newly diagnosed with NSCLC, were continuously recruited from two hospitals (the Sixth People’s Hospital of Nantong and Jiangdu People’s Hospital of Yangzhou) in Jiangsu from 2020 to 2022. All patients were pathologically confirmed. Written informed consent was obtained from all subjects, and the study was reviewed and approved by the ethics committee of Nantong University (approval no. 2022-2, February 2022).
2.2. Identification of APA-Related Genes Associated with LUAD and LUSC
APA-related genes associated with LUAD and LUSC were obtained based on the published study by Xiang et al. [15], in which the authors first downloaded the RNA-seq data from The Cancer Genome Atlas (TCGA) database and used the DaPars algorithm to calculate PDUI values of the corresponding genes for quantifying APA events. They further systematically assessed the correlation between PDUI values and expression levels of the corresponding genes using Spearman’s correlation (Rs), and APA-related genes were defined based on the threshold of |Rs| >0.3 and a false discovery rate (FDR) of <0.05.
2.3. Selection of Respective apaQTL-SNPs in APA-Related LUAD and LUSC Genes
Respective apaQTL-SNPs in APA-related LUAD and LUSC genes were downloaded from the SNP2APA online website (http://gong_lab.hzau.edu.cn/SNP2APA/ accessed on 21 June 2021) [24], and the authors obtained the SNP genotype data from TCGA database, whereas PDUI values of the corresponding genes were obtained from TC3A database. Then, linear regression of MatrixEQTL was used to calculate the absolute value of the correlation coefficient (r) to evaluate the pairwise association between SNPs and PDUI values. Moreover, SNPs with |r| ≥0.3 and PFDR < 0.05 were defined as apaQTL-SNPs.
After obtaining apaQTL-SNPs in APA-related LUAD and LUSC genes, the candidate apaQTL-SNPs were then filtered out with a minor allele frequency (MAF) of ≥0.01 in the East Asian population (including the Chinese Han population, Southern Han Chinese population and Japanese population). Finally, the linkage disequilibrium (LD) analysis with an r2 threshold of 0.80 was performed to further filter above the apaQTL-SNPs (Figure 1).
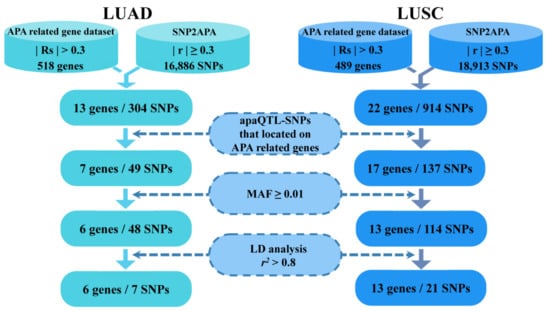
Figure 1.
The selection of functional apaQTL-SNPs. apaQTL, alternative polyadenylation quantitative trait loci; SNP, single nucleotide polymorphisms; LUAD, lung adenocarcinoma; LUSC, lung squamous cell carcinoma; RS, Spearman’s correlation; r, correlation coefficient; MAF, minor allele frequency; LD, linkage disequilibrium.
2.4. Genotyping of FLCCA GWAS in Phase I
In phase I, genotyping of FLCCA GWAS was performed using Illumina SNP microarrays.
2.5. Genotyping of Candidate apaQTL-SNPs in Phase II
For the samples in phase II, genomic DNA was extracted from the peripheral blood using a DNA extraction kit (Qiagen, Valencia, CA, USA). Then, genotyping was performed using the TaqMan allele discrimination method, and the Applied Biosystems™ QuantStudio™ 5 FAST Real-Time Polymerase Chain Reaction (PCR) system (Applied Biosystems, Foster City, CA, USA) was used to perform PCR reactions and read the fluorescent signal. Genotyping results were displayed on the allelic discrimination system based on FAM and VIC fluorescence intensity.
2.6. 3′-Rapid Amplification of cDNA Ends (3′RACE) Experiments
Total RNA was extracted from A549 cell lines using a TRIzol reagent (Invitrogen). Furthermore, the first-strand cDNA was synthesized from 1 μg of the total RNA using the HiScript 1st Strand cDNA Synthesis Kit (Vazyme R111-02). Then, 3′RACE was used to determine poly(A) sites of Churchill Domain Containing 1 (CHURC1) with a 3′RACE kit (Jingrui, Guangzhou, China). The sequences of gene-specific forward primers (GSP) were designed for CHURC1 as follows:
CHURC1_F1: GGTAATACCTGCCTGGAGAATGGATC
CHURC1_F2: ACAAGGATCTGGCAAGGTTAGGAAG
PCR products of 3′RACE were then separated through agarose gel electrophoresis and gel-purified. After confirming the quality with agarose gel electrophoresis, the 3′ ends were sequenced using an Applied Biosystems 3730× l DNA Analyzer (Applied Biosystems, Foster City, CA, USA). Finally, the AlignX function of Vector NTI Advance 11.0 (Invitrogen, Carlsbad, CA, USA) was used for sequence alignment.
2.7. Vectors Construction and qRT-PCR Assay
The psiCHECK2-CHURC1-3′UTR-rs1127968-wid and the psiCHECK2-CHURC1-3′UTR-rs1127968-mut were constructed by NKY GENEREADER (Guangzhou, China). Then, qRT-PCR assays were performed to evaluate the relative expression levels of the longer and shorter 3′UTRs of CHURC1 under rs1127968 wid/mut genotypes. The qRT-PCR was conducted using a SYBR Premix Ex Taq kit (Takara) on a 7500 Real-Time PCR system (Applied Biosystems, Foster City, CA, USA). The sequences of the target longer and shorter 3′UTRs of CHURC1 were as follows:
CHURC1-3′UTR-short-F CCCCCGACAAATGACTCTCTTA
CHURC1-3′UTR-short-R AACCATCAGGCTTGCTGTATTG
CHURC1-3′UTR-long-F TGCTGCAAATCTATATCTGACC
CHURC1-3′UTR-long-R TTAGCAAACTCAAGGAAGGGAC
2.8. Statistical Analysis
The two-sided chi-squared test and Student’s t-test were used to statistically evaluate differences in demographic characteristics and smoking status between the case and the control groups at each study phase. Logistic regression analyses were used to assess the association between the candidate apaQTL-SNPs and NSCLC risk, and the odds ratios (ORs) and 95% confidence intervals (95% CIs) were obtained after adjusting for gender, age and smoking status as appropriate. Kaplan–Meier survival curves were plotted using the “survival” package in R software. A log-rank test was used to compare the difference in survival rate between the two groups. The “Coxph” function in the “survival” package was used for univariate COX regression analysis. p < 0.05 was defined as the boundary of statistical significance. Analysis were performed using Stata version 15.0 (StataCorp, College Station, TX, USA), SPSS version 20.0 (IBM Corp., Armonk, NY, USA) and R version 3.6.2 software (R Foundation for Statistical Computing, Vienna, Austria).
3. Results
3.1. Characteristics of the Study Subjects
In the present study, the baseline characteristics of patients with NSCLC and cancer-free healthy controls are shown in Table 1. Briefly, a total of 4107 patients with NSCLC (3453 with LUAD and 654 with LUSC) and 3710 healthy controls were enrolled at phase I, and 779 patients with NSCLC (576 with LUAD and 203 with LUSC) and 667 healthy controls were enrolled at phase II. In phase II, the 779 NSCLC cases (including 511 males and 268 females) and 667 healthy controls (including 443 males and 224 females) were used to validate the results. As shown in Table 1, in phase I, 49.38% of patients in the case group were aged ≤60 years, making them younger than those in the control group, and 50.62% of patients in the case group were aged >60 years, making them older than those in the control group. In phase II, the age of patients with NSCLC was comparable to that of the control group (p = 0.358), and the gender ratio was comparable between patients with NSCLC and the controls (p = 0.781). Additionally, the proportion of smokers in the case group was higher than that in the control group in phase II (p < 0.001).

Table 1.
Characteristics of the subjects enrolled in this study.
3.2. Identification of APA-Related Genes Associated with LUAD and LUSC
In published studies [15], 518 APA-related genes associated with LUAD, and 489 APA-related genes associated with LUSC, were obtained. Among the 518 APA-related genes associated with LUAD, the PDUI values of 233 genes were negatively correlated with the corresponding gene expression (RS < −0.3, PFDR < 0.05), and the PDUI values of 285 genes were positively correlated with the corresponding gene expression (RS > 0.3, PFDR < 0.05). Among the 489 APA-related genes associated with LUSC, 259 genes had PDUI values negatively correlated with the corresponding gene expression (RS < −0.3, PFDR < 0.05), and 230 genes had PDUI values positively correlated with (RS > 0.3, PFDR < 0.05).
3.3. Screening of Candidate apaQTL-SNPs
Firstly, the apaQTL-SNPs were obtained from the SNP2APA database (16,886 apaQTL-SNPs associated with LUAD and 18,913 apaQTL-SNPs associated with LUSC). Secondly, among these apaQTL-SNPs, 49 apaQTL-SNPs were located in 7 APA-related genes for LUAD, and 137 apaQTL-SNPs were located in 17 APA-related genes for LUSC. Thirdly, based on the MAF value of ≥0.01 in both the Chinese Han and Japanese population, 48 LUAD-related and 114 LUSC-related apaQTL-SNPs were selected. Finally, linkage disequilibrium (LD) analysis (r2 < 0.8) was performed to filter apaQTL-SNPs. Finally, 28 apaQTL-SNPs (7 apaQTL-SNPs associated with LUAD and 21 apaQTL-SNPs with LUSC) were selected (Figure 1, Table 2).
Table 2.
Details information of 28 candidate apaQTL-SNPs.
3.4. Association between Candidate apaQTL-SNPs and NSCLC Risk in Phase I
In the first phase, the association between 28 apaQTL-SNPs and NSCLC risk was evaluated in the FLCCA GWAS database. Among the 28 apaQTL-SNPs, the SNP rs10138506 located in CHURC1 was significantly associated with an increased LUAD risk (additive model: OR = 1.16, 95% CI = 1.01–1.33, p = 0.034). However, this SNP was not associated with LUSC risk (p = 0.325). SNPs rs1130698 (additive model: OR = 1.19, 95% CI = 1.00–1.41, p = 0.049) and rs1130719 (additive model: OR = 1.26, 95% CI = 1.08–1.48, p = 0.002) located in CD151 were significantly associated with an increased LUSC risk. However, no statistical significance was observed between the above two apaQTL-SNPs and LUAD risk (both p > 0.05) (Table 3).
Table 3.
Characteristics of the three SNPs in this study.
3.5. Evaluation of the Association between apaQTL-SNP (rs10138506) and LUAD Risk in Phase II
To further evaluate the association between the identified apaQTL-SNP (rs10138506) and LUAD risk, genotyping was performed on 576 patients with LUAD and 667 healthy controls from the case-control study of phase II. As shown in Table 4, the variant G allele of rs10138506 was significantly associated with an increased LUAD risk (additive model: OR = 1.42, 95% CI = 1.02–1.98, p = 0.038).
Table 4.
Specific information of three candidate apaQTLs in the screening and validation phase.
3.6. Evaluation of the Association between apaQTL-SNPs (rs1130698 and rs1130719) and LUSC Risk in Phase II
To further evaluate the association between the identified apaQTL-SNPs (rs1130698 and rs1130719) and LUSC risk, genotyping was performed on 203 patients with LUSC and 667 healthy controls from the case-control study in phase II. However, no statistical significance was observed between the two apaQTL-SNPs and LUSC risk (both p > 0.05) (Table 4).
3.7. APA Analysis for rs10138506
We further evaluated the relationship between the identified apaQTL-SNP rs10138506 and PDUI values of CHURC1 in LUAD. As shown in Figure 2, the apaQTL-SNP rs10138506 was significantly correlated with the PDUI values of CHURC1 (p = 3.33 × 10⁻¹⁴). In detail, compared with those of the wild-type homozygote AA genotype, the PDUI values of the heterozygous AG genotype in rs10138506 were significantly higher, whereas those of the variant homozygous GG genotype were even higher.
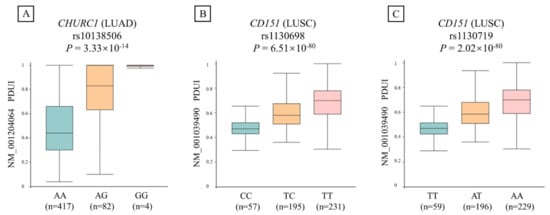
Figure 2.
The relationship between three candidate apaQTL-SNPs and PDUI values of their target genes in NSCLC. (A) The variant G allele of apaQTL-SNP rs10138506 was significantly associated with higher PDUI values in LUAD. (B) The variant C allele of apaQTL-SNP rs1130698 was significantly associated with lower PDUI values in LUSC. (C) The variant T allele of apaQTL-SNP rs1130719 was significantly associated with lower PDUI values in LUSC. apaQTL, alternative polyadenylation quantitative trait loci; SNP, single nucleotide polymorphisms; PDUI, percentage of distal poly(A) site usage index; NSCLC, non-small-cell lung cancer; LUAD, lung adenocarcinoma; LUSC, lung squamous cell carcinoma.
3.8. CHURC1 Expression
Based on TCGA database, the CHURC1 expression between LUAD tumor tissues (n = 526) and adjacent non-tumor tissues (n = 108) was significantly different (p < 0.001), and lower CHURC1 expression levels were found in tumor tissues. Furthermore, CHURC1 expression levels in 57 LUAD paired samples were also analyzed, and the results showed that CHURC1 expression in LUAD tumor tissues was significantly lower than that in the adjacent non-tumor tissues (p = 0.002) (Figure 3A,B).
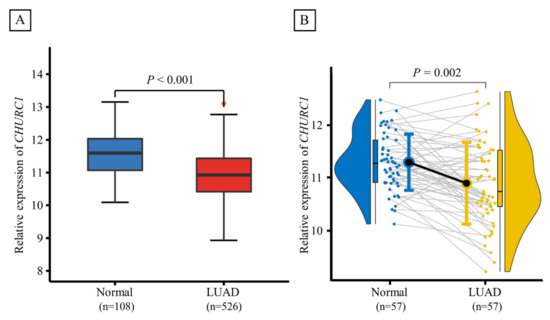
Figure 3.
Expression levels of CHURC1 in LUAD tumor tissues and adjacent non-tumor tissues. (A) CHURC1 expression was lower in LUAD tumor tissues (n = 108) than in adjacent non-tumor tissues (n = 526). (B) In 57 LUAD paired samples, CHURC1 expression was lower in LUAD tumor tissues than in adjacent non-tumor tissues. LUAD, lung adenocarcinoma.
3.9. Survival Analysis
To explore whether the expression and PDUI value of CHURC1 was related to the survival rate, we downloaded the TCGA dataset and the APA-related genes dataset [15] to perform survival analysis. The results showed that the survival time of high CHURC1 expression in LUAD was significantly higher than that of low CHURC1 expression (Log-rank p = 0.049). (Figure 4A). Further analysis of the correlation between the PDUI value of CHURC1 and survival time showed that the survival time of the low PDUI value of CHURC1 in LUAD was higher than that of the high PDUI value (log-rank p = 0.056) (Figure 4B).
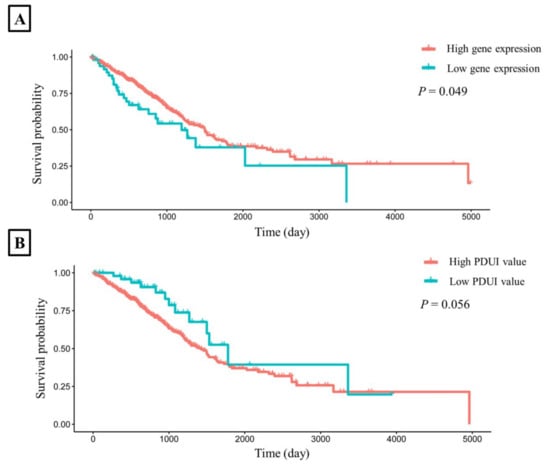
Figure 4.
The LUAD survival time curves for CHURC1. (A) Survival analysis of CHURC1 expression. (B) Survival analysis of PDUI value of CHURC1. LUAD, lung adenocarcinoma; PDUI, percentage of distal poly(A) site usage index.
3.10. Analysis of Poly(A) Sites of CHURC1 Based on the 3′RACE Experiment
Bioinformatic analysis indicated that different genotypes of apaQTL-SNP rs10138506 may affect the usage of different poly(A) sites in CHURC1, resulting in changes in PDUI values. Then, the predicted poly(A) sites of CHURC1 were identified in the NCBI database (https://www.ncbi.nlm.nih.gov/ accessed on 16 February 2022), and CHURC1 3′RACE was performed and verified using the mRNA from the A549 cell line. These results indicated that CHURC1 has two poly(A) sites that may produce two mRNA transcripts with different 3′UTR lengths. The distance between the proximal and distal poly(A) sites was approximately 2.7 kb. Meanwhile, SNP rs1127968 was found with a perfect high LD with rs10138506 (r2 = 1), which was located in the 3′UTR of CHURC1 and was approximately 0.2 kb away from the poly(A) site1 (Figure 5A). Meanwhile, the APA regulation for rs1127968 was the same as that for rs10138506 (Figure 5B). For the shorter CHURC1 mRNA isoform, the adopted PAS signal AAUACA is located at 39 bp upstream of the poly(A) site1, and the band of the PCR product (~420 bp) was consistent with the designed sequences (Figure 5C). For the longer CHURC1 mRNA isoform, the adopted PAS signal UUUAAA was located at 115 bp upstream of the poly(A) site2, whereas the band of the PCR product (~560 bp) was consistent with the designed sequences (Figure 5D). Finally, PCR product sequences were aligned to the transcript reference sequences from the NCBI database. Results showed that the 3′UTR transcript sequences with different CHURC1 lengths matched with the target region.
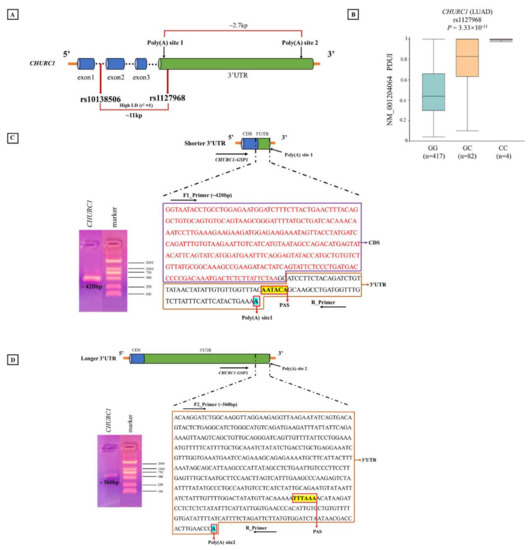
Figure 5.
3′RACE experiment determining poly(A) sites of CHURC1. (A) The location of two poly(A) sites in CHURC1; (B) the relationship between apaQTL-SNP rs1127968 and PDUI values of CHURC1 in LUAD; (C) the schematic diagram of shorter 3′UTR of CHURC1 transcript and the sequence of the PCR product (~420 bp); (D) the schematic diagram of longer 3′UTR in the CHURC1 transcript and sequence of the PCR product (~560 bp). 3′RACE, 3′-rapid amplification of cDNA ends; LD, linkage disequilibrium; apaQTL, alternative polyadenylation quantitative trait loci; SNP, single nucleotide polymorphisms; PDUI, percentage of distal poly(A) site usage index; 3′UTR, 3′untranslated region; LUAD, lung adenocarcinoma; CDS, coding sequence; PAS, polyadenylation signal; GSP, gene-specific forward primer.
3.11. The Expression of CHURC1 Isoforms under Different Genotypes of apaQTL-SNP rs10138506
We then performed qRT-PCR to evaluate whether different genotypes of apaQTL-SNP rs10138506 may affect the expression of different lengths of CHURC1 3′UTR isoforms. As rs1127968 had a perfect high LD (r2 = 1) with rs10138506 and was approximately 0.2 kb away from the poly(A) site1, we further explored the association between the different genotypes of rs1127968 and the expression of CHURC1 isoforms. The results showed that, with the expression level of the shorter 3′UTR of the CHURC1 mRNA isoform as a reference compared with the rs1127968 wild G allele, the expression level of the longer 3′UTR of the CHURC1 mRNA isoform was 1.85 fold higher under the rs1127968 mutant C allele. This indicates that different genotypes of rs1127968 may mediate changes in the lengths of the 3′UTR of the CHURC1 isoforms.
4. Discussion
Based on the present two-phase case-control study, the relationship between apaQTL-SNPs and NSCLC risk was systematically appraised. These results showed that the variant G allele of apaQTL-SNP rs10138506 in CHURC1 was significantly associated with an increased LUAD risk. Furthermore, the variant G allele of rs10138506 was significantly associated with higher PDUI values of CHURC1. This study may shed light on the etiology and underlying molecular genetic mechanisms of LUAD.
CHURC1, a transcriptional activator controlling the fibroblast growth factor [27], is a cancer susceptibility gene, affecting cell proliferation [28]. In our present study, the CHURC1 expression level in LUAD tumor tissues was lower than that in the adjacent non-tumor tissues based on TCGA data, indicating that CHURC1 may function as a tumor-suppressor gene in LUAD development. Furthermore, transcription factor SIN3A may bind at the CHURC1 promoter in human A549 LUAD cell lines [29]. Additionally, reduced SIN3A might strongly promote A549 cell invasion [30]. Therefore, CHURC1 may exert tumor-suppressive effects through certain transcription factors (e.g., SIN3A) and further affect LUAD development. We also analyzed the protein expression of CHURC1 in LUAD based on a published database [31]. The results show that CHURC1 had no statistically significant expression difference between LUAD tumor tissues and adjacent non-tumor tissues (p = 0.33). Although the mRNA expression of CHURC1 between LUAD tumor tissues and adjacent non-tumor tissues was significantly different (p < 0.001), the protein expression of CHURC1 had no statistically significant difference. Considering the concordance rate of the differential expression of mRNAs and proteins in tissues is relatively low, only about 40% [32], in subsequent studies, screening the genes related to LUAD from the perspectives of the consistency of both mRNA and protein levels are warranted.
At present, relevant studies have shown that the risk factors for lung cancer include exposure to tobacco smoke [33], indoor air pollution caused by cooking smoke and coal combustion [34], outdoor air pollution (PM2.5, et al.) [35], infection and genetic factors [36]. Among them, although environmental risk factors (such as smoking and indoor and outdoor air pollution) have a great impact on the risk of lung cancer, genetic factors explain about 20% of the heritability of lung cancer [37]. In terms of genetic factors, many scholars have explored the impact of genetic variation on LUAD. Dai et al. found that 19 susceptible loci were significantly associated with the risk of non-small-cell lung cancer through a large prospective cohort study of Chinese people, including two new SNP loci for LUAD and one new SNP loci for LUSC [8]. The risk loci found in the study explained the genetic basis of lung cancer, and people with a high genetic risk have a significantly higher risk of lung cancer than people with a low genetic risk.
Studies have found that some tumor-suppressor genes tend to produce mRNAs with longer 3′UTRs in tumor tissues. Begik et al. performed an APA analysis of gene expression data from various cancer types and found that PNRC1 acts as a tumor-suppressor gene, which tends to produce mRNAs with longer 3′UTRs in tumor tissues [38]. Additionally, ZBTB4 is significantly downregulated in breast cancer tissues with longer 3′UTRs [39]. Therefore, the role of identified apaQTL-SNP rs10138506 in regulating the 3′UTR length was explored by mediating the CHURC1 expression. Furthermore, SNP2APA data results showed that the PDUI value of CHURC1 increased under the variant G allele of rs10138506. Meanwhile, 3′RACE experiments verified the presence of two poly(A) sites (proximal and distal) in CHURC1, and the SNP rs1127968 located 0.2 kb downstream of APA site1 was in a perfect high LD with rs10138506 (r2 = 1.0). Additionally, qRT-PCR assay indicated that CHURC1 tends to use the distal poly(A) site under the variant C allele of rs1127968, which may express transcripts with longer 3′UTRs, and the potential mechanism underlying the alteration of 3′UTR length that regulates CHURC1 expression levels remains to be further explored.
The 3′UTR contains various regulatory elements, including miRNA binding sites, which play a significant role in the expression level and translation ability of their target genes. Changes in the 3′UTR length of mRNAs mediated by APA events may affect the existence of miRNA binding sites, which may in turn affect the target genes [40,41]. Several potentially conserved binding sites in the 3′UTR of CHURC1 were further identified using Targetscan (http://www.targetscan.org/vert_71/ accessed on 18 April 2022). The results showed that both miR-4262 and miR-181b-5p were identified as potential CHURC1 regulators. Previous studies reported that miR-181b-5p may play a regulatory role in LUAD, which was down-regulated in LUAD [42]. Furthermore, miR-4262 was significantly down-regulated in gastric cancer tissues, and its lower-level expression was associated with a poorer prognosis and lower survival rate in patients with gastric cancer [43]. Taken together, we hypothesized that the variant G allele of rs10138506 could influence the APA events through its high LD SNP rs1127968, thereby making the 3′UTR expression longer in CHURC1 mRNA. Changes in the 3′UTR length of mRNA yield the enrichment of miRNA binding in the 3′UTR of CHURC1 and may, therefore, inhibit the CHURC1 expression in LUAD and elevate the risk of developing LUAD (Figure 6).
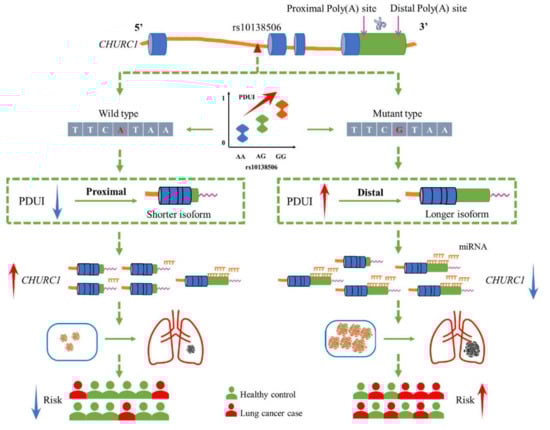
Figure 6.
The potential regulation mechanism of apaQTL-SNP rs10138506 mediating malignant phenotypic changes in LUAD by regulating the 3′UTR length of CHURC1. apaQTL, alternative polyadenylation quantitative trait loci; SNP, single nucleotide polymorphisms; 3′UTR, 3′untranslated region; LUAD, lung adenocarcinoma; PDUI, percentage of distal poly(A) site usage index; miRNA, mircroRNA.
This study has several merits. Firstly, the well-reported NSCLC-related APA genes were integrated with the SNP2APA apaQTL-SNP database, which may contribute to the precise screening of candidate NSCLC-related apaQTL-SNPs. Secondly, although LUAD and LUSC are the two main histological NSCLC subtypes, they not only have different histological origins, but also present different molecular oncogenic mechanisms. Thus, apaQTL-SNPs associated with both LUAD and LUSC were separately screened, and the association between screened apaQTL-SNPs and the risk of two different NSCLC pathological types were evaluated. In addition, the conclusion that apaQTL-SNP rs10138506 may modify NSCLC susceptibility across histological subtypes has enhanced the rigor of our study strategy. Thirdly, a two-phase case–control study with a large sample size was conducted to evaluate the association between apaQTL-SNPs and NSCLC risk, which may increase the stability and reliability of the results. The results of this study may be helpful in providing more genetic basis data for the screening of high-risk populations of lung cancer, and as an important reference in establishing a feasible lung-cancer-screening program for precision prevention and individualized intervention. However, certain limitations unavoidably exist in this study. The samples in the first phase of GWAS screening were all females. Although samples in the second phase of the validation included both males and females, we cannot exclude the possibility that gender bias in the first phase may have affected our results, and further studies with strict inclusion criteria should be paid attention.
5. Conclusions
This study concluded that the variant G allele of the apaQTL-SNP rs10138506 in CHURC1 could correlate with longer 3′UTR lengths of CHURC1 mRNA and increase LUAD risk. Therefore, further investigation is warranted to explore the potential biological effects of rs10138506 and CHURC1 in LUAD development.
Author Contributions
Conceptualization, A.Q., H.X. and Z.C.; Data curation, Y.Z., Y.D. and A.Q.; Formal analysis, L.M., X.F. and J.C.; Funding acquisition, M.C.; Investigation, R.Z., Y.Z., Y.D., J.X., A.Q., X.L. and M.C.; Methodology, T.T., G.T. and M.C.; Resources, L.M. and G.T.; Software, B.X. and X.L.; Supervision, M.C. and T.T.; Validation, A.Q., Y.D. and M.C.; Visualization, Y.Z., B.X., J.X. and M.C.; Writing—original draft, A.Q., H.X., T.T. and M.C.; Writing—review and editing, A.Q. and H.X. All authors have read and agreed to the published version of the manuscript.
Funding
This work was supported by the National Natural Science Foundation of China (82273715), the Natural Science Foundation of Jiangsu Province (BK20191449), and the Postgraduate Research and Practice Innovation Program of Jiangsu Province (KYCX21-3126, KYCX20-2852).
Institutional Review Board Statement
The study was reviewed and approved by the ethics committee of Nantong University (Approval No. 2022-2, February 2022).
Informed Consent Statement
Informed consent was obtained from all subjects involved in the study.
Data Availability Statement
The data that support the findings of this study are available from the corresponding author upon reasonable request.
Conflicts of Interest
The authors declared no potential conflict of interest.
References
- Sung, H.; Ferlay, J.; Siegel, R.L.; Laversanne, M.; Soerjomataram, I.; Jemal, A.; Bray, F. Global Cancer Statistics 2020: GLOBOCAN Estimates of Incidence and Mortality Worldwide for 36 Cancers in 185 Countries. CA Cancer J. Clin. 2021, 71, 209–249. [Google Scholar] [CrossRef] [PubMed]
- Thai, A.A.; Solomon, B.J.; Sequist, L.V.; Gainor, J.F.; Heist, R.S. Lung cancer. Lancet 2021, 398, 535–554. [Google Scholar] [CrossRef]
- Duma, N.; Santana-Davila, R.; Molina, J.R. Non-Small Cell Lung Cancer: Epidemiology, Screening, Diagnosis, and Treatment. Mayo Clin. Proc. 2019, 94, 1623–1640. [Google Scholar] [CrossRef] [PubMed]
- Miller, K.D.; Nogueira, L.; Devasia, T.; Mariotto, A.B.; Yabroff, K.R.; Jemal, A.; Kramer, J.; Siegel, R.L. Cancer treatment and survivorship statistics, 2022. CA Cancer J. Clin. 2022, 72, 409–436. [Google Scholar] [CrossRef]
- Zeng, H.; Chen, W.; Zheng, R.; Zhang, S.; Ji, J.S.; Zou, X.; Xia, C.; Sun, K.; Yang, Z.; Li, H.; et al. Changing cancer survival in China during 2003–15: A pooled analysis of 17 population-based cancer registries. Lancet Glob. Health 2018, 6, e555–e567. [Google Scholar] [CrossRef]
- Zeng, H.; Ran, X.; An, L.; Zheng, R.; Zhang, S.; Ji, J.S.; Zhang, Y.; Chen, W.; Wei, W.; He, J.; et al. Disparities in stage at diagnosis for five common cancers in China: A multicentre, hospital-based, observational study. Lancet Public Health 2021, 6, e877–e887. [Google Scholar] [CrossRef]
- St Claire, S.; Gouda, H.; Schotte, K.; Fayokun, R.; Fu, D.; Varghese, C.; Prasad, V.M. Lung health, tobacco, and related products: Gaps, challenges, new threats, and suggested research. Am. J. Physiol.-Lung Cell. Mol. Physiol. 2020, 318, L1004–L1007. [Google Scholar] [CrossRef]
- Dai, J.; Lv, J.; Zhu, M.; Wang, Y.; Qin, N.; Ma, H.; He, Y.-Q.; Zhang, R.; Tan, W.; Fan, J.; et al. Identification of risk loci and a polygenic risk score for lung cancer: A large-scale prospective cohort study in Chinese populations. Lancet Respir. Med. 2019, 7, 881–891. [Google Scholar] [CrossRef]
- Yang, H.D.; Nam, S.W. Pathogenic diversity of RNA variants and RNA variation-associated factors in cancer development. Exp. Mol. Med. 2020, 52, 582–593. [Google Scholar] [CrossRef]
- Shao, L.; Zuo, X.; Yang, Y.; Zhang, Y.; Yang, N.; Shen, B.; Wang, J.; Wang, X.; Li, R.; Jin, G.; et al. The inherited variations of a p53-responsive enhancer in 13q12.12 confer lung cancer risk by attenuating TNFRSF19 expression. Genome Biol. 2019, 20, 103. [Google Scholar] [CrossRef]
- Ishigaki, K.; Akiyama, M.; Kanai, M.; Takahashi, A.; Kawakami, E.; Sugishita, H.; Sakaue, S.; Matoba, N.; Low, S.-K.; Okada, Y.; et al. Large-scale genome-wide association study in a Japanese population identifies novel susceptibility loci across different diseases. Nat. Genet. 2020, 52, 669–679. [Google Scholar] [CrossRef]
- The ENCODE Project Consortium. An Integrated Encyclopedia of DNA Elements in the Human Genome. Nature 2012, 489, 57–74. [Google Scholar] [CrossRef]
- Mitra, M.; Lee, H.N.; Coller, H.A. Splicing Busts a Move: Isoform Switching Regulates Migration. Trends Cell Biol. 2020, 30, 74–85. [Google Scholar] [CrossRef]
- Tian, B.; Manley, J.L. Alternative polyadenylation of mRNA precursors. Nat. Rev. Mol. Cell Biol. 2017, 18, 18–30. [Google Scholar] [CrossRef]
- Xiang, Y.; Ye, Y.; Lou, Y.; Yang, Y.; Cai, C.; Zhang, Z.; Mills, T.; Chen, N.-Y.; Kim, Y.; Ozguc, F.M.; et al. Comprehensive Characterization of Alternative Polyadenylation in Human Cancer. J. Natl. Cancer Inst. 2018, 110, 379–389. [Google Scholar] [CrossRef]
- Mittleman, B.E.; Pott, S.; Warland, S.; Zeng, T.; Mu, Z.; Kaur, M.; Gilad, Y.; Li, Y. Alternative polyadenylation mediates genetic regulation of gene expression. eLife 2020, 9, e57492. [Google Scholar] [CrossRef]
- Mariella, E.; Marotta, F.; Grassi, E.; Gilotto, S.; Provero, P. The Length of the Expressed 3′ UTR Is an Intermediate Molecular Phenotype Linking Genetic Variants to Complex Diseases. Front. Genet. 2019, 10, 714. [Google Scholar] [CrossRef]
- Xia, Z.; Donehower, L.A.; Cooper, T.A.; Neilson, J.R.; Wheeler, D.A.; Wagner, E.J.; Li, W. Dynamic analyses of alternative polyadenylation from RNA-seq reveal a 3′-UTR landscape across seven tumour types. Nat. Commun. 2014, 5, 5274. [Google Scholar] [CrossRef]
- Yuan, F.; Hankey, W.; Wagner, E.J.; Li, W.; Wang, Q. Alternative polyadenylation of mRNA and its role in cancer. Genes Dis. 2021, 8, 61–72. [Google Scholar] [CrossRef]
- Zhang, S.; Zhang, X.; Lei, W.; Liang, J.; Xu, Y.; Liu, H.; Ma, S. Genome-wide profiling reveals alternative polyadenylation of mRNA in human non-small cell lung cancer. J. Transl. Med. 2019, 17, 257. [Google Scholar] [CrossRef]
- Zhang, Y.; Liu, L.; Qiu, Q.; Zhou, Q.; Ding, J.; Lu, Y.; Liu, P. Alternative polyadenylation: Methods, mechanism, function, and role in cancer. J. Exp. Clin. Cancer Res. 2021, 40, 51. [Google Scholar] [CrossRef] [PubMed]
- Shulman, E.D.; Elkon, R. Systematic identification of functional SNPs interrupting 3′UTR polyadenylation signals. PLoS Genet. 2020, 16, e1008977. [Google Scholar] [CrossRef] [PubMed]
- Li, L.; Huang, K.-L.; Gao, Y.; Cui, Y.; Wang, G.; Elrod, N.D.; Li, Y.; Chen, Y.E.; Ji, P.; Peng, F.; et al. An atlas of alternative polyadenylation quantitative trait loci contributing to complex trait and disease heritability. Nat. Genet. 2021, 53, 994–1005. [Google Scholar] [CrossRef] [PubMed]
- Yang, Y.; Zhang, Q.; Miao, Y.-R.; Yang, J.; Yang, W.; Yu, F.; Wang, D.; Guo, A.-Y.; Gong, J. SNP2APA: A database for evaluating effects of genetic variants on alternative polyadenylation in human cancers. Nucleic Acids Res. 2020, 48, D226–D232. [Google Scholar] [CrossRef] [PubMed]
- Lan, Q.; Hsiung, C.A.; Matsuo, K.; Hong, Y.-C.; Seow, A.; Wang, Z.; Hosgood, H.D., 3rd; Chen, K.; Wang, J.-C.; Chatterjee, N.; et al. Genome-wide association analysis identifies new lung cancer susceptibility loci in never-smoking women in Asia. Nat. Genet. 2012, 44, 1330–1335. [Google Scholar] [CrossRef] [PubMed]
- Yu, Y.; Mao, L.; Lu, X.; Yuan, W.; Chen, Y.; Jiang, L.; Ding, L.; Sang, L.; Xu, Z.; Tian, T.; et al. Functional Variant in 3′UTR of FAM13A Is Potentially Associated with Susceptibility and Survival of Lung Squamous Carcinoma. DNA Cell Biol. 2019, 38, 1269–1277. [Google Scholar] [CrossRef] [PubMed]
- O’Donnell, P.H.; Trubetskoy, V.; Nurhussein-Patterson, A.; Hall, J.P.; Nath, A.; Huo, D.; Fleming, G.F.; Ingle, J.N.; Abramson, V.G.; Morrow, P.K.; et al. Clinical evaluation of germline polymorphisms associated with capecitabine toxicity in breast cancer: TBCRC-015. Breast Cancer Res. Treat. 2020, 181, 623–633. [Google Scholar] [CrossRef] [PubMed]
- Wen, W.; Chen, Z.; Bao, J.; Long, Q.; Shu, X.-O.; Zheng, W.; Guo, X. Genetic variations of DNA bindings of FOXA1 and co-factors in breast cancer susceptibility. Nat. Commun. 2021, 12, 5318. [Google Scholar] [CrossRef]
- Strub, M.D.; Gao, L.; Tan, K.; McCray, P.B., Jr. Analysis of multiple gene co-expression networks to discover interactions favoring CFTR biogenesis and ΔF508-CFTR rescue. BMC Med. Genom. 2021, 14, 258. [Google Scholar] [CrossRef]
- Das, T.K.; Sangodkar, J.; Negre, N.; Narla, G.; Cagan, R.L. Sin3a acts through a multi-gene module to regulate invasion in Drosophila and human tumors. Oncogene 2013, 32, 3184–3197. [Google Scholar] [CrossRef]
- Xu, J.-Y.; Zhang, C.; Wang, X.; Zhai, L.; Ma, Y.; Mao, Y.; Qian, K.; Sun, C.; Liu, Z.; Jiang, S.; et al. Integrative Proteomic Characterization of Human Lung Adenocarcinoma. Cell 2020, 182, 245–261.e17. [Google Scholar] [CrossRef]
- Buccitelli, C.; Selbach, M. mRNAs, proteins and the emerging principles of gene expression control. Nat. Rev. Genet. 2020, 21, 630–644. [Google Scholar] [CrossRef]
- Jemal, A.; Ward, E.M.; Johnson, C.J.; Cronin, K.A.; Ma, J.; Ryerson, A.B.; Mariotto, A.; Lake, A.J.; Wilson, R.; Sherman, R.L.; et al. Annual Report to the Nation on the Status of Cancer, 1975–2014, Featuring Survival. J. Natl. Cancer Inst. 2017, 109, djx030. [Google Scholar] [CrossRef]
- Chen, K.-C.; Tsai, S.-W.; Shie, R.-H.; Zeng, C.; Yang, H.-Y. Indoor Air Pollution Increases the Risk of Lung Cancer. Int. J. Environ. Res. Public Health 2022, 19, 1164. [Google Scholar] [CrossRef]
- Turner, M.C.; Andersen, Z.J.; Baccarelli, A.; Diver, W.R.; Gapstur, S.M.; Pope, C.A., 3rd; Prada, D.; Samet, J.; Thurston, G.; Cohen, A. Outdoor air pollution and cancer: An overview of the current evidence and public health recommendations. CA Cancer J. Clin. 2020, 70, 460–479. [Google Scholar] [CrossRef]
- Qin, N.; Li, Y.; Wang, C.; Zhu, M.; Dai, J.; Hong, T.; Albanes, D.; Lam, S.; Tardon, A.; Chen, C.; et al. Comprehensive functional annotation of susceptibility variants identifies genetic heterogeneity between lung adenocarcinoma and squamous cell carcinoma. Front. Med. 2021, 15, 275–291. [Google Scholar] [CrossRef]
- Mucci, L.A.; Hjelmborg, J.B.; Harris, J.R.; Czene, K.; Havelick, D.J.; Scheike, T.; Graff, R.E.; Holst, K.; Möller, S.; Unger, R.H.; et al. Familial Risk and Heritability of Cancer Among Twins in Nordic Countries. JAMA 2016, 315, 68–76. [Google Scholar] [CrossRef]
- Begik, O.; Oyken, M.; Alican, T.C.; Can, T.; Erson-Bensan, A.E. Alternative Polyadenylation Patterns for Novel Gene Discovery and Classification in Cancer. Neoplasia 2017, 19, 574–582. [Google Scholar] [CrossRef]
- Kim, K.; Chadalapaka, G.; Lee, S.-O.; Yamada, D.; Sastre-Garau, X.; Defossez, P.-A.; Park, Y.-Y.; Lee, J.-S.; Safe, S. Identification of oncogenic microRNA-17-92/ZBTB4/specificity protein axis in breast cancer. Oncogene 2012, 31, 1034–1044. [Google Scholar] [CrossRef]
- Mayr, C. What Are 3′ UTRs Doing? Cold Spring Harb. Perspect. Biol. 2019, 11, a034728. [Google Scholar] [CrossRef]
- Mayr, C. Evolution and Biological Roles of Alternative 3′UTRs. Trends Cell Biol. 2016, 26, 227–237. [Google Scholar] [CrossRef] [PubMed]
- Hu, R.-H.; Zhang, Z.-T.; Wei, H.-X.; Ning, L.; Ai, J.-S.; Li, W.-H.; Zhang, H.; Wang, S.-Q. LncRNA ST7-AS1, by regulating miR-181b-5p/KPNA4 axis, promotes the malignancy of lung adenocarcinoma. Cancer Cell Int. 2020, 20, 568. [Google Scholar] [CrossRef] [PubMed]
- Zhang, H.; Jiang, H.; Zhang, H.; Liu, J.; Hu, X.; Chen, L. miR-4262, low level of which predicts poor prognosis, targets proto-oncogene CD163 to suppress cell proliferation and invasion in gastric cancer. OncoTargets Ther. 2019, 12, 599–607. [Google Scholar] [CrossRef] [PubMed]


Publisher’s Note: MDPI stays neutral with regard to jurisdictional claims in published maps and institutional affiliations. |
© 2022 by the authors. Licensee MDPI, Basel, Switzerland. This article is an open access article distributed under the terms and conditions of the Creative Commons Attribution (CC BY) license (https://creativecommons.org/licenses/by/4.0/).