
Methylated Circulating Tumor DNA in Blood as a Tool for Diagnosing Lung Cancer: A Systematic Review and Meta-Analysis

 ,
,  , , and
Abstract
:Simple Summary
Abstract
1. Introduction
2. Materials and Methods
2.1. Search Strategy and Screening
2.2. Eligibility Criteria
2.3. Data Extraction and Quality Assessment
2.4. Statistical Analysis
3. Results
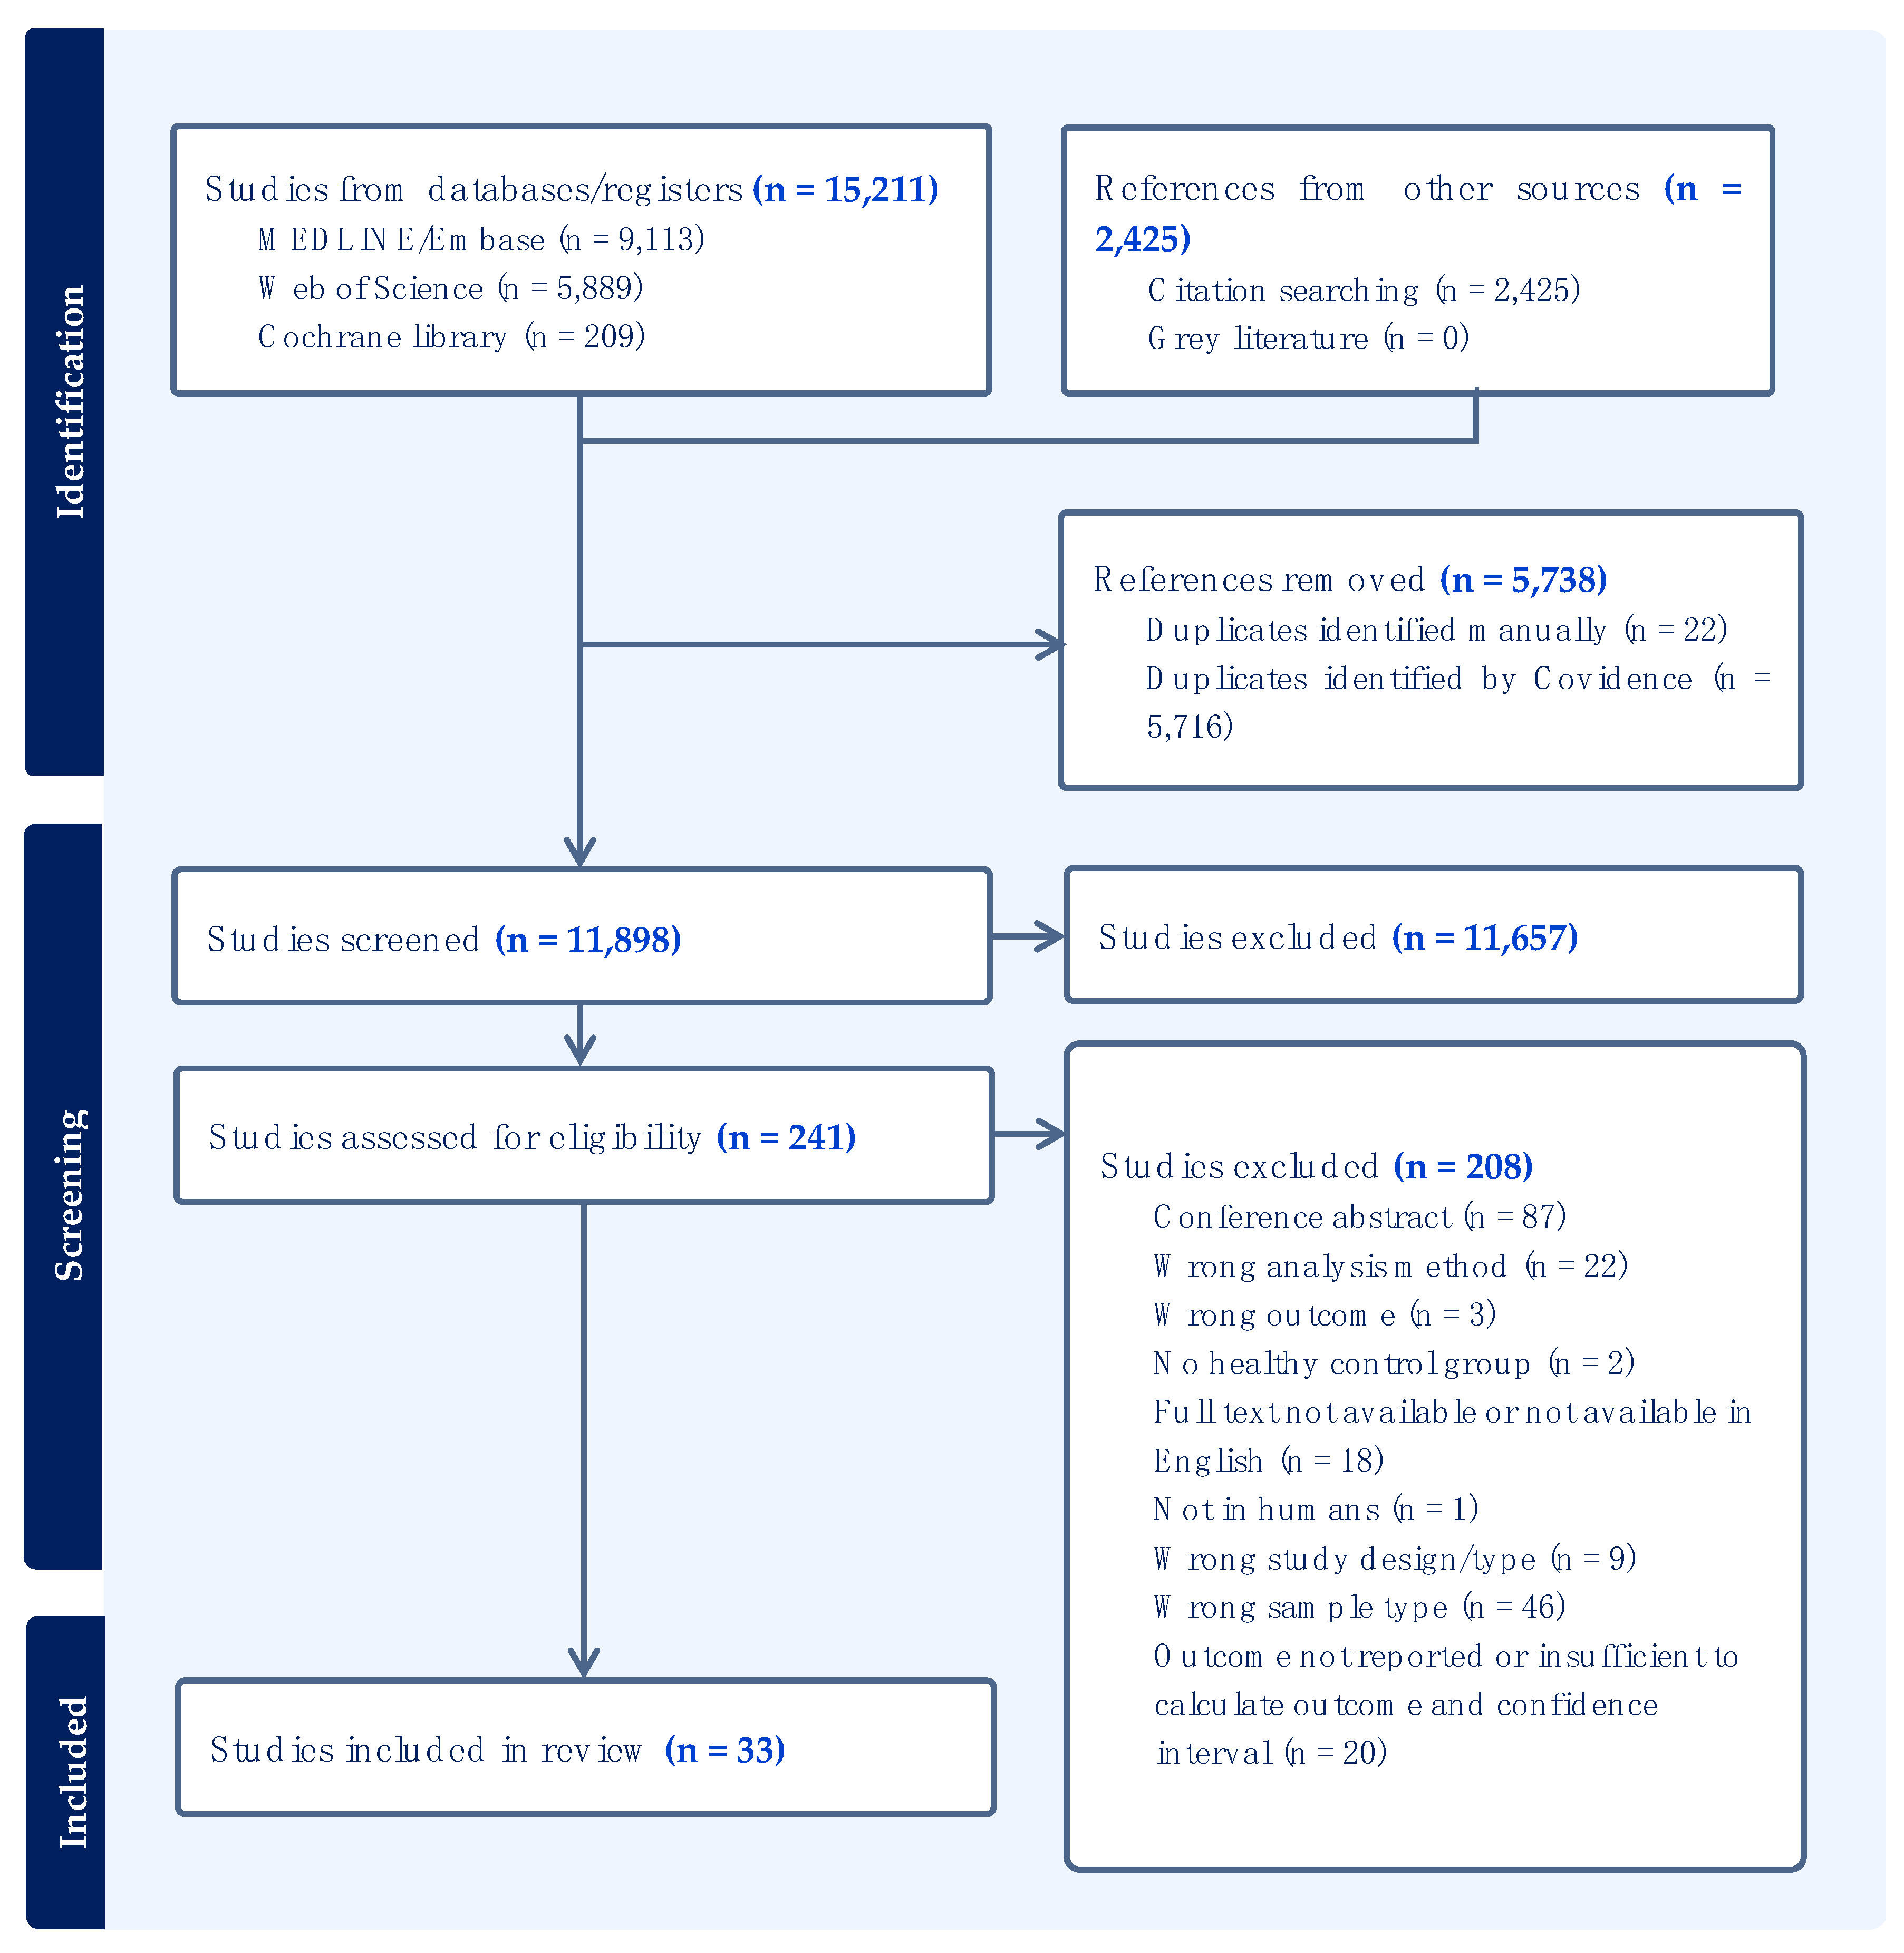
3.1. Search Results and Eligibility
3.2. Characteristics of Included Studies
3.3. Sample Type and Analysis Method
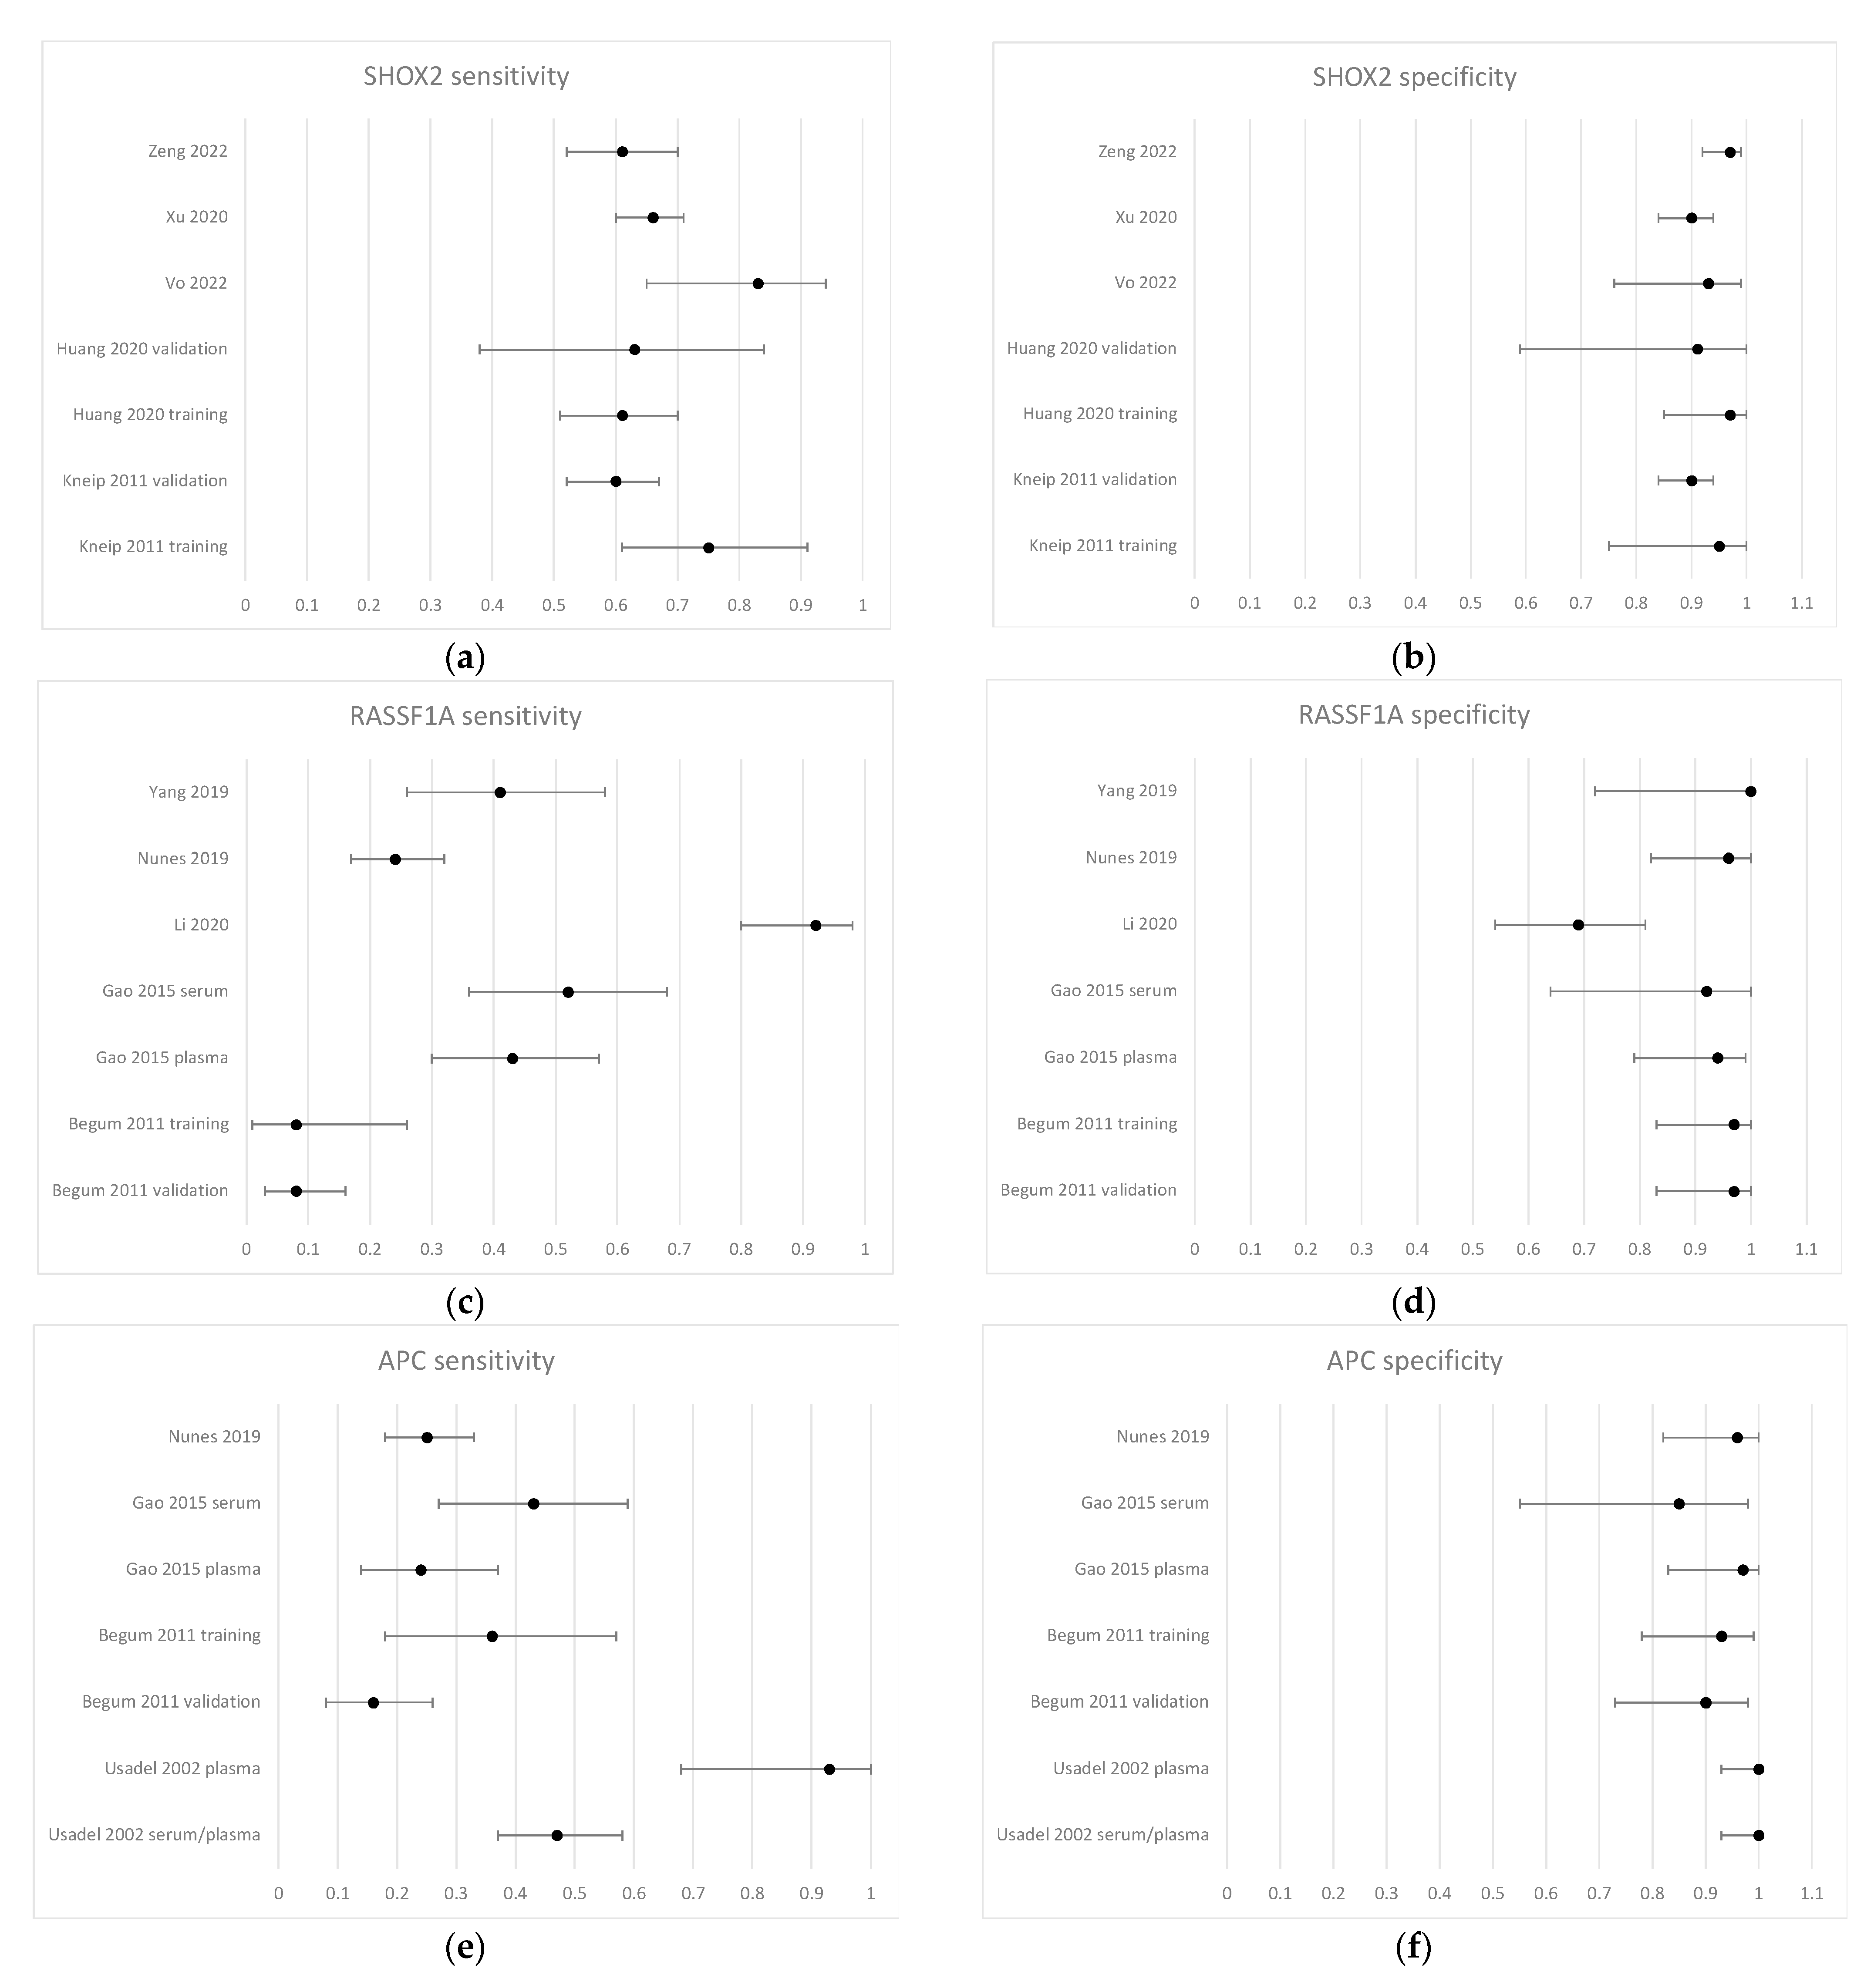
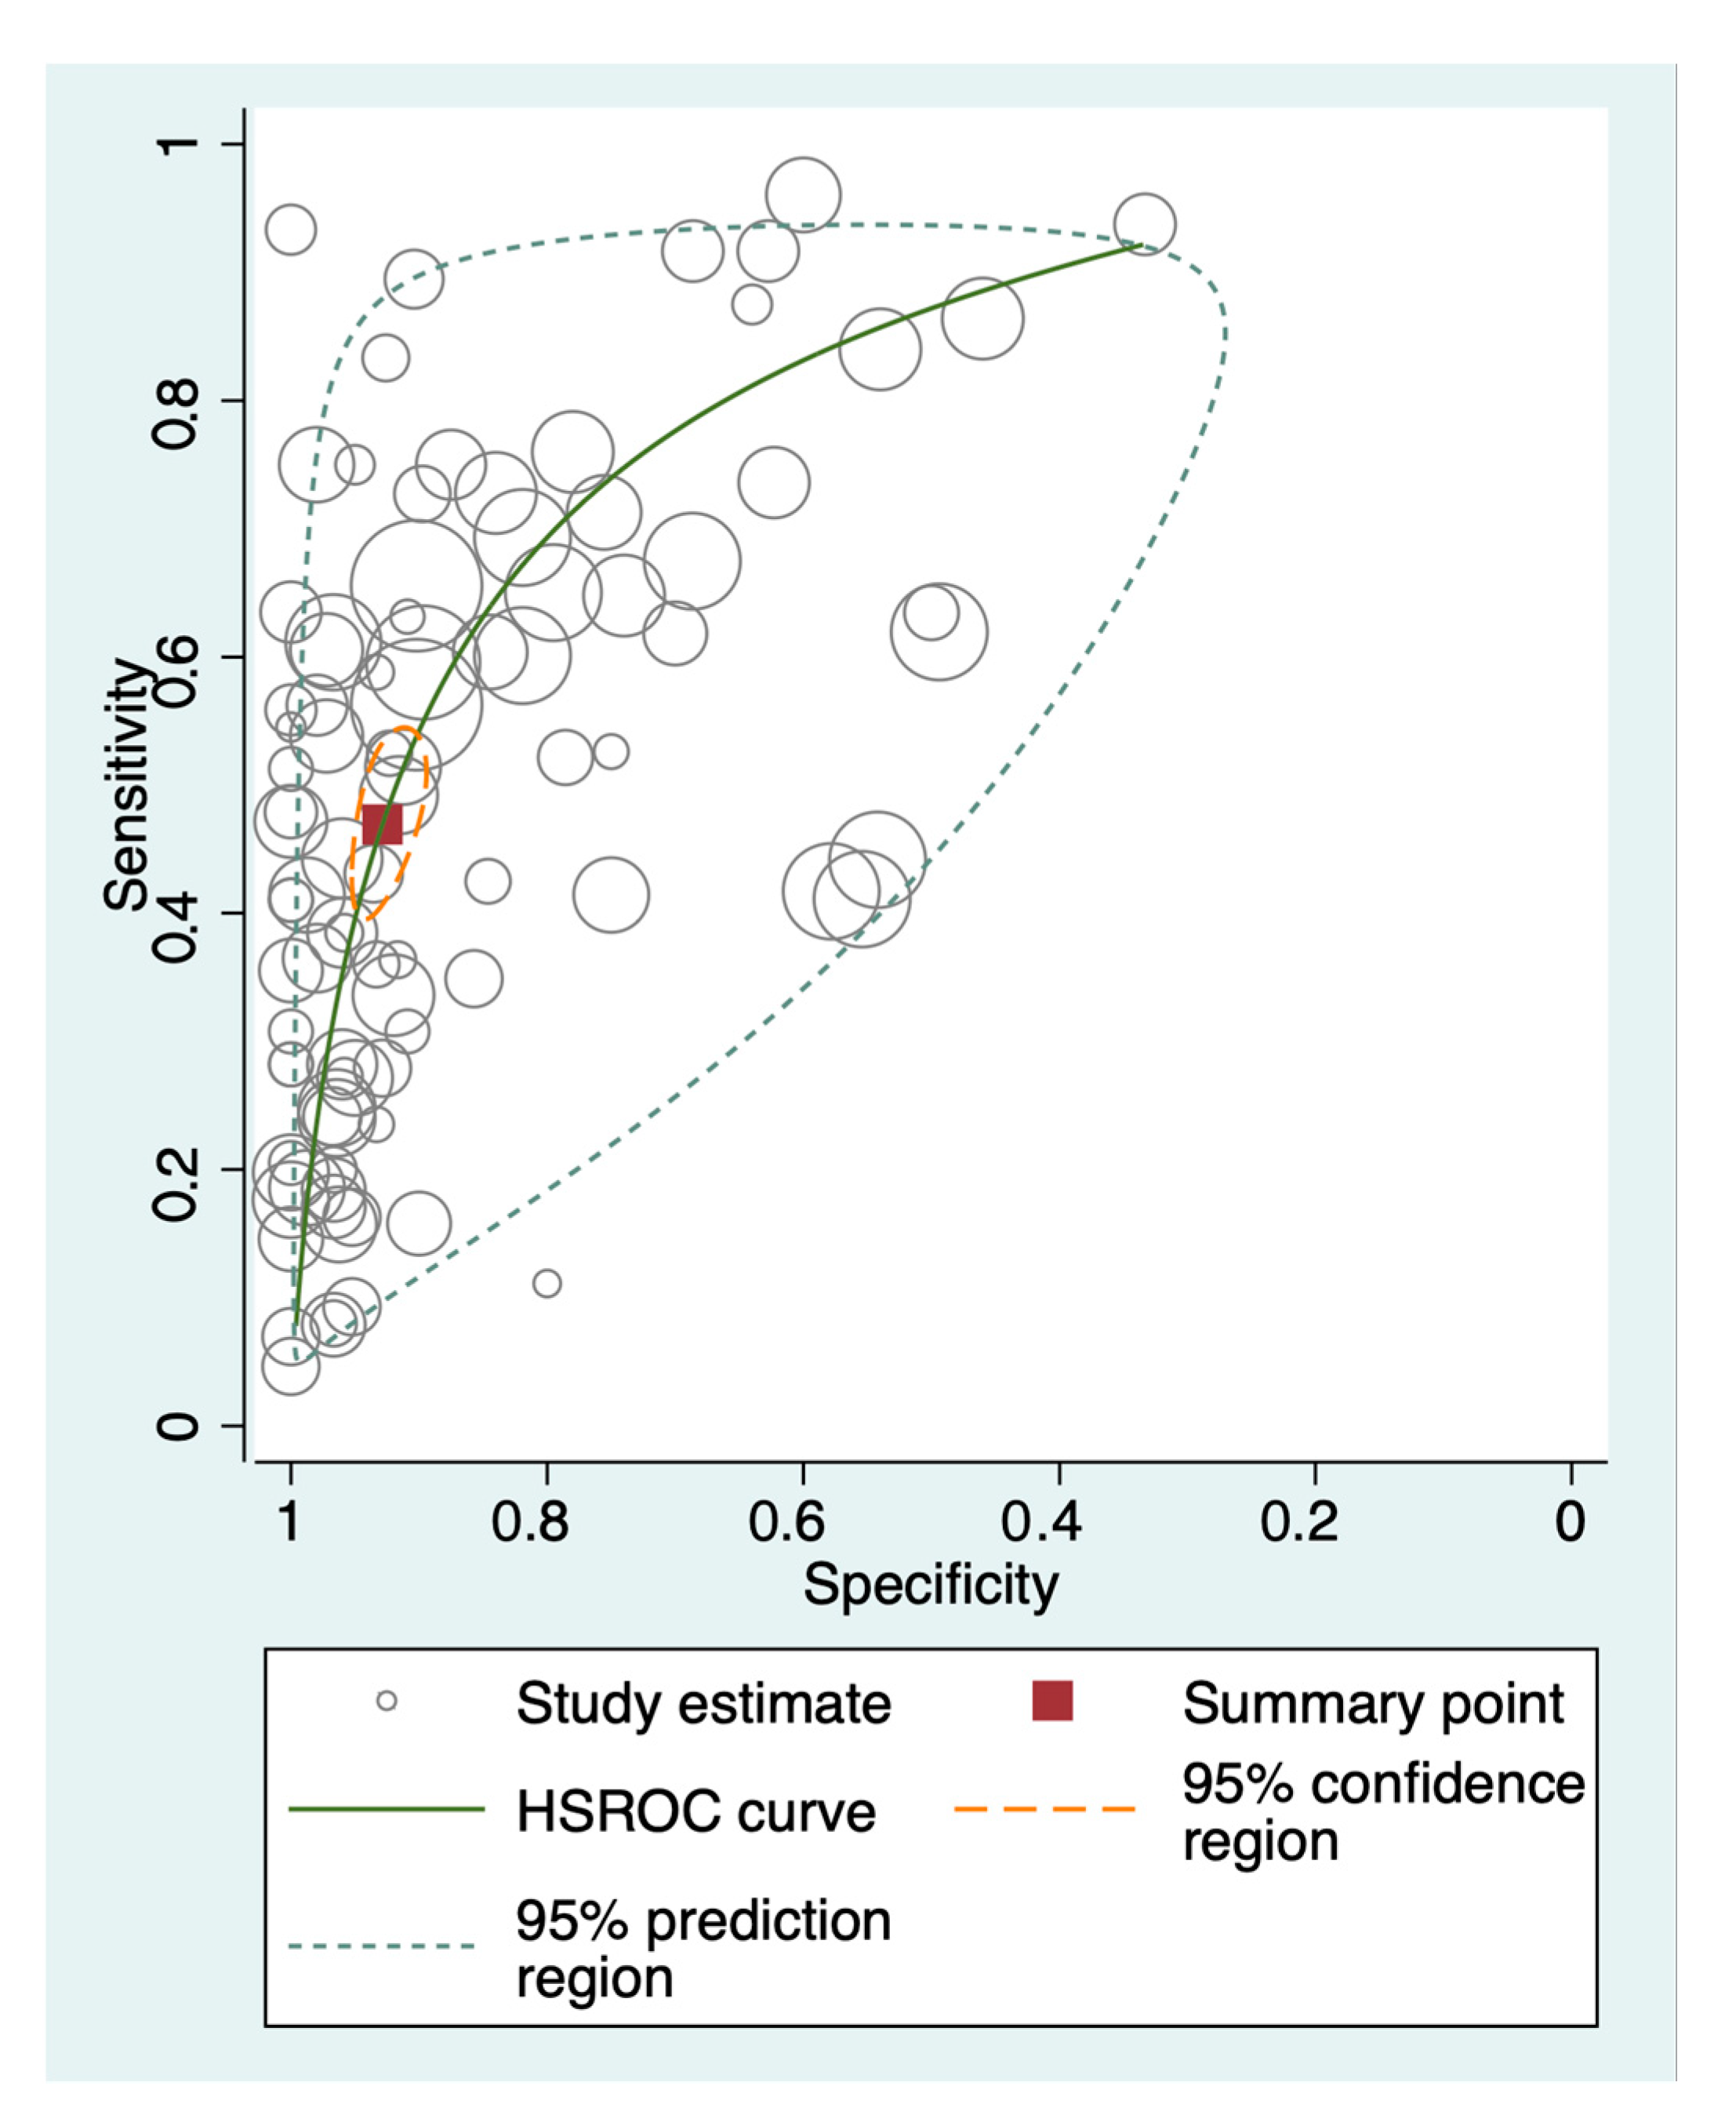
3.4. Diagnostic Performance of Methylated Circulating Tumor DNA
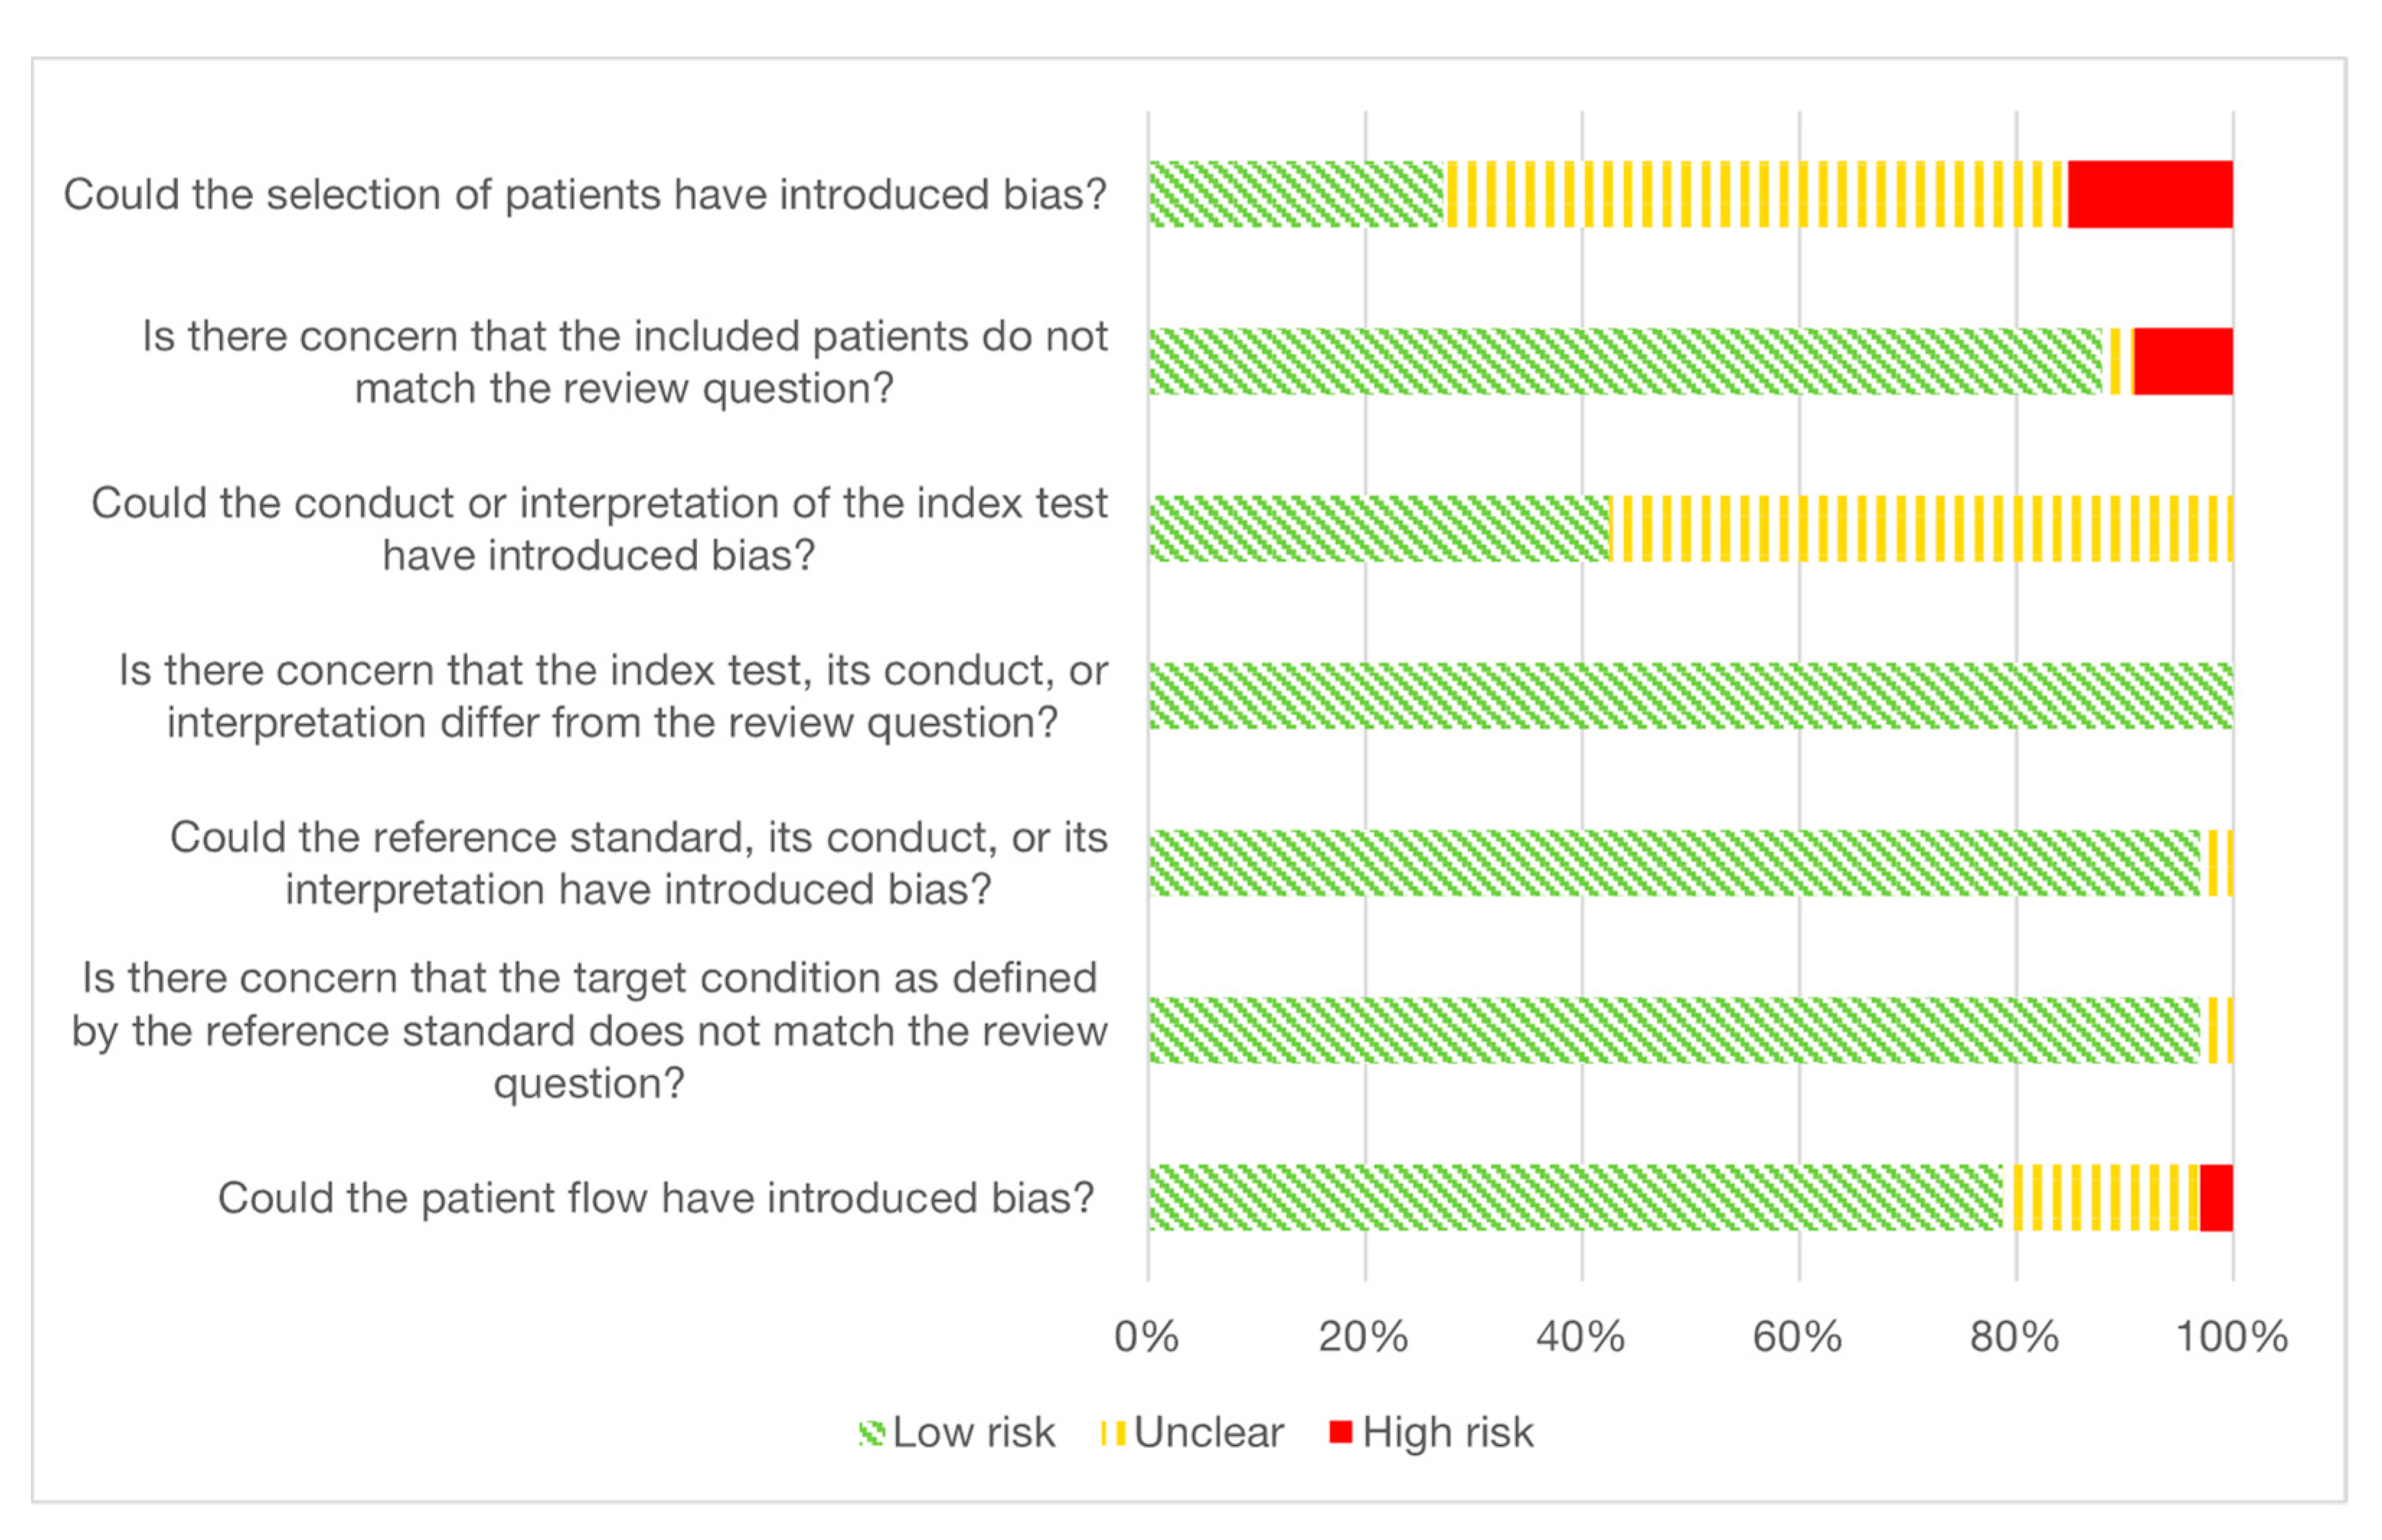
3.5. Quality Assessment and Risk of Bias
4. Discussion
5. Conclusions
Supplementary Materials
Author Contributions
Funding
Institutional Review Board Statement
Informed Consent Statement
Data Availability Statement
Acknowledgments
Conflicts of Interest
References
- Sung, H.; Ferlay, J.; Siegel, R.L.; Laversanne, M.; Soerjomataram, I.; Jemal, A.; Bray, F. Global Cancer Statistics 2020: GLOBOCAN Estimates of Incidence and Mortality Worldwide for 36 Cancers in 185 Countries. CA Cancer J. Clin. 2021, 71, 209–249. [Google Scholar] [CrossRef] [PubMed]
- Woodard, G.A.; Jones, K.D.; Jablons, D.M. Lung Cancer Staging and Prognosis. In Lung Cancer; Reckamp, K.L., Ed.; Cancer Treatment and Research; Springer International Publishing: Cham, Switzerland, 2016; Volume 170, pp. 47–75. ISBN 978-3-319-40387-8. [Google Scholar]
- O’Dowd, E.L.; Baldwin, D.R. Early Diagnosis Pivotal to Survival in Lung Cancer. Practitioner 2014, 258, 2–3, 21–24. [Google Scholar]
- Allemani, C.; Matsuda, T.; Di Carlo, V.; Harewood, R.; Matz, M.; Nikšić, M.; Bonaventure, A.; Valkov, M.; Johnson, C.J.; Estève, J.; et al. Global Surveillance of Trends in Cancer Survival 2000–14 (CONCORD-3): Analysis of Individual Records for 37 513 025 Patients Diagnosed with One of 18 Cancers from 322 Population-Based Registries in 71 Countries. Lancet 2018, 391, 1023–1075. [Google Scholar] [CrossRef] [Green Version]
- Verma, N.; Wu, M.; Altmayer, S. Lung Cancer Screening: How We Do It and Why. Semin. Roentgenol. 2020, 55, 14–22. [Google Scholar] [CrossRef] [PubMed]
- Potter, A.L.; Rosenstein, A.L.; Kiang, M.V.; Shah, S.A.; Gaissert, H.A.; Chang, D.C.; Fintelmann, F.J.; Yang, C.-F.J. Association of Computed Tomography Screening with Lung Cancer Stage Shift and Survival in the United States: Quasi-Experimental Study. BMJ 2022, 376, e069008. [Google Scholar] [CrossRef] [PubMed]
- Singareddy, A.; Flanagan, M.E.; Samson, P.P.; Waqar, S.N.; Devarakonda, S.; Ward, J.P.; Herzog, B.H.; Rohatgi, A.; Robinson, C.G.; Gao, F.; et al. Trends in Stage I Lung Cancer. Clin. Lung Cancer 2023, 24, 114–119. [Google Scholar] [CrossRef]
- Van Meerbeeck, J.P.; Franck, C. Lung Cancer Screening in Europe: Where Are We in 2021? Transl. Lung Cancer Res. 2021, 10, 2407–2417. [Google Scholar] [CrossRef]
- Mazzone, P.J.; Silvestri, G.A.; Souter, L.H.; Caverly, T.J.; Kanne, J.P.; Katki, H.A.; Wiener, R.S.; Detterbeck, F.C. Screening for Lung Cancer. Chest 2021, 160, e427–e494. [Google Scholar] [CrossRef]
- Rosenkrantz, A.B.; Xue, X.; Gyftopoulos, S.; Kim, D.C.; Nicola, G.N. Downstream Costs Associated with Incidental Pulmonary Nodules Detected on CT. Acad. Radiol. 2019, 26, 798–802. [Google Scholar] [CrossRef]
- Shi, H.-M.; Sun, Z.-C.; Ju, F.-H. Understanding the Harm of Low-dose Computed Tomography Radiation to the Body (Review). Exp. Ther. Med. 2022, 24, 534. [Google Scholar] [CrossRef]
- Lin, Y.; Fu, M.; Ding, R.; Inoue, K.; Jeon, C.Y.; Hsu, W.; Aberle, D.R.; Prosper, A.E. Patient Adherence to Lung CT Screening Reporting & Data System–Recommended Screening Intervals in the United States: A Systematic Review and Meta-Analysis. J. Thorac. Oncol. 2022, 17, 38–55. [Google Scholar] [CrossRef] [PubMed]
- MacMahon, H.; Naidich, D.P.; Goo, J.M.; Lee, K.S.; Leung, A.N.C.; Mayo, J.R.; Mehta, A.C.; Ohno, Y.; Powell, C.A.; Prokop, M.; et al. Guidelines for Management of Incidental Pulmonary Nodules Detected on CT Images: From the Fleischner Society 2017. Radiology 2017, 284, 228–243. [Google Scholar] [CrossRef] [PubMed] [Green Version]
- Li, L.; Zhao, Y.; Li, H. Assessment of Anxiety and Depression in Patients with Incidental Pulmonary Nodules and Analysis of Its Related Impact Factors. Thorac. Cancer 2020, 11, 1433–1442. [Google Scholar] [CrossRef] [Green Version]
- Casagrande, G.M.S.; Silva, M.D.O.; Reis, R.M.; Leal, L.F. Liquid Biopsy for Lung Cancer: Up-to-Date and Perspectives for Screening Programs. Int. J. Mol. Sci. 2023, 24, 2505. [Google Scholar] [CrossRef] [PubMed]
- Wen, X.; Pu, H.; Liu, Q.; Guo, Z.; Luo, D. Circulating Tumor DNA—A Novel Biomarker of Tumor Progression and Its Favorable Detection Techniques. Cancers 2022, 14, 6025. [Google Scholar] [CrossRef] [PubMed]
- Dacic, S. State of the Art of Pathologic and Molecular Testing. Hematol. Oncol. Clin. 2023, 37, 463–473. [Google Scholar] [CrossRef]
- Redshaw, N.; Huggett, J.F.; Taylor, M.S.; Foy, C.A.; Devonshire, A.S. Quantification of Epigenetic Biomarkers: An Evaluation of Established and Emerging Methods for DNA Methylation Analysis. BMC Genom. 2014, 15, 1174. [Google Scholar] [CrossRef] [Green Version]
- McGinn, S.; Gut, I.G. DNA Sequencing—Spanning the Generations. New Biotechnol. 2013, 30, 366–372. [Google Scholar] [CrossRef]
- Shields, M.D.; Chen, K.; Dutcher, G.; Patel, I.; Pellini, B. Making the Rounds: Exploring the Role of Circulating Tumor DNA (CtDNA) in Non-Small Cell Lung Cancer. Int. J. Mol. Sci. 2022, 23, 9006. [Google Scholar] [CrossRef]
- Walter, R.F.H.; Rozynek, P.; Casjens, S.; Werner, R.; Mairinger, F.D.; Speel, E.J.M.; Zur Hausen, A.; Meier, S.; Wohlschlaeger, J.; Theegarten, D.; et al. Methylation of L1RE1, RARB, and RASSF1 Function as Possible Biomarkers for the Differential Diagnosis of Lung Cancer. PLoS ONE 2018, 13, e0195716. [Google Scholar] [CrossRef]
- Balgkouranidou, I.; Chimonidou, M.; Milaki, G.; Tsaroucha, E.; Kakolyris, S.; Georgoulias, V.; Lianidou, E. SOX17 Promoter Methylation in Plasma Circulating Tumor DNA of Patients with Non-Small Cell Lung Cancer. Clin. Chem. Lab. Med. 2016, 54, 1385–1393. [Google Scholar] [CrossRef] [PubMed]
- Ponomaryova, A.A.; Rykova, E.Y.; Cherdyntseva, N.V.; Skvortsova, T.E.; Dobrodeev, A.Y.; Zav’yalov, A.A.; Tuzikov, S.A.; Vlassov, V.V.; Laktionov, P.P. RARβ2 Gene Methylation Level in the Circulating DNA from Blood of Patients with Lung Cancer. Eur. J. Cancer Prev. 2011, 20, 453–455. [Google Scholar] [CrossRef]
- Li, L.; Fu, K.; Zhou, W.; Snyder, M. Applying Circulating Tumor DNA Methylation in the Diagnosis of Lung Cancer. Precis. Clin. Med. 2019, 2, 45–56. [Google Scholar] [CrossRef] [PubMed]
- Page, M.J.; McKenzie, J.E.; Bossuyt, P.M.; Boutron, I.; Hoffmann, T.C.; Mulrow, C.D.; Shamseer, L.; Tetzlaff, J.M.; Akl, E.A.; Brennan, S.E.; et al. The PRISMA 2020 Statement: An Updated Guideline for Reporting Systematic Reviews. BMJ 2021, 372, n71. [Google Scholar] [CrossRef]
- Whiting, P.F.; Rutjes, A.W.S.; Westwood, M.E.; Mallett, S.; Deeks, J.J.; Reitsma, J.B.; Leeflang, M.M.G.; Sterne, J.A.C.; Bossuyt, P.M.M.; QUADAS-2 Group. QUADAS-2: A Revised Tool for the Quality Assessment of Diagnostic Accuracy Studies. Ann. Intern. Med. 2011, 155, 529–536. [Google Scholar] [CrossRef]
- Harbord, R.M.; Whiting, P. Metandi: Meta-Analysis of Diagnostic Accuracy Using Hierarchical Logistic Regression. Stata J. Promot. Commun. Stat. Stata 2009, 9, 211–229. [Google Scholar] [CrossRef] [Green Version]
- Dwamena, B. MIDAS: Stata Module for Meta-Analytical Integration of Diagnostic Test Accuracy Studies. EconPapers 2007. [Google Scholar]
- Kneip, C.; Schmidt, B.; Seegebarth, A.; Weickmann, S.; Fleischhacker, M.; Liebenberg, V.; Field, J.K.; Dietrich, D. SHOX2 DNA Methylation Is a Biomarker for the Diagnosis of Lung Cancer in Plasma. J. Thorac. Oncol. 2011, 6, 1632–1638. [Google Scholar] [CrossRef] [Green Version]
- Ostrow, K.; Loyo, M.; Greenberg, A.; Gaither-Davis, A.; Siegfried, J.; Hoque, M.; Bigbee, W.; Rom, W.; Sidransky, D. Molecular Analysis of Plasma DNA for the Early Detection of Lung Cancer by Quantitative Methylation Specific PCR. Cancer Res. 2009, 69, 247. [Google Scholar]
- Yang, Z.; Qi, W.; Sun, L.; Zhou, H.; Zhou, B.; Hu, Y. DNA Methylation Analysis of Selected Genes for the Detection of Early-Stage Lung Cancer Using Circulating Cell-Free DNA. Adv. Clin. Exp. Med. 2019, 28, 361–366. [Google Scholar] [CrossRef] [PubMed] [Green Version]
- Usadel, H.; Brabender, J.; Danenberg, K.D.; Jeronimo, C.; Harden, S.; Engles, J.; Danenberg, P.V.; Yang, S.; Sidransky, D. Quantitative Adenomatous Polyposis Coli Promoter Methylation Analysis in Tumor Tissue, Serum, and Plasma DNA of Patients with Lung Cancer. Cancer Res. 2002, 62, 371–375. [Google Scholar] [PubMed]
- Zhang, Y.W.; Miao, Y.F.; Yi, J.; Geng, J.; Wang, R.; Chen, L.B. Transcriptional Inactivation of Secreted Frizzled-Related Protein 1 by Promoter Hypermethylation as a Potential Biomarker for Non-Small Cell Lung Cancer. Neoplasma 2010, 57, 228–233. [Google Scholar] [CrossRef] [Green Version]
- Zhang, Y.; Song, H.; Miao, Y.; Wang, R.; Chen, L. Frequent Transcriptional Inactivation of Kallikrein 10 Gene by CpG Island Hypermethylation in Non-Small Cell Lung Cancer. Cancer Sci. 2010, 101, 934–940. [Google Scholar] [CrossRef] [PubMed]
- Begum, S.; Brait, M.; Dasgupta, S.; Ostrow, K.L.; Zahurak, M.; Carvalho, A.L.; Califano, J.A.; Goodman, S.N.; Westra, W.H.; Hoque, M.O.; et al. An Epigenetic Marker Panel for Detection of Lung Cancer Using Cell-Free Serum DNA. Clin. Cancer Res. 2011, 17, 4494–4503. [Google Scholar] [CrossRef] [PubMed] [Green Version]
- Vinayanuwattikun, C.; Sriuranpong, V.; Tanasanvimon, S.; Chantranuwat, P.; Mutirangura, A. Epithelial-Specific Methylation Marker: A Potential Plasma Biomarker in Advanced Non-Small Cell Lung Cancer. J. Thorac. Oncol. 2011, 6, 1818–1825. [Google Scholar] [CrossRef] [PubMed] [Green Version]
- Balgkouranidou, I.; Chimonidou, M.; Milaki, G.; Tsarouxa, E.G.; Kakolyris, S.; Welch, D.R.; Georgoulias, V.; Lianidou, E.S. Breast Cancer Metastasis Suppressor-1 Promoter Methylation in Cell-Free DNA Provides Prognostic Information in Non-Small Cell Lung Cancer. Br. J. Cancer 2014, 110, 2054–2062. [Google Scholar] [CrossRef] [Green Version]
- Powrozek, T.; Krawczyk, P.; Kucharczyk, T.; Milanowski, J. Septin 9 Promoter Region Methylation in Free Circulating DNA-Potential Role in Noninvasive Diagnosis of Lung Cancer: Preliminary Report. Med. Oncol. 2014, 31, 917. [Google Scholar] [CrossRef] [Green Version]
- Gao, L.; Xie, E.; Yu, T.; Chen, D.; Zhang, L.; Zhang, B.; Wang, F.; Xu, J.; Huang, P.; Liu, X.; et al. Methylated APC and RASSF1A in Multiple Specimens Contribute to the Differential Diagnosis of Patients with Undetermined Solitary Pulmonary Nodules. J. Thorac. Dis. 2015, 7, 422–432. [Google Scholar] [CrossRef]
- Powrozek, T.; Krawczyk, P.; Nicos, M.; Kuznar-Kaminska, B.; Batura-Gabryel, H.; Milanowski, J. Methylation of the DCLK1 Promoter Region in Circulating Free DNA and Its Prognostic Value in Lung Cancer Patients. Clin. Transl. Oncol. 2016, 18, 398–404. [Google Scholar] [CrossRef]
- Powrozek, T.; Krawczyk, P.; Kuznar-Kaminska, B.; Batura-Gabryel, H.; Milanowski, J. Analysis of RTEL1 and PCDHGB6 Promoter Methylation in Circulating-Free DNA of Lung Cancer Patients Using Liquid Biopsy: A Pilot Study. Exp. Lung Res. 2016, 42, 307–313. [Google Scholar] [CrossRef] [PubMed]
- Aslam, M.S.; Shaeer, A.; Abbas, Z.; Ahmed, A.; Gull, I.; Athar, M.A. Cell-Free DNA Quantification and Methylation Status of DCC Gene as Predictive Diagnostic Biomarkers of Lung Cancer in Patients Reported at Gulab Devi Chest Hospital, Lahore. Technol. Cancer Res. Treat. 2017, 16, 758–765. [Google Scholar] [CrossRef]
- Hulbert, A.; Jusue-Torres, I.; Stark, A.; Chen, C.; Rodgers, K.; Lee, B.; Griffin, C.; Yang, A.; Huang, P.; Wrangle, J.; et al. Early Detection of Lung Cancer Using DNA Promoter Hypermethylation in Plasma and Sputum. Clin. Cancer Res. 2017, 23, 1998–2005. [Google Scholar] [CrossRef] [Green Version]
- Ooki, A.; Maleki, Z.; Tsay, J.-C.J.; Goparaju, C.; Brait, M.; Turaga, N.; Nam, H.-S.; Rom, W.N.; Pass, H.I.; Sidransky, D.; et al. A Panel of Novel Detection and Prognostic Methylated DNA Markers in Primary Non-Small Cell Lung Cancer and Serum DNA. Clin. Cancer Res. 2017, 23, 7141–7152. [Google Scholar] [CrossRef] [PubMed] [Green Version]
- Nunes, S.P.; Diniz, F.; Moreira-Barbosa, C.; Constancio, V.; Silva, A.V.; Oliveira, J.; Soares, M.; Paulino, S.; Cunha, A.L.; Rodrigues, J.; et al. Subtyping Lung Cancer Using Dna Methylation in Liquid Biopsies. J. Clin. Med. 2019, 8, 1500. [Google Scholar] [CrossRef] [Green Version]
- Villalba, M.; Exposito, F.; Pajares, M.J.; Sainz, C.; Redrado, M.; Remirez, A.; Wistuba, I.; Behrens, C.; Jantus-Lewintre, E.; Camps, C.; et al. TMPRSS4: A Novel Tumor Prognostic Indicator for the Stratification of Stage IA Tumors and a Liquid Biopsy Biomarker for NSCLC Patients. J. Clin. Med. 2019, 8, 2134. [Google Scholar] [CrossRef] [PubMed] [Green Version]
- Chen, C.; Huang, X.; Yin, W.; Peng, M.; Wu, F.; Wu, X.; Tang, J.; Chen, M.; Wang, X.; Hulbert, A.; et al. Ultrasensitive DNA Hypermethylation Detection Using Plasma for Early Detection of NSCLC: A Study in Chinese Patients with Very Small Nodules. Clin. Epigenetics 2020, 12, 828. [Google Scholar] [CrossRef] [PubMed] [Green Version]
- Huang, W.; Huang, H.; Zhang, S.; Wang, X.; Ouyang, J.; Lin, Z.; Chen, P. A Novel Diagnosis Method Based on Methylation Analysis of SHOX2 and Serum Biomarker for Early Stage Lung Cancer. Cancer Control 2020, 27, 1073274820969703. [Google Scholar] [CrossRef]
- Li, X.; Yang, T.; Li, C.S.; Song, Y.; Wang, D.; Jin, L.; Lou, H.; Li, W. Polymerase Chain Reaction—Surface-Enhanced Raman Spectroscopy (PCR-SERS) Method for Gene Methylation Level Detection in Plasma. Theranostics 2020, 10, 898–909. [Google Scholar] [CrossRef]
- Wen, S.W.C.; Andersen, R.F.; Petersen, L.M.S.; Hager, H.; Hilberg, O.; Jakobsen, A.; Hansen, T.F. Comparison of Mutated Kras and Methylated Hoxa9 Tumor-Specific Dna in Advanced Lung Adenocarcinoma. Cancers 2020, 12, 3728. [Google Scholar] [CrossRef]
- Xu, Z.; Wang, Y.; Wang, L.; Xiong, J.; Wang, H.; Cui, F.; Peng, H. The Performance of the SHOX2/PTGER4 Methylation Assay Is Influenced by Cancer Stage, Age, Type and Differentiation. Biomark. Med. 2020, 14, 341–351. [Google Scholar] [CrossRef]
- Mastoraki, S.; Balgkouranidou, I.; Tsaroucha, E.; Klinakis, A.; Georgoulias, V.; Lianidou, E. KMT2C Promoter Methylation in Plasma-Circulating Tumor DNA Is a Prognostic Biomarker in Non-Small Cell Lung Cancer. Mol. Oncol. 2021, 15, 2412–2422. [Google Scholar] [CrossRef]
- Park, M.; Lee, J.; Lee, J.; Hwang, S. Alu Cell-Free DNA Concentration, Alu Index, and LINE-1 Hypomethylation as a Cancer Predictor. Clin. Biochem. 2021, 94, 67–73. [Google Scholar] [CrossRef] [PubMed]
- Szczyrek, M.; Grenda, A.; Kuznar-Kaminska, B.; Krawczyk, P.; Sawicki, M.; Batura-Gabryel, H.; Mlak, R.; Szudy-Szczyrek, A.; Krajka, T.; Krajka, A.; et al. Methylation of DROSHA and DICER as a Biomarker for the Detection of Lung Cancer. Cancers 2021, 13, 6139. [Google Scholar] [CrossRef] [PubMed]
- Kim, Y.; Lee, B.B.; Kim, D.; Um, S.-W.; Han, J.; Shim, Y.M.; Kim, D.-H. Aberrant Methylation of SLIT2 Gene in Plasma Cell-Free DNA of Non-Small Cell Lung Cancer Patients. Cancers 2022, 14, 296. [Google Scholar] [CrossRef] [PubMed]
- Palanca-Ballester, C.; Hervas, D.; Villalba, M.; Valdes-Sanchez, T.; Garcia, D.; Alcoriza-Balaguer, M.I.; Benet, M.; Martinez-Tomas, R.; Briones-Gomez, A.; Galbis-Caravajal, J.; et al. Translation of a Tissue Epigenetic Signature to Circulating Free DNA Suggests BCAT1 as a Potential Noninvasive Diagnostic Biomarker for Lung Cancer. Clin. Epigenetics 2022, 14, 116. [Google Scholar] [CrossRef]
- Vo, T.T.L.; Nguyen, T.N.; Nguyen, T.T.; Pham, A.T.D.; Vuong, D.L.; Ta, V.T.; Ho, V.S. SHOX2 Methylation in Vietnamese Patients with Lung Cancer. Mol. Biol. Rep. 2022, 49, 3413–3421. [Google Scholar] [CrossRef]
- Zeng, S.; Lin, C.; Huang, Y. MiR-375 Combined with SHOX2 Methylation Has Higher Diagnostic Efficacy for Non-Small-Cell Lung Cancer. Mol. Biotechnol. 2022, 65, 1187–1197. [Google Scholar] [CrossRef]
- Zhang, L.Y.; Sun, X.W.; Ding, Y.J.; Yan, Y.R.; Wang, Y.; Li, C.X.; Li, S.Q.; Zhang, L.; Song, H.J.; Li, H.P.; et al. SERPINA1 Methylation Levels Are Associated with Lung Cancer Development in Male Patients with Chronic Obstructive Pulmonary Disease. Int. J. Chron. Obstruct. Pulmon. Dis. 2022, 17, 2117–2125. [Google Scholar] [CrossRef]
- Power, M.; Fell, G.; Wright, M. Principles for High-Quality, High-Value Testing. Evid. Based Med. 2013, 18, 5–10. [Google Scholar] [CrossRef] [Green Version]
- Mokhles, S.; Takkenberg, J.J.; Treasure, T. Evidence-Based and Personalized Medicine. It’s [AND] Not [OR]. Ann. Thorac. Surg. 2017, 103, 351–360. [Google Scholar] [CrossRef] [Green Version]
- Meddeb, R.; Pisareva, E.; Thierry, A.R. Guidelines for the Preanalytical Conditions for Analyzing Circulating Cell-Free DNA. Clin. Chem. 2019, 65, 623–633. [Google Scholar] [CrossRef] [PubMed]
- El Messaoudi, S.; Rolet, F.; Mouliere, F.; Thierry, A.R. Circulating Cell Free DNA: Preanalytical Considerations. Clin. Chim. Acta 2013, 424, 222–230. [Google Scholar] [CrossRef] [PubMed]
- Taylor, S.C.; Nadeau, K.; Abbasi, M.; Lachance, C.; Nguyen, M.; Fenrich, J. The Ultimate QPCR Experiment: Producing Publication Quality, Reproducible Data the First Time. Trends Biotechnol. 2019, 37, 761–774. [Google Scholar] [CrossRef] [PubMed] [Green Version]
- Yu, M.; Carter, K.T.; Makar, K.W.; Vickers, K.; Ulrich, C.M.; Schoen, R.E.; Brenner, D.; Markowitz, S.D.; Grady, W.M. MethyLight Droplet Digital PCR for Detection and Absolute Quantification of Infrequently Methylated Alleles. Epigenetics 2015, 10, 803–809. [Google Scholar] [CrossRef] [Green Version]
- Whale, A.S.; Devonshire, A.S.; Karlin-Neumann, G.; Regan, J.; Javier, L.; Cowen, S.; Fernandez-Gonzalez, A.; Jones, G.M.; Redshaw, N.; Beck, J.; et al. International Interlaboratory Digital PCR Study Demonstrating High Reproducibility for the Measurement of a Rare Sequence Variant. Anal. Chem. 2017, 89, 1724–1733. [Google Scholar] [CrossRef]
- Postel, M.; Roosen, A.; Laurent-Puig, P.; Taly, V.; Wang-Renault, S.-F. Droplet-Based Digital PCR and next Generation Sequencing for Monitoring Circulating Tumor DNA: A Cancer Diagnostic Perspective. Expert Rev. Mol. Diagn. 2018, 18, 7–17. [Google Scholar] [CrossRef]
- Terp, S.K.; Stoico, M.P.; Dybkær, K.; Pedersen, I.S. Early Diagnosis of Ovarian Cancer Based on Methylation Profiles in Peripheral Blood Cell-Free DNA: A Systematic Review. Clin. Epigenet. 2023, 15, 24. [Google Scholar] [CrossRef]
- Park, J.Y.; Jang, S.H. Epidemiology of Lung Cancer in Korea: Recent Trends. Tuberc. Respir. Dis. 2016, 79, 58–69. [Google Scholar] [CrossRef]
- Leenen, F.A.D.; Muller, C.P.; Turner, J.D. DNA Methylation: Conducting the Orchestra from Exposure to Phenotype? Clin. Epigenetics 2016, 8, 92. [Google Scholar] [CrossRef] [Green Version]
- Cohen, J.F.; Korevaar, D.A.; Altman, D.G.; Bruns, D.E.; Gatsonis, C.A.; Hooft, L.; Irwig, L.; Levine, D.; Reitsma, J.B.; Vet, H.C.W.d.; et al. STARD 2015 Guidelines for Reporting Diagnostic Accuracy Studies: Explanation and Elaboration. BMJ Open 2016, 6, e012799. [Google Scholar] [CrossRef] [Green Version]

| Study ID | Region | Study Design | Cases | Histology | Stage | Controls | Cohort | Number of Cases | Number of Controls | Reference Standard |
|---|---|---|---|---|---|---|---|---|---|---|
| Usadel, 2002 [32] | Northern America | Case-control study | Retrospectively selected cases | LUSC 35/99 * (35%), LUAD 47/99 (48%), other 17/99 (17%) | I 53/99 * (54%), II 23/99 (23%), III 17/99 (17%), IV 6/99 (6%) | Unmatched healthy controls | Training | 71 serum, 33 plasma (15 matched) | 50 | Histopathology or cytology. |
| Ostrow, 2009 [30] | Northern America | Case-control study | Retrospectively selected cases | LUSC 6/13 (46%), LUAD 1/13 (8%), other 6/13 (46%) | Not reported | Matched on certain characteristics | Training | 13 | 24 | Tumor tissue biopsy/histopathology |
| LUSC 7/70 (10%), LUAD 47/70 (67%), other 16/70 (23%) | I 49/70 (70%), II 2/70 (3%), III 10/70 (14%), IV 4/70 (6%), no stage 5/70 (7%) | Validation | 70 | 23 with nodules + 80 smokers with no nodules | ||||||
| Zhang, 2010 A [33] | China | Case-control study | Retrospectively selected cases | LUSC 36/78 (46%), LUAD 30/78 (38%), other 12/78 (15%) | I–II 58/78 (74%), III–IV 20/78 (26%) | Unmatched healthy controls | Training | 78 | 50 | Histopathology or cytology |
| Zhang, 2010 B [34] | China | Case-control study | Retrospectively selected cases | LUSC 36/78 (46%), LUAD 30/78 (38%), other 12/78 (15%) | I–II 58/78 (74%), III–IV 20/78 (26%) | Unmatched healthy controls | Training | 78 | 50 | Tumor tissue biopsy/histopathology |
| Begum, 2011 [35] | Northern America | Case-control study | Retrospectively selected cases | LUSC 26/76 (34%), LUAD 36/76 (47%), other 14/76 (18%) | I 41/76 (54%), II 17/76 (22%), III 11/76 (14%), IV 5/76 (7%), unknown 2/76 (3%) | Matched on certain characteristics | Training | 76 | 30 | Histopathology or cytology |
| Kneip, 2011 [29] | EU | Case-control study | Retrospectively selected cases | LUSC 38/188 (20%), LUAD 31/188 (16%), SCLC 15/188 (8%), other/unknown 104/188 (55%) | I 37/188 (20%), II 29/188 (15%), III 53/188 (28%), IV 42/188 (22%), unknown 27/188 (14%) | Combination of healthy, benign and prostate cancer | Training | 188 | 155 | Histopathology or cytology |
| Ponomaryova, 2011 [23] | Other: Russia | Case-control study | Retrospectively selected cases | LUSC 34/52 (65%), LUAD 18/52 (35%) | I–II 25/52 (48%), III–IV 27/52 (52%) | Unmatched healthy controls | Training | 52 | 26 | Histopathology or cytology |
| Vinayanuwattikun, 2011 [36] | Other: Asian country | Case-control study | Retrospectively selected cases | NSCLC, not further described | The whole cohort was described as ‘advanced’. | Matched on certain characteristics | Training | 38 | 52 | Tumor tissue biopsy/histopathology |
| Balgkouranidou, 2014 A [37] | EU | Case-control study | Retrospectively selected cases | LUSC 23/44 # (52%), LUAD 20/44 (45%), missing 1/44 (2%) | I 14/44 # (32%), II–III 29/44 (66%), missing 1/44 (2%) | Unmatched healthy controls | Training | 48 | 24 (same used for training and validation) | Histopathology or cytology |
| LUSC 24/74 (32%), non-squamous 50/74 (68%) | IV 74/74 (100%) | Validation | 74 | 24 (same used for training and validation) | ||||||
| Powrozek, 2014 [38] | EU | Case-control study | Retrospectively selected cases | LUSC 20/70 (29%), LUAD 20/70 (29%), SCLC 23/70 (33%), other 7/70 (10%) | I 0/47 € (0%), II 7/47 (15%), III 23/47 (49%), IV 17/47 (36%) | Matched on certain characteristics | Training | 70 | 100 | Not described |
| Gao, 2015 [39] | China | Cohort study | Diagnostic work-up for LC | LUSC 23/58 (40%), LUAD 18/58 (31%), SCLC 2/58 (3%), other 15/58 (26%) | All were early-stage lung cancer (T1a–T2a) | Non-cancer participants who underwent diagnostic work-up | Training | 58 plasma 40 serum | 31 with benign disease, 23 healthy | Histopathology or cytology |
| Balgkouranidou, 2016 B [22] | EU | Case-control study | Retrospectively selected cases | LUSC 21/44 # (48%), LUAD 22/44 (50%), missing 1/44 (2%) | I 14/44 # (32%), II–III 29/44 (66%), missing 1/44 (2%) | Unmatched healthy controls | Training | 48 | 49 (same used for training and validation) | Tumor tissue biopsy/histopathology |
| LUSC 24/74 (32%), non-squamous 50/74 (68%) | IV 74/74 (100%) | Validation | 74 | 49 (same used for training and validation) | ||||||
| Powrozek, 2016 [40] | EU | Case-control study | Retrospectively selected cases | LUSC 20/65 (31%), LUAD 22/65 (34%), SCLC 19/65 (29%), other 4/65 (6%) | I 0/46 (0%), II 7/46 (15%), III 22/46 (48%), IV 17/46 (37%), limited 9/19 (47%), extensive 10/19 (53%) | Unmatched healthy controls | Training | 65 | 95 | Tumor tissue biopsy/histopathology |
| Powrozek, 2016 [41] | EU | Case-control study | Retrospectively selected cases | LUSC 30/70 (43%), LUAD 25/70 (36%), SCLC 15 (21%) | I 8/55 # (15%), II 12/55 (22%), III 19/55 (35%), IV 16/55 (29%) | Unmatched healthy controls | Training | 70 | 80 | Surgery specimen/histopathology |
| Aslam, 2017 [42] | Other: Asian country | Case-control study | Retrospectively selected cases | LUSC 19/34 (56%), LUAD 7/34 (21%), other 8/34 (24%) | Not reported | Matched on certain characteristics | Training | 34 | 34 | Tumor tissue biopsy/histopathology |
| Hulbert, 2017 [43] | Northern America | Cohort study | Diagnostic work-up for LC | LUSC 26/150 (17%), LUAD 121/150 (81%), other 3/150 (2%) | I 136/150 (91%), II 14/150 (9%), III 0/150 (0%), IV 0/150 (0%) | Non-cancer participants who underwent diagnostic work-up | Training | 125 | 50 | Surgery specimen/histopathology |
| Ooki, 2017 [44] | Northern America | Case-control study | Retrospectively selected cases | LUAD 43/43 (100%) | I 43/43 (100%) | Matched on certain characteristics | Training | 43 LUAD | 42 (same used for training and validation) | Histopathology or cytology |
| LUSC 40/40 (100%) | I 40/40 (100%) | Validation | 40 LUSC | 42 (same used for training and validation) | ||||||
| Nunes, 2019 [45] | EU | Case-control study | Retrospectively selected cases | LUSC 42/129 (33%), LUAD 65/129 (50%), SCLC 19/129 (15%), other 3/129 (2%) | I 15/129, II 11/129, III 27/129, IV 76/129 | Non-cancer participants who underwent diagnostic work-up | Training | 129 | 28 | Histopathology or cytology |
| Villalba, 2019 [46] | EU | Case-control study | Retrospectively selected cases | LUSC 38/89 (43%), LUAD 51/89 (57%) | I 8/89 (9%), II 8/89 (9%), III 19/89 (21%), IV 52/89 (58%), missing 2/89 (2%) | Matched on certain characteristics | Training | 89 | 25 | Surgery specimen/histopathology |
| Yang, 2019 [31] | China | Cohort study | Diagnostic work-up for LC | LUSC 12/39 (31%), LUAD 25/39 (64%), other 2/39 (5%) | I 39/39 (100%) | Non-cancer participants who underwent diagnostic work-up | Training | 39 | 11 | Surgery specimen/histopathology |
| Chen, 2020 [47] | China | Cohort study | Diagnostic work-up for LC | LUSC 22/163 (13%), LUAD 139/163 (85%), other 2/163 (1%) | I 163/163 (100%) | Non-cancer participants who underwent diagnostic work-up | Training | 163 | 83 | Surgery specimen/histopathology |
| Huang, 2020 [48] | China | Cohort study | Diagnostic work-up for LC | LUSC 15/104 (14%), LUAD 53/104 (51%), SCLC 3/104 (3%), other 1/104 (1%), missing 32/104 (31%) | I 48/104 (46%), II 15/104 (14%), III 20/104 (19%), IV 21/104 (20%) | Unmatched patients with benign diseases | Training | 104 | 36 with benign disease, 50 healthy | Surgery specimen/histopathology |
| LUSC 4/19 (21%), LUAD 14/19 (74%), other 1/19 (5%) | I 12/19 (63%), II 4/19 (21%), III 3/19 (16%) | Validation | 19 | 11 | ||||||
| Li, 2020 [49] | China | Case-control study | Retrospectively selected cases | LUSC 24/48 (50%), LUAD 18/48 (38%), other 6/48 (13%) | I–II 15/48 (31%), III–IV 33/48 (69%) | Unmatched healthy controls | Training | 48 | 51 | Histopathology or cytology |
| Wen, 2020 [50] | EU | Case-control study | Retrospectively selected cases | LUAD 48/48 (100%) | III 3/48 (6%), IV 45/48 (94%) | Unmatched healthy controls | Training | 48 | 100 | Histopathology or cytology |
| Xu, 2020 [51] | China | Case-control study | Retrospectively selected cases | LUSC 28/302 (9%), LUAD 236/302 (78%), SCLC 32/302 (11%), other 6/302 (2%) | I 68/302 (23%), II 62/302 (21%), III 72/302 (24%), IV 100/302 (33%) | Matched on certain characteristics | Training | 302 | 153 | Not described |
| Mastoraki, 2021 [52] | EU | Case-control study | Retrospectively selected cases | LUSC 19/48 (40%), LUAD 28/48 (58%), other 1/48 (2%) | I–II 28/48 (58%), III–IV 13/48 (27%), missing 7/48 (15%) | Matched on certain characteristics | Training | 48 early stage | 60 (same used for training and validation) | Histopathology or cytology |
| Not available | IV 91/91 (100%) | Validation | 91 stage IV | 60 (same used for training and validation) | ||||||
| Park, 2021 [53] | Other: Asian country | Case-control study | Retrospectively selected cases | Not available | Not available | Unmatched healthy controls | Training | 64 | 64 | Tumor tissue biopsy/histopathology |
| Szczyrek, 2021 [54] | EU | Case-control study | Diagnostic work-up for LC | LUSC 34/101 (34%), LUAD 52/101 (51%), SCLC 8/101 (8%), other 7/101 (7%) | IA–IIIA 27/101 (27%), IIIB–IV 66/101 (65%), missing 8/101 (8%) | Unmatched healthy controls | Training | 101 | 45 | Tumor tissue biopsy/histopathology |
| Kim, 2022 [55] | Other: Asian country | Case-control study | Diagnostic work-up for LC | LUSC 30/72 (42%), LUAD 31/72 (43%), other 11/72 (15%) | I 41/72 (57%), II 26/72 (36%), III 3/72 (4%), IV 2/72 (3%) | Unmatched patients with benign diseases | Training | 72 | 61 | Surgery specimen/histopathology |
| Palanca-Ballester, 2022 [56] | EU | Case-control study | Retrospectively selected cases | LUSC 13/44 (30%), LUAD 31/44 (70%) | I 4/44 (9%), II 7/44 (16%), III 3/44 (7%), IV 30/44 (68%) | Unmatched patients with benign diseases | Training | 44 | 39 | Other: Histopathology or cytology |
| Vo, 2022 [57] | Other: Asian country | Case-control study | Retrospectively selected cases | Not available | I 2/30 (7%), II 8/30 (27%), III 15/30 (50%), IV 5/30 (17%) | Unmatched healthy controls | Training | 30 | 27 | Other: Histopathology or cytology. |
| Zeng, 2022 [58] | China | Case-control study | Retrospectively selected cases | LUSC 58/121 (48%), LUAD 63/121 (52%) | I–II 78/121 (64%), III–IV 43/121 (36%) | Unmatched patients with benign diseases | Training | 121 | 121 | Surgery specimen/histopathology |
| Zhang, 2022 [59] | China | Case-control study | Retrospectively selected cases | LUSC 8/23 (35%), LUAD 10/23 (43%), SCLC 5/23 (22%) | I–II 2/23 (9%), III–IV 21/23 (91%) | Unmatched patients with benign diseases | Training | 23 | 56 | Histopathology or cytology |
| Study ID | Sample Type | Analysis Method | Assay Type | How Was the Cut-Off Determined? |
|---|---|---|---|---|
| Usadel, 2002 [32] | Plasma; Serum | QMSP | Single gene | Not reported |
| Ostrow, 2009 [30] | Plasma | QMSP | Single gene | Defined by a training cohort and validated in an independent cohort |
| Zhang, 2010 A [33] | Plasma | QMSP | Single gene | Not reported |
| Zhang, 2010 B [34] | Plasma | QMSP | Single gene | Not reported |
| Begum, 2011 [35] | Plasma; Serum | QMSP | Single gene | Defined by a training cohort and validated in an independent cohort |
| Kneip, 2011 [29] | Plasma | QMSP | Single gene | Defined by a training cohort and validated in an independent cohort |
| Ponomaryova, 2011 [23] | Plasma | QMSP | Single gene | Defined by a training cohort |
| Vinayanuwattikun, 2011 [36] | Plasma | QMSP | Single gene | Defined by a training cohort |
| Balgkouranidou, 2014 A [37] | Plasma | QMSP | Single gene | Not reported |
| Powrozek, 2014 [38] | Plasma | QMSP | Single gene | Defined in a previous study |
| Gao, 2015 [39] | Plasma; Serum | QMSP | Multiplex | Defined by a training cohort |
| Balgkouranidou, 2016 B [22] | Plasma | QMSP | Single gene | Not reported |
| Powrozek, 2016 [40] | Plasma | QMSP | Single gene | Defined by a training cohort |
| Powrozek, 2016 [41] | Plasma | QMSP | Single gene | Not reported |
| Aslam, 2017 [42] | Plasma | QMSP | Single gene | Not reported |
| Hulbert, 2017 [43] | Plasma | QMSP | Single gene | Defined by a training cohort |
| Ooki, 2017 [44] | Serum | QMSP | Single gene | Defined by a training cohort and validated in an independent cohort |
| Nunes, 2019 [45] | Plasma | QMSP | Multiplex | Defined by a training cohort and validated in an independent cohort |
| Villalba, 2019 [46] | Plasma | Digital PCR | Single gene | Defined by a training cohort |
| Yang, 2019 [31] | Plasma | QMSP | Single gene | Defined by a training cohort |
| Chen, 2020 [47] | Plasma | QMSP | Single gene | Defined by a training cohort |
| Huang, 2020 [48] | Plasma | QMSP | Not described | Defined by a training cohort and validated in an independent cohort |
| Li, 2020 [49] | Plasma | PCR-SERS | Single gene | Defined by a training cohort |
| Wen, 2020 [50] | Plasma | Digital PCR | Single gene | Defined by a training cohort |
| Xu, 2020 [51] | Plasma | QMSP | Multiplex | Arbitrarily set at 90% specificity for both markers. |
| Mastoraki, 2021 [52] | Plasma | QMSP | Single gene | Defined by a training cohort and validated in an independent cohort |
| Park, 2021 [53] | Plasma | QMSP | Single gene | Defined by a training cohort |
| Szczyrek, 2021 [54] | Plasma | QMSP | Single gene | Defined by a training cohort |
| Kim, 2022 [55] | Plasma | Pyrosequencing | Single gene | Defined by a training cohort and validated in an independent cohort |
| Palanca-Ballester, 2022 [56] | Plasma | Digital PCR | Single gene | Defined by a training cohort |
| Vo, 2022 [57] | Plasma | QMSP | Single gene | Defined by a training cohort |
| Zeng, 2022 [58] | Plasma | QMSP | Single gene | Defined by a training cohort |
| Zhang, 2022 [59] | Plasma or serum | Pyrosequencing | Single gene | Not reported |
Disclaimer/Publisher’s Note: The statements, opinions and data contained in all publications are solely those of the individual author(s) and contributor(s) and not of MDPI and/or the editor(s). MDPI and/or the editor(s) disclaim responsibility for any injury to people or property resulting from any ideas, methods, instructions or products referred to in the content. |
© 2023 by the authors. Licensee MDPI, Basel, Switzerland. This article is an open access article distributed under the terms and conditions of the Creative Commons Attribution (CC BY) license (https://creativecommons.org/licenses/by/4.0/).
Share and Cite
Borg, M.; Wen, S.W.C.; Andersen, R.F.; Timm, S.; Hansen, T.F.; Hilberg, O. Methylated Circulating Tumor DNA in Blood as a Tool for Diagnosing Lung Cancer: A Systematic Review and Meta-Analysis. Cancers 2023, 15, 3959. https://doi.org/10.3390/cancers15153959
Borg M, Wen SWC, Andersen RF, Timm S, Hansen TF, Hilberg O. Methylated Circulating Tumor DNA in Blood as a Tool for Diagnosing Lung Cancer: A Systematic Review and Meta-Analysis. Cancers. 2023; 15(15):3959. https://doi.org/10.3390/cancers15153959
Chicago/Turabian StyleBorg, Morten, Sara Witting Christensen Wen, Rikke Fredslund Andersen, Signe Timm, Torben Frøstrup Hansen, and Ole Hilberg. 2023. "Methylated Circulating Tumor DNA in Blood as a Tool for Diagnosing Lung Cancer: A Systematic Review and Meta-Analysis" Cancers 15, no. 15: 3959. https://doi.org/10.3390/cancers15153959