Agent-Based Modeling of Virtual Tumors Reveals the Critical Influence of Microenvironmental Complexity on Immunotherapy Efficacy
Abstract
:Simple Summary
Abstract
1. Introduction
2. Materials and Methods
2.1. Computational Models
2.2. Description of Experiments
2.3. Estimation of Model Parameters and Construction of Virtual Tumors
3. Results
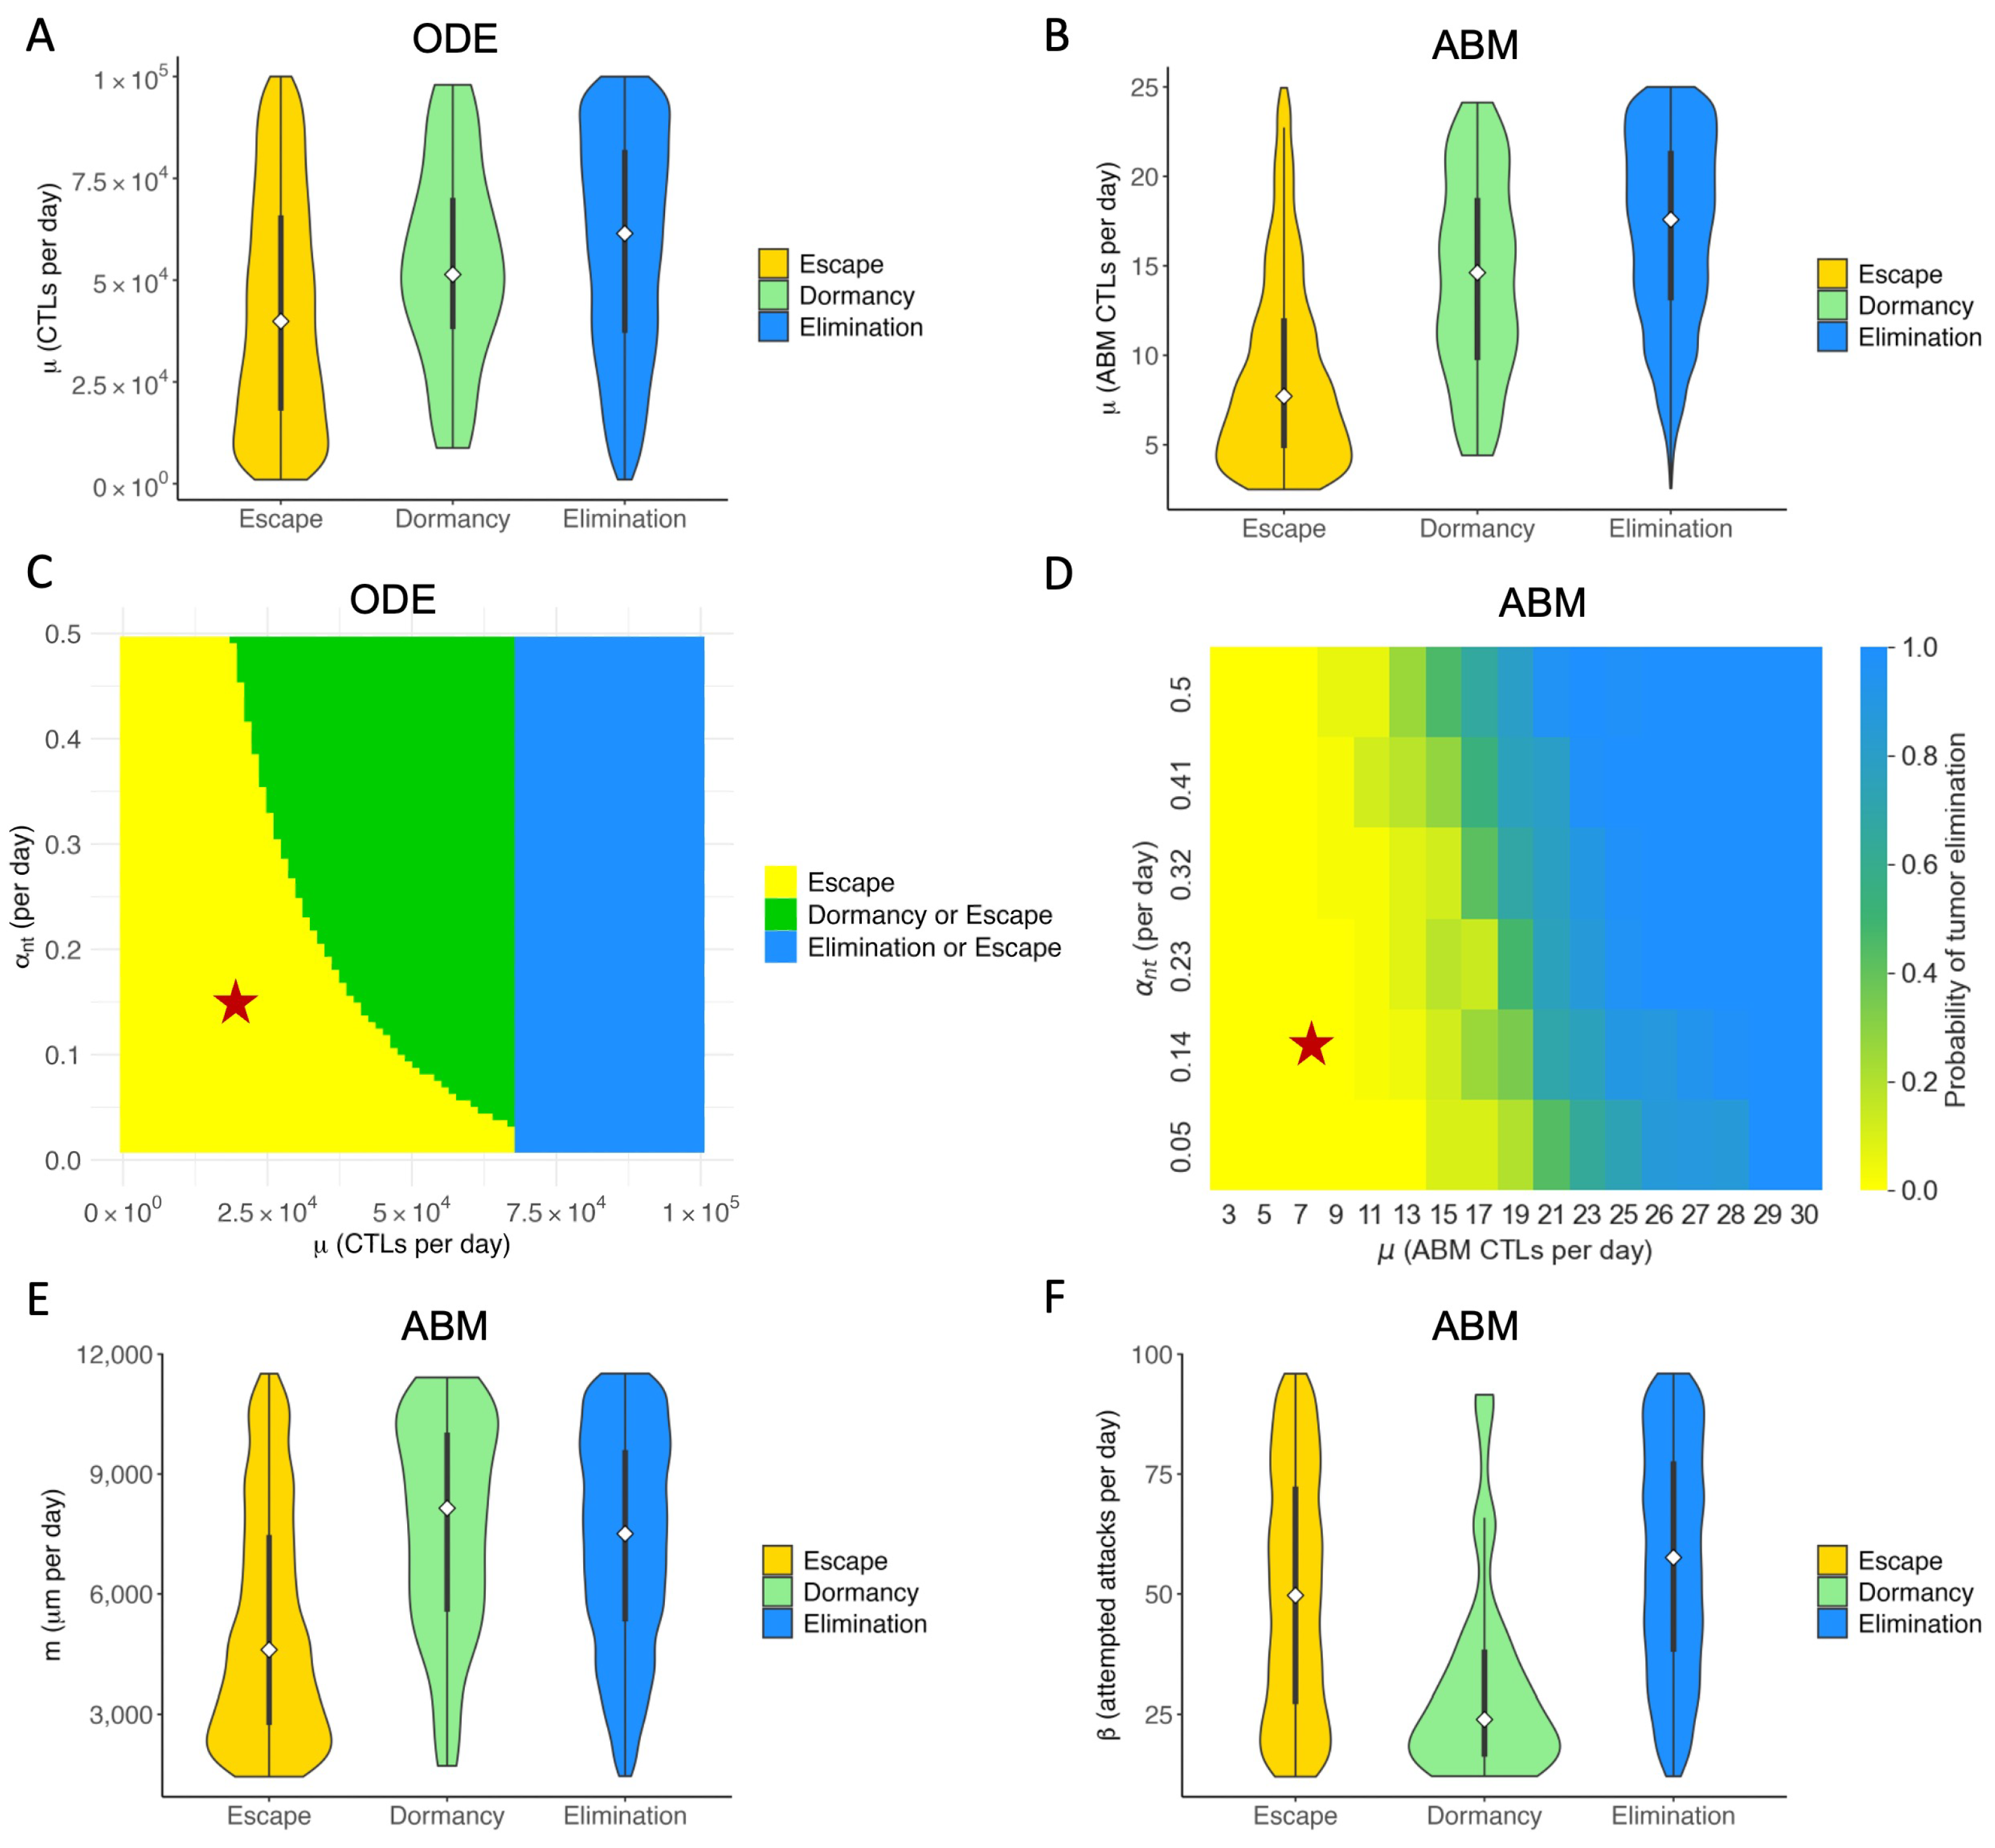
3.1. Immunotherapy Efficacy Widely Varies in Virtual Cohort with Indistinguishable Pretreatment Tumor Growth Patterns
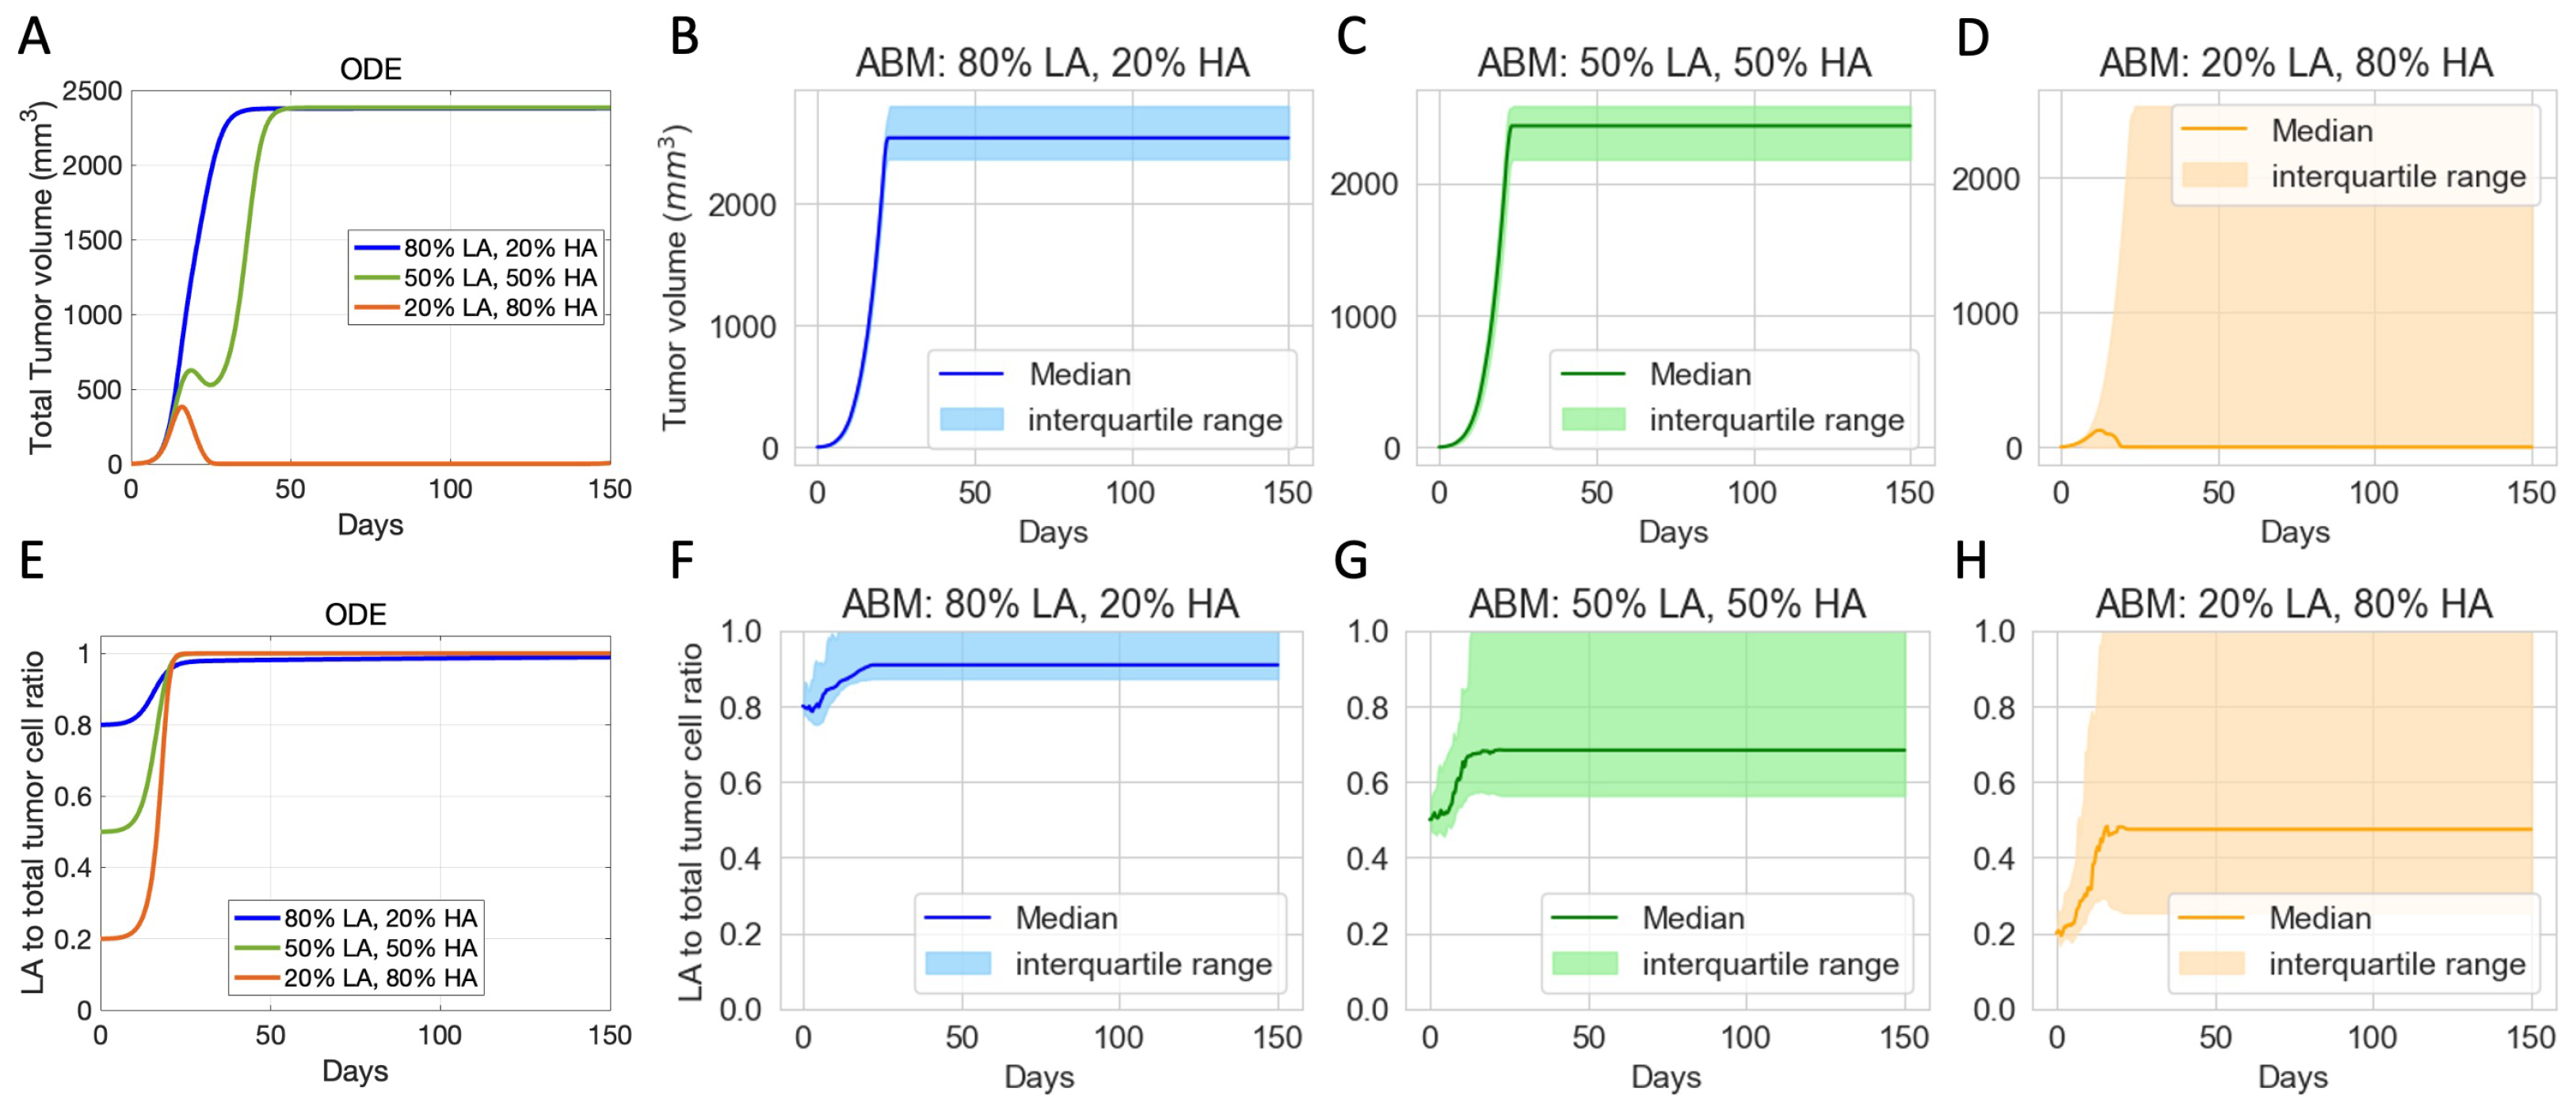
3.2. Initial Phenotypic Composition Dictates Composition and Volume of Tumor after Checkpoint Blockade Therapy
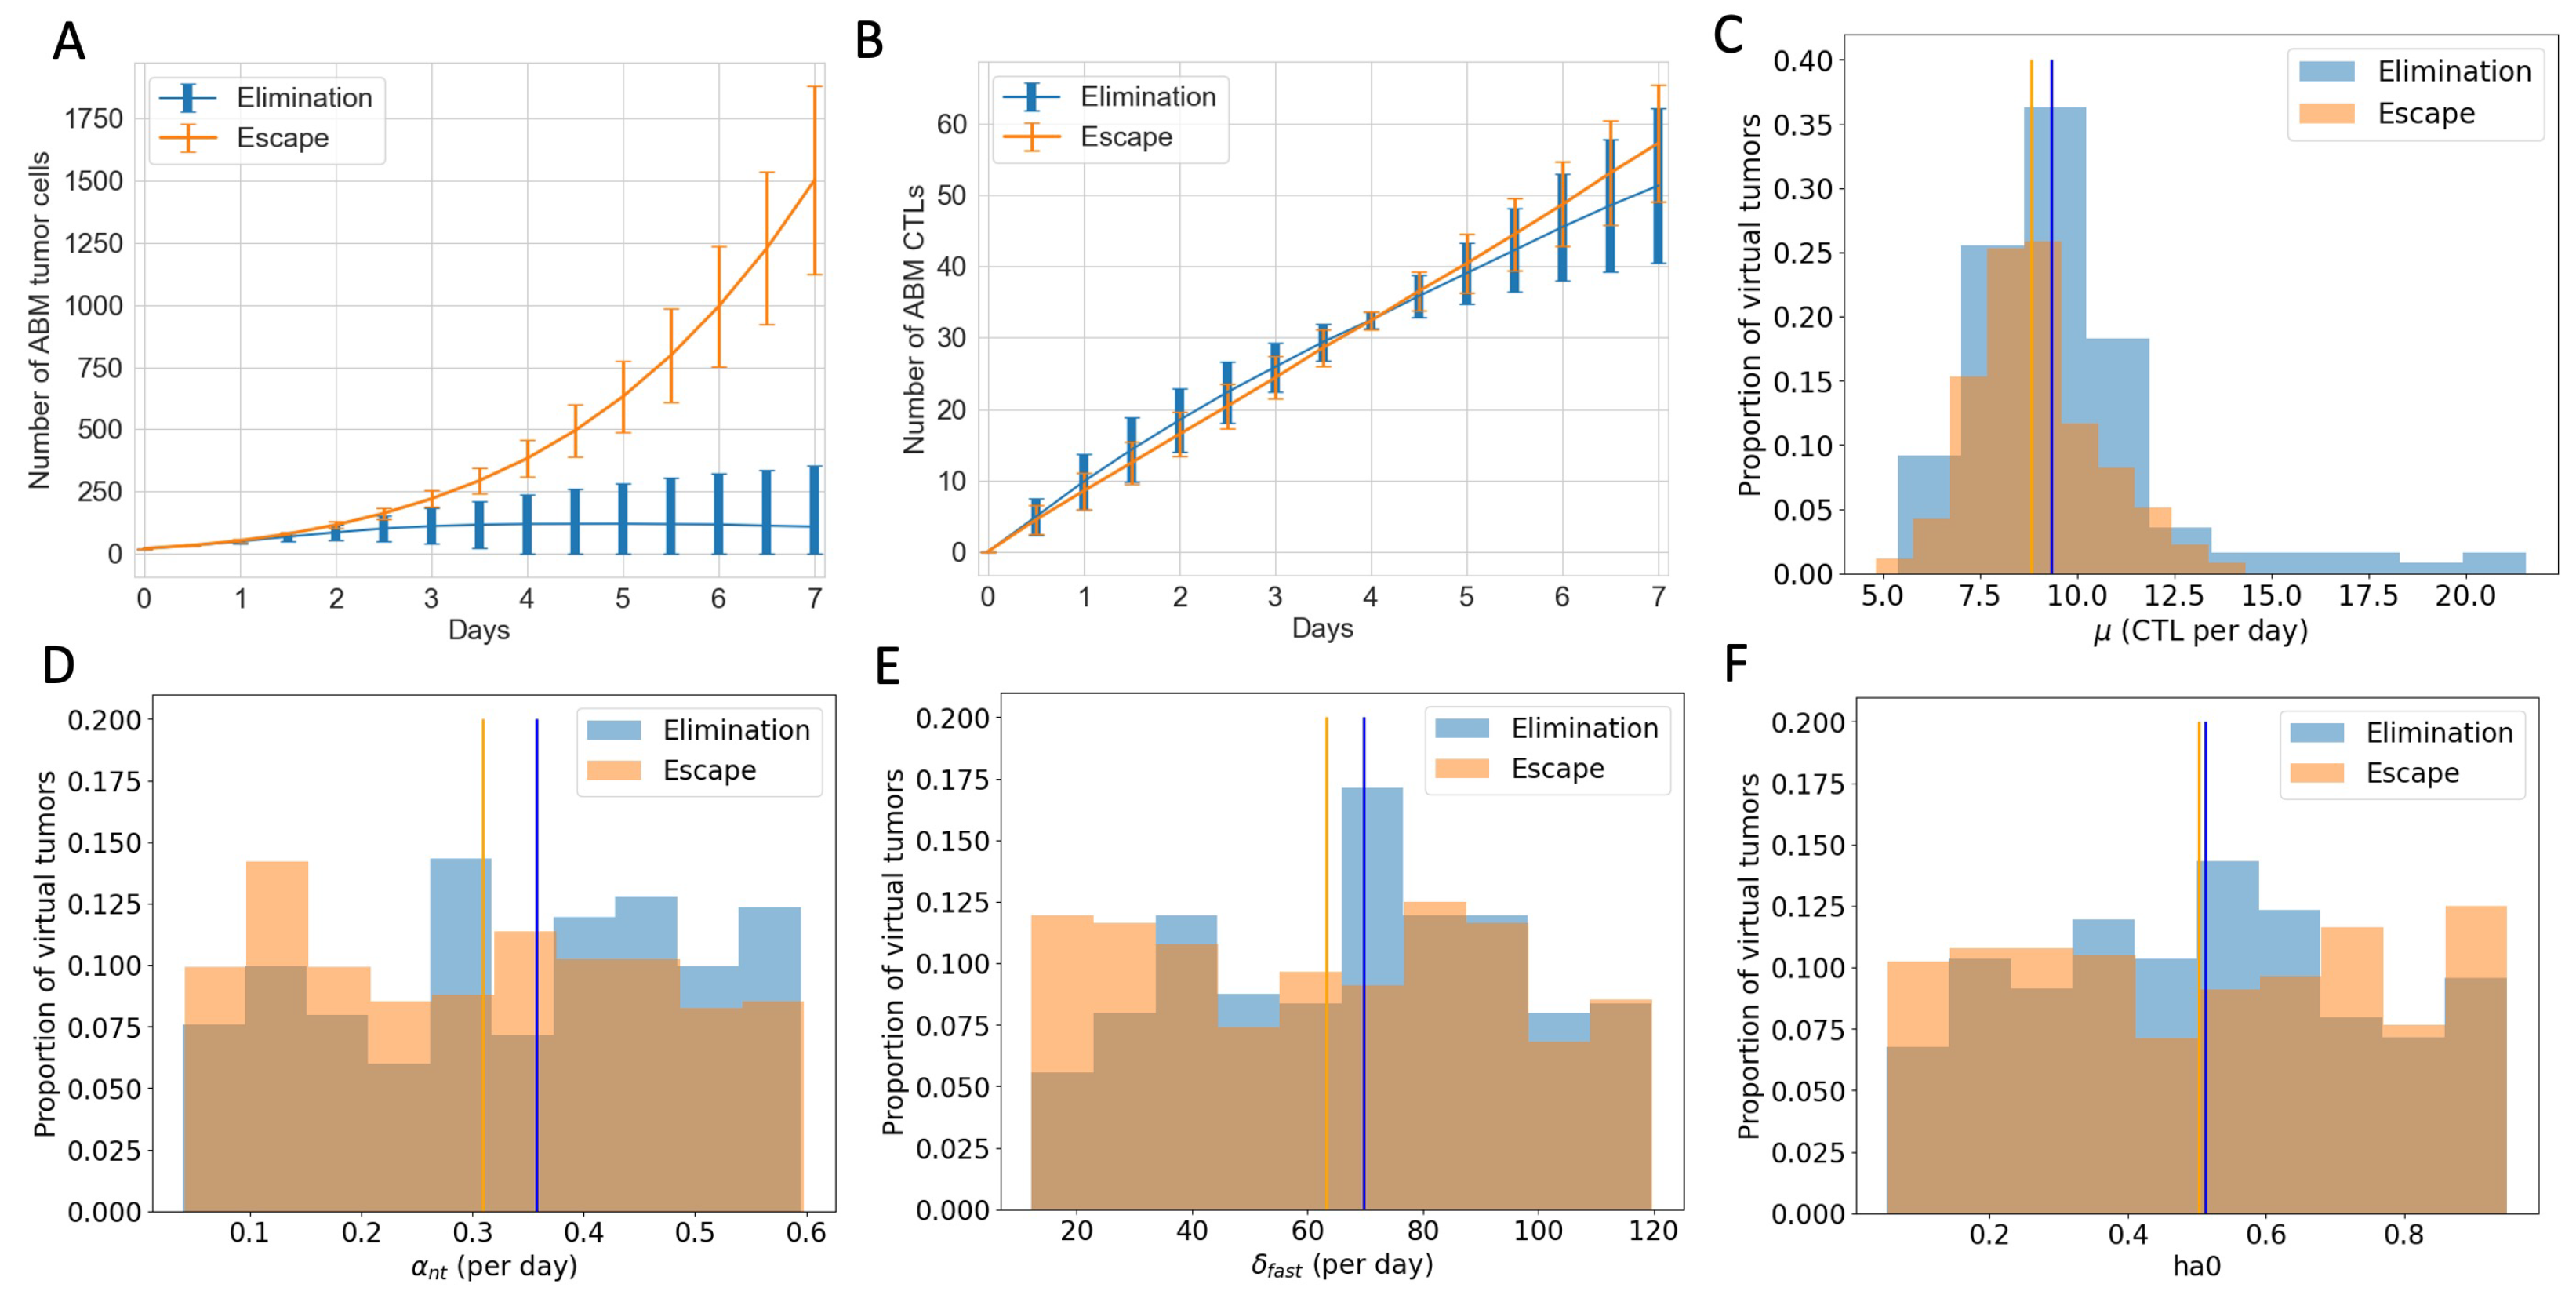
3.3. Therapeutic Outcomes Are Correlated with Key Immune Parameters
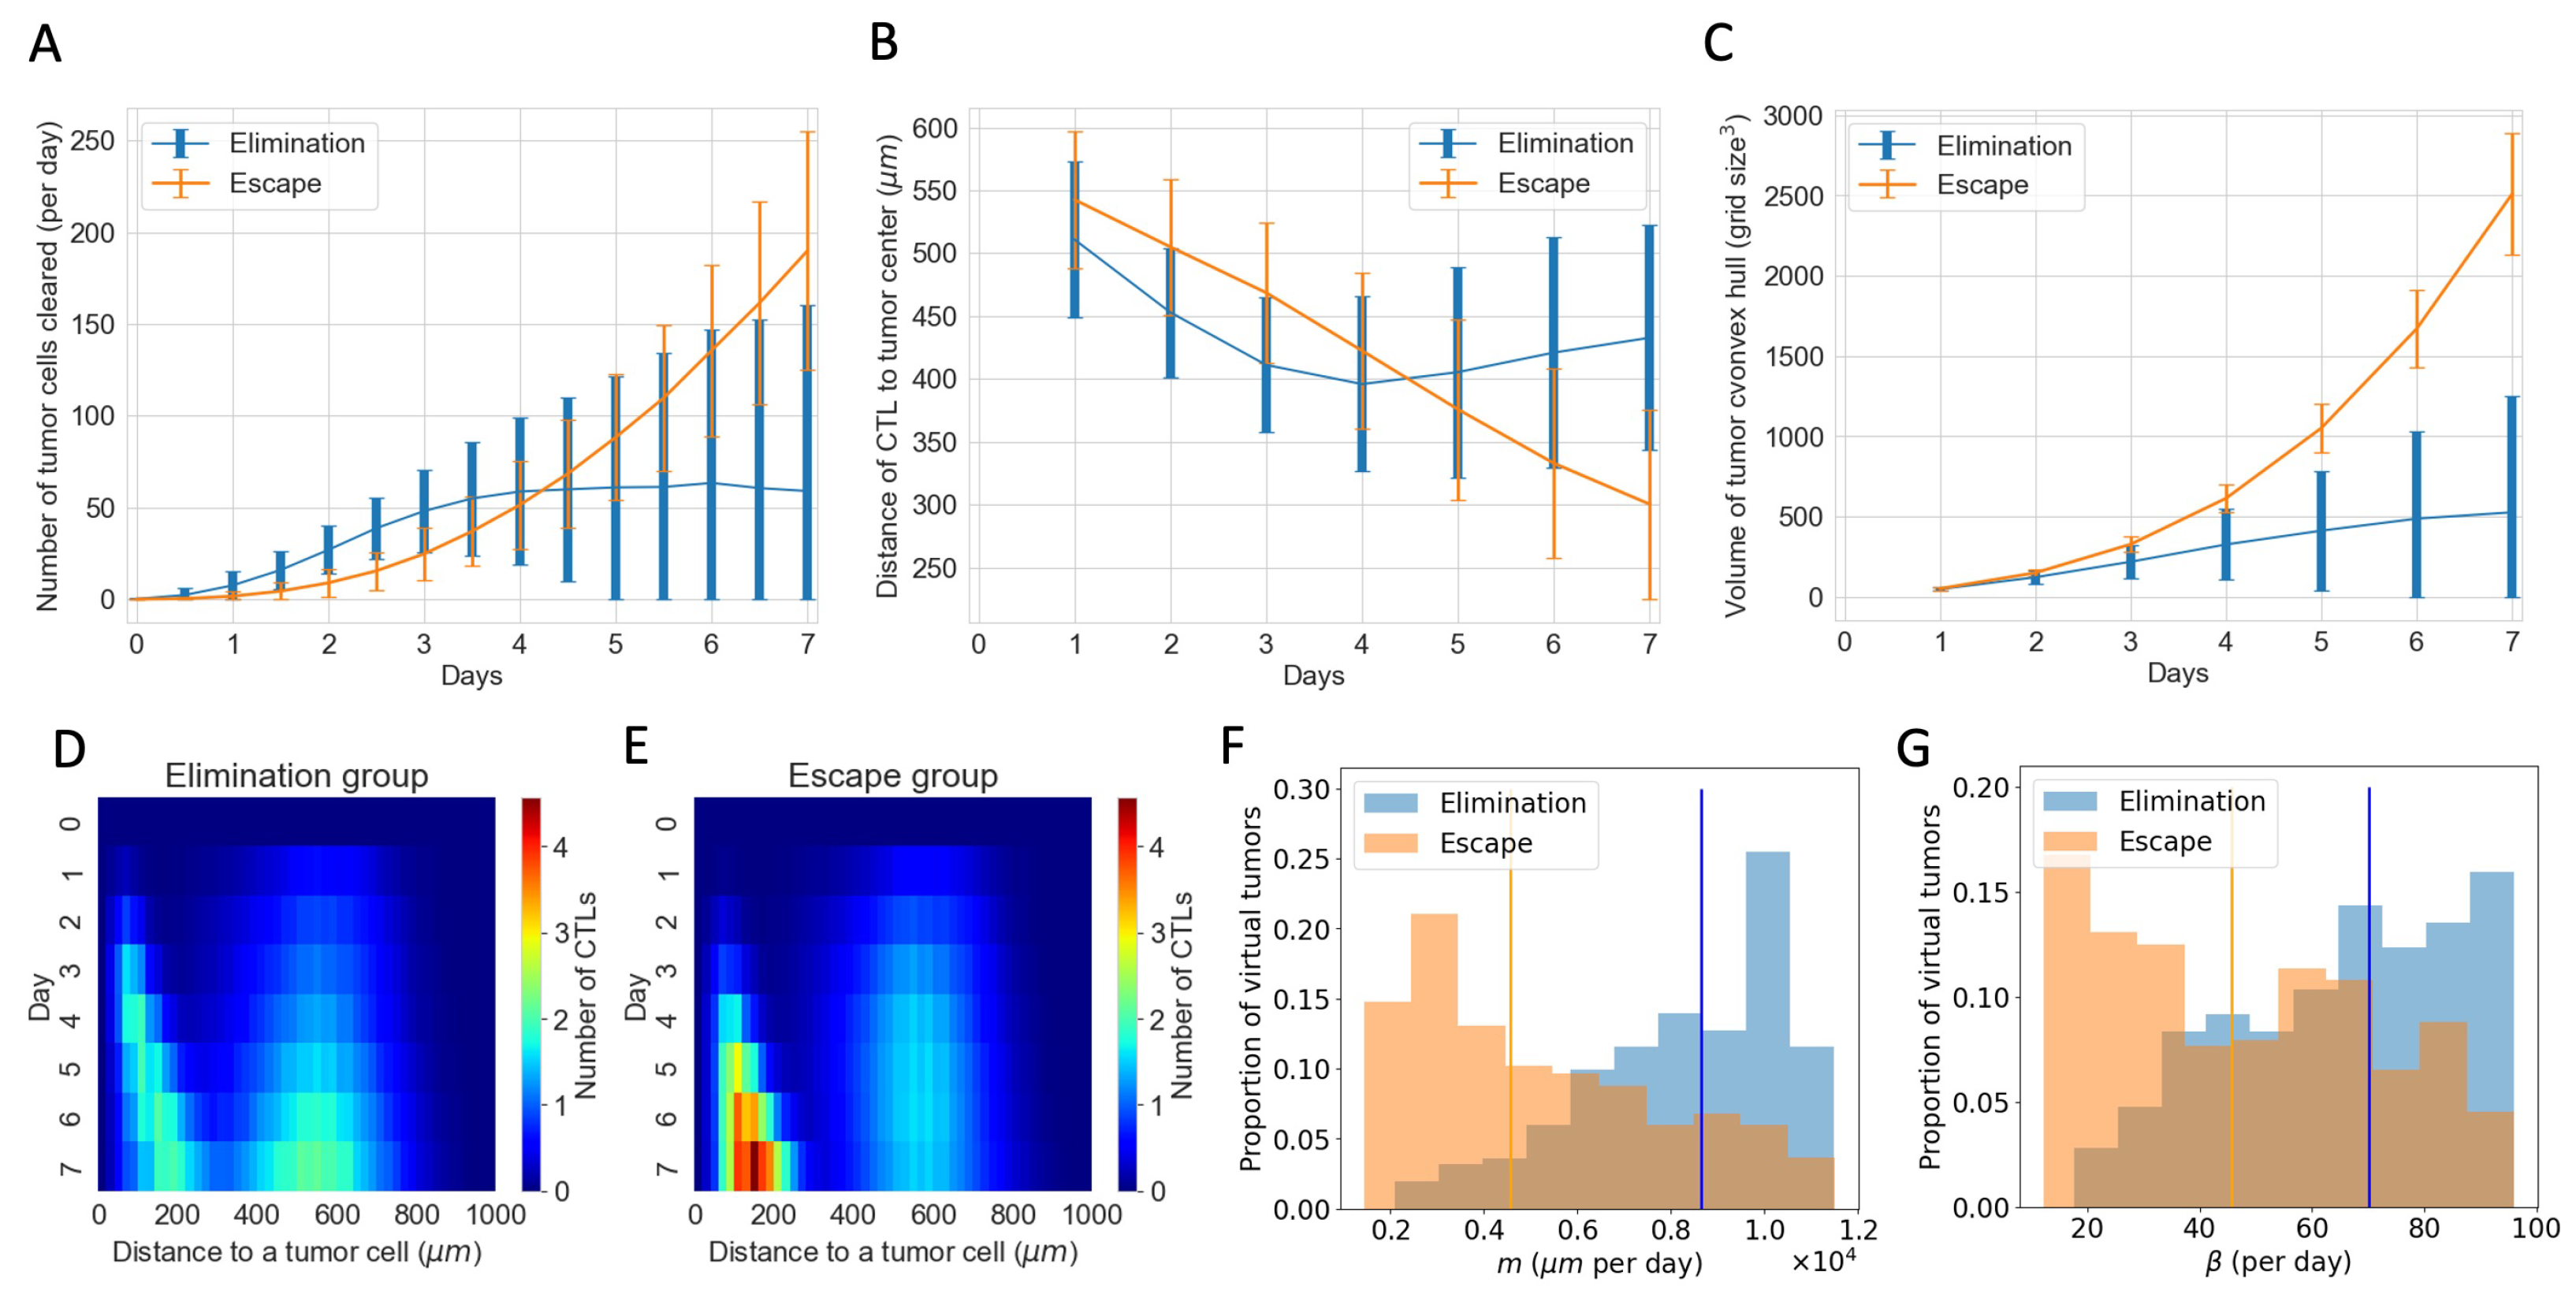
3.4. ABM Reveals Spatial and Phenotypic Heterogeneity Despite Similar Temporal Tumor and Immune Growth Patterns
4. Discussion
5. Conclusions
Author Contributions
Funding
Institutional Review Board Statement
Informed Consent Statement
Data Availability Statement
Acknowledgments
Conflicts of Interest
Abbreviations
| ABM | agent-based model |
| CTL | cytotoxic T lymphocyte |
| FDA | US Food & Drug Administration |
| FasL | Fas ligand |
| FGFR3 | fibroblast growth factor receptor 3 |
| HA | high antigen |
| ICI | immune checkpoint inhibitor |
| IL-2 | interleukin-2 |
| ISF | immune stimulatory factor |
| LA | low antigen |
| ODE | ordinary differential equation |
| PD-1 | programmed cell death protein 1 |
| PD-L1 | programmed death-ligand 1 |
| TME | tumor microenvironment |
Appendix A

Appendix B
| Name | Description | Value (s) | Source/Notes |
|---|---|---|---|
| Tumor Cell Parameters | |||
| proliferation rate | d−1 | Calibrated | |
| Maximum number of occupied neighbors that still allows tumor cell proliferation (out of 26) | 20 | Calibrated | |
| Apoptosis rate | d−1 | Estimated [33] | |
| Maximum total number of tumor cells allowed | 60,000 | Assumed | |
| Maximum number of tumor cells allowed to touch the boundary | 36 | Assumed | |
| Immune Cell Parameters | |||
| Tumor-induced recruitment to TME | 8 d−1 | Calibrated | |
| Base proliferation rate | 0 d−1 | Assumed | |
| Max ISF-stimulated CTL proliferation rate | d−1 | [25,27,42] | |
| Apoptosis rate | d−1 | [25,27] | |
| Immune cell conjugation rate | 28.8 d−1 | [33,43] | |
| m | Movement rate | 2880 d−1 | Estimated [33] |
| Number of consecutive movement steps attempted when an immune cell moves | 4 | Estimated [33] | |
| CTL exhaustion rate | 0.01 d−1 | Estimated | |
| Immune Stimulatory Factor Parameters | |||
| ISF expression by LA tumor cells compared to HA tumor cells | 0.5 | Assumed [33] | |
| EC50 for ISF stimulation of CTL proliferation | 10 | Assumed | |
| Hill coefficient for ISF stimulation of CTL proliferation | 2 | Estimated [33] | |
| Factor determining maximal possible increase to immune proliferation due to ISF | 2.5 | Estimated [33] | |
| EC50 for magnitude of ISF gradient affecting immune cell movement along gradient | 2 | Estimated [33] | |
| Hill coefficient for magnitude of ISF gradient affecting immune cell movement along gradient | 2 | Estimated [33] | |
| Maximum reach of ISF from one tumor cell in any one direction | 5 | Estimated [33] | |
| Cell-kill Parameters | |||
| Slow-killing rate | 12 d−1 | [21] | |
| Fast-killing rate | 48 d−1 | [21] | |
| Probability of HA tumor cell death via fast killing | 0.92 | Assumed [32] | |
| Probability of HA tumor cell death via fast killing | 0.33 | Assumed [32] | |
| PD-1/PD-L1 Parameters | |||
| Concentration of PD-1 on CTLs | [55] | ||
| Association rate of PD-1-PD-L1 reaction | 100 nM−1 d−1 | [56] | |
| Dissociation rate of PD-1-PD-L1 reaction | d−1 | [56] | |
| EC50 of PD-1-PD-L1 complex effects on immune cells | Computed [33] | ||
| Miscellaneous Parameters | |||
| Tumor update duration | 15 | Chosen | |
| Immune update duration | Chosen | ||
| Length of time in during which cells cannot proliferate | 9 | [57] | |
| h | Distance between adjacent voxels | 20 | One cell width [33] |
| Maximum number of occupied neighbors that still allows immune cell proliferation (out of 26) | 22 | Assumption [33] | |
| Maximum number of occupied neighbors that still allows movement (out of 26) | 25 | Assumption [33] | |
| Name | Description | Value (Baseline) | Units | Source |
|---|---|---|---|---|
| Proliferation rate of high antigen tumor cells | 0.498 | per day | Calibrated | |
| Proliferation rate of low antigen tumor cells | 0.498 | per day | Calibrated | |
| K | Carrying capacity for tumor cells | # of cells | Calibrated | |
| Maximum CTL-induced death rate of high antigen tumor cells via the slow killing mechanism | 1–12 (4) | per day | Estimated ([58]) | |
| Maximum CTL-induced death rate of low antigen tumor cells via the slow killing mechanism | 1–12 (4) | per day | Estimated ([58]) | |
| CTL-induced death rate of high antigen tumor cells via the fast-killing mechanism | to | per cell per day | Estimated ([42]) | |
| CTL-induced death rate of low antigen tumor cells via the fast-killing mechanism | to | per cell per day | Estimated ([42]) | |
| Activation and recruitment rate of T cells | to () | # per day | Estimated | |
| Probability of high antigen tumor cells death via the fast-killing mechanism | 0 to 1 (0.92) | dimensionless | Estimated | |
| Probability of low antigen tumor cells death via the fast-killing mechanism | 0 to 1 (0.33) | dimensionless | Estimated | |
| Maximum rate of CTL proliferation activated by N cells | 0 to 0.5 (0.15) | per day | Estimated | |
| Maximum rate of CTL proliferation activated by M cells | 0 to 0.5 (0.15) | per day | Estimated |
References
- Ingham-Dempster, T.; Walker, D.C.; Corfe, B.M. An agent-based model of anoikis in the colon crypt displays novel emergent behaviour consistent with biological observations. R. Soc. Open Sci. 2017, 4, 160858. [Google Scholar] [CrossRef] [PubMed]
- Browning, A.P.; Lewin, T.D.; Baker, R.E.; Maini, P.K.; Moros, E.G.; Caudell, J.; Byrne, H.M.; Enderling, H. Predicting radiotherapy patient outcomes with real-time clinical data using mathematical modelling. Bull. Math. Biol. 2024, 86, 19. [Google Scholar]
- Zhang, J.; Cunningham, J.J.; Brown, J.S.; Gatenby, R.A. Integrating evolutionary dynamics into treatment of metastatic castrate-resistant prostate cancer. Nat. Commun. 2017, 8, 1816. [Google Scholar] [CrossRef]
- Elassaiss-Schaap, J.; Rossenu, S.; Lindauer, A.; Kang, S.; De Greef, R.; Sachs, J.; De Alwis, D. Using model-based “learn and confirm” to reveal the pharmacokinetics-pharmacodynamics relationship of pembrolizumab in the KEYNOTE-001 Trial. CPT Pharmacometrics Syst. Pharmacol. 2017, 6, 21–28. [Google Scholar] [CrossRef] [PubMed]
- Billan, S.; Kaidar-Person, O.; Gil, Z. Treatment after progression in the era of immunotherapy. Lancet Oncol. 2020, 21, e463–e476. [Google Scholar] [CrossRef] [PubMed]
- Zhang, Y.; Zhang, Z. The history and advances in cancer immunotherapy: Understanding the characteristics of tumor-infiltrating immune cells and their therapeutic implications. Cell. Mol. Immunol. 2020, 17, 807–821. [Google Scholar] [CrossRef] [PubMed]
- Tan, S.; Li, D.; Zhu, X. Cancer immunotherapy: Pros, cons and beyond. Biomed. Pharmacother. 2020, 124, 109821. [Google Scholar] [CrossRef]
- Hamdan, F.; Cerullo, V. Cancer immunotherapies: A hope for the uncurable? Front. Mol. Med. 2023, 3, 1140977. [Google Scholar] [CrossRef]
- Shields, C.W., IV; Wang, L.L.W.; Evans, M.A.; Mitragotri, S. Materials for immunotherapy. Adv. Mater. 2020, 32, 1901633. [Google Scholar] [CrossRef]
- He, X.; Xu, C. Immune checkpoint signaling and cancer immunotherapy. Cell Res. 2020, 30, 660–669. [Google Scholar] [CrossRef]
- Ma, W.; Xue, R.; Zhu, Z.; Farrukh, H.; Song, W.; Li, T.; Zheng, L.; Pan, C.x. Increasing cure rates of solid tumors by immune checkpoint inhibitors. Exp. Hematol. Oncol. 2023, 12, 10. [Google Scholar] [CrossRef]
- Tang, Q.; Zhao, S.; Zhou, N.; He, J.; Zu, L.; Liu, T.; Song, Z.; Chen, J.; Peng, L.; Xu, S. PD-1/PD-L1 immune checkpoint inhibitors in neoadjuvant therapy for solid tumors. Int. J. Oncol. 2023, 62, 1–30. [Google Scholar] [CrossRef]
- Sun, L.; Su, Y.; Jiao, A.; Wang, X.; Zhang, B. T cells in health and disease. Signal Transduct. Target. Ther. 2023, 8, 235. [Google Scholar]
- Raskov, H.; Orhan, A.; Christensen, J.P.; Gögenur, I. Cytotoxic CD8+ T cells in cancer and cancer immunotherapy. Br. J. Cancer 2021, 124, 359–367. [Google Scholar] [CrossRef]
- Gonzalez, H.; Hagerling, C.; Werb, Z. Roles of the immune system in cancer: From tumor initiation to metastatic progression. Genes Dev. 2018, 32, 1267–1284. [Google Scholar] [CrossRef]
- Parkin, J.; Cohen, B. An overview of the immune system. Lancet 2001, 357, 1777–1789. [Google Scholar] [CrossRef]
- Cassioli, C.; Baldari, C.T. The expanding arsenal of cytotoxic T cells. Front. Immunol. 2022, 13, 883010. [Google Scholar] [CrossRef]
- Liu, J.; Ye, Y.; Cai, L. Supramolecular attack particle: The way cytotoxic T lymphocytes kill target cells. Signal Transduct. Target. Ther. 2020, 5, 210. [Google Scholar] [CrossRef]
- Basu, R.; Whitlock, B.M.; Husson, J.; Le Floc’h, A.; Jin, W.; Oyler-Yaniv, A.; Dotiwala, F.; Giannone, G.; Hivroz, C.; Biais, N.; et al. Cytotoxic T cells use mechanical force to potentiate target cell killing. Cell 2016, 165, 100–110. [Google Scholar] [CrossRef]
- Weigelin, B.; Friedl, P. T cell-mediated additive cytotoxicity–death by multiple bullets. Trends Cancer 2022, 8, 980–987. [Google Scholar] [CrossRef]
- Hassin, D.; Garber, O.G.; Meiraz, A.; Schiffenbauer, Y.S.; Berke, G. Cytotoxic T lymphocyte perforin and Fas ligand working in concert even when Fas ligand lytic action is still not detectable. Immunology 2011, 133, 190–196. [Google Scholar] [CrossRef] [PubMed]
- Meiraz, A.; Garber, O.G.; Harari, S.; Hassin, D.; Berke, G. Switch from perforin-expressing to perforin-deficient CD8+ T cells accounts for two distinct types of effector cytotoxic T lymphocytes in vivo. Immunology 2009, 128, 69–82. [Google Scholar] [CrossRef]
- Vera, J.; Lischer, C.; Nenov, M.; Nikolov, S.; Lai, X.; Eberhardt, M. Mathematical modelling in biomedicine: A primer for the curious and the skeptic. Int. J. Mol. Sci. 2021, 22, 547. [Google Scholar] [CrossRef]
- Valentinuzzi, D.; Jeraj, R. Computational modelling of modern cancer immunotherapy. Phys. Med. Biol. 2020, 65, 24TR01. [Google Scholar] [CrossRef]
- Kuznetsov, V.A.; Makalkin, I.A.; Taylor, M.A.; Perelson, A.S. Nonlinear dynamics of immunogenic tumors: Parameter estimation and global bifurcation analysis. Bull. Math. Biol. 1994, 56, 295–321. [Google Scholar] [CrossRef]
- Komarova, N.L.; Wodarz, D. ODE models for oncolytic virus dynamics. J. Theor. Biol. 2010, 263, 530–543. [Google Scholar] [CrossRef] [PubMed]
- Nikolopoulou, E.; Johnson, L.; Harris, D.; Nagy, J.; Stites, E.; Kuang, Y. Tumour-immune dynamics with an immune checkpoint inhibitor. Lett. Biomath. 2018, 5, S137–S159. [Google Scholar] [CrossRef]
- Santos, G.; Nikolov, S.; Lai, X.; Eberhardt, M.; Dreyer, F.S.; Paul, S.; Schuler, G.; Vera, J. Model-based genotype-phenotype mapping used to investigate gene signatures of immune sensitivity and resistance in melanoma micrometastasis. Sci. Rep. 2016, 6, 24967. [Google Scholar] [CrossRef] [PubMed]
- Friedman, A.; Lai, X. Combination therapy for cancer with oncolytic virus and checkpoint inhibitor: A mathematical model. PLoS ONE 2018, 13, e0192449. [Google Scholar] [CrossRef]
- Benchaib, M.A.; Bouchnita, A.; Volpert, V.; Makhoute, A. Mathematical modeling reveals that the administration of EGF can promote the elimination of lymph node metastases by PD-1/PD-L1 blockade. Front. Bioeng. Biotechnol. 2019, 7, 104. [Google Scholar] [CrossRef]
- Norton, K.A.; Gong, C.; Jamalian, S.; Popel, A.S. Multiscale agent-based and hybrid modeling of the tumor immune microenvironment. Processes 2019, 7, 37. [Google Scholar] [CrossRef]
- Wang, Y.; Bergman, D.R.; Trujillo, E.; Pearson, A.T.; Sweis, R.F.; Jackson, T.L. Mathematical model predicts tumor control patterns induced by fast and slow cytotoxic T lymphocyte killing mechanisms. Sci. Rep. 2023, 13, 22541. [Google Scholar] [CrossRef] [PubMed]
- Bergman, D.R.; Wang, Y.; Trujillo, E.; Fernald, A.A.; Li, L.; Pearson, A.T.; Sweis, R.F.; Jackson, T.L. Dysregulated FGFR3 signaling alters the immune landscape in bladder cancer and presents therapeutic possibilities in an agent-based model. Front. Immunol. 2024, 15, 1358019. [Google Scholar] [CrossRef] [PubMed]
- Mendonsa, A.M.; Na, T.Y.; Gumbiner, B.M. E-cadherin in contact inhibition and cancer. Oncogene 2018, 37, 4769–4780. [Google Scholar] [CrossRef]
- McLane, L.M.; Abdel-Hakeem, M.S.; Wherry, E.J. CD8 T cell exhaustion during chronic viral infection and cancer. Annu. Rev. Immunol. 2019, 37, 457–495. [Google Scholar] [CrossRef] [PubMed]
- Budimir, N.; Thomas, G.D.; Dolina, J.S.; Salek-Ardakani, S. Reversing T-cell exhaustion in cancer: Lessons learned from PD-1/PD-L1 immune checkpoint blockade. Cancer Immunol. Res. 2022, 10, 146–153. [Google Scholar] [CrossRef]
- Murali, A.K.; Mehrotra, S. Apoptosis–an ubiquitous T cell immunomodulator. J. Clin. Cell. Immunol. 2011, S3, 2. [Google Scholar] [CrossRef]
- O’Donnell, J.S.; Teng, M.W.; Smyth, M.J. Cancer immunoediting and resistance to T cell-based immunotherapy. Nat. Rev. Clin. Oncol. 2019, 16, 151–167. [Google Scholar] [CrossRef]
- Dunn, G.P.; Old, L.J.; Schreiber, R.D. The three Es of cancer immunoediting. Annu. Rev. Immunol. 2004, 22, 329–360. [Google Scholar] [CrossRef]
- Del Monte, U. Does the cell number 109 still really fit one gram of tumor tissue? Cell Cycle 2009, 8, 505–506. [Google Scholar] [CrossRef]
- Jain, H.V.; Norton, K.A.; Prado, B.B.; Jackson, T.L. SMoRe ParS: A novel methodology for bridging modeling modalities and experimental data applied to 3D vascular tumor growth. Front. Mol. Biosci. 2022, 9, 1056461. [Google Scholar] [CrossRef] [PubMed]
- Okuneye, K.; Bergman, D.; Bloodworth, J.C.; Pearson, A.T.; Sweis, R.F.; Jackson, T.L. A validated mathematical model of FGFR3-mediated tumor growth reveals pathways to harness the benefits of combination targeted therapy and immunotherapy in bladder cancer. Comput. Syst. Oncol. 2021, 1, e1019. [Google Scholar] [CrossRef]
- Liadi, I.; Singh, H.; Romain, G.; Rey-Villamizar, N.; Merouane, A.; Adolacion, J.R.T.; Kebriaei, P.; Huls, H.; Qiu, P.; Roysam, B.; et al. Individual motile CD4+ T cells can participate in efficient multikilling through conjugation to multiple tumor cells. Cancer Immunol. Res. 2015, 3, 473–482. [Google Scholar] [CrossRef] [PubMed]
- Rossetti, R.; Brand, H.; Lima, S.C.G.; Furtado, I.P.; Silveira, R.M.; Fantacini, D.M.C.; Covas, D.T.; de Souza, L.E.B. Combination of genetically engineered T cells and immune checkpoint blockade for the treatment of cancer. Immunother. Adv. 2022, 2, ltac005. [Google Scholar] [CrossRef] [PubMed]
- Schoenfeld, A.J.; Lee, S.M.; Doger de Speville, B.; Gettinger, S.N.; Hafliger, S.; Sukari, A.; Papa, S.; Rodriguez-Moreno, J.F.; Graf Finckenstein, F.; Fiaz, R.; et al. Lifileucel, an Autologous Tumor-infiltrating Lymphocyte Monotherapy, in Patients with Advanced Non-small Cell Lung Cancer Resistant to Immune Checkpoint Inhibitors. Cancer Discov. 2024, 14, 1389–1402. [Google Scholar] [CrossRef]
- Silk, A.W.; Curti, B.; Bryan, J.; Saunders, T.; Shih, W.; Kane, M.P.; Hannon, P.; Fountain, C.; Felcher, J.; Zloza, A.; et al. A phase Ib study of interleukin-2 plus pembrolizumab for patients with advanced melanoma. Front. Oncol. 2023, 13, 1108341. [Google Scholar] [CrossRef]
- Sznol, M.; Rizvi, N. Teaching an old dog new tricks: Re-engineering IL-2 for immuno-oncology applications. J. Immunother. Cancer 2023, 11, e006346. [Google Scholar] [CrossRef]
- Zapata, L.; Caravagna, G.; Williams, M.J.; Lakatos, E.; AbdulJabbar, K.; Werner, B.; Chowell, D.; James, C.; Gourmet, L.; Milite, S.; et al. Immune selection determines tumor antigenicity and influences response to checkpoint inhibitors. Nat. Genet. 2023, 55, 451–460. [Google Scholar] [CrossRef]
- Wang, W.Y.; Pearson, A.T.; Kutys, M.L.; Choi, C.K.; Wozniak, M.A.; Baker, B.M.; Chen, C.S. Extracellular matrix alignment dictates the organization of focal adhesions and directs uniaxial cell migration. APL Bioeng. 2018, 2, 046107. [Google Scholar] [CrossRef]
- Spranger, S.; Dai, D.; Horton, B.; Gajewski, T.F. Tumor-residing Batf3 dendritic cells are required for effector T cell trafficking and adoptive T cell therapy. Cancer Cell 2017, 31, 711–723. [Google Scholar] [CrossRef]
- Moldoveanu, D.; Ramsay, L.; Lajoie, M.; Anderson-Trocme, L.; Lingrand, M.; Berry, D.; Perus, L.J.; Wei, Y.; Moraes, C.; Alkallas, R.; et al. Spatially mapping the immune landscape of melanoma using imaging mass cytometry. Sci. Immunol. 2022, 7, eabi5072. [Google Scholar] [CrossRef] [PubMed]
- Nathan, P.; Hassel, J.C.; Rutkowski, P.; Baurain, J.F.; Butler, M.O.; Schlaak, M.; Sullivan, R.J.; Ochsenreither, S.; Dummer, R.; Kirkwood, J.M.; et al. Overall survival benefit with tebentafusp in metastatic uveal melanoma. N. Engl. J. Med. 2021, 385, 1196–1206. [Google Scholar] [CrossRef]
- Borgonovo, E.; Pangallo, M.; Rivkin, J.; Rizzo, L.; Siggelkow, N. Sensitivity analysis of agent-based models: A new protocol. Comput. Math. Organ. Theory 2022, 28, 52–94. [Google Scholar] [CrossRef]
- Ten Broeke, G.; Van Voorn, G.; Ligtenberg, A. Which sensitivity analysis method should I use for my agent-based model? J. Artif. Soc. Soc. Simul. 2016, 19, 5. [Google Scholar] [CrossRef]
- Cheng, X.; Veverka, V.; Radhakrishnan, A.; Waters, L.C.; Muskett, F.W.; Morgan, S.H.; Huo, J.; Yu, C.; Evans, E.J.; Leslie, A.J.; et al. Structure and interactions of the human programmed cell death 1 receptor. J. Biol. Chem. 2013, 288, 11771–11785. [Google Scholar] [CrossRef]
- Lee, H.T.; Lee, S.H.; Heo, Y.S. Molecular interactions of antibody drugs targeting PD-1, PD-L1, and CTLA-4 in immuno-oncology. Molecules 2019, 24, 1190. [Google Scholar] [CrossRef] [PubMed]
- Macklin, P.; Edgerton, M.E.; Thompson, A.M.; Cristini, V. Patient-calibrated agent-based modelling of ductal carcinoma in situ (DCIS): From microscopic measurements to macroscopic predictions of clinical progression. J. Theor. Biol. 2012, 301, 122–140. [Google Scholar] [CrossRef]
- Breart, B.; Lemaître, F.; Celli, S.; Bousso, P. Two-photon imaging of intratumoral CD8+ T cell cytotoxic activity during adoptive T cell therapy in mice. J. Clin. Investig. 2008, 118, 1390–1397. [Google Scholar] [CrossRef]

| Name | Description | Values (Baseline) | Source |
|---|---|---|---|
| CTL recruitment rate | 2.5–25 (8) ABM CTL d−1 | Calibrated | |
| Initial ratio of HA tumor cells to total tumor cells | 0.05–0.95 (0.5) d−1 | Estimated [33] | |
| Max ISF stimulated CTL proliferation rate | 0.04–1.00 (0.15) d−1 | Estimated [25,27,42] | |
| Fast kill rate | 12–120 (48) d−1 | Estimated [33] | |
| Probability of fast killing for HA | 0–1 (0.92) | Assumed | |
| Probability of fast killing for LA | 0–1 (0.33) | Assumed | |
| m | CTL movement rate | 1440–11,520 (2880) d−1 | Estimated [33] |
| CTL Conjugation rate with tumor cells | 12–96 (28.8) d−1 | [33,43] | |
| Immune stimulatory factor reach | 60–200 (100) | Estimated [33] | |
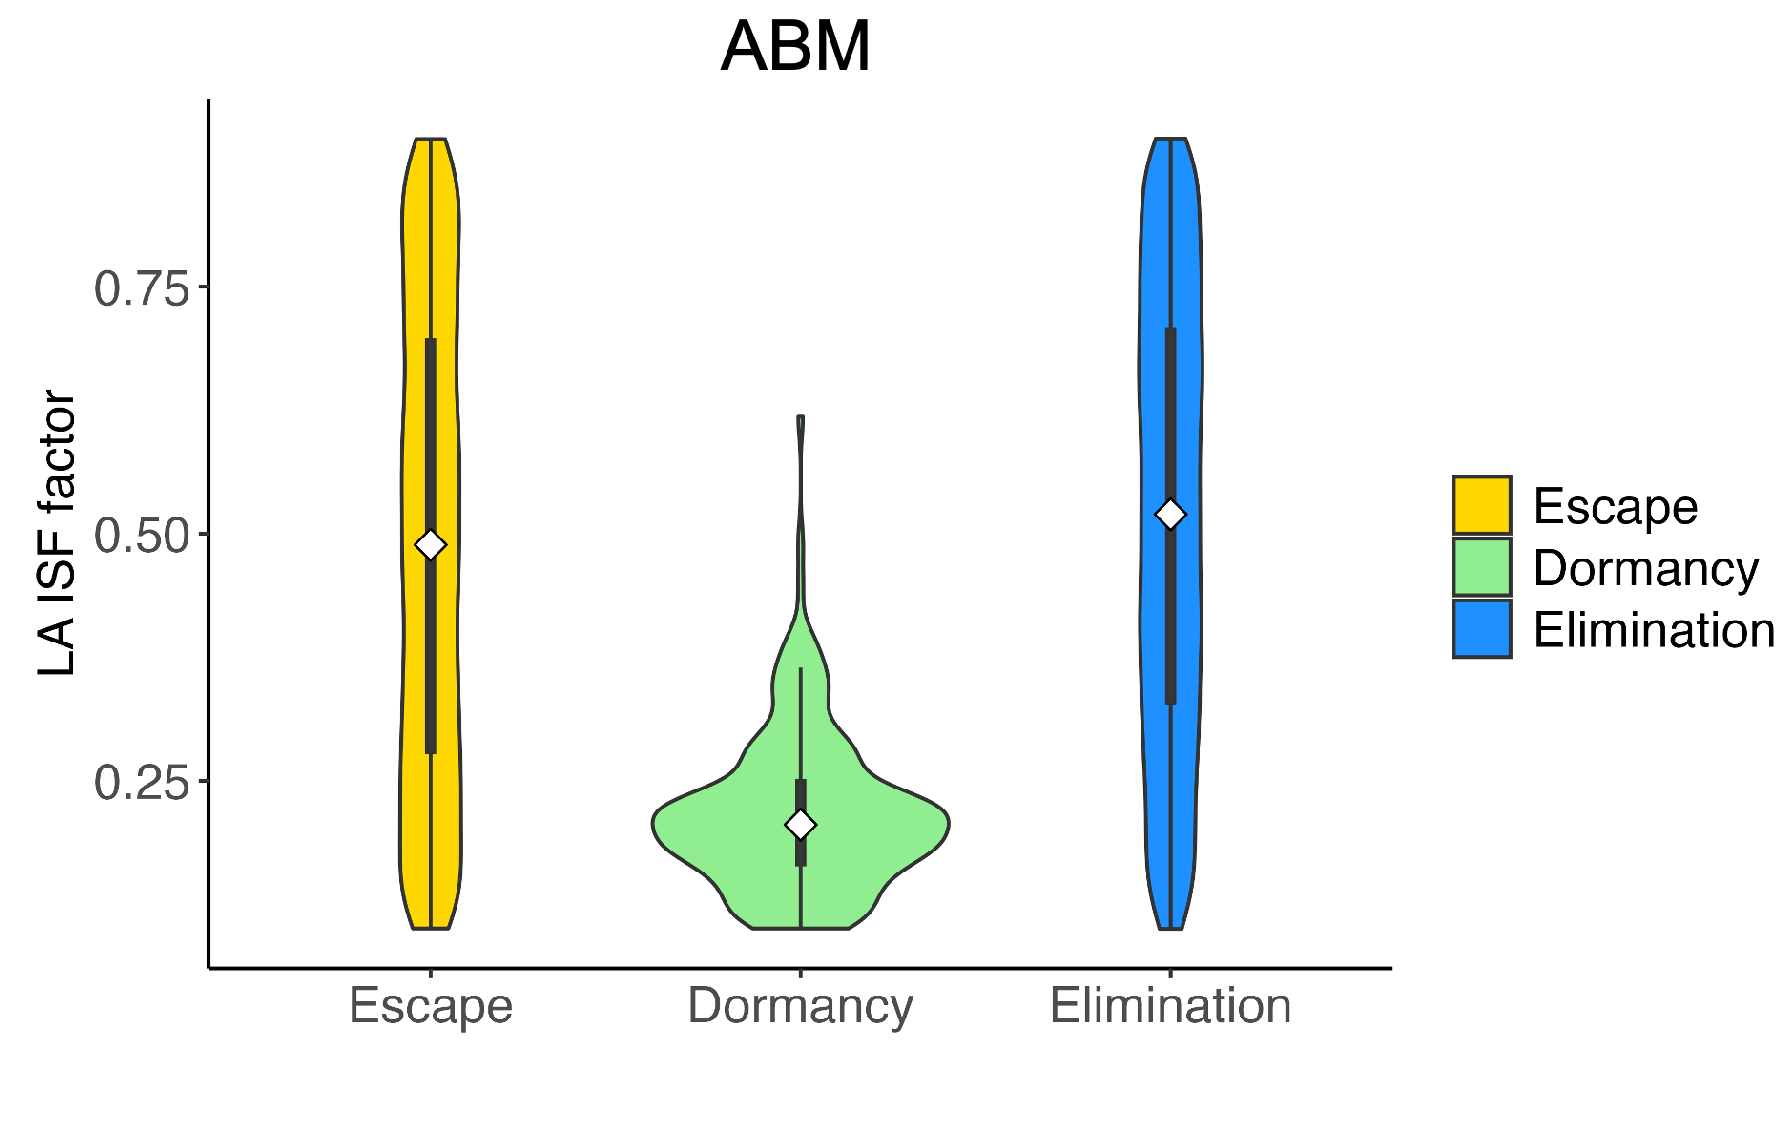
| ISF expression by LA tumor cells compared to HA tumor cells | 0.1–0.9 (0.5) | Assumed [33] |
| Name | Description | Value |
|---|---|---|
| Total Tumor cells | 20 ABM cells | |
| CTLs | 0 ABM cells | |
| Initial ratio of HA tumor cells to total tumor cells | 0.05–0.95 |
| Name | Description | Values (Baseline) |
|---|---|---|
| Proliferation rate of tumor cells | d−1 | |
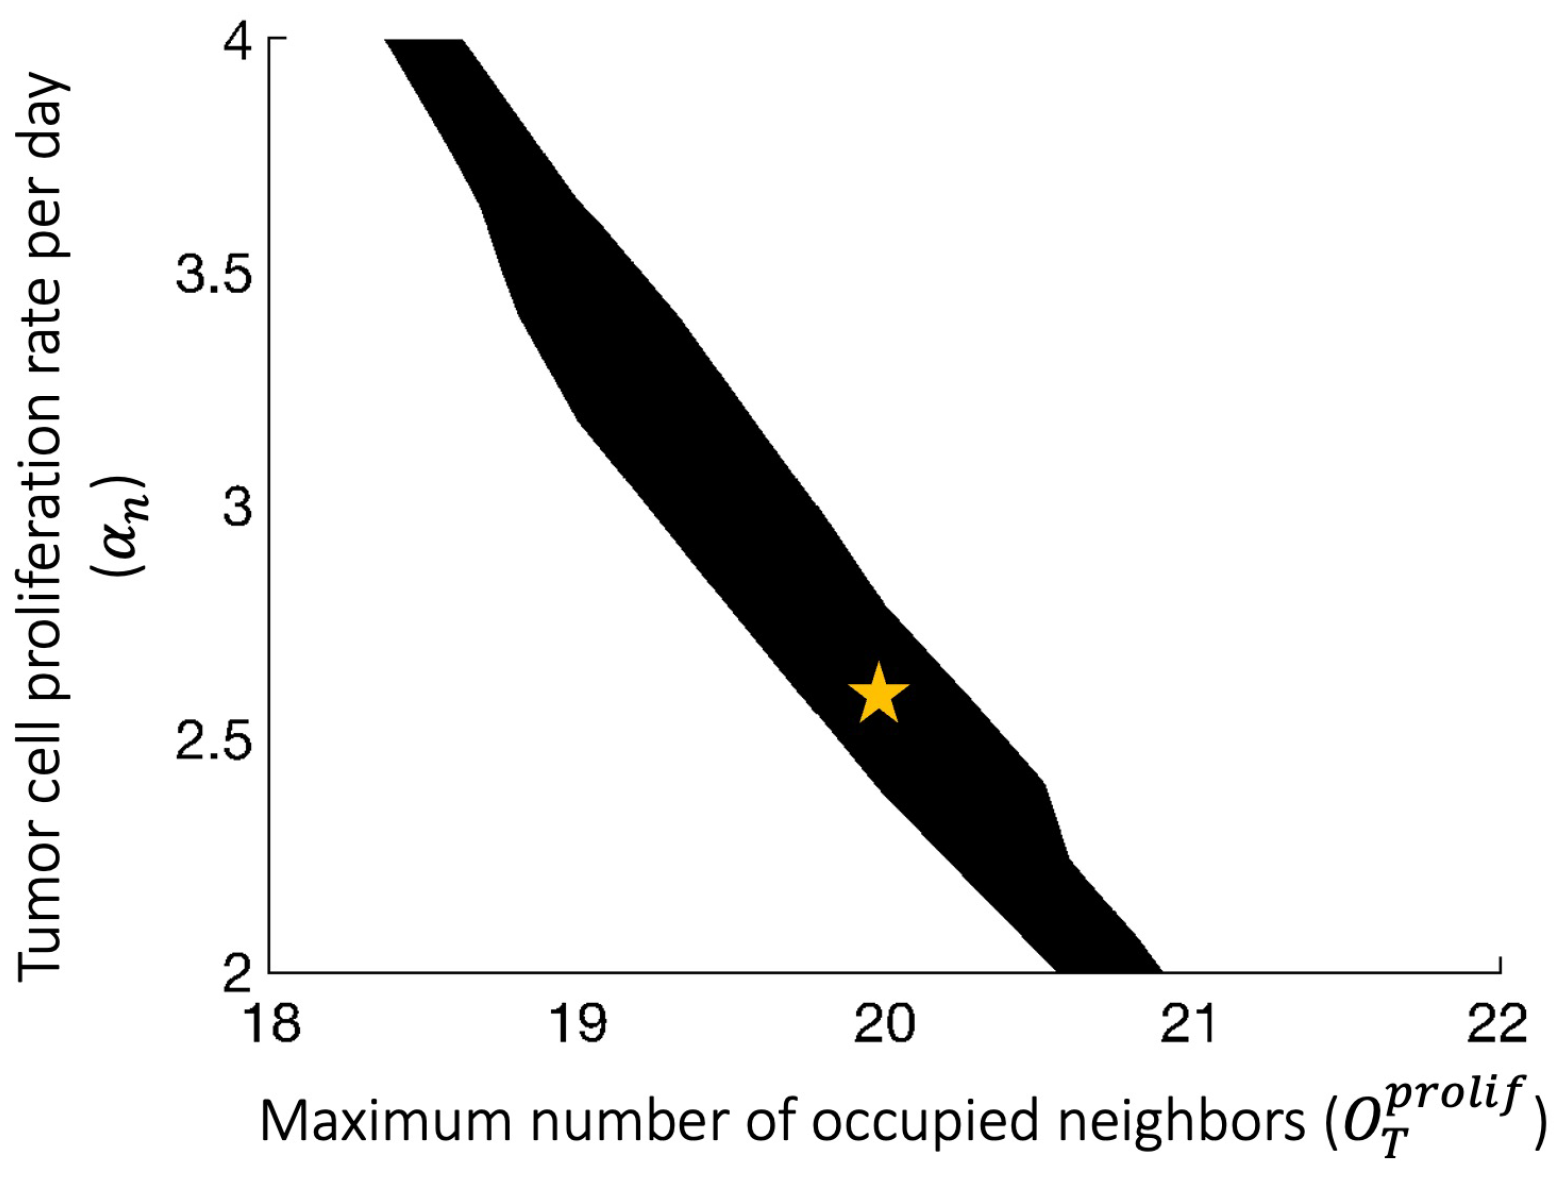
| Maximum number of occupied neighbors that still allows tumor cell proliferation (out of 26) | 20 cells | |
| CTL recruitment rate | 2.5–25 (8) ABM CTL d−1 |
Disclaimer/Publisher’s Note: The statements, opinions and data contained in all publications are solely those of the individual author(s) and contributor(s) and not of MDPI and/or the editor(s). MDPI and/or the editor(s) disclaim responsibility for any injury to people or property resulting from any ideas, methods, instructions or products referred to in the content. |
© 2024 by the authors. Licensee MDPI, Basel, Switzerland. This article is an open access article distributed under the terms and conditions of the Creative Commons Attribution (CC BY) license (https://creativecommons.org/licenses/by/4.0/).
Share and Cite
Wang, Y.; Bergman, D.R.; Trujillo, E.; Fernald, A.A.; Li, L.; Pearson, A.T.; Sweis, R.F.; Jackson, T.L. Agent-Based Modeling of Virtual Tumors Reveals the Critical Influence of Microenvironmental Complexity on Immunotherapy Efficacy. Cancers 2024, 16, 2942. https://doi.org/10.3390/cancers16172942
Wang Y, Bergman DR, Trujillo E, Fernald AA, Li L, Pearson AT, Sweis RF, Jackson TL. Agent-Based Modeling of Virtual Tumors Reveals the Critical Influence of Microenvironmental Complexity on Immunotherapy Efficacy. Cancers. 2024; 16(17):2942. https://doi.org/10.3390/cancers16172942
Chicago/Turabian StyleWang, Yixuan, Daniel R. Bergman, Erica Trujillo, Anthony A. Fernald, Lie Li, Alexander T. Pearson, Randy F. Sweis, and Trachette L. Jackson. 2024. "Agent-Based Modeling of Virtual Tumors Reveals the Critical Influence of Microenvironmental Complexity on Immunotherapy Efficacy" Cancers 16, no. 17: 2942. https://doi.org/10.3390/cancers16172942
APA StyleWang, Y., Bergman, D. R., Trujillo, E., Fernald, A. A., Li, L., Pearson, A. T., Sweis, R. F., & Jackson, T. L. (2024). Agent-Based Modeling of Virtual Tumors Reveals the Critical Influence of Microenvironmental Complexity on Immunotherapy Efficacy. Cancers, 16(17), 2942. https://doi.org/10.3390/cancers16172942


