Article

Investigating the Role of SNAI1 and ZEB1 Expression in Prostate Cancer Progression and Immune Modulation of the Tumor Microenvironment

by
William Lautert-Dutra
1,†,
Camila Morais Melo
1,†,
Luiz Paulo Chaves
1,
Francisco Cesar Sousa
2,
Cheryl Crozier
3,
Dan Dion
3,
Filipe S. Avante
2,
Fabiano Pinto Saggioro
4,
Rodolfo Borges dos Reis
2,
Leticia Fröhlich Archangelo
5,
Jane Bayani
3,6 and
Jeremy A. Squire
1,2,7,*
1
Department of Genetics, Faculty of Medicine at Ribeirão Preto, University of São Paulo (FMRP-USP), Ribeirão Preto 14049-900, SP, Brazil
2
Division of Urology, Department of Surgery and Anatomy, University of São Paulo (FMRP-USP), Ribeirão Preto 14049-900, SP, Brazil
3
Diagnostic Development, Ontario Institute for Cancer Research, Toronto, ON M5G 0A3, Canada
4
Department of Pathology, University of São Paulo (FMRP-USP), Ribeirão Preto 14049-900, SP, Brazil
5
Department of Cellular and Molecular Biology and Pathogenic Bioagents, Ribeirão Preto Medical School, University of São Paulo (FMRP-USP), Ribeirão Preto 14049-900, SP, Brazil
6
Laboratory Medicine and Pathology, University of Toronto, Toronto, ON M5G 1E2, Canada
7
Department of Pathology and Molecular Medicine, Queen’s University, Kingston, ON K7L3N6, Canada
*
Author to whom correspondence should be addressed.
These authors contributed equally to this work.
Cancers 2024, 16(8), 1480; https://doi.org/10.3390/cancers16081480
Submission received: 4 March 2024 / Revised: 3 April 2024 / Accepted: 8 April 2024 / Published: 12 April 2024

Abstract

:

Simple Summary

We evaluate the downstream effects of the Epithelial-to-Mesenchymal Transition (EMT) transcription factors, ZEB1 and SNAI1, and analyze their potential significance as biomarkers for increased aggressiveness and immune response in prostate cancer (PCa). We used two commercial expression profiling panels to examine a primary PCa cohort (n = 51) and identified changes in gene expression linked to downstream pathways associated with biochemical recurrence and increased clinical risk. Genes such as COL1A1, COL1A2, and COL3A1, which are implicated in the tumor microenvironment, and immune-related genes, such as THY1, IRF5, and HLA-DRA, exhibited significant expression level changes. Enrichment analysis identified pathways associated with angiogenesis, TGF-beta, EMT, and UV response in PCa progression. Confirmatory analyses conducted using public domain data demonstrated the downstream impacts of ZEB1 and SNAI1 on pathways and immune responses, highlighting their potential influence on immune modulation in PCa. Future treatment strategies aimed at modulating EMT may enhance immune cell infiltration toward an anti-tumorigenic phenotype.

Abstract

Prostate cancer (PCa) is an immunologically cold tumor and the molecular processes that underlie this behavior are poorly understood. In this study, we investigated a primary cohort of intermediate-risk PCa (n = 51) using two NanoString profiling panels designed to study cancer progression and immune response. We identified differentially expressed genes (DEGs) and pathways associated with biochemical recurrence (BCR) and clinical risk. Confirmatory analysis was performed using the TCGA-PRAD cohort. Noteworthy DEGs included collagens such as COL1A1, COL1A2, and COL3A1. Changes in the distribution of collagens may influence the immune activity in the tumor microenvironment (TME). In addition, immune-related DEGs such as THY1, IRF5, and HLA-DRA were also identified. Enrichment analysis highlighted pathways such as those associated with angiogenesis, TGF-beta, UV response, and EMT. Among the 39 significant DEGs, 11 (28%) were identified as EMT target genes for ZEB1 using the Harmonizome database. Elevated ZEB1 expression correlated with reduced BCR risk. Immune landscape analysis revealed that ZEB1 was associated with increased immunosuppressive cell types in the TME, such as naïve B cells and M2 macrophages. Increased expression of both ZEB1 and SNAI1 was associated with elevated immune checkpoint expression. In the future, modulation of EMT could be beneficial for overcoming immunotherapy resistance in a cold tumor, such as PCa.

1. Introduction

Prostate cancer (PCa) is the second most common cancer in men and the fifth cause of cancer-related deaths worldwide [1,2]. The disease course is often favorable, but unfortunately, 20–30% of patients with localized disease will eventually progress and develop advanced disease and metastasis [3]. Once resistance to androgen deprivation therapy develops, there are limited chemotherapy choices available to control the progression [4], but recently there has been increasing interest in the use of immunotherapy in the advanced setting.
The effect of checkpoint blockade therapy in metastatic PCa has been disappointing, with just 5–10% of patients responding [5,6]. These poor results are primarily thought to be because PCa is an immunologically cold or excluded tumor [7,8]. In various solid tumors, the presence of immune infiltration within the tumor microenvironment (TME) has been associated with improved immune control and a better prognosis [9].
The TME is the cellular ecosystem that surrounds a tumor, and it includes immune cells, the extracellular matrix (ECM), blood vessels, and other cells, such as cancer-associated fibroblasts (CAFs) that may modulate the composition of the TME. Studies of the immune content in PCa have resulted in inconsistent findings, with some indicating that elevated T cell levels within the TME correlate with improved prognosis [10], while others suggest the opposite effect [11]. The variation in immune infiltration likely contributes to the observed differences in anti-cancer immune responses in PCa [12,13].
Epithelial–mesenchymal transition (EMT) mechanisms can profoundly influence the TME [14]. The EMT is a molecular mechanism associated with tumor progression and acquisition of heterogeneity in advanced cancers [15]. EMT-inducing transcriptional regulators, such as TWIST, SNAI1, SNAI2, ZEB1, and ZEB2, exert their phenotypic changes in tumors by modulating the expression of epithelial markers and activating the expression of mesenchymal markers [14]. These downstream regulatory changes in gene expression occur through their direct binding to the promoters of target genes involved in cell adhesion and polarity, leading to loss of cell–cell adhesion, remodeling of the cytoskeleton, and acquisition of migratory and invasive properties characteristic of mesenchymal cells [16].
Zinc finger E-box binding homeobox 1 (ZEB1) is an established EMT transcription factor whose expression in PCa is associated with more aggressive disease and chemoresistance [17]. Similarly, Snail family transcriptional repressor 1 (SNAI1) is the main promoter of EMT in PCa [18], and its expression is associated with a higher Gleason score [19] and increased cell migration [20].
EMT-driven alterations to the TME can lead to resistance to immunotherapy [21,22]. TGF-β signaling is integral to the epithelial phenotype and downstream effects induce changes in the stromal environment to facilitate tumor progression [23]. The expression of TGF-β interacts with both the Snail and ZEB1 proteins to influence cancer–TME crosstalk related to immune evasion [24,25,26].
The prognostic role of downstream EMT transcriptomics derived from PCa primary intermediate-risk tumors has not previously been investigated in the context of the immune landscape of the TME. In this study, we analyzed the influence of altered ZEB1 and SNAI1 expression levels on cancer progression using a retrospective cohort of 51 intermediate-risk PCa tumors from FMRP-USP, Brazil. We determined how downstream changes in gene expression related to each transcription factor could lead to PCa progression changes and immune pathway activities. We used two NanoString mRNA panels (PanCancer Pathway and Immune Profiling) to quantify gene expression levels across the cohort to identify differentially expressed genes (DEGs) and pathways linked to the EMT and progression in intermediate-risk PCa. Our findings indicate that changes in ZEB1 and SNAI1 expression in PCa are associated with the induction of DEGs and downstream pathways that influence the TME and may facilitate immune evasion during tumor progression.

2. Materials and Methods

2.1. Tumor Cohort

The Faculty of Medicine at the Ribeirão Preto (FMRP) cohort comprised 51 primary prostate cancer samples obtained via radical prostatectomy, in accordance with the National Comprehensive Cancer Network (NCCN) clinical practice guidelines [27], at the Urology Division of the Department of Surgery and Anatomy, FMRP-USP, Brazil, between 2007 and 2015 (Table S1). Transcriptomic data derived from this cohort were recently included in another publication by our group [28]. Smaller prostates were submitted for pathological assessment in their entirety according to the guidelines of the American College of Pathology. In cases where larger glands were partially sampled, we followed the protocol by submitting the entire tumor if grossly visible, along with the tumor, surrounding periprostatic tissue, and margins, including the entire apical and bladder neck margins. Additionally, we included the junction of each seminal vesicle with the prostate proper. If there was no grossly visible tumor, a systematic sampling strategy was used. This involved taking slices from the posterior aspect of each transverse section, along with a mid-anterior block from each side. Additionally, we submitted samples including the entire apical and bladder neck margins, as well as the junction of each seminal vesicle with the prostate. Biochemical recurrence (BCR) was defined as PSA > 0.2 ng/mL within six months post radical prostatectomy. To assess the likelihood of prostate cancer recurrence after initial surgery, we utilized the Cancer of The Prostate Risk Assessment Score (CAPRA-S) [29]. This scoring system incorporates various clinical and pathological factors, such as pre-treatment PSA level, pathological Gleason score, surgical margin, extracapsular extension, seminal vesicle invasion, and lymph node invasion. CAPRA-S provides a relative risk assessment for biochemical progression, ranging from 1 to 12. For this study, patients with low CAPRA-S scores were those with values between 0 and 2, those with intermediate scores had CAPRA-S scores ranging from 3 to 5, and those with high scores had CAPRA-S scores between 6 and 12. Patient outcome data were collected to the last follow-up date. This retrospective study was approved by the Ethics Committee in Research of Hospital of Ribeirão Preto, São Paulo, Brazil (HCRP), numbers CAAE 60032122.8.0000.5440 and CAAE 43277221.0.0000.5440, and the Ethics Board of the University of Toronto (Protocol 00043323).

2.2. RNA Isolation

RNA extraction was performed on tissues containing tumor-rich areas, which were previously identified and marked by a pathologist (FPS) to represent the highest Gleason pattern. Serial 5 μm formalin-fixed paraffin-embedded (FFPE) tissue was processed at the Ontario Institute for Cancer Research, Toronto, Canada (OICR), using extraction methods described in previous studies [30,31].

2.3. Transcription Analysis

RNA profiling was performed using both the NanoString PanCancer and the Immune Profiling Panels (NanoString Technologies Inc., Seattle, WA, USA) [32] according to the manufacturer’s instructions. Briefly, RNA profiling using the NanoString methodology relies on digital molecular barcoding and direct hybridization to quantify gene expression levels across multiple genes simultaneously. This methodology has been shown to offer high sensitivity, specificity, and the ability to analyze gene expression patterns from small amounts of RNA, as described previously [33]. The NanoString PanCancer panel comprises 730 genes involved in the cancer progression processes, such as angiogenesis, extracellular matrix remodeling (ECM), EMT, and metastasis. The Immune Profiling Panel comprises 730 immune response genes specifically optimized for immuno-oncology investigative research. There are 130 endogenous genes common between the 2 transcriptional panels, yielding 1200 unique transcripts available for interrogation. Raw expression data from both panels were loaded in nSolver software v4.0 (NanoString Technologies) to perform the quality control (QC) analysis and to build the transcript matrix for downstream analysis. Pearson correlation analysis was performed for the 160 genes in common between the panels and was used to assess reproducibility and identify any potential panel bias. The majority of the 160 genes common to both panels showed a consistent positive correlation between the panels, indicating that gene expression analyses by each panel were reproducible (Supplementary Figure S1). For initial differential expression, we used DESeq2 v1.34.0 with BCR and risk factor as the design factors [34]. We conducted over-representation enrichment analysis (ORA) and Gene Set Enrichment Analysis (GSEA) on the differential expressed genes utilizing the clusterprofiler v4.0 with Kyoto Encyclopedia of Genes and Genomes (KEGG) pathways [35]. Additionally, we categorized the expression levels of ZEB1 and SNAI1 into quartiles for each gene. These categorical data allowed us to classify patient gene expressions as either “low” (below Q3) or “high” (above Q3) for ZEB1 and SNAI1 [28]. We then used the classification status of ZEB1 and SNAI1 as the design factor for the transcriptome analysis as described earlier. For validation purposes, we utilized RNA-seq data from the prostate adenocarcinoma cohort in The Cancer Genome Atlas (PRAD-TCGA, n = 420) [36]. We compared the effects of dichotomized expression levels of ZEB1 and SNAI1 in this public domain cohort.

2.4. Digital Cytometry Analysis

To quantify the immune cell composition in the TME of tumors having a high expression of ZEB1 and SNAI1, we used expression data from TCGA-PRAD [36] analyzed using the digital cytometry resource CIBERSORTx [37]. This algorithm estimates the relative immune abundance in the TME using a “signature matrix” containing validated leukocyte expression data from 22 human hematopoietic cell phenotypes (LM22).

2.5. Statistical Analysis

The data processing and downstream analysis for transcriptome data were completed in Rstudio software (R Foundation for Statistical Computing, R v4.1.2 “Bird Hippie”). Multiple unpaired t-tests were assessed to calculate the statistical significance using the GraphPad Prism 9.3.0 software for CIBERSORT data. Genes were considered differentially expressed when log2 fold change > 0.5 for the NanoString PanCancer and Immune Profiling Panels, and a more rigorous threshold of >0.58 was used for validation comparisons with the TCGA-PRAD, with p-adjusted (FDR) < 0.05. For the enrichment analysis, we used a cutoff value of 0.05 to consider the ORA of Molecular Signatures Database (MsigDB) Hallmarks. Kaplan–Meier estimates of BCR-free survival were computed using the survival package v3.4.0. Figure S1 illustrates the general workflow of this work (Supplementary Figure S2).

3. Results

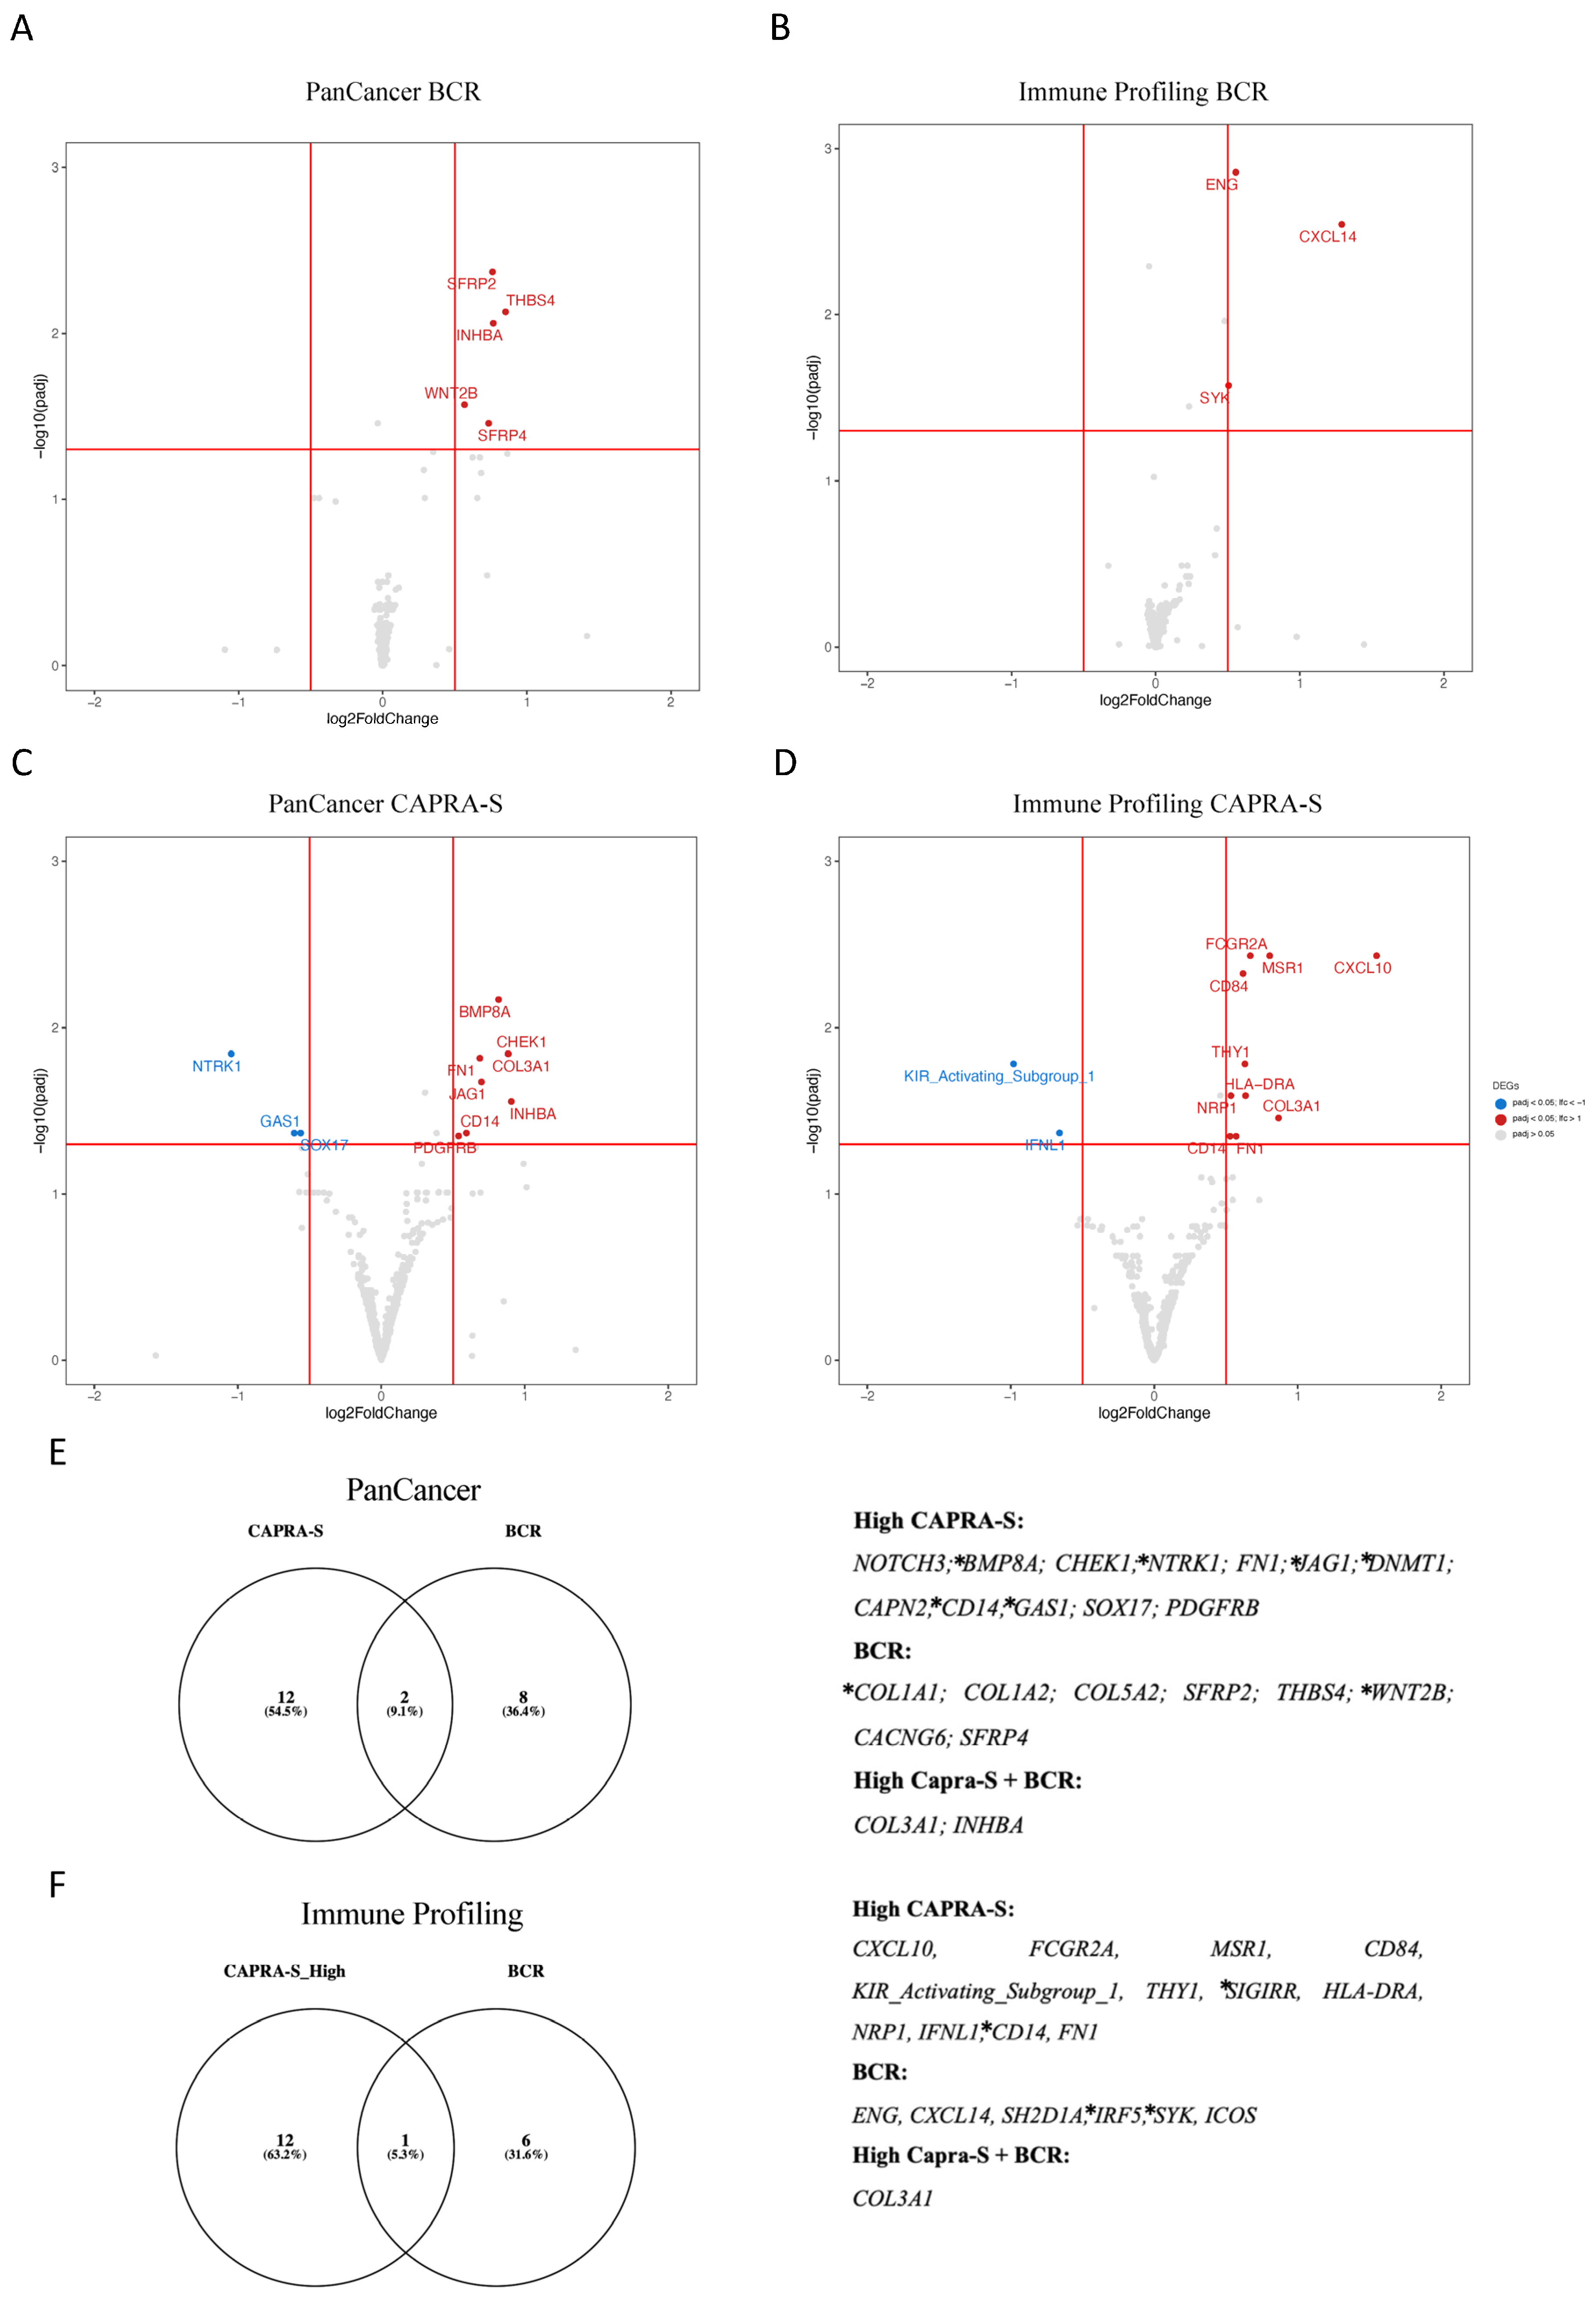
3.1. Identification of DEGs and Pathways Associated with BCR and Clinical Risk

The NanoString PanCancer and the Immune Profiling Panel were developed to cover cancer-related biological functions and features related to adaptative and innate immune response genes. Using both panels, we examined the DEGs (log2 fold change > 0.5) to determine the impact of downstream changes in gene expression on PCa progression through outcome and immune evasion pathways.
In the first phase of our transcriptomic analysis, we investigated DEGs within the FMRP cohort stratified by CAPRA-S and BCR status. Patients with either a CAPRA-S intermediate or a CAPRA-S high relative risk were grouped together as “High”, while the remaining patients identified as low-risk CAPRA-S, were defined by the “Low” group.
Table 1 and Table 2 summarize the significantly associated DEGs with BCR and CAPRA-S determined using the PanCancer panel and Immune Panel, respectively. Many of the DEGs identified in this analysis have been previously reported as prognostic biomarkers in PCa or have been published as potential markers of immune response in various cancers.
Volcano plot analysis of the significantly altered DEGs associated with BCR included the overexpression of SFRP2, THBS4, INHBA, WNT2B, and SFRP4 (Figure 1A), as well as ENG, CXCL14, and SYK (Figure 1B) amongst the “Low” CAPRA-S group. Similarly, the “High” CAPRA-S group exhibited a substantial number of DEGs (Figure 1C,D). Association with CAPRA-S showed increased expression of BMP8A, CHEK1, FN1, COL3A1, JAG1, CD14, INHBA, and PDGFRB (PanCancer) and FCGR2A, CD84, MSR1, CXCL10, THY1, HLA-DRA, COL3A1, NRP1, CD14, and FN1 (Immune Panel). Reduced expression of NTRK1, GAS1, and SOX17 (PanCancer) and KIR_Activating_Subgroup 1 and IFNL1 (Immune Panel) was also identified. Amongst the overlapping genes between panels, increased expression of CD14, FN1, and COL3A1 were independently detected and associated with high CAPRA-S (Figure 1E,F).
The last part of our investigation was to identify pathways based on ORA and GSEA analyses of the DEGs identified. Enrichment analysis revealed pathways related to angiogenesis, and TGF-beta, EMT, and UV response were associated with progression and immune response in the FMRP cohort (Supplementary Table S2). Underscoring the importance of the EMT in PCa progression, 11 (28%) of the 39 DEGs (Figure 1F) associated with BCR or CAPRA-S in our cohort were identified as target genes for the EMT transcription factor ZEB1 [67].
Thus, our initial analyses revealed DEGs associated with immune responses and progression, some of which are regulated by the EMT driver ZEB1. Additionally, genes implicated in the remodeling of the TME, including members of the collagen family (COL1A, COL1A2, COL3A1, COL5A2) [38], fibronectin (FN1) [52], and SFRP4 [47], were identified as putative markers of PCa progression. These findings, in conjunction with existing published data (as reviewed in [68]), highlight the potential impact of EMT mechanisms on modulating the immune TME during the progression of PCa.

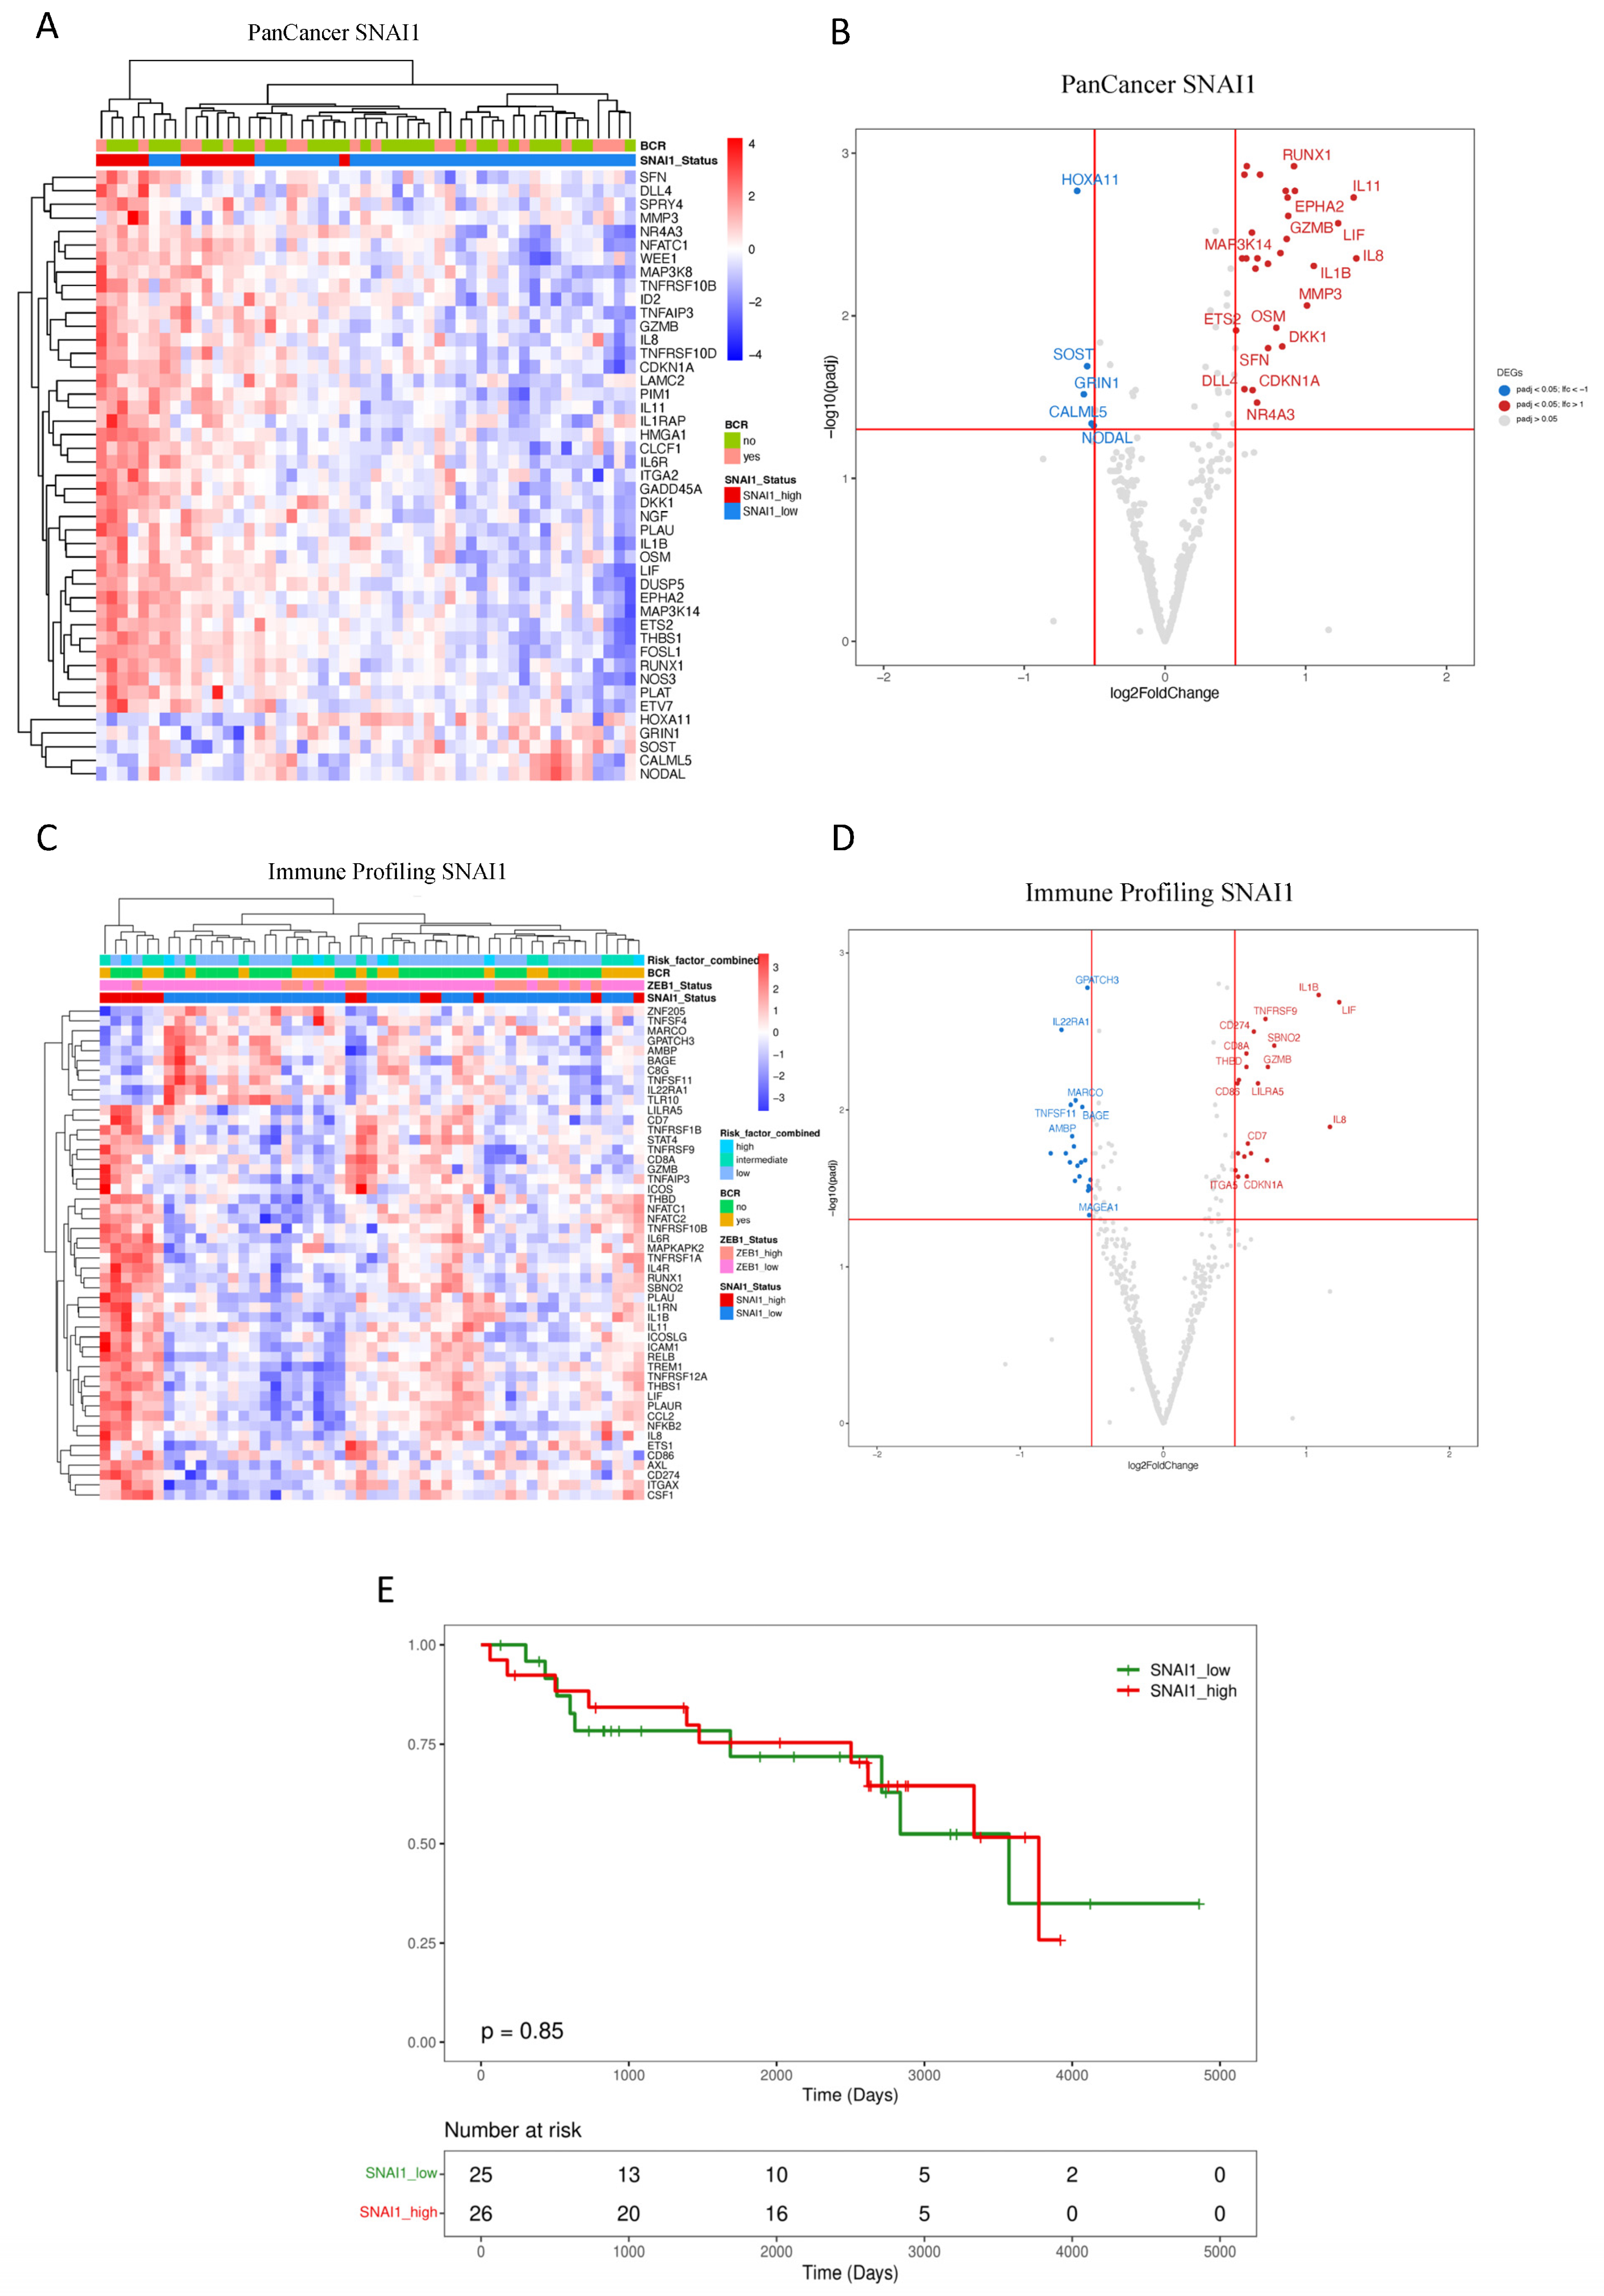
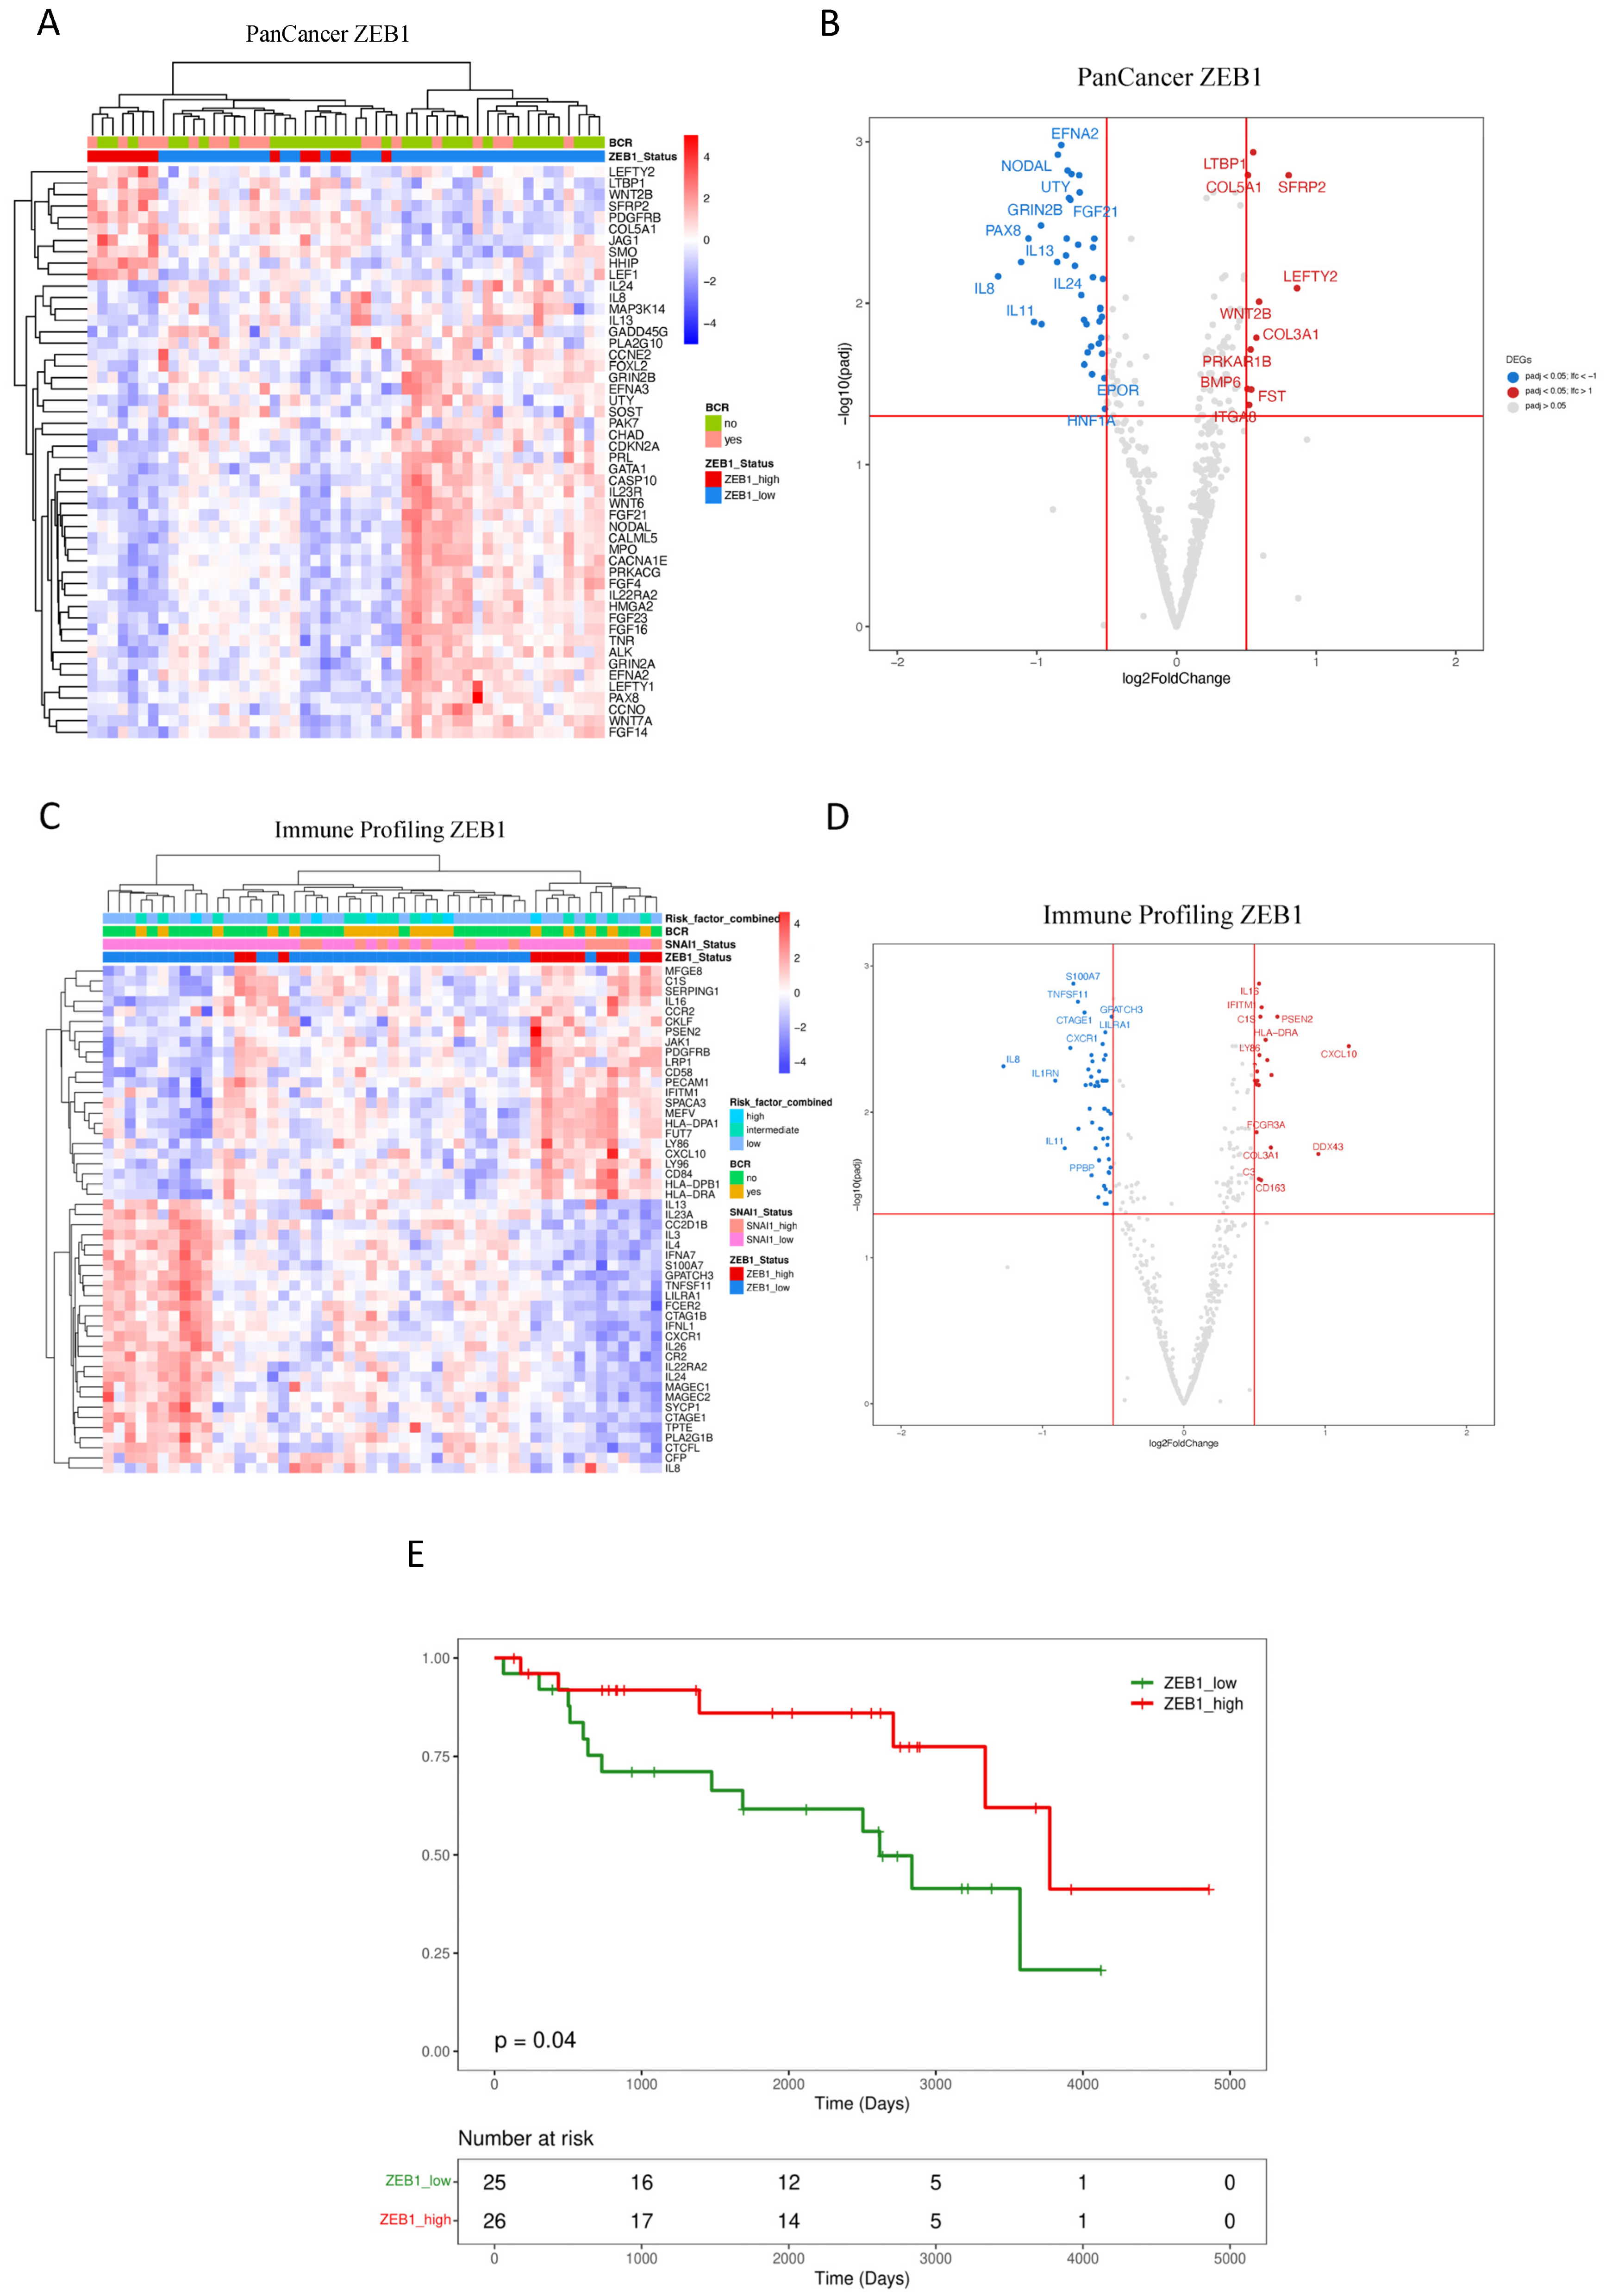
3.2. Downstream Effects of ZEB1 and SNAI1 Expression

The dichotomization of ZEB1 and SNAI1 gene expression levels was based on quartile (Q) values, with patients classified as “low” defined as below Q3 compared to those classified as “high” being above Q3. Our objective was to establish a classification system for the DEG patterns linked to the transcriptional activity of these two EMT drivers and the potential impact on downstream pathways involved in PCa progression. DEGs derived from the analysis of both panels classified by ZEB1 and SNAI1 expression levels are shown in Supplementary Table S3.
Using an unsupervised approach, potential relationships amongst samples based on ZEB1 expression profiles were performed and summarized in Figure 2A,B (PanCancer) and Figure 2C,D (Immune Profiling). A distinct cluster of DEGs associated with high ZEB1 expression was revealed in the PanCancer panel (Figure 2A), identified by a significantly increased expression of LEFTY2, LTBP1, WNT2B, SFRP2, PDGFRB, COL5A1, JAG1, SMO, HHIP, and LEF1 (Figure 2B), as well as several under-expressed genes, including EFNA2, NODAL, UTY, IL8, IL13, IL24, and IL11. Across the genes in the Immune Panel (Figure 2C), a large cluster of DEGs associated with high ZEB1 expression was observed, including an increased expression of CKCLF, PSEN2, JAK1, PDGFRB, LRP1, CD58, PECAM1, IFITM1, SPACA3, MEFV, HLA-DPA1, FUT7, LY86, CXCL10, LY96, CD84, HLA-DPB1, and HLA-DRA (Figure 2D). Similarly, an under-expressed cluster of genes included IL8, TNFSF11, CXCR1, and IL11 (Figure 2D). Pathway analysis of the up- and downregulated DEGs was performed using ORA. ZEB1 expression was associated with allograft rejection, inflammatory response, interferon-alpha and interferon-gamma response, EMT, IL-2/STAT5, IL-6/JAK/STAT3, WNT/beta-catenin (Supplementary Table S4).
The elevated ZEB1 expression demonstrated a statistically significant association with a reduced risk of BCR for our cohort of intermediate-risk PCa, as determined by Kaplan–Meier analysis, (log-rank test p = 0.04) (Figure 2E). This observation aligns with previous findings in which reduced ZEB1 expression was associated with aggressive disease in PCa [69].
Transcriptome analysis based on the dichotomization of SNAI1 uncovered several DEGs illustrated in Figure 3A,B (PanCancer) and Figure 3C,D (Immune Profiling). Results from the PanCancer panel demonstrated clustering associated with high SNAI1 expression, revealing a reduced expression of HOXA11, GRIN1, SOST, CALML5, and NODAL (Figure 3A,B). Significantly overexpressed genes include RUNX1, ETS2, IL1B, LIF, and IL8. Similarly, DEGs related to SNAI1 expression from the Immune Profiling Panel included the overexpression of CD274 (PDL1), IL1B, and TNFRSF9 (Figure 3C,D).
Enrichment analysis of DEGs identified pathways, including TNF-alpha via NF-kB, hypoxia, p53, and PI3K/AKT/mTOR, in addition to those identified in our analysis linked with ZEB1 expression, including IL-2/STAT5, IL-6/JAK/STAT3, EMT, and interferon-alpha and interferon-gamma response (Table 3). Kaplan–Meier analysis revealed no significant association between SNAI1 and BCR-free survival (SNAI1 high vs. low expression, log-rank test, p = 0.85) (Figure 3E).

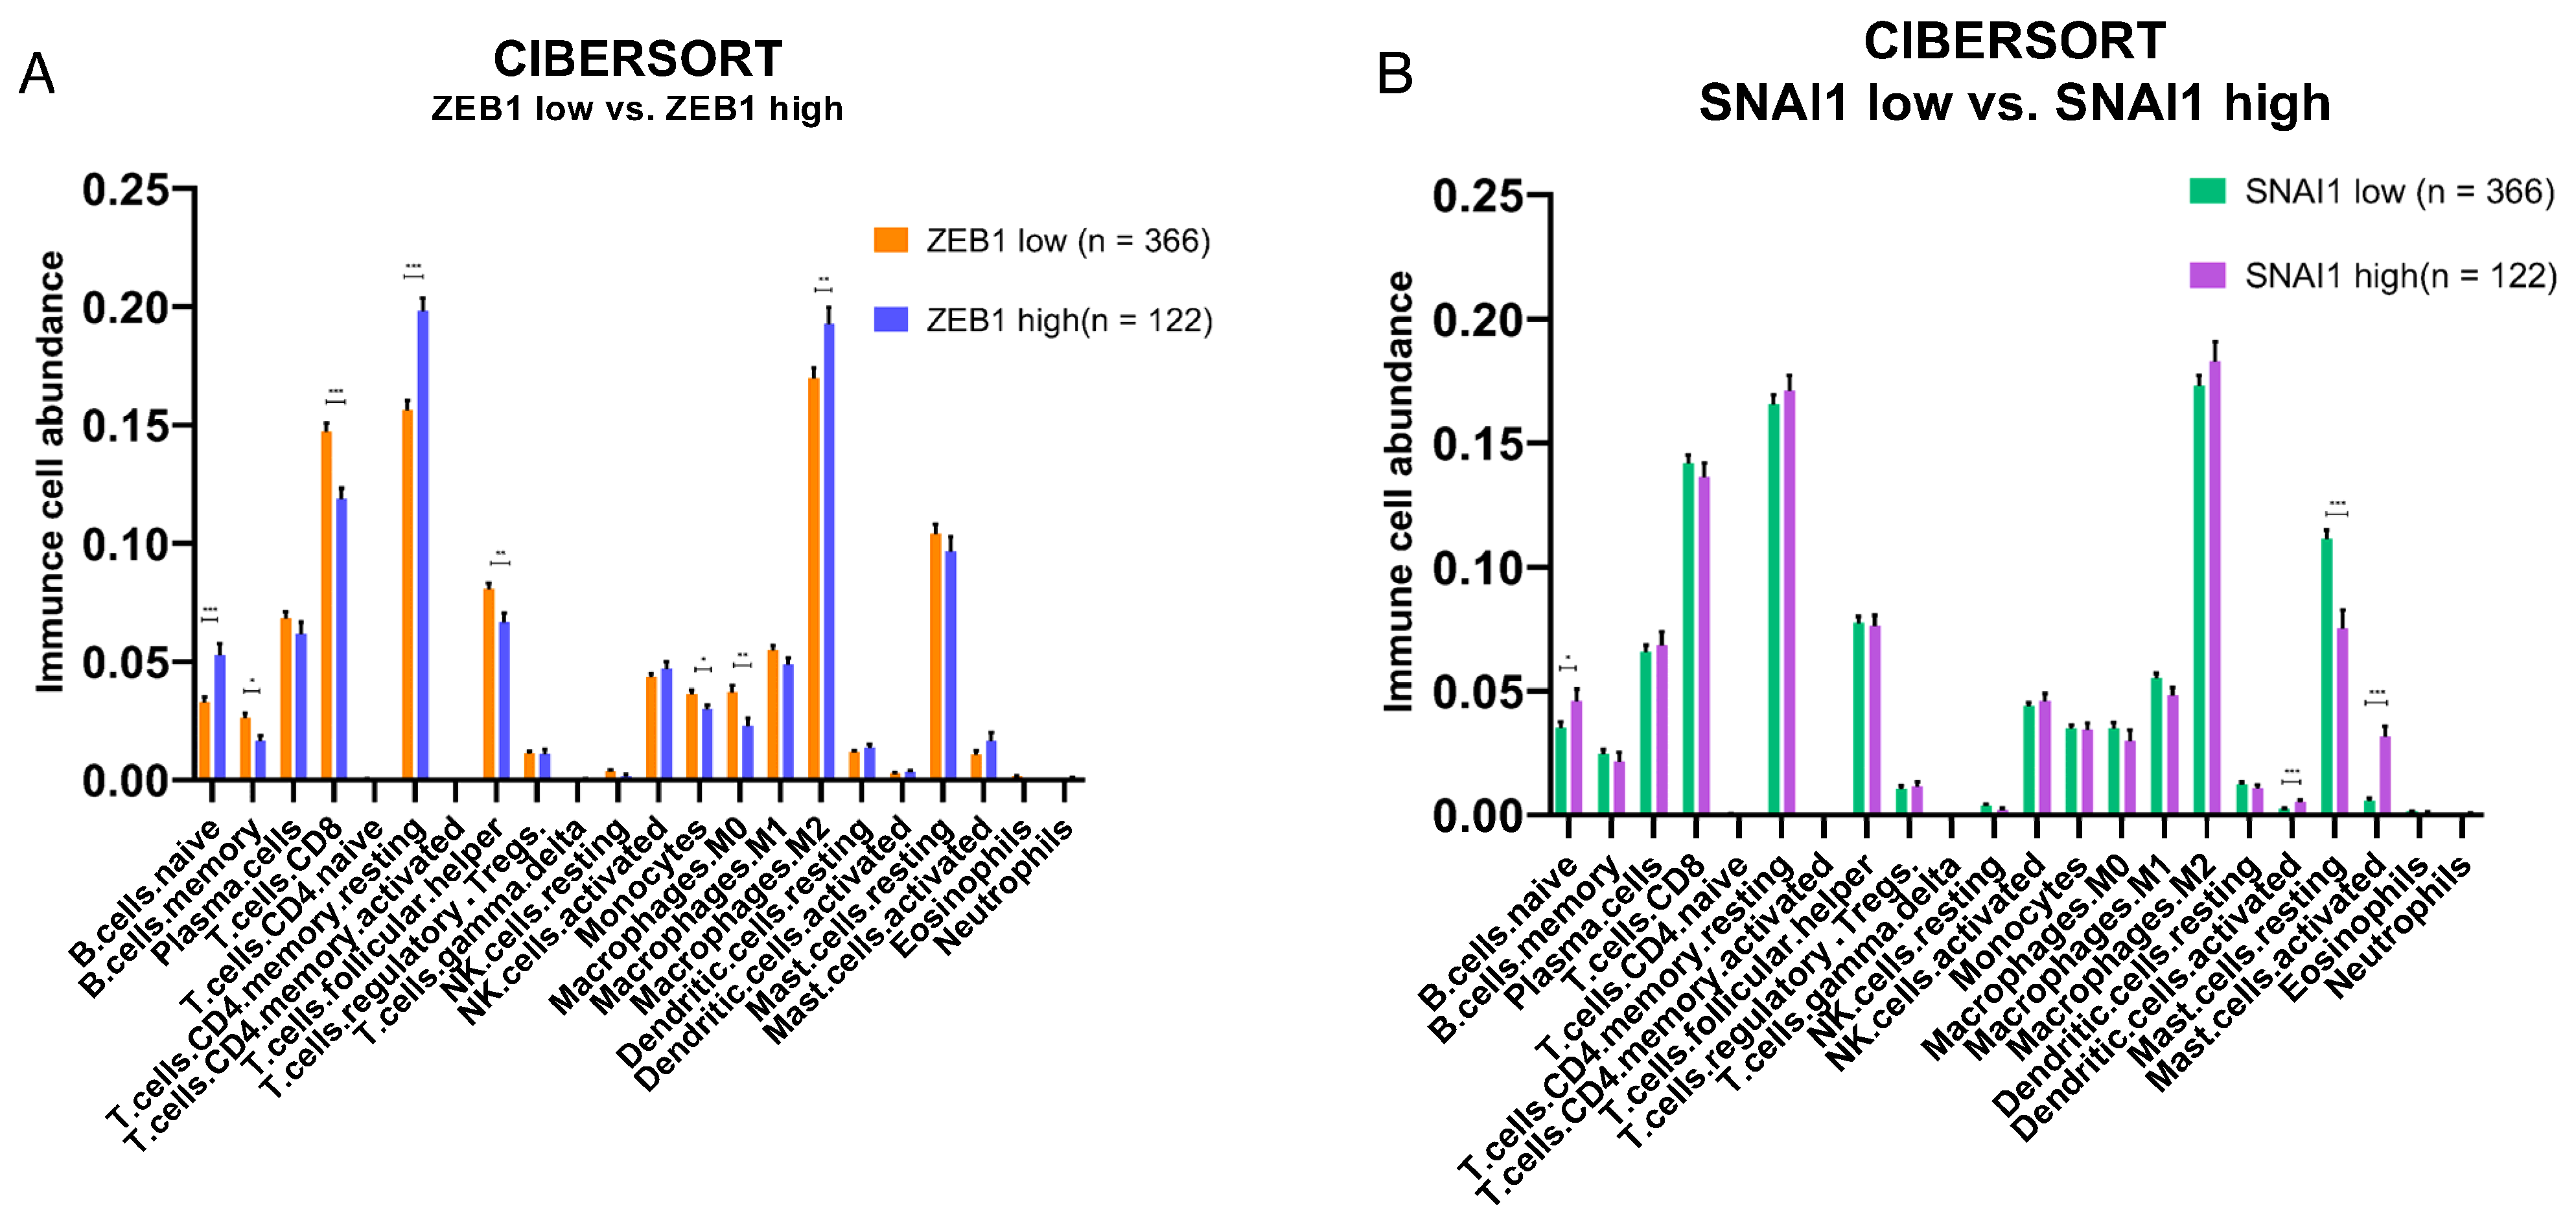
3.3. Impact of ZEB1 and SNAI1 Expression on the Immune TME

To investigate whether tumors expressing high ZEB1 and SNAI1 levels affect the variation in immune cell composition in PCa, we investigated the relative abundance of immune cells using TCGA-PRAD public domain transcriptomic data. CIBERSORTx analysis was used to determine the impact of “high” vs. “low” expression levels of ZEB1 and SNAI1 on TILs and the immune content of the TME. Our results showed that ZEB1’s high expression was associated with an increased abundance of naïve B cells, resting memory CD4+ T cells, and M2 macrophages, and a decreased abundance of memory B cells, CD8 T cells, follicular T helper cells, monocytes, and M0 macrophages (Figure 4A), whilst SNAI1’s high expression showed an increased presence of dendritic and B cells (Figure 4B).
The changes in the immune response in the TME associated with the altered expression of ZEB1 and SNAI1 suggested that these EMT-related transcription factors may directly or indirectly alter the expression of immune modulatory molecules. For example, we found that the expression of the checkpoint gene CD274 (PD-L1) was associated with SNAI1’s high expression in our retrospective cohort analysis (Figure 3C,D). We, therefore, investigated whether the expression of ZEB1 and SNAI1 was also associated with changes in the expression of specific immune checkpoints and immune evasion-related markers in the TCGA-PRAD cohort. Our analysis showed that a high expression of the EMT transcription factors ZEB1 and SNAI1 is associated with an elevated expression of CTLA-4, PD-L1, HAVCR2 (TIM-3), DCR3, and IL10, and IL10RA (Supplementary Figures S3 and S4), suggesting a pattern of the upregulation of immunomodulatory genes resulting in an increase in the composition of immune cells of the TME. Also, these findings collectively highlight the role of the TME in shaping the gene expression signature and outcome in PCa.

4. Discussion

An important hallmark of cancer is understanding how tumors manage to evade the host immune system [70]. This is a crucial adaptive advantage for survival, maintenance, and the evolution of cancer, especially after the emerging success of different types of immunotherapies. PCa is a tumor considered immunologically cold, that is, a type of tumor that is successful in immune evasion and, consequently, does not respond well to immunotherapy [7,8].
The dynamic and reversible nature of the EMT program impacts not only the tumor cells but also the surrounding ECM by accumulating immune suppressive cells in the TME and upregulating immunomodulatory molecules [22]. In PCa, EMT pathways have already been shown to be strongly related to characteristics of progression and aggressiveness, such as migration, invasion, and increased metastatic potential [14,18]. There is growing evidence suggesting that a partial EMT phenotype, in which cells can simultaneously maintain both epithelial and mesenchymal characteristics, may lead to more aggressive disease than a complete EMT [69]. This observation is consistent with our finding that higher ZEB1 expression was associated with a reduced risk of BCR.
Proteins in the collagen family play critical roles in diverse cellular processes, including cell adhesion, migration, differentiation, and proliferation. Collagens in the ECM can engage integrins on tumor cells, impede T cell infiltration, interact with CAFs, and facilitate invasion and metastasis [71]. Of the thirty-nine DEGs in our cohort significantly associated with BCR or CAPRA-S, we identified an increased expression of four collagen genes (COL1A1, COL1A2, COL3A1, and COL5A2). Of these, COL3A1 (collagen type III alpha 1) is the most common DEG in our series, and it is an established biomarker of poor outcome in PCa [38,72]. Its expression also appears to promote immune infiltration in a wide variety of different cancers [73]. COL3A1 interacts with fibronectin (FN1), which was also found to be significantly overexpressed. A crucial component of the ECM, FN1, is also intricately associated with collagens and CAFs [52]. Similarly, increased expression of INHBA (inhibin β A) was also observed from our results and is associated with enhanced collagen expression, including both COL3A1 and COL5A2 [74]. An increased expression of COL3A1 in PCa activates other pro-tumorigenic genes and pathways, such as the Wnt/beta-catenin [38]. COL3A1 expression is associated with higher Gleason scores, higher PSA levels, and a higher likelihood of lymph node involvement. Additionally, COL5A2 expression correlated with increased tumor cell invasion and resistance to androgen deprivation therapy [40]. SFRP2 was identified as a regulator of the TME through its impact on Wnt signaling and tumor angiogenesis [41,42], while THBS4 influenced cancer stem cell-like properties in PCa via the PI3K/Akt pathway [43]. Several other DEGs have been previously associated with higher Gleason scores, including COL1A2 and INHBA (subunit of Activin A) [44,45]. WNT2B is regulated by long non-coding RNAs (lncRNAs) and has been shown to play a role in influencing the EMT in PCa [46], while SFRP4 emerged as a predictor of BCR in PCa, and its expression is also linked to the EMT [47].
Analysis of the immune-related components identified several DEGs that could be involved in shaping the immune landscape of PCa that were also associated with disease progression defined by CAPRA-S and BCR status (Table 2). The expression of Interferon Regulatory Factor 5 (IRF5) was associated with BCR, suggesting that this immune response modulator may also influence prognosis [58]. Similarly, the observation that THY1 is overexpressed in PCa-associated fibroblasts may also be involved in antigen presentation in the stromal components of the TME of PCa [63]. The identification of HLA-DRA in our analysis offers the possibility that dysregulation may affect antigen presentation within the TME and influence the immune response [65]. NRP has been reported to be upregulated by androgen deprivation therapy (ADT) in advanced PCa [66], and its expression is thought to lead to increased vascularization and facilitate tumor progression. The co-expression of the immune cytokines CXCL10 with CXCR3 has been previously associated with metastatic recurrence [60].
It is noteworthy that of our 39 high-risk significantly associated DEGs, ENG, INHBA, COL1A1, COL3A1, COL5A2, SFRP4, THY1, and CXCL14 were also identified as prognostic biomarkers in a recently published transcriptional signature predictive of recurrence [75]. COL3A1, FN1, and THBS4 were found to be associated with high infiltration of Tregs in bone metastatic PCa [72]. Similarly, a recent patent identified COL1A1, FN1, COL3A1, INHBA, and SFRP4 as stromal response genes that can be used to test for PCa outcome [76].
Eleven of the thirty-nine significant DEGs were identified as ZEB1 target genes using the Harmonizome database [67]. Nine of the eleven ZEB1 target genes were associated with high CAPRA-S. The proteins encoded by these 11 DEGs, COL1A1, WNT2B, IRF5, SYK, BMP8A, NTRK1, JAG1, DNMT1, CD14, GAS1, and SIGIRR, collectively present a set of functional properties that may be integral in limiting the immune response within the TME of PCa when an EMT transcriptional program is regulated by ZEB1. For example, collagen production by COL1A1 may physically impede immune cell infiltration [77], while WNT2B signaling is associated with immunosuppression [46]. IRF5, involved in immune regulation, and SYK, have been implicated in immune cell functions [59]. Additionally, BMP8A, NTRK1, JAG1, and GAS1 each bring unique contributions that can influence the immunosuppressive characteristics of the TME [49,51,53,54]. Furthermore, DNMT1 and CD14, through epigenetic regulation and immune cell activation, respectively, contribute to the overall immune evasion [78]. Lastly, SIGIRR’s role as a negative regulator of Toll-like receptor signaling suggests its potential involvement in immune suppression [64].
Validation using the PRAD TCGA public cohort showed that both EMT drivers ZEB1 and SNAI1 are associated with the expression of the immunological evasion markers CTLA-4, PD-L1, TIM3, DCR3, and IL10. The expression of these markers leads not only to an inactivation of T cells but also to a generalized immune suppression in the TME [79]. Checkpoint proteins like CTLA-4 and PD-L1 inhibit T cell activation by delivering inhibitory signals to T cells upon engagement with their respective ligands. This inhibition prevents the full activation of T cells, leading to a state of quiescence where T cells remain inactive and are unable to mount an effective immune response against tumors [80].
Analysis of the relative abundance of immune cells in the TME of the PRAD TCGA cohort showed that ZEB1 expression was associated with an increase in M2 polarization macrophages, which are known to be involved in the suppression of immunological activity [81]. Decreases in memory B cells, CD8+ T cells, follicular T helper cells, monocytes, and M0 macrophages further support ZEB1 expression and may influence anti-tumor immunity in the TME and recruitment of TILs. In contrast, digital cytometric analysis of the effects of high SNAI1 expression on the TME correlated with increased abundance of naïve B cells, resting dendritic cells, and activated mast cells, while showing decreased levels of resting mast cells. Interestingly, mast cell infiltration in PCa has been associated with chemotherapy resistance through the activation of p38/p53/p21 signaling [82]. Collectively, these data suggest that downstream changes activated by EMT transcription factors not only influence the aggressive behavior of tumors but also lead to changes in the immune activity of the TME.

5. Conclusions

In summary, these data suggest that the differential expression of collagen genes, such as COL3A1 and various immune response genes observed in our study, are part of the EMT program, leading to cellular alterations that impact immune cell functions in the microenvironment of PCa. Collagen-related signals can modulate T cell activation, proliferation, and cytokine production. Moreover, the density and organization of collagen fibers could affect the spatial distribution and activation levels of immune cells within the tumor, influencing their ability to recognize and eliminate cancer cells. Understanding the interplay between the spatial effects of collagen and immune cells in the TME has therapeutic implications. This study has some limitations. The CAPRA-S score, which was used to classify the groups according to tumor progression relies on pathological factors, like the Gleason score and tumor stage. While these are important, they may not fully capture the complexity of prostate cancer biology and its interaction with the host environment. Furthermore, our sample size of 51 cases, while limited, was aimed at providing pilot data to establish a connection between the EMT and the immune TME in prostate cancer, thereby providing a basis for future clinical investigations with larger cohorts. This study suggests that future treatment strategies aimed at modulating the EMT [14,83] may enhance immune cell infiltration toward an anti-tumorigenic phenotype, which could be beneficial for countering immunotherapy resistance in a cold tumor, such as PCa.

Supplementary Materials

The following supporting information can be downloaded at https://www.mdpi.com/article/10.3390/cancers16081480/s1, Table S1: Prostate cancer tissue samples and validation cohort. BCR, biochemical recurrence; CAPRA-S, Cancer of the Prostate Risk Assessment Score; pGS, pathologic Gleason score; ISUP, International Society of Urological Pathology Score; TNM, Classification of Malignant Tumors. * For validation comparisons, we used RNA-seq data from the prostate adenocarcinoma cohort from The Cancer Genome Atlas (PRAD-TCGA, n = 420) [36]. Table S2: Enrichment analysis from the DEGs associated with BCR and CAPRA-S in the FMRP cohort. List of ORA enriched analysis using MSigDb Hallmark’s terms for DEGs associated with BCR and CAPRA-S using both the Immune Profile and PanCancer panels. Both comparisons used no BCR and low CAPRA-S scores as references from the FMRP cohort. Table S3: DEGs based on ZEB1 and SNAI1. List of DEGs from Immune Profiling and PanCaner panels for patients classified according to ZEB1 and SNAI1 expression. The genes were considered DE when log2 FC > 0.5 and p-adjusted (FDR) < 0.05. Table S4: Enrichment analysis from DEGs associated with a high ZEB1 expression in the FMRP cohort. List of ORA-enriched pathways using MSigDb Hallmark’s terms for DEGs associated with a high expression of ZEB1. The analysis used patients with a low expression of ZEB1 as a reference. Figure S1: Correlation plots of common genes between Immune Profiling and PanCancer panels. Pearson correlation was used in normalized expression levels of each gene. The heatmap shows the Pearson correlation coefficient. Non-significant results are displayed in white and significant correlations are colored (p < 0.01). Figure S2: Summary workflow. We conducted NanoString panel profiling using RNA extracted from formalin-fixed paraffin-embedded (FFPE) tissues from the Faculty of Medicine of Ribeirao Preto (FMRP) cohort (n = 51). DEGs and pathway and downstream analyses of ZEB1 and SNAI1 were performed using our in-house pipeline (see methods). Figure S3: Effects of a high and low ZEB1 expression on the relative expression of checkpoint genes. Analysis of the expression of known immunomodulatory markers shows an increased relative expression of CTLA-4, PD-L1, HAVCR2 (TIM-3), IDO1, DCR3, IL10, and IL10RA in the high ZEB1 group (n = 366) compared to the low group (n = 122) in the TCGA cohort. * p < 0.05, Mann–Whitney test. Figure S4: Effects of a high and low SNAI1 expression on the relative expression of checkpoint genes. Analysis of the expression of known immunomodulatory markers shows an increased relative expression of CTLA-4, PD-L1, HAVCR2 (TIM-3), IDO1, DCR3, IL10, and IL10RA in the high SNAI1 group (n = 366) compared to the low group (n = 122) in the TCGA cohort. * p < 0.05, Mann–Whitney test.

Author Contributions

L.P.C.: Conceptualization, data curation, investigation, methodology, project administration, visualization, and writing—review and editing. W.L.-D.: Conceptualization, data curation, formal analysis, investigation, methodology, project administration, validation, visualization, writing—original draft, and writing—review and editing. C.M.M.: Data curation, investigation, methodology, validation, and writing—review and editing. F.C.S.: Data curation and writing—review and editing. C.C.: Data curation, investigation, methodology, validation, and writing—review and editing. D.D.: Data curation, investigation, methodology, validation, and writing—review and editing. F.S.A.: Data curation, methodology, and writing—review and editing. F.P.S.: Data curation, investigation, methodology, validation, and writing—review and editing. R.B.d.R.: Data curation, investigation, methodology, project administration, and writing—review and editing. L.F.A.: Data curation, investigation, methodology, project administration, and writing—review and editing. J.B.: Conceptualization, data curation, formal analysis, funding acquisition, investigation, methodology, project administration, resources, supervision, validation, visualization, writing—original draft, and writing—review and editing. J.A.S.: Conceptualization, data curation, formal analysis, funding acquisition, investigation, methodology, project administration, resources, supervision, validation, visualization, writing—original draft, and writing—review and editing. All authors have read and agreed to the published version of the manuscript.

Funding

This work was supported by the Fundação de Amparo à Pesquisa do Estado de São Paulo (FAPESP) [grant numbers 2019/22912-8 to J.A.S., 2021/12816-9 (L.P.C.), 2021/12271-5 (W.L.-D.), and 2021/15011-4 to J.A.S., R.B.d.R. and L.F.A.], CNPq Bolsa de Produtividade em Pesquisa PQ-2019 308024/2019-2 (J.A.S) and funds from the Government of Ontario to J.B.

Institutional Review Board Statement

This retrospective study was approved by the Ethics Committee in Research of Hospital of Ribeirão Preto, São Paulo, Brazil (HCRP) numbers CAAE 60032122.8.0000.5440 (13 July 2022), CAAE 43277221.0.0000.5440 (7 March 2022) and the Ethics Board of the University of Toronto (Protocol: 00043323, 13 September 2022). The studies were conducted in accordance with the local legislation and institutional requirements.

Informed Consent Statement

Informed consent was obtained from all subjects involved in the study.

Data Availability Statement

The datasets presented in this study can be found in online repositories. The names of the repository/repositories and accession number(s) can be found in the article/Supplementary Materials.

Acknowledgments

The authors acknowledge the contributions of the Department of Surgery and Anatomy, the Department of Pathology, FMRP-USP, and members of Diagnostic Development at the Ontario Institute for Cancer Research. We thank the patients for their contributions to the study.

Conflicts of Interest

J.B. has the patent application “A Molecular Classifier for Personalized Risk Stratification for Patients with Prostate Cancer” under consideration. Status: PCT, Filing Date: 18 June 2021, International Application No. PCT/CA2021/050837, PCT Application Title: Molecular Classifiers for Prostate Cancer. Previous US Provisional Status: Filing Date: 18 June 2020, US Provisional Patent No. 63/040.692, US Provisional Application Title: Use of Molecular Classifiers to Diagnose, Treat, and Prognose Prostate Cancer. The remaining authors declare that the research was conducted in the absence of any commercial or financial relationships that could be constructed as a potential conflict of interest.

References

  1. Siegel, R.L.; Miller, K.D.; Wagle, N.S.; Jemal, A. Cancer statistics, 2023. CA Cancer J. Clin. 2023, 73, 17–48. [Google Scholar] [CrossRef]
  2. Sung, H.; Ferlay, J.; Siegel, R.L.; Laversanne, M.; Soerjomataram, I.; Jemal, A.; Bray, F. Global Cancer Statistics 2020: GLOBOCAN Estimates of Incidence and Mortality Worldwide for 36 Cancers in 185 Countries. CA Cancer J. Clin. 2021, 71, 209–249. [Google Scholar] [CrossRef]
  3. Rebello, R.J.; Oing, C.; Knudsen, K.E.; Loeb, S.; Johnson, D.C.; Reiter, R.E.; Gillessen, S.; Van der Kwast, T.; Bristow, R.G. Prostate cancer. Nat. Rev. Dis. Prim. 2021, 7, 9. [Google Scholar] [CrossRef]
  4. Baciarello, G.; Gizzi, M.; Fizazi, K. Advancing therapies in metastatic castration-resistant prostate cancer. Expert Opin. Pharmacother. 2018, 19, 1797–1804. [Google Scholar] [CrossRef]
  5. Abida, W.; Cheng, M.L.; Armenia, J.; Middha, S.; Autio, K.A.; Vargas, H.A.; Rathkopf, D.; Morris, M.J.; Danila, D.C.; Slovin, S.F.; et al. Analysis of the Prevalence of Microsatellite Instability in Prostate Cancer and Response to Immune Checkpoint Blockade. JAMA Oncol. 2019, 5, 471–478. [Google Scholar] [CrossRef]
  6. Wu, Y.M.; Cieślik, M.; Lonigro, R.J.; Vats, P.; Reimers, M.A.; Cao, X.; Ning, Y.; Wang, L.; Kunju, L.P.; de Sarkar, N.; et al. Inactivation of CDK12 Delineates a Distinct Immunogenic Class of Advanced Prostate Cancer. Cell 2018, 173, 1770–1782.e14. [Google Scholar] [CrossRef]
  7. Melo, C.M.; Vidotto, T.; Chaves, L.P.; Lautert-Dutra, W.; Dos Reis, R.B.; Squire, J.A. The role of somatic mutations on the immune response of the tumor microenvironment in prostate cancer. Int. J. Mol. Sci. 2021, 22, 9550. [Google Scholar] [CrossRef]
  8. Stultz, J.; Fong, L. How to turn up the heat on the cold immune microenvironment of metastatic prostate cancer. Prostate Cancer Prostatic Dis. 2021, 24, 697–717. [Google Scholar] [CrossRef]
  9. Fridman, W.H.; Pagès, F.; Sautès-Fridman, C.; Galon, J. The immune contexture in human tumours: Impact on clinical outcome. Nat. Rev. Cancer 2012, 12, 298–306. [Google Scholar] [CrossRef]
  10. Nardone, V.; Botta, C.; Caraglia, M.; Martino, E.C.; Ambrosio, M.R.; Carfagno, T.; Tini, P.; Semeraro, L.; Misso, G.; Grimaldi, A.; et al. Tumor infiltrating T lymphocytes expressing FoxP3, CCR7 or PD-1 predict the outcome of prostate cancer patients subjected to salvage radiotherapy after biochemical relapse. Cancer Biol. Ther. 2016, 17, 1213–1220. [Google Scholar] [CrossRef]
  11. Zhao, S.G.; Lehrer, J.; Chang, S.L.; Das, R.; Erho, N.; Liu, Y.; Sjöström, M.; Den, R.B.; Freedland, S.J.; Klein, E.A.; et al. The immune landscape of prostate cancer and nomination of PD-L2 as a potential therapeutic target. J. Natl. Cancer Inst. 2019, 111, 301–310. [Google Scholar] [CrossRef]
  12. Ge, R.; Wang, Z.; Cheng, L. Tumor microenvironment heterogeneity an important mediator of prostate cancer progression and therapeutic resistance. NPJ Precis. Oncol. 2022, 6, 31. [Google Scholar] [CrossRef]
  13. Haffner, M.C.; Zwart, W.; Roudier, M.P.; True, L.D.; Nelson, W.G.; Epstein, J.I.; De Marzo, A.M.; Nelson, P.S.; Yegnasubramanian, S. Genomic and phenotypic heterogeneity in prostate cancer. Nat. Rev. Urol. 2021, 18, 79–92. [Google Scholar] [CrossRef]
  14. Brabletz, S.; Schuhwerk, H.; Brabletz, T.; Stemmler, M.P. Dynamic EMT: A multi-tool for tumor progression. EMBO J. 2021, 40, e108647. [Google Scholar] [CrossRef]
  15. Derynck, R.; Weinberg, R.A. EMT and Cancer: More Than Meets the Eye. Dev. Cell 2019, 49, 313–316. [Google Scholar] [CrossRef]
  16. Stemmler, M.P.; Eccles, R.L.; Brabletz, S.; Brabletz, T. Non-redundant functions of EMT-TFs. Nat. Cell Biol. 2019, 21, 102–112. [Google Scholar] [CrossRef]
  17. Orellana-Serradell, O.; Herrera, D.; Castellon, E.A.; Contreras, H.R. The transcription factor ZEB1 promotes an aggressive phenotype in prostate cancer cell lines. Asian J. Androl. 2018, 20, 294–299. [Google Scholar] [CrossRef]
  18. Stylianou, N.; Lehman, M.L.; Wang, C.; Fard, A.T.; Rockstroh, A.; Fazli, L.; Jovanovic, L.; Ward, M.; Sadowski, M.C.; Kashyap, A.S.; et al. A molecular portrait of epithelial–mesenchymal plasticity in prostate cancer associated with clinical outcome. Oncogene 2019, 38, 913–934. [Google Scholar] [CrossRef]
  19. Poblete, C.E.; Fulla, J.; Gallardo, M.; Muñoz, V.; Castellón, E.A.; Gallegos, I.; Contreras, H.R. Increased SNAIL expression and low syndecan levels are associated with high Gleason grade in prostate cancer. Int. J. Oncol. 2014, 44, 647–654. [Google Scholar] [CrossRef]
  20. Neal, C.L.; Henderson, V.; Smith, B.N.; McKeithen, D.; Graham, T.; Vo, B.T.; Odero-Marah, V.A. Snail transcription factor negatively regulates maspin tumor suppressor in human prostate cancer cells. BMC Cancer 2012, 12, 336. [Google Scholar] [CrossRef]
  21. Horn, L.A.; Fousek, K.; Palena, C. Tumor Plasticity and Resistance to Immunotherapy. Trends Cancer 2020, 6, 432–441. [Google Scholar] [CrossRef] [PubMed]
  22. Taki, M.; Abiko, K.; Ukita, M.; Murakami, R.; Yamanoi, K.; Yamaguchi, K.; Hamanishi, J.; Baba, T.; Matsumura, N.; Mandai, M. Tumor immune microenvironment during epithelial- mesenchymal transition. Clin. Cancer Res. 2021, 27, 4669–4679. [Google Scholar] [CrossRef] [PubMed]
  23. Pickup, M.; Novitskiy, S.; Moses, H.L. The roles of TGFβ in the tumour microenvironment. Nat. Rev. Cancer 2013, 13, 788–799. [Google Scholar] [CrossRef] [PubMed]
  24. Suzuki, H.I. MicroRNA control of TGF-β signaling. Int. J. Mol. Sci. 2018, 19, 1901. [Google Scholar] [CrossRef] [PubMed]
  25. Zhang, J.; Tian, X.J.; Zhang, H.; Teng, Y.; Li, R.; Bai, F.; Elankumaran, S.; Xing, J. TGF-β-induced epithelial-to-mesenchymal transition proceeds through stepwise activation of multiple feedback loops. Sci. Signal. 2014, 7, ra91. [Google Scholar] [CrossRef] [PubMed]
  26. Terry, S.; Savagner, P.; Ortiz-Cuaran, S.; Mahjoubi, L.; Saintigny, P.; Thiery, J.P.; Chouaib, S. New insights into the role of EMT in tumor immune escape. Mol. Oncol. 2017, 11, 824–846. [Google Scholar] [CrossRef] [PubMed]
  27. Mohler, J.L.; Antonarakis, E.S.; Armstrong, A.J.; D’Amico, A.V.; Davis, B.J.; Dorff, T.; Eastham, J.A.; Enke, C.A.; Farrington, T.A.; Higano, C.S.; et al. Prostate Cancer, Version 2.2019, NCCN Clinical Practice Guidelines in Oncology. J. Natl. Compr. Canc. Netw. 2019, 17, 479–505. [Google Scholar] [CrossRef] [PubMed]
  28. Lautert-Dutra, W.; Melo, C.M.; Chaves, L.P.; Souza, F.C.; Crozier, C.; Sundby, A.E.; Woroszchuk, E.; Saggioro, F.P.; Avante, F.S.; dos Reis, R.B.; et al. Identification of tumor-agnostic biomarkers for predicting prostate cancer progression and biochemical recurrence. Front. Oncol. 2023, 13, 1280943. [Google Scholar] [CrossRef]
  29. Cooperberg, M.R.; Hilton, J.F.; Carroll, P.R. The CAPRA-S score: A straightforward tool for improved prediction of outcomes after radical prostatectomy. Cancer 2011, 22, 5039–5046. [Google Scholar] [CrossRef]
  30. Bayani, J.; Yao, C.Q.; Quintayo, M.A.; Yan, F.; Haider, S.; DCosta, A.; Brookes, C.L.; Van De Velde, C.J.H.; Hasenburg, A.; Kieback, D.G.; et al. Molecular stratification of early breast cancer identifies drug targets to drive stratified medicine. NPJ Breast Cancer 2017, 3, 3. [Google Scholar] [CrossRef]
  31. Patel, P.G.; Selvarajah, S.; Guérard, K.P.; Bartlett, J.M.S.; Lapointe, J.; Berman, D.M.; Okello, J.B.A.; Park, P.C. Reliability and performance of commercial RNA and DNA extraction kits for FFPE tissue cores. PLoS ONE 2017, 12, 0179732. [Google Scholar] [CrossRef]
  32. Goytain, A.; Ng, T. NanoString nCounter Technology: High-Throughput RNA Validation. In Chimeric RNA. Methods in Molecular Biology; Li, H., Elfman, J., Eds.; Humana: New York, NY, USA, 2020; pp. 125–139. ISBN 978-1-4939-9903-3. [Google Scholar]
  33. Olkhov-Mitsel, E.; Hodgson, A.; Liu, S.K.; Vesprini, D.; Bayani, J.; Bartlett, J.; Xu, B.; Downes, M.R. Immune gene expression profiles in high-grade urothelial carcinoma of the bladder: A NanoString study. J. Clin. Pathol. 2021, 74, 53–57. [Google Scholar] [CrossRef] [PubMed]
  34. Love, M.I.; Huber, W.; Anders, S. Moderated estimation of fold change and dispersion for RNA-seq data with DESeq2. Genome Biol. 2014, 15, 550. [Google Scholar] [CrossRef]
  35. Wu, T.; Hu, E.; Xu, S.; Chen, M.; Guo, P.; Dai, Z.; Feng, T.; Zhou, L.; Tang, W.; Zhan, L.; et al. clusterProfiler 4.0: A universal enrichment tool for interpreting omics data. Innovation 2021, 2, 100141. [Google Scholar] [CrossRef]
  36. Thorsson, V.; Gibbs, D.L.; Brown, S.D.; Wolf, D.; Bortone, D.S.; Ou Yang, T.H.; Porta-Pardo, E.; Gao, G.F.; Plaisier, C.L.; Eddy, J.A.; et al. The Immune Landscape of Cancer. Immunity 2018, 48, 812–830.e14. [Google Scholar] [CrossRef] [PubMed]
  37. Chen, B.; Khodadoust, M.S.; Liu, C.L.; Newman, A.M.; Alizadeh, A.A. Profiling tumor infiltrating immune cells with CIBERSORT. Methods Mol. Biol. 2018, 1711, 243–259. [Google Scholar] [CrossRef] [PubMed]
  38. Angel, P.M.; Spruill, L.; Jefferson, M.; Bethard, J.R.; Ball, L.E.; Hughes-Halbert, C.; Drake, R.R. Zonal regulation of collagen-type proteins and posttranslational modifications in prostatic benign and cancer tissues by imaging mass spectrometry. Prostate 2020, 80, 1071–1086. [Google Scholar] [CrossRef]
  39. Szabo, P.M.; Vajdi, A.; Kumar, N.; Tolstorukov, M.Y.; Chen, B.J.; Edwards, R.; Ligon, K.L.; Chasalow, S.D.; Chow, K.H.; Shetty, A.; et al. Cancer-associated fibroblasts are the main contributors to epithelial-to-mesenchymal signatures in the tumor microenvironment. Sci. Rep. 2023, 13, 3051. [Google Scholar] [CrossRef] [PubMed]
  40. Georgescu, I.; Gooding, R.J.; Doiron, R.C.; Day, A.; Selvarajah, S.; Davidson, C.; Berman, D.M.; Park, P.C. Molecular characterization of Gleason patterns 3 and 4 prostate cancer using reverse Warburg effect-associated genes. Cancer Metab. 2016, 4, 8. [Google Scholar] [CrossRef]
  41. Sun, Y.; Zhu, D.; Chen, F.; Qian, M.; Wei, H.; Chen, W.; Xu, J. SFRP2 augments WNT16B signaling to promote therapeutic resistance in the damaged tumor microenvironment. Oncogene 2016, 35, 4321–4334. [Google Scholar] [CrossRef]
  42. van Loon, K.; Huijbers, E.J.M.; Griffioen, A.W. Secreted frizzled-related protein 2: A key player in noncanonical Wnt signaling and tumor angiogenesis. Cancer Metast. Rev. 2021, 40, 191–203. [Google Scholar] [CrossRef] [PubMed]
  43. Hou, Y.; Li, H.; Huo, W. THBS4 silencing regulates the cancer stem cell-like properties in prostate cancer via blocking the PI3K/Akt pathway. Prostate 2020, 80, 753–763. [Google Scholar] [CrossRef] [PubMed]
  44. Chen, L.; De Menna, M.; Groenewoud, A.; Thalmann, G.N.; Kruithof-de Julio, M.; Snaar-Jagalska, B.E. A NF-ĸB-Activin A signaling axis enhances prostate cancer metastasis. Oncogene 2020, 39, 1634–1651. [Google Scholar] [CrossRef] [PubMed]
  45. Reader, K.L.; John-McHaffie, S.; Zellhuber-McMillan, S.; Jowett, T.; Mottershead, D.G.; Cunliffe, H.E.; Gold, E.J. Activin B and Activin C Have Opposing Effects on Prostate Cancer Progression and Cell Growth. Cancers 2023, 15, 147. [Google Scholar] [CrossRef] [PubMed]
  46. Han, Y.; Hu, H.; Zhou, J. Knockdown of LncRNA SNHG7 inhibited epithelial-mesenchymal transition in prostate cancer though miR-324-3p/WNT2B axis in vitro. Pathol. Res. Pract. 2019, 215, 152537. [Google Scholar] [CrossRef] [PubMed]
  47. Yimamu, Y.; Yang, X.; Chen, J.; Luo, C.; Xiao, W.; Guan, H.; Wang, D. The Development of a Gleason Score-Related Gene Signature for Predicting the Prognosis of Prostate Cancer. J. Clin. Med. 2022, 11, 7164. [Google Scholar] [CrossRef] [PubMed]
  48. Qing, Y.; Wang, Y.; Hu, C.; Zhang, H.; Huang, Y.; Zhang, Z.; Ma, T.; Zhang, S.; Li, K. Evaluation of NOTCH family genes’ expression and prognostic value in prostate cancer. Transl. Androl. Urol. 2022, 11, 627–642. [Google Scholar] [CrossRef]
  49. Liu, B.; Li, X.; Li, J.; Jin, H.; Jia, H.; Ge, X. Construction and Validation of a Robust Cancer Stem Cell-Associated Gene Set-Based Signature to Predict Early Biochemical Recurrence in Prostate Cancer. Dis. Markers 2020, 2020, 8860788. [Google Scholar] [CrossRef]
  50. Karanika, S.; Karantanos, T.; Li, L.; Wang, J.; Park, S.; Yang, G.; Zuo, X.; Song, J.H.; Maity, S.N.; Manyam, G.C.; et al. Targeting DNA Damage Response in Prostate Cancer by Inhibiting Androgen Receptor-CDC6-ATR-Chk1 Signaling. Cell Rep. 2017, 18, 1970–1981. [Google Scholar] [CrossRef]
  51. Bagherabadi, A.; Hooshmand, A.; Shekari, N.; Singh, P.; Zolghadri, S.; Stanek, A.; Dohare, R. Correlation of NTRK1 Downregulation with Low Levels of Tumor-Infiltrating Immune Cells and Poor Prognosis of Prostate Cancer Revealed by Gene Network Analysis. Genes 2022, 13, 840. [Google Scholar] [CrossRef]
  52. Erdogan, B.; Ao, M.; White, L.M.; Means, A.L.; Brewer, B.M.; Yang, L.; Washington, M.K.; Shi, C.; Franco, O.E.; Weaver, A.M.; et al. Cancer-associated fibroblasts promote directional cancer cell migration by aligning fibronectin. J. Cell Biol. 2017, 216, 3799–3816. [Google Scholar] [CrossRef]
  53. Su, Q.; Zhang, B.; Zhang, L.; Dang, T.; Rowley, D.; Ittmann, M.; Xin, L. Jagged1 upregulation in prostate epithelial cells promotes formation of reactive stroma in the Pten null mouse model for prostate cancer. Oncogene 2017, 36, 618–627. [Google Scholar] [CrossRef] [PubMed]
  54. Xiong, Z.; Ge, Y.; Xiao, J.; Wang, Y.; Li, L.; Ma, S.; Lan, L.; Liu, B.; Qin, B.; Luan, Y.; et al. GAS1RR, an immune-related enhancer RNA, is related to biochemical recurrence-free survival in prostate cancer. Exp. Biol. Med. 2023, 248, 1–13. [Google Scholar] [CrossRef] [PubMed]
  55. Du, Z.; Li, L.; Sun, W.; Zhu, P.; Cheng, S.; Yang, X.; Luo, C.; Yu, X.; Wu, X. Systematic Evaluation for the Influences of the SOX17/Notch Receptor Family Members on Reversing Enzalutamide Resistance in Castration-Resistant Prostate Cancer Cells. Front. Oncol. 2021, 11, 607291. [Google Scholar] [CrossRef] [PubMed]
  56. Vidal, A.C.; Duong, F.; Howard, L.E.; Wiggins, E.; Freedland, S.J.; Bhowmick, N.A.; Gong, J. Soluble endoglin (sCD105) as a novel biomarker for detecting aggressive prostate cancer. Anticancer Res. 2020, 40, 1459–1462. [Google Scholar] [CrossRef] [PubMed]
  57. Williams, K.A.; Lee, M.; Hu, Y.; Andreas, J.; Patel, S.J.; Zhang, S.; Chines, P.; Elkahloun, A.; Chandrasekharappa, S.; Gutkind, J.S.; et al. A Systems Genetics Approach Identifies CXCL14, ITGAX, and LPCAT2 as Novel Aggressive Prostate Cancer Susceptibility Genes. PLoS Genet. 2014, 10, e1004809. [Google Scholar] [CrossRef] [PubMed]
  58. Lv, D.; Wu, X.; Chen, X.; Yang, S.; Chen, W.; Wang, M.; Liu, Y.; Gu, D.; Zeng, G. A novel immune-related gene-based prognostic signature to predict biochemical recurrence in patients with prostate cancer after radical prostatectomy. Cancer Immunol. Immunother. 2021, 70, 3587–3602. [Google Scholar] [CrossRef] [PubMed]
  59. Ghotra, V.P.S.; He, S.; Van Der Horst, G.; Nijhoff, S.; De Bont, H.; Lekkerkerker, A.; Janssen, R.; Jenster, G.; Van Leenders, G.J.L.H.; Hoogland, A.M.M.; et al. SYK is a candidate kinase target for the treatment of advanced prostate cancer. Cancer Res. 2015, 75, 230–240. [Google Scholar] [CrossRef] [PubMed]
  60. Wightman, S.C.; Uppal, A.; Pitroda, S.P.; Ganai, S.; Burnette, B.; Stack, M.; Oshima, G.; Khan, S.; Huang, X.; Posner, M.C.; et al. Oncogenic CXCL10 signalling drives metastasis development and poor clinical outcome. Br. J. Cancer 2015, 113, 327–335. [Google Scholar] [CrossRef]
  61. Long, X.; Wu, L.; Zeng, X.; Wu, Z.; Hu, X.; Jiang, H.; Lv, Z.; Yang, C.; Cai, Y.; Yang, K.; et al. Biomarkers in previous histologically negative prostate biopsies can be helpful in repeat biopsy decision-making processes. Cancer Med. 2020, 9, 7524–7536. [Google Scholar] [CrossRef]
  62. Dębska-Zielkowska, J.; Moszkowska, G.; Zieliński, M.; Zielińska, H.; Dukat-Mazurek, A.; Trzonkowski, P.; Stefańska, K. KIR Receptors as Key Regulators of NK Cells Activity in Health and Disease. Cells 2021, 10, 1777. [Google Scholar] [CrossRef]
  63. True, L.D.; Zhang, H.; Ye, M.; Huang, C.Y.; Nelson, P.S.; Von Haller, P.D.; Tjoelker, L.W.; Kim, J.S.; Qian, W.J.; Smith, R.D.; et al. CD90/THY1 is overexpressed in prostate cancer-associated fibroblasts and could serve as a cancer biomarker. Mod. Pathol. 2010, 23, 1346–1356. [Google Scholar] [CrossRef]
  64. Bauman, T.M.; Becka, A.J.; Sehgal, P.D.; Huang, W.; Ricke, W.A. SIGIRR/TIR8, an important regulator of TLR4 and IL-1R-mediated NF-κB activation, predicts biochemical recurrence after prostatectomy in low-grade prostate carcinomas. Hum. Pathol. 2015, 46, 1744–1751. [Google Scholar] [CrossRef]
  65. Tuerff, D.; Muller, D.J.; Lap, C.J.G.; Liu, S.; Diao, G.; Antonio, M.; Nava, V.; Jain, M.R. The association of HLA-DR and PD-L1 expression with clinical characteristics in prostate. J. Clin. Oncol. 2023, 41, 17017. [Google Scholar] [CrossRef]
  66. Tse, B.W.C.; Volpert, M.; Ratther, E.; Stylianou, N.; Nouri, M.; McGowan, K.; Lehman, M.L.; McPherson, S.J.; Roshan-Moniri, M.; Butler, M.S.; et al. Neuropilin-1 is upregulated in the adaptive response of prostate tumors to androgen-targeted therapies and is prognostic of metastatic progression and patient mortality. Oncogene 2017, 36, 3417–3427. [Google Scholar] [CrossRef]
  67. Rouillard, A.D.; Gundersen, G.W.; Fernandez, N.F.; Wang, Z.; Monteiro, C.D.; McDermott, M.G.; Ma’ayan, A. The harmonizome: A collection of processed datasets gathered to serve and mine knowledge about genes and proteins. Database 2016, 2016, baw100. [Google Scholar] [CrossRef] [PubMed]
  68. Chaves, L.P.; Melo, C.M.; Saggioro, F.P.; Borges, R.; Squire, J.A. Epithelial—Mesenchymal Transition Signaling and Prostate Precision Therapeutics. Genes 2021, 12, 1900. [Google Scholar] [CrossRef]
  69. Kitz, J.; Lefebvre, C.; Carlos, J.; Lowes, L.E.; Allan, A.L. Reduced zeb1 expression in prostate cancer cells leads to an aggressive partial-emt phenotype associated with altered global methylation patterns. Int. J. Mol. Sci. 2021, 22, 12840. [Google Scholar] [CrossRef]
  70. Hanahan, D. Hallmarks of Cancer: New Dimensions. Cancer Discov. 2022, 12, 31–46. [Google Scholar] [CrossRef] [PubMed]
  71. Cox, T.R. The matrix in cancer. Nat. Rev. Cancer 2021, 21, 217–238. [Google Scholar] [CrossRef]
  72. Meng, F.; Han, X.; Min, Z.; He, X.; Zhu, S. Prognostic signatures associated with high infiltration of Tregs in bone metastatic prostate cancer. Aging 2021, 13, 17442–17461. [Google Scholar] [CrossRef] [PubMed]
  73. Zhang, H.; Ding, C.; Li, Y.; Xing, C.; Wang, S.; Yu, Z.; Chen, L.; Li, P.; Dai, M. Data mining-based study of collagen type III alpha 1 (COL3A1) prognostic value and immune exploration in pan-cancer. Bioengineered 2021, 12, 3634–3646. [Google Scholar] [CrossRef] [PubMed]
  74. Nagaraja, A.S.; Dood, R.L.; Armaiz-Pena, G.; Kang, Y.; Wu, S.Y.; Allen, J.K.; Jennings, N.B.; Mangala, L.S.; Pradeep, S.; Lyons, Y.; et al. Adrenergic-mediated increases in INHBA drive CAF phenotype and collagens. JCI Insight 2017, 2, e93076. [Google Scholar] [CrossRef] [PubMed]
  75. Li, X.; Huang, H.; Zhang, J.; Jiang, F.; Guo, Y.; Shi, Y.; Guo, Z.; Ao, L. A qualitative transcriptional signature for predicting the biochemical recurrence risk of prostate cancer patients after radical prostatectomy. Prostate 2020, 80, 376–387. [Google Scholar] [CrossRef] [PubMed]
  76. Shak, S.; Lee, M.; Novotny, W.; Maddala, T.; Crager, M.; Cherbavaz, D.; Pelham, R.; Millward, C.L.; Knezevic, D. Gene Expression Profile Algorithm and Test for Determining Prognosis of Prostate Cancer. AU2018201688A1, 27 February 2020. [Google Scholar]
  77. Yin, W.; Zhu, H.; Tan, J.; Xin, Z.; Zhou, Q.; Cao, Y.; Wu, Z.; Wang, L.; Zhao, M.; Jiang, X.; et al. Identification of collagen genes related to immune infiltration and epithelial-mesenchymal transition in glioma. Cancer Cell Int. 2021, 21, 276. [Google Scholar] [CrossRef] [PubMed]
  78. Lee, E.; Wang, J.; Yumoto, K.; Jung, Y.; Cackowski, F.C.; Decker, A.M.; Li, Y.; Franceschi, R.T.; Pienta, K.J.; Taichman, R.S. DNMT1 Regulates Epithelial-Mesenchymal Transition and Cancer Stem Cells, Which Promotes Prostate Cancer Metastasis. Neoplasia 2016, 18, 553–566. [Google Scholar] [CrossRef] [PubMed]
  79. Khalil, D.N.; Smith, E.L.; Brentjens, R.J.; Wolchok, J.D. The future of cancer treatment: Immunomodulation, CARs and combination immunotherapy. Nat. Rev. Clin. Oncol. 2016, 13, 273–290. [Google Scholar] [CrossRef] [PubMed]
  80. Renaude, E.; Kroemer, M.; Borg, C.; Peixoto, P.; Hervouet, E.; Loyon, R.; Adotévi, O. Epigenetic Reprogramming of CD4+ Helper T Cells as a Strategy to Improve Anticancer Immunotherapy. Front. Immunol. 2021, 12, 669992. [Google Scholar] [CrossRef]
  81. Erlandsson, A.; Carlsson, J.; Lundholm, M.; Fält, A.; Andersson, S.O.; Andrén, O.; Davidsson, S. M2 macrophages and regulatory T cells in lethal prostate cancer. Prostate 2019, 79, 363–369. [Google Scholar] [CrossRef]
  82. Xie, H.; Li, C.; Dang, Q.; Chang, L.S.; Li, L. Infiltrating mast cells increase prostate cancer chemotherapy and radiotherapy resistances via modulation of p38/p53/p21 and ATM signals. Oncotarget 2016, 7, 1341–1353. [Google Scholar] [CrossRef]
  83. Huang, Y.; Hong, W.; Wei, X. The molecular mechanisms and therapeutic strategies of EMT in tumor progression and metastasis. J. Hematol. Oncol. 2022, 15, 129. [Google Scholar] [CrossRef] [PubMed]
Figure 1. NanoString profile of primary prostate cancer patients. (AD) Volcano plots of the DEGs stratified by BCR and CAPRA-S status for both transcriptome panels. (E,F) Venn diagrams represent the intersection of the DEGs from BCR and CAPRA-S for both transcriptome panels. The list of 39 significantly associated DEGs from both comparisons is displayed on the right side of both panels. Eleven of these DEGs (COL1A1, WNT2B, BMP8A, NTRK1, JAG1, DNMT1, CD14, GAS1, SIGIRR, IRF5, and SYK) marked with * were identified as target genes for the EMT transcription factor ZEB1 using the ENCODE transcription factor dataset that has all 8646 target genes of ZEB1 based on ChIP-seq [67]. Both clinical comparisons used no BCR and low CAPRA-S scores as references from the FMRP cohort. Adjusted p-value < 0.05 and a log2 fold change > 0.5. Data were plotted using ggplot2 and Venny (https://bioinfogp.cnb.csic.es/tools/venny/index.htm, accessed on 5 December 2023).
Cancers 16 01480 g001
Figure 2. Impact of ZEB1 expression on primary prostate cancer patients. (AD) Unsupervised heatmaps and Volcano plots showing the top 50 DEGs for patients expressing high levels of ZEB1 in the FMRP cohort (n = 51). Because the display software is limited by the area available for visualizing the top genes, not all significantly expressed DEGs are depicted in the Volcano plots. (E) The Kaplan–Meier plot shows that a low level of ZEB1 expression is associated with a reduced recurrence-free interval (log-rank test, p = 0.04). Adjusted p-value < 0.05 and a log2 fold change > 0.5. Data were plotted using pheatmap and ggplot2.
Cancers 16 01480 g002
Figure 3. Impact of SNAI1 expression on primary prostate cancer patients. (AD) Unsupervised heatmaps and Volcano plots showing the top 50 DEGs for patients expressing high levels of SNAI1 in the FMRP cohort (n = 51). (E) The Kaplan–Meier plot shows that the recurrence interval is not affected by levels of SNAI1 (log-rank test, p = 0.85) in the FMRP cohort. Adjusted p-value < 0.05 and a log2 fold change > 0.5. Data were plotted using pheatmap.
Cancers 16 01480 g003
Figure 4. Effects of a high and low expression of EMT transcription factors on the relative abundance of immune cells in the TME of the PRAD-TCGA cohort. Deconvolution-based digital cytometry shows that expression levels of EMT transcription factors influence the relative abundance of immune cell content in the TME. (A) The high ZEB1 group showed an increased abundance of naïve B cells, resting memory CD4+ T cells, and M2 macrophages, and a decreased abundance of memory B cells, CD8 T cells, follicular T helper cells, monocytes, and M0 macrophages. (B) SNAI1 shows an increased abundance of naïve B cells, resting dendritic cells, and activated mast cells, and a decreased abundance of resting mast cells. Results derived from public domain data (TCGA-PRAD). * p-value < 0.05; ** p-value < 0.01; *** p-value < 0.001 by Mann–Whitney test.
Cancers 16 01480 g004
Table 1. Ranked list of the DEGs associated with BCR and CAPRA-S based on the PanCancer Panel using the FMRP cohort. The roles of each of the top-ranking DEGs in the cancer progression and PCa literature are shown with specific citations (if available). Adjusted p-value < 0.05 and a log2 fold change > 0.5.
GeneLog2 FCpadjProteinRole in Progression and Biology of PCaCitations
BCRCOL1A10.876>0.001collagen type I alpha 1 chainCollagens contribute to the ECM, which are the major structural components of the TME. COL1A1, COL1A2, and COL3A1 expression in CAFs have been associated with the EMT. COL1A1 expression is upregulated in PCa stromal cells and was associated with a worse prognosis in PCa.[38,39]
COL3A10.879>0.001collagen type III alpha 1 chain COL3A1 interacts with fibronectin. Increased expression of COL3A1 in PCa activates other pro-tumorigenic genes and pathways, such as the Wnt/beta-catenin. COL3A1 expression is associated with higher Gleason scores, higher PSA levels, and a higher likelihood of lymph node involvement.[38]
COL1A20.596>0.001collagen type I alpha 2 chain COL1A2 expression is associated with higher Gleason scores.[40]
COL5A20.479>0.001collagen type V alpha 2 chain COL5A2 expression has been associated with increased tumor cell invasion and resistance to androgen deprivation therapy.[40]
SFRP20.7610.004secreted frizzled-related protein 2 SFRP2 affects TME by regulating Wnt signaling and influencing tumor angiogenesis.[41,42]
THBS40.8520.007thrombospondin 4 THBS4 affects cancer stem cell-like properties in PCa by its regulation of the PI3K/Akt pathway.[43]
INHBA0.7660.008inhibin beta A subunit INHBA (Activin A) activates NF-κB and is associated with a higher Gleason score PCa.[44,45]
WNT2B0.5670.02Wnt family member 2B WNT2B is regulated by lncRNAs to influence the EMT in PCa.[46]
SFRP40.73490.03secreted frizzled-related protein 4 SFRP4 predicts BCR in PCa and is associated with the EMT.[47]
CAPRA-SNOTCH30.6882>0.001notch 3 NOTCH1-4 expression was associated with disease progression, prognosis, and immune cell infiltration.[48]
BMP8A0.81670.006bone morphogenetic protein 8a BMPs are members of the TGF-beta family and are thought to be involved in PCa bone metastasis.[49]
CHEK10.88510.01checkpoint kinase 1 CHEK1 (CHK1) is associated with DNA damage response and AR signaling.[50]
COL3A10.88220.01collagen type III alpha 1 chain see above
NTRK1−1.0450.01neurotrophic receptor tyrosine kinase 1 NTRK1 downregulation is associated with reduced TILs in the TME of PCa and poor prognosis.[51]
FN10.6860.01fibronectin 1 FN1 is a key component of the ECM, and the TME is associated with collagens and CAFs. [52]
JAG10.6970.02jagged 1 JAG1 upregulation results in increased inflammatory foci in the TME of tumors in Pten-deficient mice.[53]
INHBA0.9050.02inhibin beta A subunit See above.
CD140.5920.04CD14 molecule CD14 is mostly expressed in macrophages. --
GAS1−0.6060.04growth arrest-specific 1 GAS1RR (an immune-related enhancer RNA) represses GAS1 and is associated with BR-free survival in PCa.[54]
SOX17−0.5610.04SRY-box 17 SOX17 and Notch’s axis associated with enzalutamide resistance in CRPC models.[55]
Table 2. Ranked list of the DEGs associated with BCR and CAPRA-S based on the Immune Profiling Panel using the FMRP. The roles of each of the top-ranking DEGs in immune oncology and the PCa literature are shown with specific citations (if available). Adjusted p-value < 0.05 and a log2 fold change > 0.5.
GeneLog2 FCpadjProteinRole in Immune Oncology and PCa Citations
BCRCOL3A11.027>0.001collagen type III alpha 1 chain See Table 1.
ENG0.5560.001endoglin Endoglin (sCD105) in plasma associated with aggressive PCa.[56]
CXCL141.2910.002C-X-C motif chemokine ligand 14 CXAL14 expression associated with outcome in PCa. [57]
SH2D1A−0.0450.005SH2 domain containing 1A Stimulation factor for T and B cells.--
IRF50.4780.01interferon regulatory factor 5 IRF5 expression used for BCR prediction in PCa.[58]
SYK0.5060.02spleen associated tyrosine kinase Associated with metastatic PCa.[59]
ICOS0.2310.03inducible T cell costimulator ICOS + Treg cells exert immunosuppressive effects.--
CAPRA-SCXCL101.5490.003C-X-C motif chemokine ligand 10 CXCL10 co-expression with CXCR3 is a predictor of metastatic recurrence.[60]
FCGR2A0.6690.003Fc fragment of IgG receptor IIa Expressed in macrophages, neutrophils, and other immune cells.--
MSR10.8040.003macrophage scavenger receptor 1 Helpful as an additional diagnostic biomarker for PCa.[61]
CD840.6180.004CD84 molecule Expressed in numerous immune cell types.--
KIR Activating
Subgroup 1
−0.980.01killer cell immunoglobulin-like receptors KIRs expressed in NK and T cells.[62]
THY10.6310.01Thy-1 cell surface antigen THY1 overexpressed in PCa-associated fibroblasts.[63]
SIGIRR0.4590.02single Ig and TIR domain containing TLR4 and IL-1R-mediated NF-kB activation associated with BCR.[64]
HLA-DRA0.6360.02major histocompatibility complex, class II, DR alpha Antigen presentation in the TME.[65]
NRP10.5340.02neuropilin 1 Androgen-repressed gene upregulated by ADT in advanced PCa.[66]
COL3A10.8650.03collagen type III alpha 1 chain See Table 1.
IFNL1−0.660.04interferon lambda 1 Interferon lambda 1 is involved in antiviral immune defense.--
CD140.5280.04CD14 molecule CD14 is mostly expressed in macrophages.--
FN10.5700.04fibronectin 1 See Table 1.
Table 3. Enrichment analysis from DEGs associated with SNAI1 High expression in the HC-FMRP cohort. List of ORA enriched pathways using MSigDb Hallmark’s terms for DEGs associated with high expression of SNAI1. The analysis used patients with low expression of SNAI1 as a reference.
TermAdjusted p-ValueGenes
Immune Profiling
TNF-alpha Signaling via NF-kB>0.001EGR2; CDKN1A; CSF1; CD80; TNFRSF9; LIF; PLAUR; TNFAIP3; NFKB1; ICAM1; NFKB2; RELB; NFKBIA; BCL6; PLAU; IL1B; REL; CCL2; ICOSLG; CD44
Inflammatory Response>0.001CDKN1A; IL4R; CSF1; TNFRSF9; IL10RA; LIF; PLAUR; ICAM4; TNFRSF1B; NFKB1; ICAM1; NFKBIA; MARCO; IRAK2; AXL; IL1B; IRF7; CCL2; ITGA5; ICOSLG
Allograft Rejection>0.001CD86; CCR1; IL11; IL4R; CSF1; CD80; LIF; GZMB; ETS1; ICAM1; NCR1; CD8A; IL1B; IL9; CD7; IRF7; STAT4; CCL2; IL12A; ICOSLG
Interferon-Gamma Response>0.001CD86; CD274; CDKN1A; IL4R; VCAM1; IL10RA; TNFAIP3; NFKB1; ICAM1; NFKBIA; IRF7; STAT4; TXNIP; CCL2
IL-2/STAT5 Signaling>0.001CD86; IL4R; CSF1; TNFRSF9; IL10RA; LIF; ITGAE; TNFRSF1B; MAPKAPK2; TNFSF11; CTLA4; ICOS; CD44
IL-6/JAK/STAT3 Signaling>0.001CCR1; IL4R; CSF1; TNFRSF12A; IL1B; TNFRSF1B; CD44; TNFRSF1A
KRAS Signaling Up>0.001PLAU; ITGA2; IL1B; IL10RA; LIF; PLAUR; TNFAIP3; TNFRSF1B; ETS1
Coagulation>0.001THBD; C8G; PLAU; ITGA2; C8A; THBS1; SH2B2
Epithelial–Mesenchymal Transition>0.001VCAM1; TNFRSF12A; ITGA2; PLAUR; TNFAIP3; ITGA5; THBS1; CD44
Apical Junction>0.001CD86; CD274; VCAM1; ITGA2; ICAM4; CD34; ICAM1
Apoptosis0.005CDKN1A; TNFRSF12A; IL1B; TXNIP; CD44
Interferon-Alpha Response0.005IL4R; CSF1; IRF7; TXNIP
PanCancer
TNF-alpha Signaling via NF-kB>0.001DUSP5; CDKN1A; GADD45A; LIF; TNFAIP3; ETS2; FOSL1; NR4A3; PLAU; CLCF1; ID2; IL1B; MAP3K8
Epithelial–Mesenchymal Transition>0.001GADD45A; ITGA2; ID2; MMP3; TNFAIP3; LAMC2; THBS1; DKK1
KRAS Signaling Up>0.001PLAU; ITGA2; ID2; IL1B; LIF; TNFAIP3; PLAT; NGF
Coagulation>0.001PLAU; ITGA2; MMP3; PLAT; THBS1
Apoptosis>0.001CDKN1A; WEE1; GADD45A; IL1B; PLAT
Complement>0.001DUSP5; PIM1; TNFAIP3; GZMB; PLAT
p53 Pathway>0.001CDKN1A; GADD45A; LIF; SFN; EPHA2
IL-6/JAK/STAT3 Signaling0.002IL1B; PIM1; MAP3K8
IL-2/STAT5 Signaling0.002SPRY4; PIM1; LIF; MAP3K8
Inflammatory Response0.002CDKN1A; IL1B; LIF; OSM
Allograft Rejection0.002IL11; IL1B; LIF; GZMB
PI3K/AKT/mTOR Signaling0.003CDKN1A; SFN; NGF
TGF-beta Signaling0.01ID2; THBS1
Hypoxia0.01CDKN1A; PIM1; TNFAIP3
Estrogen Response Late0.01ID2; LAMC2; SFN
Interferon-Gamma Response0.01CDKN1A; PIM1; TNFAIP3
E2F Targets0.01CDKN1A; WEE1; HMGA1
Xenobiotic Metabolism0.01ID2; ETS2; EPHA2
Disclaimer/Publisher’s Note: The statements, opinions and data contained in all publications are solely those of the individual author(s) and contributor(s) and not of MDPI and/or the editor(s). MDPI and/or the editor(s) disclaim responsibility for any injury to people or property resulting from any ideas, methods, instructions or products referred to in the content.

