Article

A Matter of Margins in Oral Cancer—How Close Is Enough?

by
Mateusz Szewczyk
1,2,*,
Jakub Pazdrowski
1,2,
Piotr Pieńkowski
1,2,
Bartosz Wojtera
1,2,
Barbara Więckowska
3,
Paweł Golusiński
4 and
Wojciech Golusiński
1,2
1
Department of Head and Neck Surgery, Poznań University of Medical Sciences, 61-701 Poznań, Poland
2
The Greater Poland Cancer Center, 61-866 Poznań, Poland
3
Department of Computer Science and Statistics, Poznań University of Medical Sciences, 61-701 Poznań, Poland
4
Department of Otolaryngology and Maxillofacial Surgery, University of Zielona Góra, 65-417 Zielona Góra, Poland
*
Author to whom correspondence should be addressed.
Cancers 2024, 16(8), 1488; https://doi.org/10.3390/cancers16081488
Submission received: 21 March 2024 / Revised: 7 April 2024 / Accepted: 11 April 2024 / Published: 12 April 2024
(This article belongs to the Special Issue Head and Neck Cancer Metastases)

Abstract

:

Simple Summary

In patients with oral cancer, the risk factors for local, regional, and distant recurrence according to margin status have not been well established. The aims of the present study were to identify a margin cut-off point for improved survival in patients with close margins. A retrospective review of adult patients treated surgically at our centre for primary oral cavity squamous cell cancer from 2009 to 2021 was carried out. Margins (mucosal and deep) were classified as positive (<1 mm), close (1 to 4.9 mm), or clear (>5 mm). A total of 326 patients (210 men; 64.4%) were included. Margin status was as follows: close (n = 168, 51.5%), clear (n = 83, 25.4%), and positive (n = 75, 23.0%). The optimal cut-off for disease-free survival was a deep margin > 3 mm. In the close margin group, survival was significantly better in patients with a deep margin > 3 mm. Moreover, in this subset of patients, survival was comparable to the outcomes observed in patients with clear margins, suggesting that surgical margins smaller than the standard cut-off (5 mm) may be sufficient in certain well-defined cases.

Abstract

In patients with oral cancer, the risk factors for local, regional, and distant recurrence according to margin status have not been well established. We aimed to determine the risk factors for recurrence by margin status and to identify a margin cut-off point for improved survival in patients with close margins. We retrospectively reviewed adult patients treated at our centre from 2009 to 2021 for primary oral cancer. Margins were classified as positive (<1 mm), close (1 to 4.9 mm), or clear (>5 mm). Univariate and multivariate analyses were performed. A total of 326 patients (210 men) were included. The mean age was 59.1 years. Margin status was close (n = 168, 51.5%), clear (n = 83, 25.4%), or positive (n = 75, 23.0%). In the univariate analysis, positive surgical margins (HR = 7.53) had the greatest impact on distant failure. Positive surgical margins—without nodal involvement—had the greatest impact on the risk of distant failure. In the close margin group, the optimal cut-off for disease-free survival (AUC = 0.58) and overall survival (AUC = 0.63) was a deep margin > 3 mm, with survival outcomes that were comparable to the clear margin group. These finding suggest that margins < 5 mm may be sufficient in certain well-defined cases. Prospective studies are warranted to confirm these findings.

1. Introduction

Oral cancer is the most common type of head and neck cancer [1,2]. In most cases, the treatment of choice is surgical resection of the primary tumour with negative resection margins [3,4]. Positive surgical margins are one of the main risk factors for recurrence following surgery, which is why complete resection with a sufficient surgical margin is essential to avoid treatment failure [5,6]. While it is clear that a sufficient surgical margin is essential to ensure local control, the definition of clear margins has long been controversial. In oral cancer, the most widely accepted clearance margin is 5 mm, as supported by a study carried out by the Royal College of Pathologists (RCP) [7] and a survey of head and neck surgeons conducted by the American Head and Neck Society (AHNS) [8]. The definition of a “close” margin is also challenging, but most scientific societies—including the RCP, the AHNS, and the European Head and Neck Society (EHNS) [9]—define this as a margin from 1 to 5 mm.
Margin status is important because it determines the indication for adjuvant treatment. Moreover, several studies have suggested that smaller margins (i.e., ≤5 mm) may not significantly influence overall survival or local recurrence [10,11,12,13,14]. One recent study found that clinical outcomes in patients with surgical margins > 1 mm were comparable to those observed in patients with margins > 5 mm [15]. Although adjuvant treatment (radiotherapy or chemoradiotherapy) is generally indicated in patients with close margins, good oncological outcomes can be achieved in well-selected patients without adjuvant treatment [16]. Patients with close margins represent a highly heterogenous subgroup, with some patients presenting more adverse clinicopathological features than others [12,17,18]. In fact, the data show that some patients with close margins achieve clinical outcomes that are similar to those observed in patients with clear margins, whereas others experience outcomes that are more in line with those found in patients with involved margins [19,20]. While numerous factors play a role in determining treatment outcomes in patients with close margins, there is little doubt that the surgical margin is a key factor [15]. However, as the findings of the studies described above indicate, margins < 5 mm may be sufficient in some cases. In this regard, it would be valuable to identify a cut-off point that would differentiate between patients with close margins in terms of better or worse survival.
In patients with oral cancer, the risk factors for local, regional, and distant recurrence according to margin status have not been well established. In this context, we conducted the present retrospective study to determine the risk factors for recurrence according to margin status and to identify a margin cut-off point for improved survival in patients with close margins.

2. Materials and Methods

This was a retrospective review of adult patients (age 18 or older) treated surgically for primary oral cavity squamous cell cancer (OCSCC) from 2009 to 2021 at our institution. Due to the retrospective nature of the study, approval from the ethics committee was not required.
We included all patients who underwent primary surgery for OCSCC ± adjuvant treatment during the study period except for those who met any of the following exclusion criteria: recurrent OCSCC; second primary malignancy; synchronous primary malignancy; follow up < 24 months (unless recurrence or death occurred earlier); and primary treatment other than surgery.
We evaluated the following variables: demographics (age, sex, smoking status, and general health status [Charlson Comorbidity Index]) and pathologic factors (T stage; N stage; disease stage; primary tumour margin status; perineural invasion (PNI); lymphovascular invasion (LVI); extranodal extension (ENE); and adjuvant treatment [radiotherapy or chemoradiotherapy]).
All patients underwent surgical resection (en bloc intent) with a macroscopically-free (1 cm) tumour margin resection. Based on the patient’s preoperative tumour stage and diagnostic evaluation, simultaneous neck dissection was carried out when indicated. Frozen section margin evaluation was performed in all cases. In patients with positive margins, the tumour bed was re-resected, but the patient was still treated as if the final margin was positive.
Tumours were staged according to the 7th edition of the American Joint Committee on Cancer (AJCC) [21]. Re-staging could not be performed because most of the histopathologic reports did not provide data on the depth of invasion. All patients were presented to a multidisciplinary tumour board to determine the indication for adjuvant treatment (standard radiotherapy protocol was 60–66 Gy administered daily Monday–Friday for 6 to 7 weeks; the chemotherapy regimen consisted of single-agent cisplatin (100 mg/m2) administered every 3 weeks). Recurrences were documented based on clinical, histopathological, and/or radiological examination. Failure was classified as local, regional, or distant. New tumours located ≥ 2 cm from the primary tumour were classified as second primary tumours. Disease-free survival (DFS) was defined as the time elapsed (in months) from the date of surgery until recurrence. Overall survival (OS) was defined as the time from the date of surgery to the last follow up or death.
Data on the surgical margins—including the distance to the closest margin, the mucosal margin, and the deep margin—were extracted from the pathological reports. Margins were classified as positive (<1 mm), close (1 to 4.9 mm), or clear (>5 mm).

Statistical Analysis

We used the Cox proportional hazards model to assess the association between risk factors and DFS and OS. This analysis was performed twice. First, we determined the crude hazard ratio (HR) with 95% confidence intervals (CI). Then, on a multivariate analysis, we adjusted the HR for the other variables analysed. To avoid redundancy, we excluded from the corrected model all variables that were highly correlated (C-Pearson’s correlation coefficient > 0.5). The Kaplan–Meier curves are shown in the figures. The distribution of risk factors according to surgical margin status (positive, close, clear) was compared using the chi-square test with the Benjamini–Hochberg correction for multiple comparisons. In the close margin group, we created receiver operating characteristic (ROC) curves for DFS (to evaluate recurrence) and OS (to evaluate mortality). The ROC curves were used to assess the possibility of determining the optimal cut-off point according to margin size. The size of the AUC was examined by DeLong’s method. For statistically significant results, we determined the cut-off point based on the Youden index. We then compared the survival curves according to margin status for this “optimal” cut-off point (<3 mm) for four curves: clear, close (≤ or > the cut-off point), and positive margins. For this comparison, we used the log-rank test with HR and 95% CI. A significance level of alpha = 0.05 was used for the analyses. The PQStat (v1.8.6) and R (v4.3.3; survminer package) software packages were used for all calculations.

3. Results

3.1. Demographic Data

The final analysis included 326 patients, most of whom were males (n = 210, 64%). The mean age of the sample was 59.1 years (range, 23–97). Most patients were active smokers (n = 190; 60%).
The most common primary tumour sites were the tongue (n = 155; 47.5%) followed by the floor of mouth (n = 111; 34.0%). Adjuvant treatment was administered in 263 cases (80%); of these, 178 (54%) received radiotherapy alone and 85 (26%) received concurrent radiochemotherapy.
A total of 147 (45%) patients developed recurrent disease, which was distributed by location as follows: local (n = 53, 16.2%), regional (n = 33, 10.1%), locoregional (n = 17, 5.2%), distant (n = 21, 6.4%), and locoregional/distant (n = 8, 2.4%). Fifteen patients (4.6%) developed a second primary tumour.
The margin status in the 326 patients was as follows: positive (n = 75, 23.0%), close (n = 168, 51.5%), and clear (n = 83, 25.4%). In patients with close margins, the mean mucosal margin was 2.98 mm (standard deviation [SD], 1.67) and the mean deep margin was 3.27 mm (SD: 2.05).
The clinical and demographic data of the sample are shown in Table 1. Figure 1 and Figure 2 show the Kaplan–Meier curves with DFS and OS stratified by margin status.

3.2. Risk Factors for Local, Regional, and Distant Recurrence

Table 2 shows the results of the univariate and multivariate analyses of risk factors for recurrence. Importantly, the risk of local recurrence was statistically significant only in patients with positive margins (HR = 2.75) but not in those with close or clear margins. Similarly, positive margins (but not close or clear margins) were a significant risk factor for both regional and distant recurrence (HR = 2.56 and HR = 7.53, respectively).

3.3. Local Recurrence

In the univariate analysis, the risk of local recurrence was highest in patients with nodal disease (HR = 3.54), advanced disease (HR = 3.32), positive margins (HR = 2.75), LVI (HR = 2.94), PNI (HR = 2.09), ENE (HR = 1.91), and advanced T stage (hazard ratio [HR] = 1.75). Not smoking was protective for local recurrence (HR = 0.58). In the multivariate analysis, three variables remained statistically significant for local recurrence: nodal disease (HR = 3.39), advanced disease (HR = 3.37), and positive margins (HR = 2.02).

3.4. Regional Recurrence

In the univariate analysis, the following variables were associated with a greater risk of regional recurrence: LVI (HR = 3.67), nodal disease (HR = 3.66), advanced disease (HR = 3.6), PNI (HR = 3.58), ENE (HR = 2.82), positive surgical margins (HR = 2.56), and high tumour grade (HR = 2.16). Not smoking was a protective factor (HR = 0.53). In the multivariate analysis, four factors remained significant: nodal disease, advanced disease, PNI, and ENE.

3.5. Distant Recurrence

In the univariate analysis, the following variables were associated with a higher risk of distant recurrence: positive surgical margins (HR = 7.53), nodal disease (HR = 5.94), LVI (HR = 4.74), advanced disease (HR = 3.79), and ENE (HR = 3.46). Adjuvant treatment was a protective factor (HR = 0.13). In the multivariate analysis, nodal disease, LVI, and positive surgical margins all remained significant (Table 2).

3.6. Risk Factors for Recurrence Based on Margin Status (Positive, Close, or Clear)

Table 3 shows the clinical and tumour-related risk factors according to margin status. As the table shows, the percentage of patients with locally advanced disease was significantly higher in the positive margin group (33.3%) than in the close (19.6%; p = 0.0311) or clear margin groups (12.1%; p = 0.0039). Similarly, the percentage of patients with positive margins who presented nodal disease was also significantly greater (60%) than in the close margin (42.8%; p = 0.0135) or clear margin groups (26.5%; p = 0.0001). The positive margin group also had a significantly higher percentage of patients with ENE (29.3%) versus the close margin (17.2%; p = 0.0334) and clear margin groups (7.2%; p = 0.001). Other risk factors, including smoking status, higher grade of tumour, PNI, and LVI, were similar among these three subgroups (Table 3).
Figure 3, Figure 4 and Figure 5 show the Kaplan–Meier survival curves (DFS) for patients with local (Figure 3), regional (Figure 4), and distant (Figure 5) disease according to margin status (positive, close, clear). DFS was significantly worse in the positive margin group. No significant survival differences were observed between the close and clear margin groups.
Table 4 shows the risk factors for local, regional, and distant recurrence according to margin status. In the positive margin group, the risk of local recurrence was highest in patients with LVI (HR = 3.33), advanced disease (HR = 3.01), ENE (HR = 2.53), and nodal disease (HR = 2.45). Those same four risk factors, together with PNI (HR = 3.02) and smoking (HR = 2.8), were also significant risk factors for regional recurrence. The only significant risk factor for distant recurrence was smoking status (HR = 3.93) (Table 4).
In patents with close margins, the risk of local recurrence was highest in patients with nodal disease (HR = 3.42), advanced disease (HR = 2.83), and LVI (HR = 2.71). For regional recurrence, those same three factors plus PNI (HR = 4.66) were significant. For distant recurrence, nodal disease, advanced disease, and ENE (HR = 3.66) were all significant (Table 4).
Finally, in patients with clear margins, the only variables that were significant for a higher risk of local recurrence were nodal disease (HR = 4.08) and advanced disease (HR = 3.94). None of these risk factors were significant for regional or distant recurrence (Table 4).

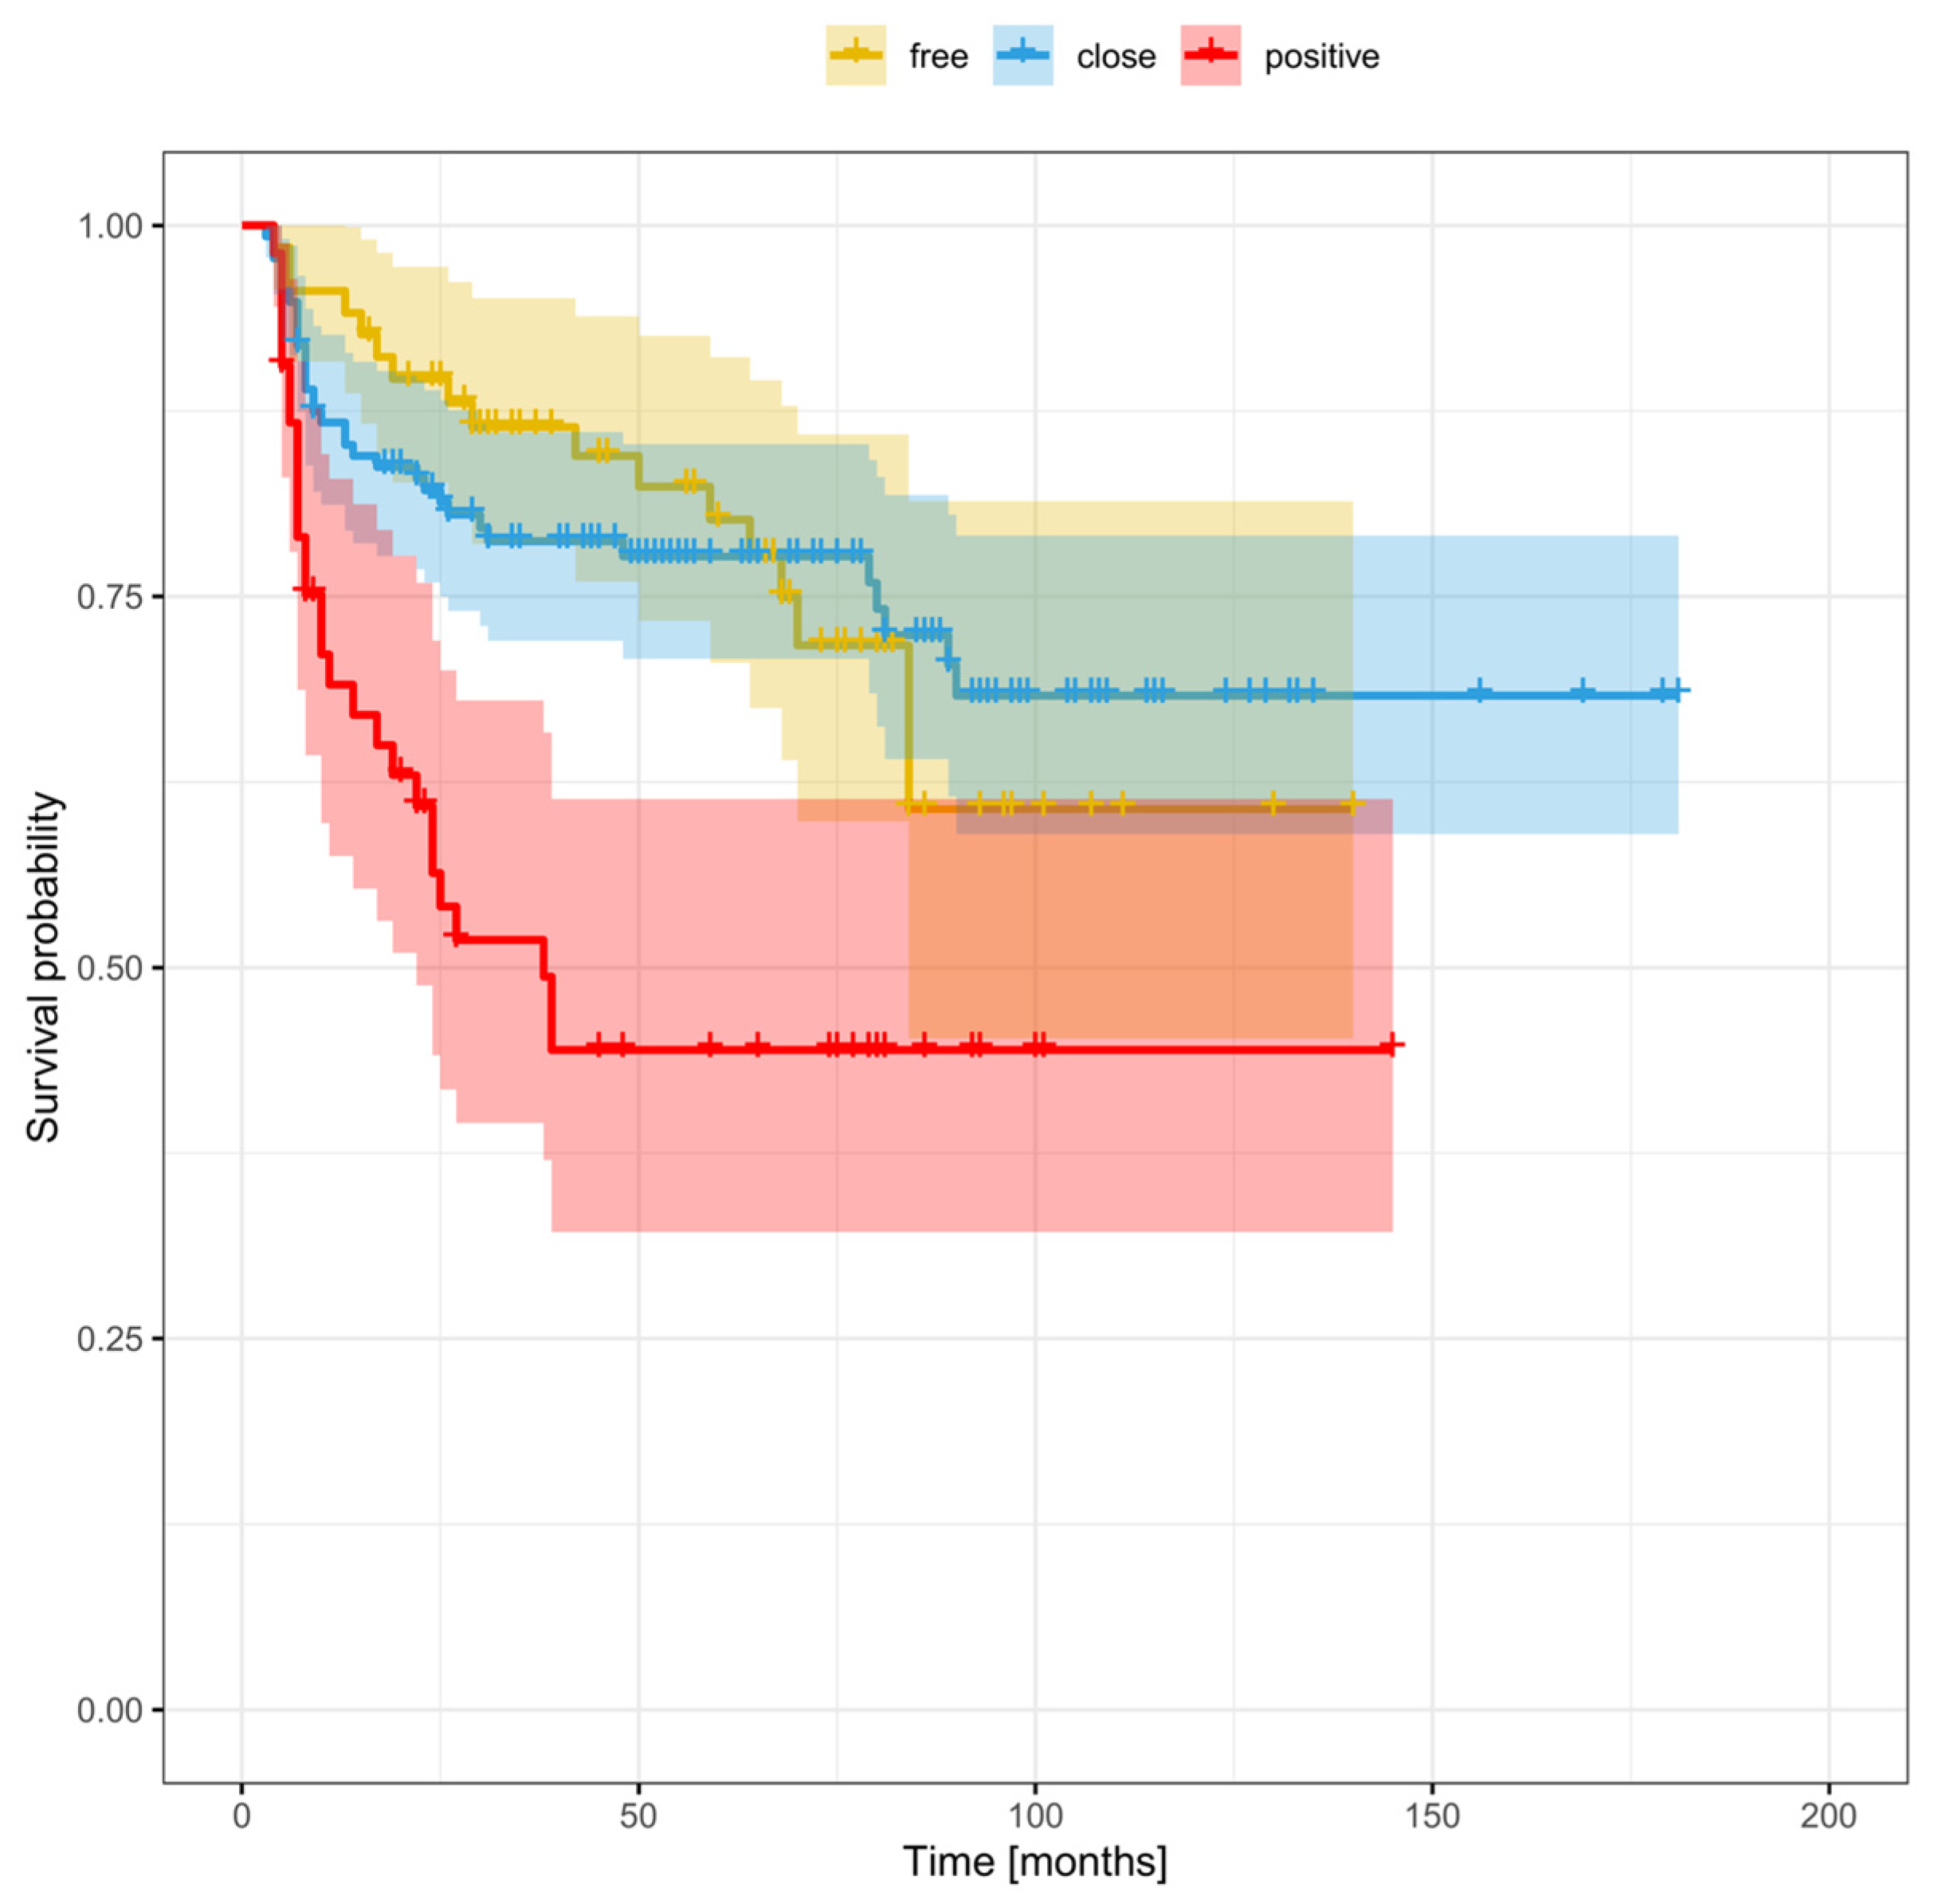
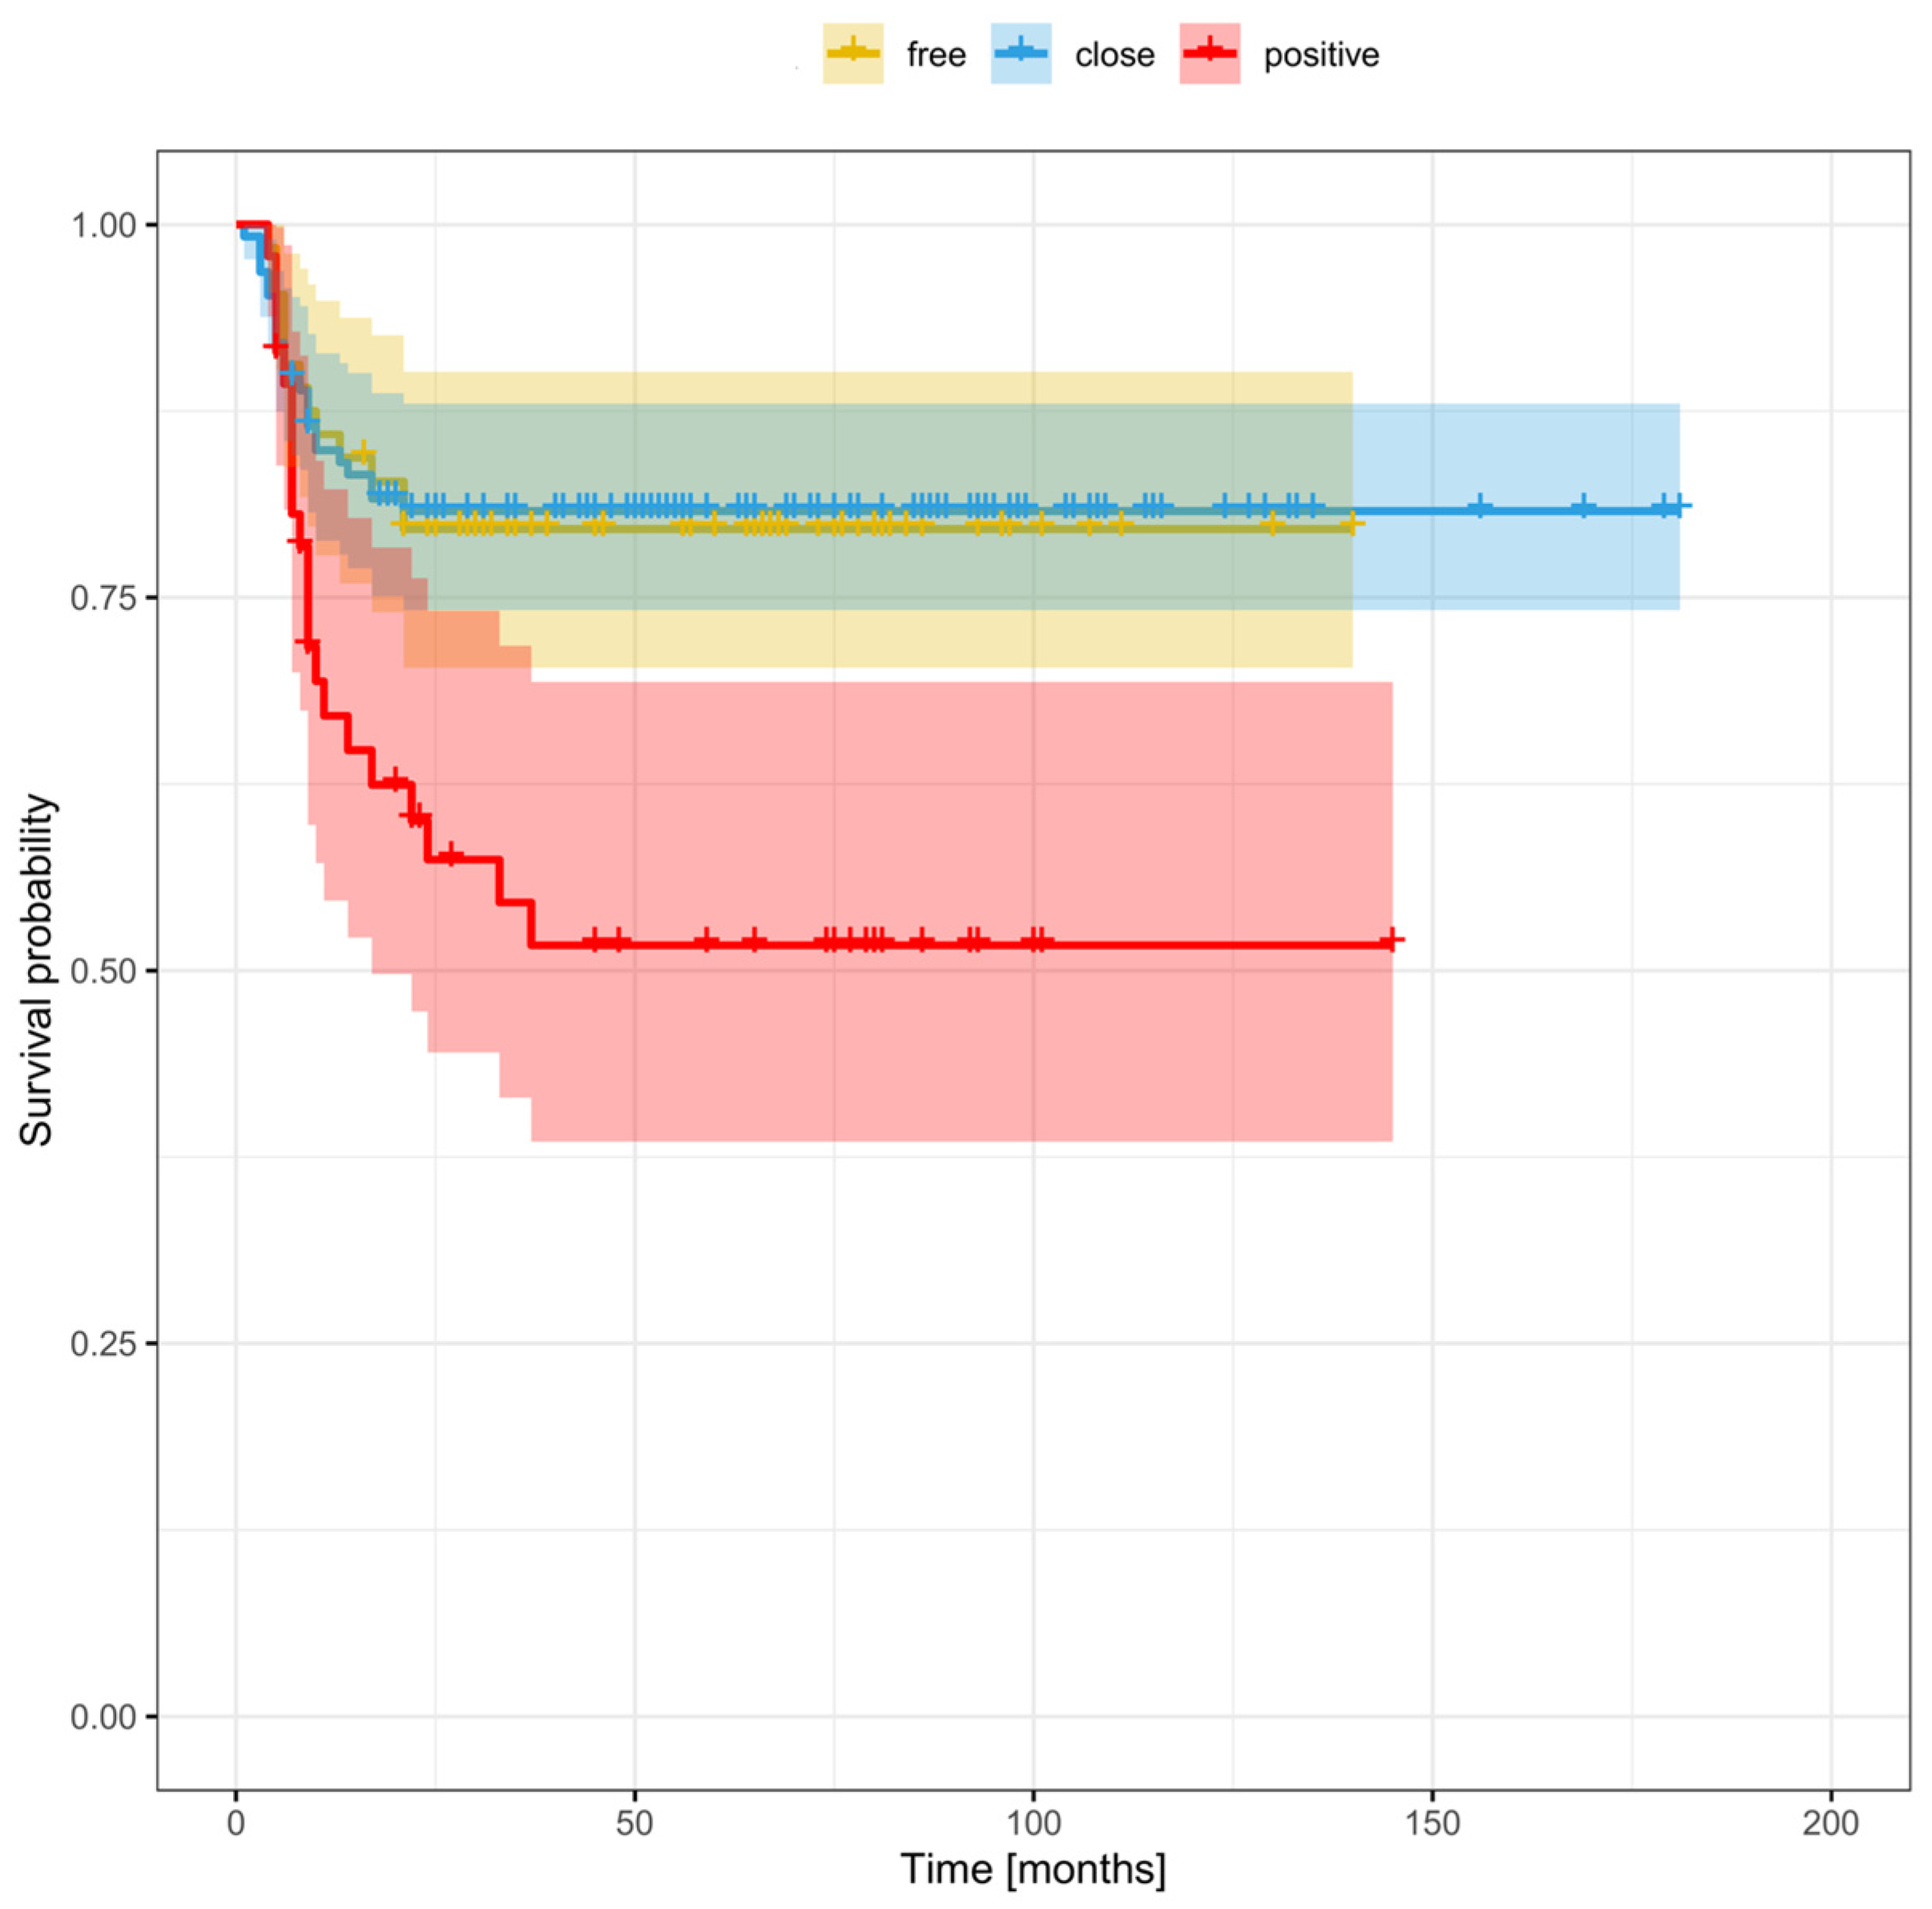
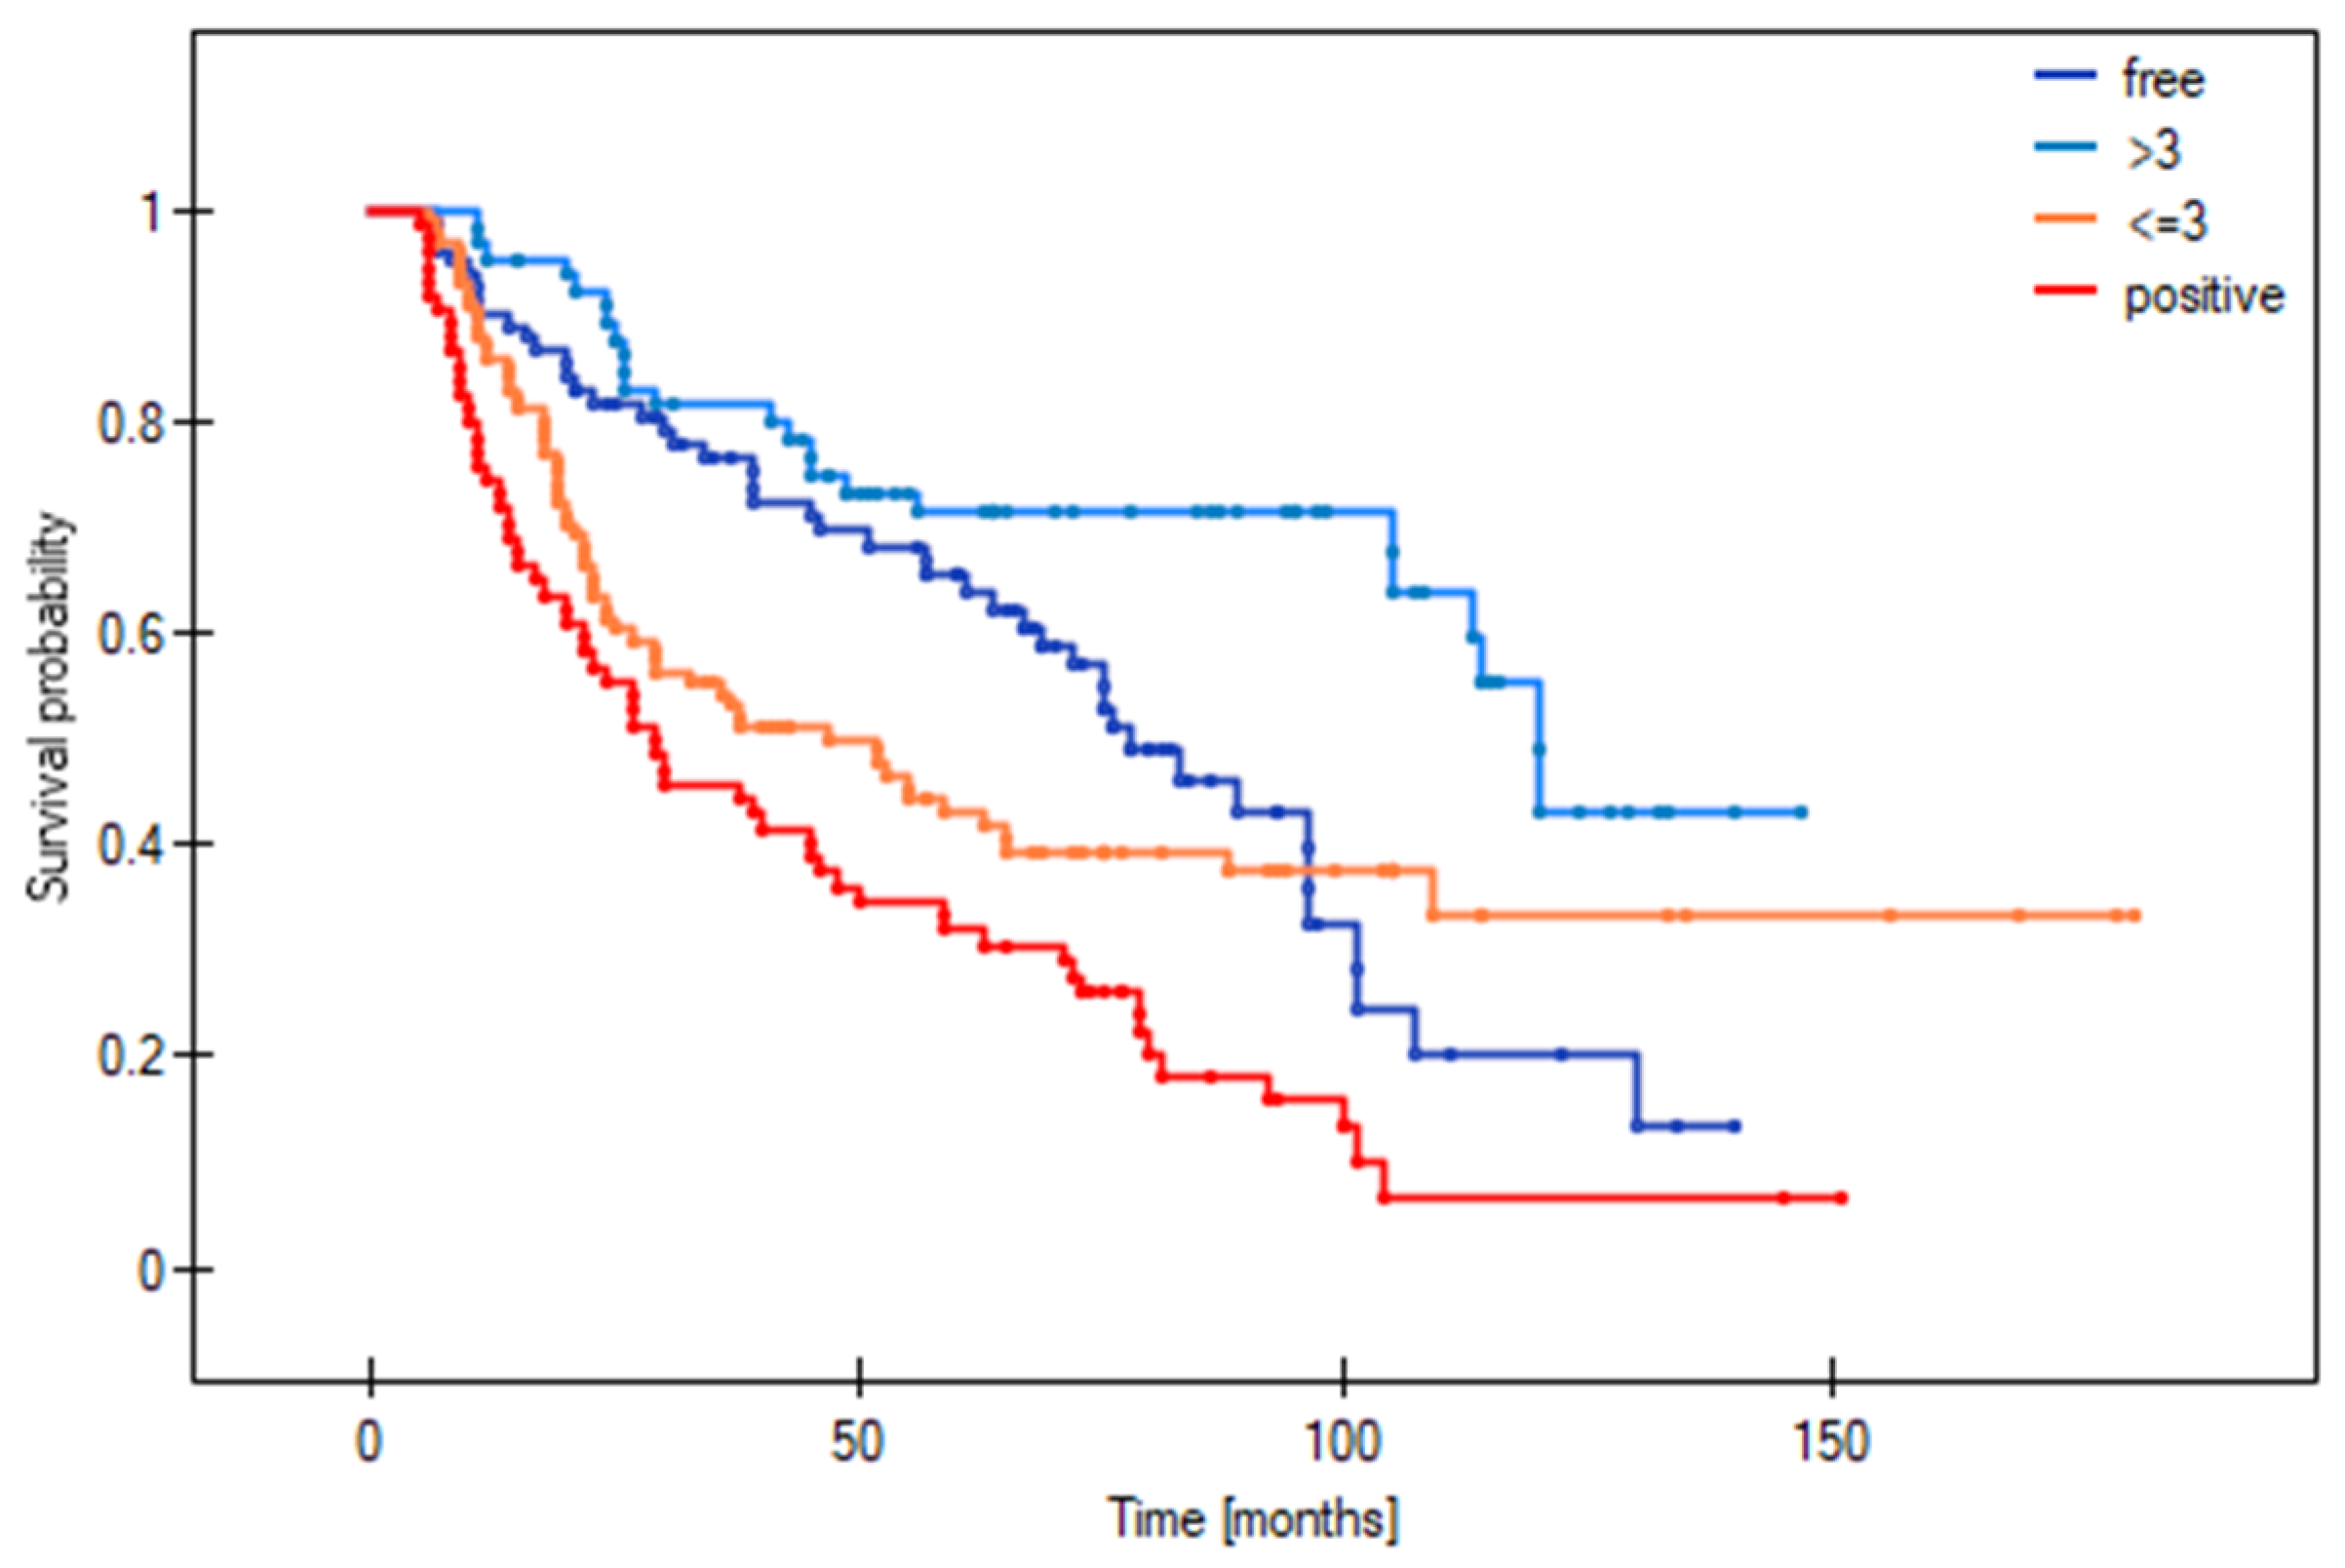
3.7. Cut-Off Point to Differentiate between Survival Outcomes in Patients with Close Margins

In the close margin group, we performed an analysis of the time-dependent receiver operating characteristic (ROC) curve based on the Youden index in an attempt to identify a cut-off point that would indicate better survival. This analysis was performed separately for the deep and mucosal margins (Table 5).
The optimal deep margin cut-off size for DFS (area under the curve [AUC] = 0.58) and OS (AUC = 0.63) was a margin > 3 mm. No significant cut-off point was found for the mucosal margin. Figure 6 and Figure 7 show the DFS and OS Kaplan–Meier curves grouped according to margin status (positive margins, deep margin ≤ 3 mm, deep margin > 3 mm, and clear margins). For DFS, the difference between positive margins and close margins > 3 mm was statistically significant (33.8% vs. 80.2% respectively, p < 0.0001; HR = 3.31). Similarly, there were significant differences in the 5-year DFS between the groups with positive and clear margins (33.8% vs. 64.2%, p = 0.0002; HR = 2.17) and between those with a deep margin ≤ 3 vs. >3 mm (52.6% vs. 80.2%, p = 0.006; HR = 2.1). In terms of OS at 5 years, significant differences were observed between the following: positive vs. ≤3 mm margins (31.8% vs. 41.7% respectively, p = 0.004; HR = 1.7); positive vs. >3 mm margins (31.8% vs. 71.3% respectively, p < 0.0001; HR = 3.94); positive vs. clear margins (31.8% vs. 65.4%, p = 0.0004; HR = 2.15); and ≤ vs. >3 mm (41.7% vs. 71.3%, p = 0.0003; HR = 2.32) (Table 5).
Table 6 shows the risk of local, regional, and distant recurrence according to margin status (positive, close, clear) and deep margin distance (≤3 vs. >3 mm). As the table shows, there were significant differences in local recurrence between the following: positive vs. >3 mm margins (HR = 4.74); positive vs. clear margins (HR = 2.74); and ≤3 vs. >3 mm margins (HR = 2.45). For regional recurrence, significant differences were observed between the following: positive vs. >3 mm margins (HR = 4.9); positive vs. clear margins (HR = 2.55); and ≤3 vs. >3 mm margins (HR = 2.55). For distant recurrence, significant differences were observed for the following: positive vs. >3 mm margins (HR = 7.19); positive vs. clear margins (HR = 7.51); ≤3 vs. >3 mm margins (HR = 2.72); and ≤3 mm vs. clear (HR = 2.84). No survival differences were observed between patients with >3 mm margins and clear margins.

4. Discussion

In the close margin subgroup, survival outcomes were significantly better (AUC = 0.63) in patients with a deep margin > 3 mm vs. those with smaller margins (≤3 mm) (Table 5). At 5 years, the DFS and OS (80.2% and 71.3%) in this subgroup with deep margins > 3 mm were similar to those observed in the clear margin group (64.2% and 65.4%, respectively). By contrast, patients with a smaller deep margin (≤3 mm) had worse 5-year DFS and OS rates (52.6% and 41.7%), which were comparable to the positive margin group (33.8% and 31.8%, respectively).
In our study, the variable that had the greatest impact on the risk of distant failure was positive surgical margins, a finding that contrasts with the results reported in other published studies, most of which have found that nodal involvement is the main risk factor [22,23,24]. Crucially, none of the clinical or tumour-related variables evaluated in this study had any significant impact on regional or distant disease in patients with clear surgical margins. Similarly, none of these factors were significant for distant recurrence in the positive margin group. These findings suggest that other factors (immune deficiency, genetic factors, and adverse histologic risk factors), which are not routinely studied, likely play a role in treatment failure.
In oral cancer, margin status is a well-known risk factor for recurrence. However, the effect size of positive margins versus other strong risk factors (e.g., nodal status and advanced local disease) is controversial [25]. In addition, although close margins are considered to be a risk factor, the true risk has not been well described. In fact, as we have shown in this study, the risk appears to depend in large part on the size of the margin. Consequently, this lack of clarity complicates decision-making with regards to adjuvant treatment in patients with close margins. In the study by Mitchell et al. [26], the mean survival in patients with involved margins was only half of that observed in patients with clear margins (11.4 vs. 25.4 years, respectively). In that study, patients with close margins also had significantly worse survival (15.6 years) than those with clear margins. However, this difference between patients with close and clear margins was not confirmed in our study (5-year OS 54% vs. 65,4%, p = 0.669; DFS 63.8% vs. 64.2%, p = 0.8399, respectively). Although 5-year OS and DFS were significantly worse in the positive margin group (31.8% and 33.8%, respectively; p < 0.0001), we did not observe any significant differences between the close and clear margin groups. Binahmed et al. reported similar findings, with no significant differences between the close and clear margin groups [27]. However, those authors defined a “close” margin as ≤2 mm from the inked resection margin. A systematic review carried out by Young et al. concluded that patients with margins <1 mm had a three-fold greater risk of local recurrence compared to those with clear margins [28]. However, that study did not compare the hazard ratio for margin status to other known risk factors.
A study in Taiwan involving more than 15,000 patients included in the Taiwan Cancer Registry database found that three factors—advanced nodal status (HR = 5.30), positive surgical margins (HR = 2.10), and advanced T stage (HR = 2.08)—were associated with the greatest risk of recurrence in a multivariate analysis [29]. However, it is difficult to compare the findings of that study to ours because they used cancer-specific survival (CSS), whereas we used DFS and OS and we also grouped our results according to local, regional, and distant recurrence. Notwithstanding these differences, our multivariate analysis showed that nodal disease (HR = 3.39), advanced disease (HR = 3.37), and positive surgical margins (HR = 2.02) were all associated with a significantly increased risk of local recurrence. The most significant risk factors for regional failure were nodal status and advanced disease, followed by PNI, LVI and ENE.
Another finding of this study was that positive surgical margins (HR = 5.6) had the greatest impact on the risk of distant failure, followed by nodal disease (HR = 4.01). This finding is particularly interesting because nodal involvement is the main risk factor in most other studies. For example, Zubair et al. evaluated 187 patients with recurrent disease, 46 of whom developed distant recurrence. The main risk factors were nodal disease (HR = 23.04 for pN2c) and depth of invasion (HR = 14.03 for >10 mm) [30]. Zanoni et al. found that the neutrophile-to-lymphocyte (NLR) ratio—which we did not evaluate in our study—and nodal disease (>5 metastatic nodes) were the strongest risk factors (HR = 3.1 and HR = 2.06, respectively) for distant recurrence [31].
In the positive margin group, the variables with the greatest risk of local and regional recurrence were, respectively, LVI (HR = 3.33) and ENE (HR = 4.45). None of the other variables were significantly associated with the risk of distant recurrence. In patients with close surgical margins, nodal disease had the greatest impact on local and distant recurrence (HR = 3.42 and HR = 9.16, respectively). The presence of PNI (HR = 4.66) was associated with the greatest risk of regional recurrence. In the clear margin subgroup, nodal disease was associated with a significant increase in risk of local recurrence (HR = 4.08).
Interestingly, none of the risk factors evaluated in this study were significantly associated with either regional or distant recurrence. This finding is important because it suggests that recurrence must be attributable to risk factors (e.g., NLR, pattern of invasion, tumour budding, etc.) that were not evaluated in our study. Zanoni et al. found that NLR was the greatest risk factor for the development of distant recurrence, indicating that an impaired immune system is a key risk factor that should be considered when planning adjuvant treatment and surveillance [31]. Kligerman et al. examined 161 patients with oral cancer but excluded patients with certain risk factors (PNI, LVI, and positive surgical margins). That study evaluated certain adverse pathologic risk factors including the pattern of invasion, tumour budding, and tumour infiltrating lymphocytes. In the multivariate analysis, tumour budding, higher T stage, and neck dissection were all significantly associated with recurrence [17].
Although numerous previous studies [10,12,13,14,31,32] have also subdivided patients with close margins in an effort to determine the impact of the margin size on outcomes, the results to date have been heterogenous. Moreover, none of those studies differentiated between mucosal and deep margins. For example, the study by Singh et al. used two margin cut-off points, i.e., >2 mm and >7 mm, to determine their impact on the mean locoregional-free survival [32]. Lin et al. [29] took 5 mm margins as a reference point, finding that margins < 4 mm were associated with significantly worse CSS. However, that study did not differentiate between mucosal and deep margins. Zanoni et al. used ROC curves to identify a cut-off point to differentiate between close margins, finding that survival outcomes in patients with a margin > 2.2 mm were similar to those observed in patients with clear margins (AUC = 0.671). Nonetheless, that study only measured locoregional-free survival at 2 years [14]. Fowler et al. evaluated more than 400 patients with oral cancer, finding that patients with margins > 1 mm had similar outcomes to those with clear margins (>5 mm) [15].

Strengths and Limitations

This study has several limitations. First, the retrospective design is a limitation, with all the limitations inherent to this type of study. Another limitation, related to the retrospective design, is that the decision to administer adjuvant radiotherapy was individualized after presentation to a multidisciplinary tumour board, which could have introduced bias and thus influenced the results. By contrast, the main strength of this study is that it was a single-institution study with a highly standardized treatment regimen with reliable follow-up. Importantly, to our knowledge, this is the first study to analyze outcomes according to both deep and mucosal margins.

5. Conclusions

This study has two important findings. First, among the patients with close margins, survival was significantly better (and comparable to the clear margin subgroup) in those with a deep margin > 3 mm. This suggests that adjuvant radiotherapy or chemoradiotherapy may not always be necessary in patients with close margins (but only in well-selected cases). Another relevant finding is that positive surgical margins—not nodal involvement—had the greatest impact on the risk of distant failure. Given the potential clinical and treatment implications of these findings, more research—ideally through prospective studies—is warranted.

Author Contributions

Conceptualization, M.S.; methodology, J.P. and P.G.; software, M.S.; validation, B.W. (Barbara Więckowska); formal analysis, M.S.; investigation, P.P. and P.G.; resources, B.W. (Bartosz Wojtera); data curation, W.G.; writing—original draft preparation, M.S.; writing—review and editing, W.G.; visualization, B.W. (Bartosz Wojtera); supervision, W.G.; project administration, B.W. (Barbara Więckowska); funding acquisition, M.S. All authors have read and agreed to the published version of the manuscript.

Funding

This research received no external funding.

Institutional Review Board Statement

Due to the retrospective nature of the study, approval from the ethics committee was not required.

Informed Consent Statement

Informed consent was obtained from all subjects involved in the study.

Data Availability Statement

For the data supporting the reported results, please contact the corresponding author.

Conflicts of Interest

The authors declare no conflicts of interest.

References

  1. Chamoli, A.; Gosavi, A.S.; Shirwadkar, U.P.; Wangdale, K.V.; Behera, S.K.; Kurrey, N.K.; Kalia, K.; Mandoli, A. Overview of Oral Cavity Squamous Cell Carcinoma: Risk Factors, Mechanisms, and Diagnostics. Oral Oncol. 2021, 121, 105451. [Google Scholar] [CrossRef] [PubMed]
  2. Miranda-Filho, A.; Bray, F. Global Patterns and Trends in Cancers of the Lip, Tongue and Mouth. Oral Oncol. 2020, 102, 104551. [Google Scholar] [CrossRef] [PubMed]
  3. Shanti, R.M.; O’Malley, B.W. Surgical Management of Oral Cancer. Dent. Clin. N. Am. 2018, 62, 77–86. [Google Scholar] [CrossRef] [PubMed]
  4. Ong, T.K.; Murphy, C.; Smith, A.B.; Kanatas, A.N.; Mitchell, D.A. Survival after Surgery for Oral Cancer: A 30-Year Experience. Br. J. Oral Maxillofac. Surg. 2017, 55, 911–916. [Google Scholar] [CrossRef]
  5. Daniell, J.R.; Rowe, D.; Wiesenfeld, D.; McDowell, L.; Hall, K.A.; Nastri, A.; Iseli, T.A.; Wong, T. A Change in Surgical Margin: Do Wider Surgical Margins Lead to Decreased Rates of Local Recurrence in T1 and T2 Oral Tongue Cancer? Int. J. Oral Maxillofac. Surg. 2023, 52, 19–25. [Google Scholar] [CrossRef] [PubMed]
  6. Smits, R.W.H.; Koljenović, S.; Hardillo, J.A.; Ten Hove, I.; Meeuwis, C.A.; Sewnaik, A.; Dronkers, E.A.C.; Bakker Schut, T.C.; Langeveld, T.P.M.; Molenaar, J.; et al. Resection Margins in Oral Cancer Surgery: Room for Improvement. Head Neck 2016, 38, E2197–E2203. [Google Scholar] [CrossRef] [PubMed]
  7. Woolgar, J.A.; Triantafyllou, A. A Histopathological Appraisal of Surgical Margins in Oral and Oropharyngeal Cancer Resection Specimens. Oral Oncol. 2005, 41, 1034–1043. [Google Scholar] [CrossRef] [PubMed]
  8. Meier, J.D.; Oliver, D.A.; Varvares, M.A. Surgical Margin Determination in Head and Neck Oncology: Current Clinical Practice. The Results of an International American Head and Neck Society Member Survey. Head Neck 2005, 27, 952–958. [Google Scholar] [CrossRef] [PubMed]
  9. Machiels, J.-P.; René Leemans, C.; Golusinski, W.; Grau, C.; Licitra, L.; Gregoire, V. Squamous Cell Carcinoma of the Oral Cavity, Larynx, Oropharynx and Hypopharynx: EHNS–ESMO–ESTRO Clinical Practice Guidelines for Diagnosis, Treatment and Follow-Up. Ann. Oncol. 2020, 31, 1462–1475. [Google Scholar] [CrossRef] [PubMed]
  10. Bajwa, M.S.; Houghton, D.; Java, K.; Triantafyllou, A.; Khattak, O.; Bekiroglu, F.; Schache, A.G.; Brown, J.S.; McCaul, J.A.; Rogers, S.N.; et al. The Relevance of Surgical Margins in Clinically Early Oral Squamous Cell Carcinoma. Oral Oncol. 2020, 110, 104913. [Google Scholar] [CrossRef] [PubMed]
  11. Nason, R.W.; Binahmed, A.; Pathak, K.A.; Abdoh, A.A.; Sándor, G.K.B. What Is the Adequate Margin of Surgical Resection in Oral Cancer? Oral Surg. Oral Med. Oral Pathol. Oral Radiol. Endodontol. 2009, 107, 625–629. [Google Scholar] [CrossRef] [PubMed]
  12. Solomon, J.; Hinther, A.; Matthews, T.W.; Nakoneshny, S.C.; Hart, R.; Dort, J.C.; Chandarana, S.P. The Impact of Close Surgical Margins on Recurrence in Oral Squamous Cell Carcinoma. J. Otolaryngol.-Head Neck Surg. 2021, 50, 9. [Google Scholar] [CrossRef] [PubMed]
  13. Tasche, K.K.; Buchakjian, M.R.; Pagedar, N.A.; Sperry, S.M. Definition of “Close Margin” in Oral Cancer Surgery and Association of Margin Distance With Local Recurrence Rate. JAMA Otolaryngol. Neck Surg. 2017, 143, 1166. [Google Scholar] [CrossRef] [PubMed]
  14. Zanoni, D.K.; Migliacci, J.C.; Xu, B.; Katabi, N.; Montero, P.H.; Ganly, I.; Shah, J.P.; Wong, R.J.; Ghossein, R.A.; Patel, S.G. A Proposal to Redefine Close Surgical Margins in Squamous Cell Carcinoma of the Oral Tongue. JAMA Otolaryngol. Neck Surg. 2017, 143, 555. [Google Scholar] [CrossRef] [PubMed]
  15. Fowler, J.; Campanile, Y.; Warner, A.; Laxague, F.; Fnais, N.; Fung, K.; Mendez, A.; MacNeil, D.; Yoo, J.; Palma, D.; et al. Surgical Margins of the Oral Cavity: Is 5 Mm Really Necessary? J. Otolaryngol.-Head Neck Surg. 2022, 51, 38. [Google Scholar] [CrossRef] [PubMed]
  16. Ch’ng, S.; Corbett-Burns, S.; Stanton, N.; Gao, K.; Shannon, K.; Clifford, A.; Gupta, R.; Clark, J.R. Close Margin Alone Does Not Warrant Postoperative Adjuvant Radiotherapy in Oral Squamous Cell Carcinoma. Cancer 2013, 119, 2427–2437. [Google Scholar] [CrossRef] [PubMed]
  17. Kligerman, M.P.; Moon, P.K.; Tusty, M.; Cloutier, J.M.; Ma, Y.; Holsinger, C.F.; Divi, V. Impact of Histologic Risk Factors on Recurrence Rates for Oral Cavity Squamous Cell Carcinoma. Ann. Otol. Rhinol. Laryngol. 2023, 132, 731–737. [Google Scholar] [CrossRef] [PubMed]
  18. Lee, D.-H.; Kim, G.-J.; Kim, H.-B.; Shin, H.-I.; Kim, C.-S.; Nam, I.-C.; Cho, J.-H.; Joo, Y.-H.; Cho, K.-J.; Sun, D.-I.; et al. Close Surgical Margins in Oral and Oropharyngeal Cancer: Do They Impact Prognosis? Cancers 2022, 14, 2990. [Google Scholar] [CrossRef] [PubMed]
  19. Hamman, J.; Howe, C.L.; Borgstrom, M.; Baker, A.; Wang, S.J.; Bearelly, S. Impact of Close Margins in Head and Neck Mucosal Squamous Cell Carcinoma: A Systematic Review. Laryngoscope 2022, 132, 307–321. [Google Scholar] [CrossRef] [PubMed]
  20. Brinkman, D.; Callanan, D.; O’Shea, R.; Jawad, H.; Feeley, L.; Sheahan, P. Impact of 3 Mm Margin on Risk of Recurrence and Survival in Oral Cancer. Oral Oncol. 2020, 110, 104883. [Google Scholar] [CrossRef] [PubMed]
  21. Edge, S.B.; Compton, C.C. The American Joint Committee on Cancer: The 7th Edition of the AJCC Cancer Staging Manual and the Future of TNM. Ann. Surg. Oncol. 2010, 17, 1471–1474. [Google Scholar] [CrossRef] [PubMed]
  22. Lim, J.-Y.; Lim, Y.C.; Kim, S.-H.; Kim, J.W.; Jeong, H.M.; Choi, E.C. Predictive Factors of Isolated Distant Metastasis after Primary Definitive Surgery without Systemic Treatment for Head and Neck Squamous Cell Carcinoma. Oral Oncol. 2010, 46, 504–508. [Google Scholar] [CrossRef] [PubMed]
  23. Liu, J.C.; Bhayani, M.; Kuchta, K.; Galloway, T.; Fundakowski, C. Patterns of Distant Metastasis in Head and Neck Cancer at Presentation: Implications for Initial Evaluation. Oral Oncol. 2019, 88, 131–136. [Google Scholar] [CrossRef] [PubMed]
  24. Van Der Kamp, M.F.; Muntinghe, F.O.W.; Iepsma, R.S.; Plaat, B.E.C.; Van Der Laan, B.F.A.M.; Algassab, A.; Steenbakkers, R.J.H.M.; Witjes, M.J.H.; Van Dijk, B.A.C.; De Bock, G.H.; et al. Predictors for Distant Metastasis in Head and Neck Cancer, with Emphasis on Age. Eur. Arch. Otorhinolaryngol. 2021, 278, 181–190. [Google Scholar] [CrossRef] [PubMed]
  25. Spence, R.N.; Efthymiou, V.; Goss, D.; Varvares, M.A. Margin Distance in Oral Tongue Cancer Surgery: A Systematic Review of Survival and Recurrence Outcomes. Oral Oncol. 2023, 147, 106609. [Google Scholar] [CrossRef] [PubMed]
  26. Mitchell, D.A.; Kanatas, A.; Murphy, C.; Chengot, P.; Smith, A.B.; Ong, T.K. Margins and Survival in Oral Cancer. Br. J. Oral Maxillofac. Surg. 2018, 56, 820–829. [Google Scholar] [CrossRef] [PubMed]
  27. Binahmed, A.; Nason, R.W.; Abdoh, A.A. The Clinical Significance of the Positive Surgical Margin in Oral Cancer. Oral Oncol. 2007, 43, 780–784. [Google Scholar] [CrossRef] [PubMed]
  28. Young, K.; Bulosan, H.; Kida, C.C.; Bewley, A.F.; Abouyared, M.; Birkeland, A.C. Stratification of Surgical Margin Distances by the Millimeter on Local Recurrence in Oral Cavity Cancer: A Systematic Review and Meta-Analysis. Head Neck 2023, 45, 1305–1314. [Google Scholar] [CrossRef] [PubMed]
  29. Lin, M.-C.; Leu, Y.-S.; Chiang, C.-J.; Ko, J.-Y.; Wang, C.-P.; Yang, T.-L.; Chen, T.-C.; Chen, C.-N.; Chen, H.-L.; Liao, C.-T.; et al. Adequate Surgical Margins for Oral Cancer: A Taiwan Cancer Registry National Database Analysis. Oral Oncol. 2021, 119, 105358. [Google Scholar] [CrossRef] [PubMed]
  30. Zubair, F.; Farooq, S.; Wright, S.; Schipani, S.; McMahon, J. Patterns of Recurrence amongst Patients Undergoing Resection of Oral Squamous Cell Carcinoma with Curative Intent. Br. J. Oral Maxillofac. Surg. 2022, 60, 1379–1384. [Google Scholar] [CrossRef] [PubMed]
  31. Zanoni, D.K.; Valero, C.; McGill, M.R.; Montero, P.H.; Shah, J.P.; Wong, R.J.; Ganly, I.; Patel, S.G. Distant Metastasis in Oral Squamous Cell Carcinoma: Does the Neutrophil-to-Lymphocyte Ratio Act as a Surrogate of the Host Immune Status? Oral Oncol. 2022, 124, 105641. [Google Scholar] [CrossRef] [PubMed]
  32. Singh, A.; Mishra, A.; Singhvi, H.; Sharin, F.; Bal, M.; Laskar, S.G.; Prabhash, K.; Chaturvedi, P. Optimum Surgical Margins in Squamous Cell Carcinoma of the Oral Tongue: Is the Current Definition Adequate? Oral Oncol. 2020, 111, 104938. [Google Scholar] [CrossRef] [PubMed]
Figure 1. Overall survival stratified by margin status.
Cancers 16 01488 g001
Figure 2. Disease-free survival stratified by margin status.
Cancers 16 01488 g002
Figure 3. Disease-free survival stratified by margin status in patients with local recurrence.
Cancers 16 01488 g003
Figure 4. Disease-free survival stratified by margin status in patients with regional recurrence.
Cancers 16 01488 g004
Figure 5. Disease-free survival stratified by margin status in patients with distant recurrence.
Cancers 16 01488 g005
Figure 6. Disease-free survival stratified by margin status, including a smaller (≤3 mm) and larger close margin (>3 mm).
Cancers 16 01488 g006
Figure 7. Overall survival stratified by margin status, including a smaller (≤3 mm) and larger close margin (>3 mm).
Cancers 16 01488 g007
Table 1. Clinical and demographic features of the study population.
VariablePatients
(n = 326)
%
Sex
  Male21064.4
  Female11635.6
Mean age, years (range)59.1 (23–97)
Tobacco use
  Never12939.5
  Active 19760.5
Alcohol use
  Never/occasionally (less than 20 g of 100% alcohol per week)28186.1
  Alcohol abuse4513.9
Location
  Tongue15547.5
  Floor of mouth11134.0
  Buccal mucosa298.9
  Retromolar trigone82.5
  Mandibular gingiva216.5
  Maxillary gingiva20.6
Grade
  16720.5
  220863.8
  35115.7
Clinical T stage
  Early (T1/T2)25879.1
  Advanced (T3/T4)6820.9
Clinical N stage
  N018757.3
  N+13942.7
Tumour stage
  Early (I/II)15647.8
  Advanced (III/IV)17052.2
PNI 4012.2
LVI 278.2
ENE 5717.4
Margins
  Positive (<1 mm)8325.5
  Close (1–5 mm)16851.5
  Clear (>5 mm)7523%
Adjuvant treatment
  Radiotherapy26380.6
  Chemoradiotherapy8526
Recurrence14745.1
  Local5316.2
  Regional3310.1
  Locoregional175.2
  Distant216.4
  Locoregional + distant82.4
  Second primary tumour154.6
Abbreviations: PNI, perineural invasion; LVI, lymphovascular invasion; ENE, extranodal extension.
Table 2. Univariate and multivariate analysis of risk factors for recurrent disease.
Risk FactorUnivariate AnalysisMultivariate Analysis
HR (95% CI)p ValueHR (95% CI)p Value
Local recurrence
Grade (3 vs. 1 + 2)1.71 (0.97–3.01)0.06710.9 (0.5–1.63)0.7265
T stage (advanced vs. early)1.75 (1.07–2.87)0.02601.3 (0.77–2.2)0.3343
Nodal disease (N+ vs. N0)3.54 (2.23–5.64)<0.00013.39 (1.9–6.03)<0.0001
Stage (advanced vs. early)3.32 (2.02–5.44)<0.00013.37 (1.84–6.16)0.0001
PNI 2.09 (1.15–3.79)0.01561.5 (0.79–2.85)0.2207
LVI 2.94 (1.55–5.59)0.00011.9 (0.93–3.88)0.0774
ENE 1.91 (1.11–3.27)0.01891.41 (0.78–2.53)0.2514
Adjuvant treatment0.64 (0.34–1.21)0.16541.78 (0.8–4.0)0.1605
Margins
  positive2.75 (1.5–5.06)0.00112.02 (1.02–4.01)0.0446
  close1.02 (0.57–1.83)0.94640.96 (0.51–1.81)0.9071
  clearrefrefrefref
Smoking status (active vs. never)0.58 (0.37–0.91)0.0170.67 (0.41–1.08)0.0997
Alcohol abuse1.25 (0.68–2.32)0.47041.14 (0.57–2.27)0.7065
Regional recurrence
Grade (3 vs. 1 + 2)2.16 (1.21–3.85)0.00881.11 (0.59–2.09)0.7439
T stage (advanced vs. early)1.5 (0.83–2.07)0.17761.05 (0.59–2.09)0.8948
Nodal disease (N+ vs. N0)3.66 (2.14–6.26)<0.00013.85 (1.84–8.04)0.0003
Stage (advanced vs. early)3.6 (2.02–6.42)<0.00013.93 (1.89–8.18)0.0003
PNI 3.58 (2.03–6.31)<0.00012.74 (1.47–5.13)0.0016
LVI 3.67 (1.94–6.94)0.00011.99 (0.99–3.99)0.0052
ENE 2.82 (1.63–4.89)0.00022.1 (1.11–3.98)0.0228
Adjuvant treatment0.87 (0.45–1.68)0.6782.9 (0.89–4.28)0.0876
Margins
  positive2.56 (1.28–5.12)0.00781.91 (0.85–4.32)0.118
  close0.96 (0.49–1.88)0.8980.89 (0.42–1.88)0.7593
  clearref ref
Smoking status (active vs. never)0.53 (0.32–0.88)0.01510.54 (0.32–0.93)0.025
Alcohol abuse1.02 (0.48–2.16)0.95310.66 (0.27–1.61)0.363
Distant recurrence
Grade (3 vs. 1 + 2)1.19 (0.41–3.43)0.74510.62 (0.21–1.82)0.381
T stage (advanced vs. early)0.95 (0.36–2.49)0.91780.52 (0.19–1.39)0.1902
Nodal disease (N+ vs. N0)5.94 (2.62–13.44)<0.00014.01 (1.63–9.89)0.0025
Stage (advanced vs. early)3.79 (1.68–8.56)0.00142.26 (0.94–5.42)0.0687
PNI 1.31 (0.4–4.34)0.65370.63 (0.16–2.4)0.4933
LVI 4.74 (1.93–11.66)0.00075.65 (1.78–17.95)0.0033
ENE 3.46 (1.61–7.46)0.00152.19 (0.92–5.23)0.076
Adjuvant treatment0.13 (0.02–0.97)0.04710.52 (0.06–4.64)0.5561
Margins
  Positive7.53 (2.16–26.22)0.00155.6 (1.41–22.19)0.0142
  Close1.99 (0.56–7.04)0.28741.05 (0.27–4.05)0.9491
  Clearref Ref
Smoking status (active vs. never)1.1 (0.5–2.43)0.80461.15 (0.51–2.62)0.7374
Alcohol abuse1.75 (0.71–4.31)0.22181.09 (0.41–2.9)0.8699
Abbreviations: HR, hazard ratio; CI, confidence interval; PNI, perineural invasion; LVI, lymphovascular invasion; ENE, extranodal extension. Bold value stands for p value that is statistically significant.
Table 3. Distribution of clinical and tumour-related factors by margin status (positive, close, clear).
Clinical or
Tumour-Related
Factors
Positive Margins
(n = 83)
Close Margins
(n = 168)
Clear Margins
(n = 75)
Positive vs.
Close
Positive vs.
Clear
Clear vs.
Close
n (%)p Value
Active smoker42 (56)106 (63.1)49 (59.1)0.69980.69980.6998
Advanced T stage25 (33.3)33 (19.6)10 (12.1)0.03110.00390.133
Nodal disease45 (60)72 (42.9)22 (26.5)0.01350.00010.0135
Advanced disease50 (67.6)92 (54.8)27 (32.5)0.06230.0014<0.0001
PNI13 (17.3)20 (11.9)7 (8.4)0.38080.14380.4037
LVI8 (10.7)16 (9.5)3 (3.6)0.78270.14380.1438
ENE22 (29.3)29 (17.3)6 (7.3)0.03340.0010.0334
Adjuvant treatment74 (98.7)141 (83.9)48 (57.8)0.0009<0.0001<0.0001
Abbreviations: PNI, perineural invasion; LVI, lymphovascular invasion; ENE, extranodal extension. Bold value stands for p value that is statistically significant.
Table 4. Risk factors for local, regional, and distant recurrence according to margin status.
Positive Surgical Margins
Local RecurrenceRegional RecurrenceDistant Recurrence
HR (95% CI)p ValueHR (95% CI)p ValueHR (95% CI)p Value
Advanced T stage1.67 (0.79–3.68)0.17581.8 (0.76–4.28)0.18440.76 (0.21–2.72)0.4326
Nodal disease2.45 (1.07–5.64)0.03463.54 (1.28–9.78)0.01472.53 (0.84–7.61)0.0992
Advanced disease3.01 (1.14–7.97)0.02683.16 (1.06–9.43)0.03951.57 (0.53–4.71)0.4174
PNI2.36 (0.88–6.32)0.08683.02 (1.15–7.89)0.02450.99 (0.13–7.64)0.9943
LVI3.33 (1.1–10.07)0.03354.05 (1.43–1.48)0.0084--
ENE2.53 (1.12–5.72)0.02614.41 (1.82–10.71)0.0013.06 (0.93–10.04)0.0648
Adjuvant treatment-0.9337-0.9795-0.9825
Smoking status1.44 (0.67–3.09)0.34872.8 (1.02–7.69)0.04663.93 (1.09–14.23)0.0341
Close Surgical Margins
Local RecurrenceRegional RecurrenceDistant Recurrence
HR (95% CI)p ValueHR (95% CI)p ValueHR (95% CI)p Value
Advanced T stage1.67 (0.78–3.58)0.18791.19 (0.45–3.2)0.72390.92 (0.2–4.21)0.9912
Nodal disease3.42 (1.69–6.94)0.00063.7 (1.58–8.66)0.00259.16 (2.01–41.82)0.0043
Advanced disease2.83 (1.35–5.92)0.00595.75 (1.96–16.83)0.00145.74 (1.26–26.21)0.024
PNI2.11 (0.87–5.1)0.09944.66 (2.03–10.7)0.00031.06 (0.14–8.18)0.9585
LVI2.71 (1.12–6.58)0.02723.64 (1.44–9.19)0.0063--
ENE1.44 (0.63–3.31)0.39122.0 (0.83–4.82)0.12353.66 (1.16–11.53)0.027
Adjuvant treatment1.63 (0.71–3.75)0.24822.1 (0.83–5.3)0.1156-0.9795
Smoking status0.4 (0.2–0.81)0.010.24 (0.1–0.56)0.0010.81 (0.24–2.68)0.7268
Clear Surgical Margins
Local RecurrenceRegional RecurrenceDistant Recurrence
HR (95% CI)p ValueHR (95% CI)p ValueHR (95% CI)p Value
Advanced T stage1.01 (0.23–4.42)0.99330.57 (0.07–4.36)0.586-0.9843
Nodal disease4.08 (1.57–10.61)0.0042.95 (0.96–9.04)0.05879.96 (0.9–110.25)0.061
Advanced disease3.94 (1.48–10.48)0.00591.93 (0.63–5.91)0.24935.97 (0.54–65.85)0.1447
PNI1.4 (0.32–6.2)0.65512.19 (0.49–9.9)0.3075.56 (0.5–61.62)0.1621
LVI5.87 (0.73–47.41)0.09653.3 (0.43–25.56)0.2524)--
ENE0.82 (0.11–6.24)0.85012.35 (0.52–10.62)0.26755.43 (0.49–60.24)0.1678
Adjuvant treatment0.37 (0.12–1.12)0.07920.69 (0.22–2.1)0.50770.5 (0.05–5.33)0.5717
Smoking status0.66 (0.25–1.71)0.39420.29 (0.09–0.95)0.04150.3 (0.03–3.31)0.326
Abbreviations: HR, hazard ratio; CI, confidence interval; PNI, perineural invasion; LVI, lymphovascular invasion; ENE, extranodal extension. Bold value stands for p value that is statistically significant.
Table 5. Disease-free survival and overall survival stratified according to the deep margin distance (≤ vs. >3 mm).
Margin Status5-Year DFS5-Year OS
Positive33.8%31.8%
Deep margin ≤3 mm52.6%41.7%
Deep margin >3 mm80.2%71.3%
Clear64.2%65.4%
Deep margin ≤ 3 mm
p value *<0.0001<0.0001
Hazard ratio (95% CI)
>3 mm vs. clear0.66 (0.42–1.03)0.54 (0.37–0.8)
≤3 mm vs. clear1.38 (0.9–2.13)1.26 (0.87–1.84)
positive vs. clear2.17 (1.34–3.52)2.15 (1.39–3.31)
≤3 mm vs. >3 mm2.1 (1.35–3.28)2.32 (1.59–3.39)
positive vs. >3 mm3.31 (2.02–5.41)3.94 (2.55–6.1)
positive vs. ≤3 mm1.57 (0.98–2.53)1.7 (1.11–2.61)
Abbreviations: DFS, disease-free survival; OS, overall survival. * Log-rank test. Bold value stands for p value that is statistically significant.
Table 6. Local, regional, and distant recurrence risk stratified by margin status.
Local Recurrence RiskRegional Recurrence RiskDistant Recurrence Risk
Deep margin ≤ 3
Hazard ratio (95% CI)
p-value *<0.00010.0007<0.0001
>3 mm vs. clear0.58 (0.32–1.05)0.52 (0.26–1.06)1.04 (0.39–2.82)
≤3 mm vs. clear1.41 (0.79–2.54)1.33 (0.67–2.62)2.84 (1.08–7.48)
Positive vs. clear2.74 (1.37–5.45)2.55 (1.17–5.57)7.51 (2.45–23.04)
≤3 vs. >3 mm2.45 (1.35–4.46)2.55 (1.26–5.14)2.72 (1.02–7.24)
Positive vs. >3 mm4.74 (2.36–9.55)4.9 (2.2–10.89)7.19 (2.32–22.27)
Positive vs. ≤3 mm1.93 (0.98–3.83)1.92 (0.89–4.17)2.64 (0.87–8.02)
* Log-rank test. Bold value stands for p value that is statistically significant.
Disclaimer/Publisher’s Note: The statements, opinions and data contained in all publications are solely those of the individual author(s) and contributor(s) and not of MDPI and/or the editor(s). MDPI and/or the editor(s) disclaim responsibility for any injury to people or property resulting from any ideas, methods, instructions or products referred to in the content.

