Figure 1.
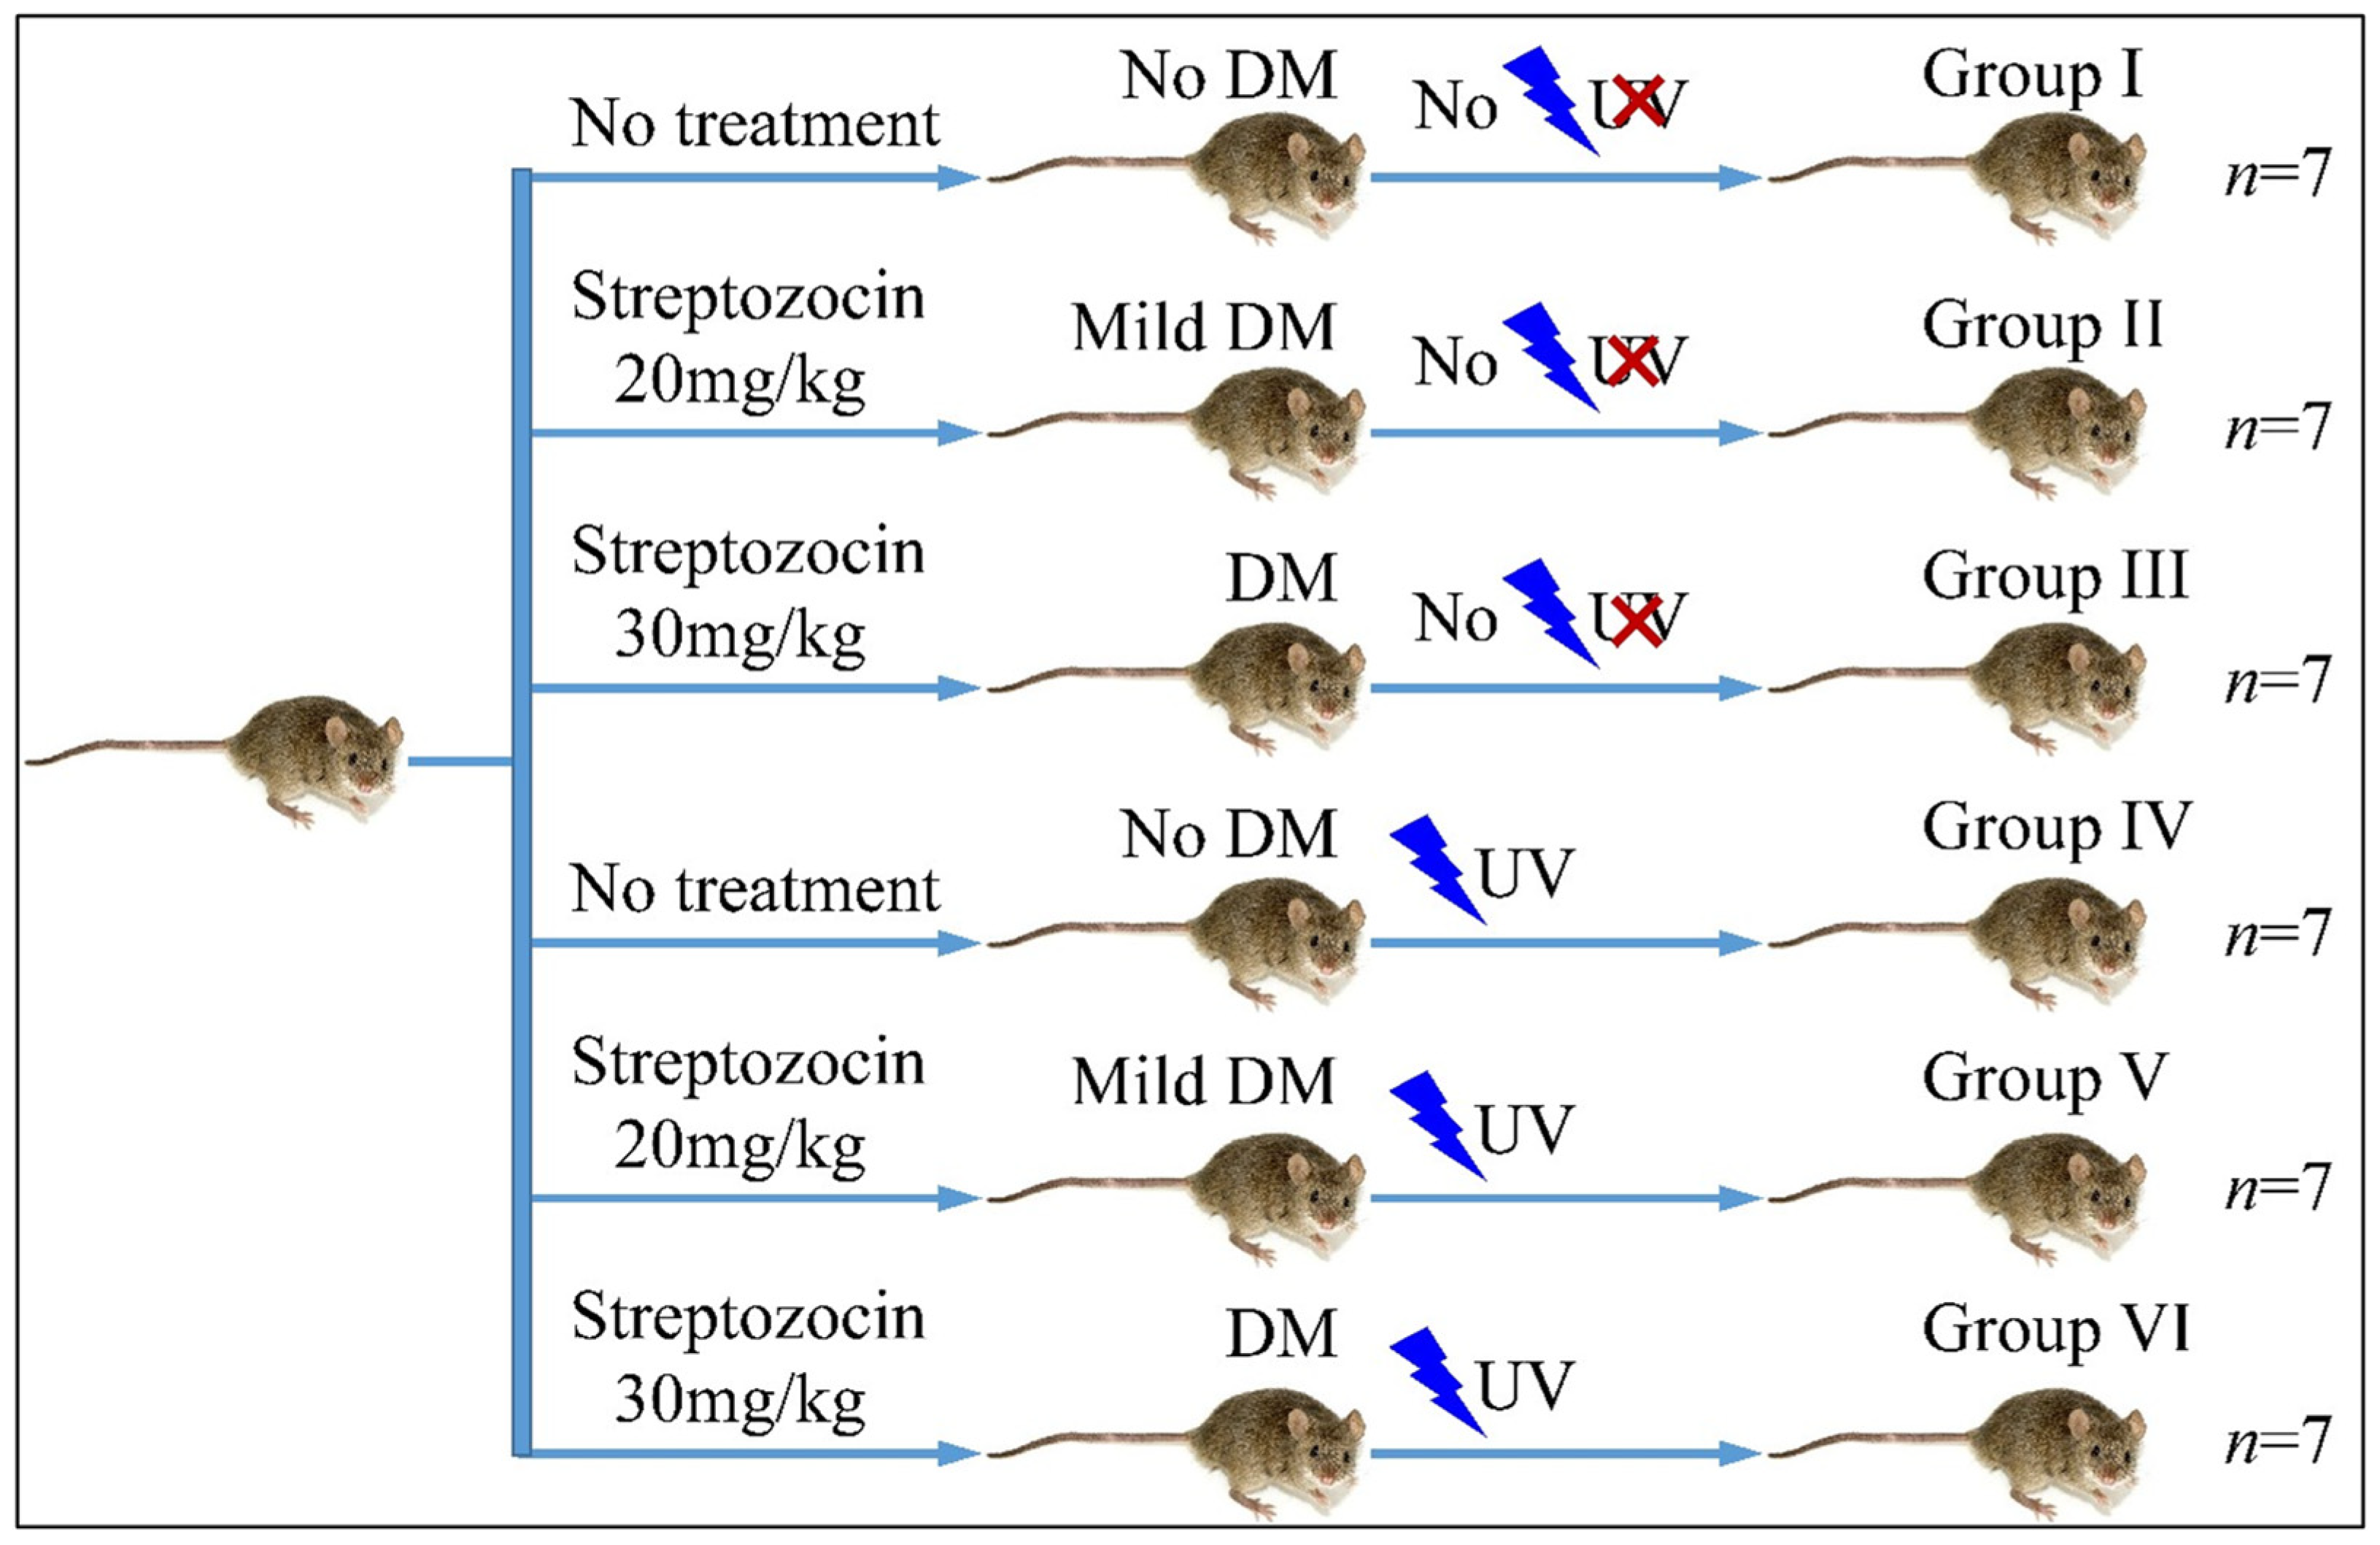
Diagrammatical representation of the experimental design (Legend: DM: Diabetes Mellitus, UV: Ultra-Violet).
Figure 1.
Diagrammatical representation of the experimental design (Legend: DM: Diabetes Mellitus, UV: Ultra-Violet).
Figure 2.
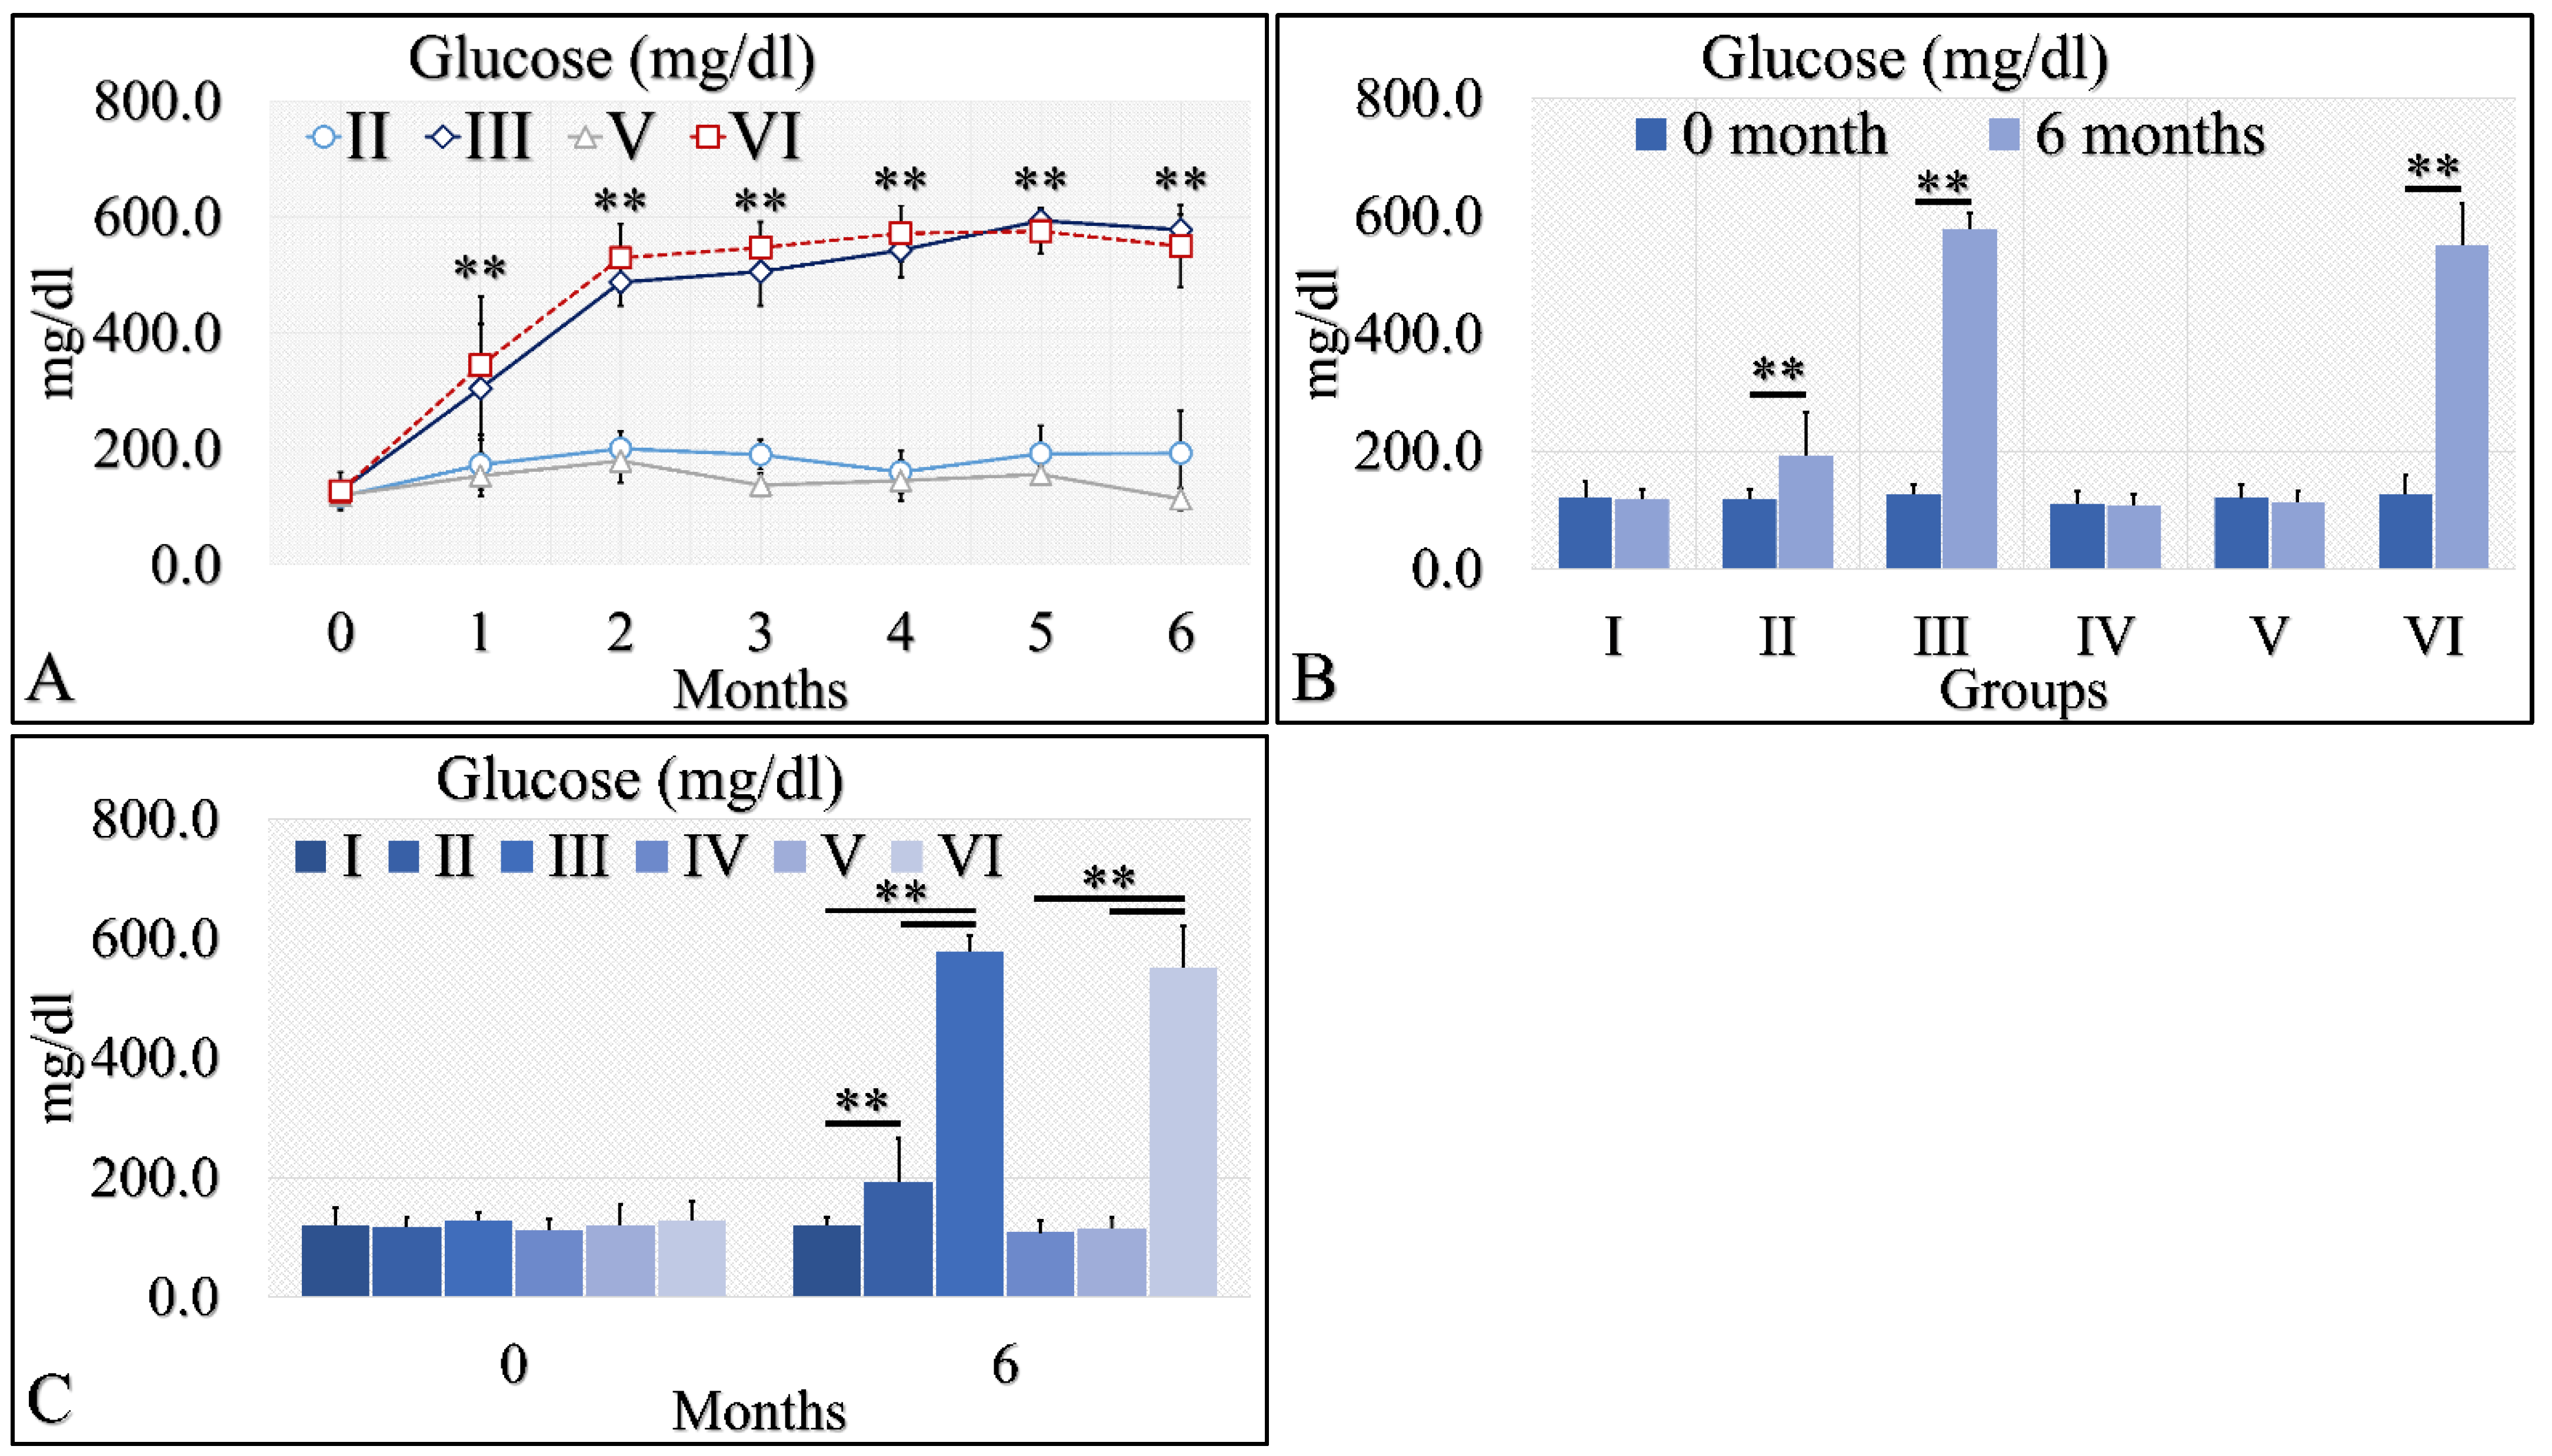
Diabetes induction was successful in the II, III and VI mice groups (II, III, V, VI), where glucose levels were significantly higher, as compared to the month of reference (0 month) (A). Significant differences were observed between month 0 and month 6 in groups II, III and VI (B). In addition, groups II and III manifested significantly higher glucose levels, as compared to the control experiment at 6 months, and group VI manifested significantly higher glucose levels, as compared to the irradiated reference (Group IV) and irradiated Type 2 diabetic mice (Group V) (C) (Legend: I: No treatment, no diabetes induction, no irradiation, II: Type 2 diabetes induction, no irradiation, III: Type 1 diabetes induction, no irradiation, IV: No diabetes induction, irradiation, V: Type 2 diabetes induction, irradiation, VI: Type 1 diabetes induction, irradiation. In subfigure (A), ** indicates a significance of p << 0.01, as compared to the month 0. In subfigures (B,C), ** depicts a significance of p << 0.01).
Figure 2.
Diabetes induction was successful in the II, III and VI mice groups (II, III, V, VI), where glucose levels were significantly higher, as compared to the month of reference (0 month) (A). Significant differences were observed between month 0 and month 6 in groups II, III and VI (B). In addition, groups II and III manifested significantly higher glucose levels, as compared to the control experiment at 6 months, and group VI manifested significantly higher glucose levels, as compared to the irradiated reference (Group IV) and irradiated Type 2 diabetic mice (Group V) (C) (Legend: I: No treatment, no diabetes induction, no irradiation, II: Type 2 diabetes induction, no irradiation, III: Type 1 diabetes induction, no irradiation, IV: No diabetes induction, irradiation, V: Type 2 diabetes induction, irradiation, VI: Type 1 diabetes induction, irradiation. In subfigure (A), ** indicates a significance of p << 0.01, as compared to the month 0. In subfigures (B,C), ** depicts a significance of p << 0.01).
![Cancers 16 01507 g002]()
Figure 3.
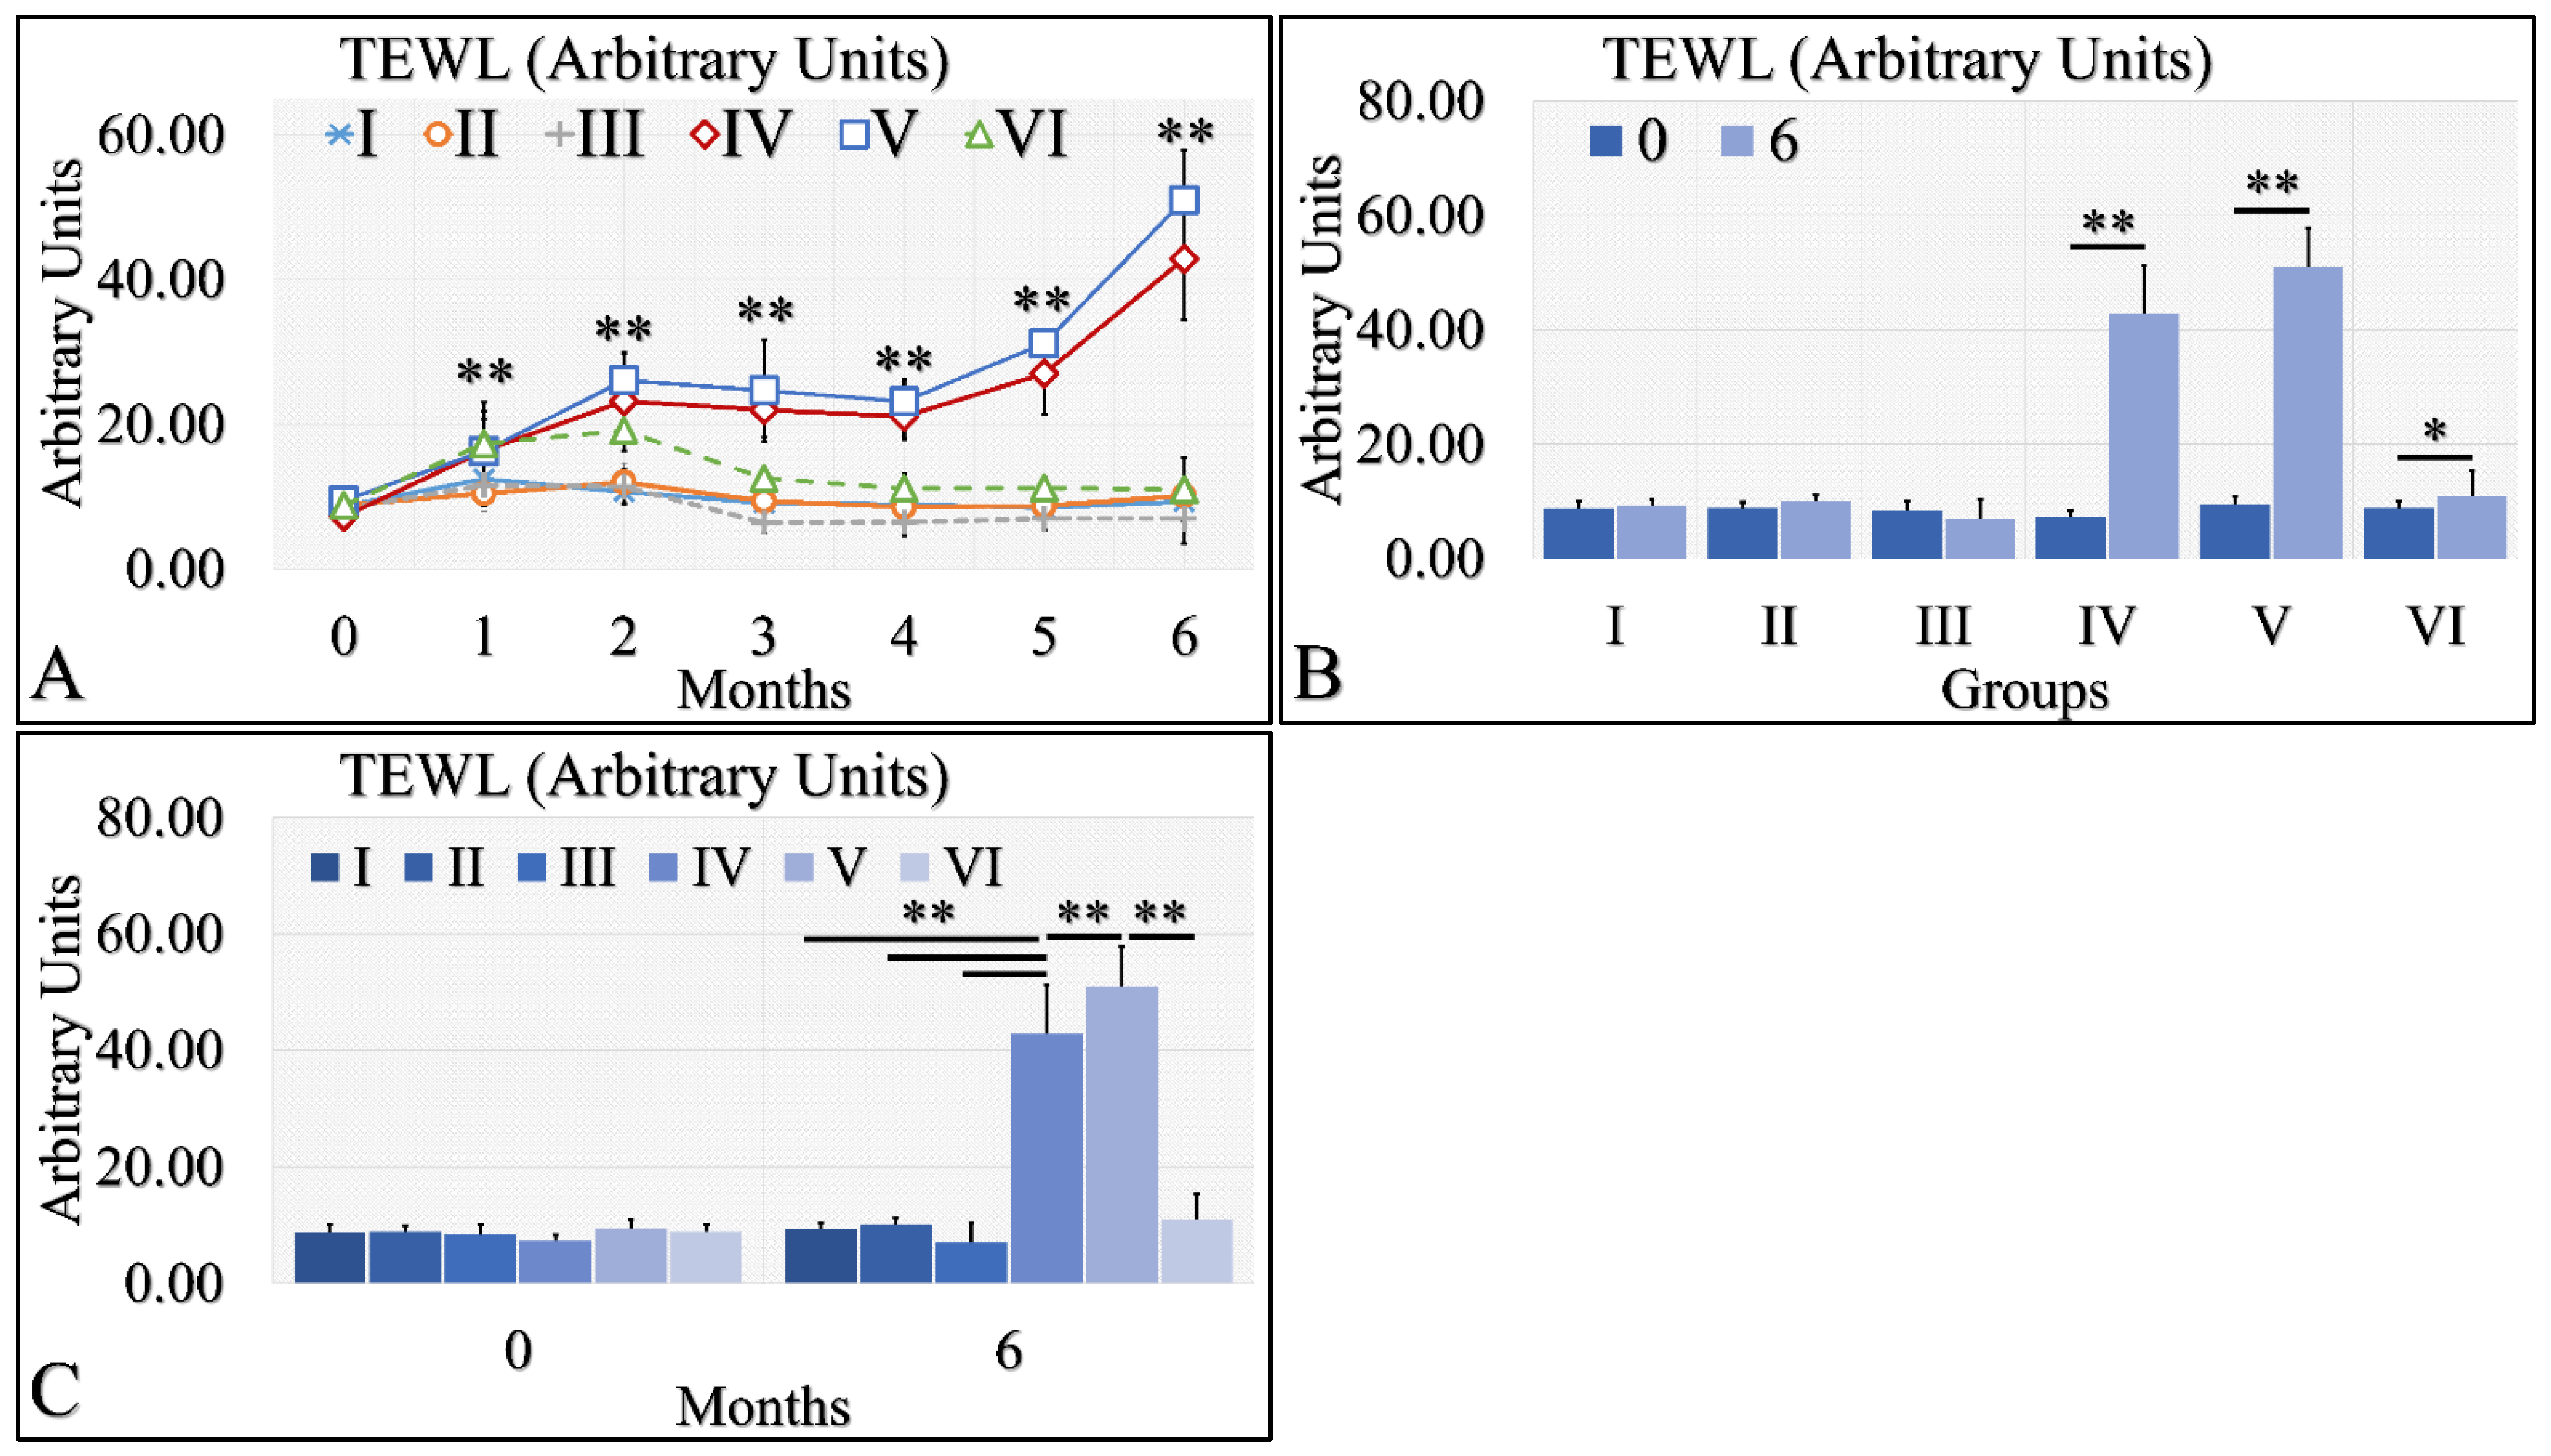
TEWL was observed mostly in groups IV and V. In particular, TEWL manifested an ascending pattern, with respect to time for groups IV and V (A). This result was also manifested in the comparison between months 0 and 6, where irradiated mice and irradiated mice with Type 2 diabetes manifested higher TEWL levels (B). Similarly, groups IV and V manifested significantly higher TEWL levels, as compared to all other groups (C) (Legend: I: No treatment, no diabetes induction, no irradiation, II: Type 2 diabetes induction, no irradiation, III: Type 1 diabetes induction, no irradiation, IV: No diabetes induction, irradiation, V: Type 2 diabetes induction, irradiation, VI: Type 1 diabetes induction, irradiation. In subfigure (A), ** indicates a significance of p << 0.01, as compared to the month 0 and to the other groups in the same month. In subfigures (B,C), ** depicts a significance of p << 0.01, * Depicts the significance of p < 0.05).
Figure 3.
TEWL was observed mostly in groups IV and V. In particular, TEWL manifested an ascending pattern, with respect to time for groups IV and V (A). This result was also manifested in the comparison between months 0 and 6, where irradiated mice and irradiated mice with Type 2 diabetes manifested higher TEWL levels (B). Similarly, groups IV and V manifested significantly higher TEWL levels, as compared to all other groups (C) (Legend: I: No treatment, no diabetes induction, no irradiation, II: Type 2 diabetes induction, no irradiation, III: Type 1 diabetes induction, no irradiation, IV: No diabetes induction, irradiation, V: Type 2 diabetes induction, irradiation, VI: Type 1 diabetes induction, irradiation. In subfigure (A), ** indicates a significance of p << 0.01, as compared to the month 0 and to the other groups in the same month. In subfigures (B,C), ** depicts a significance of p << 0.01, * Depicts the significance of p < 0.05).
Figure 4.
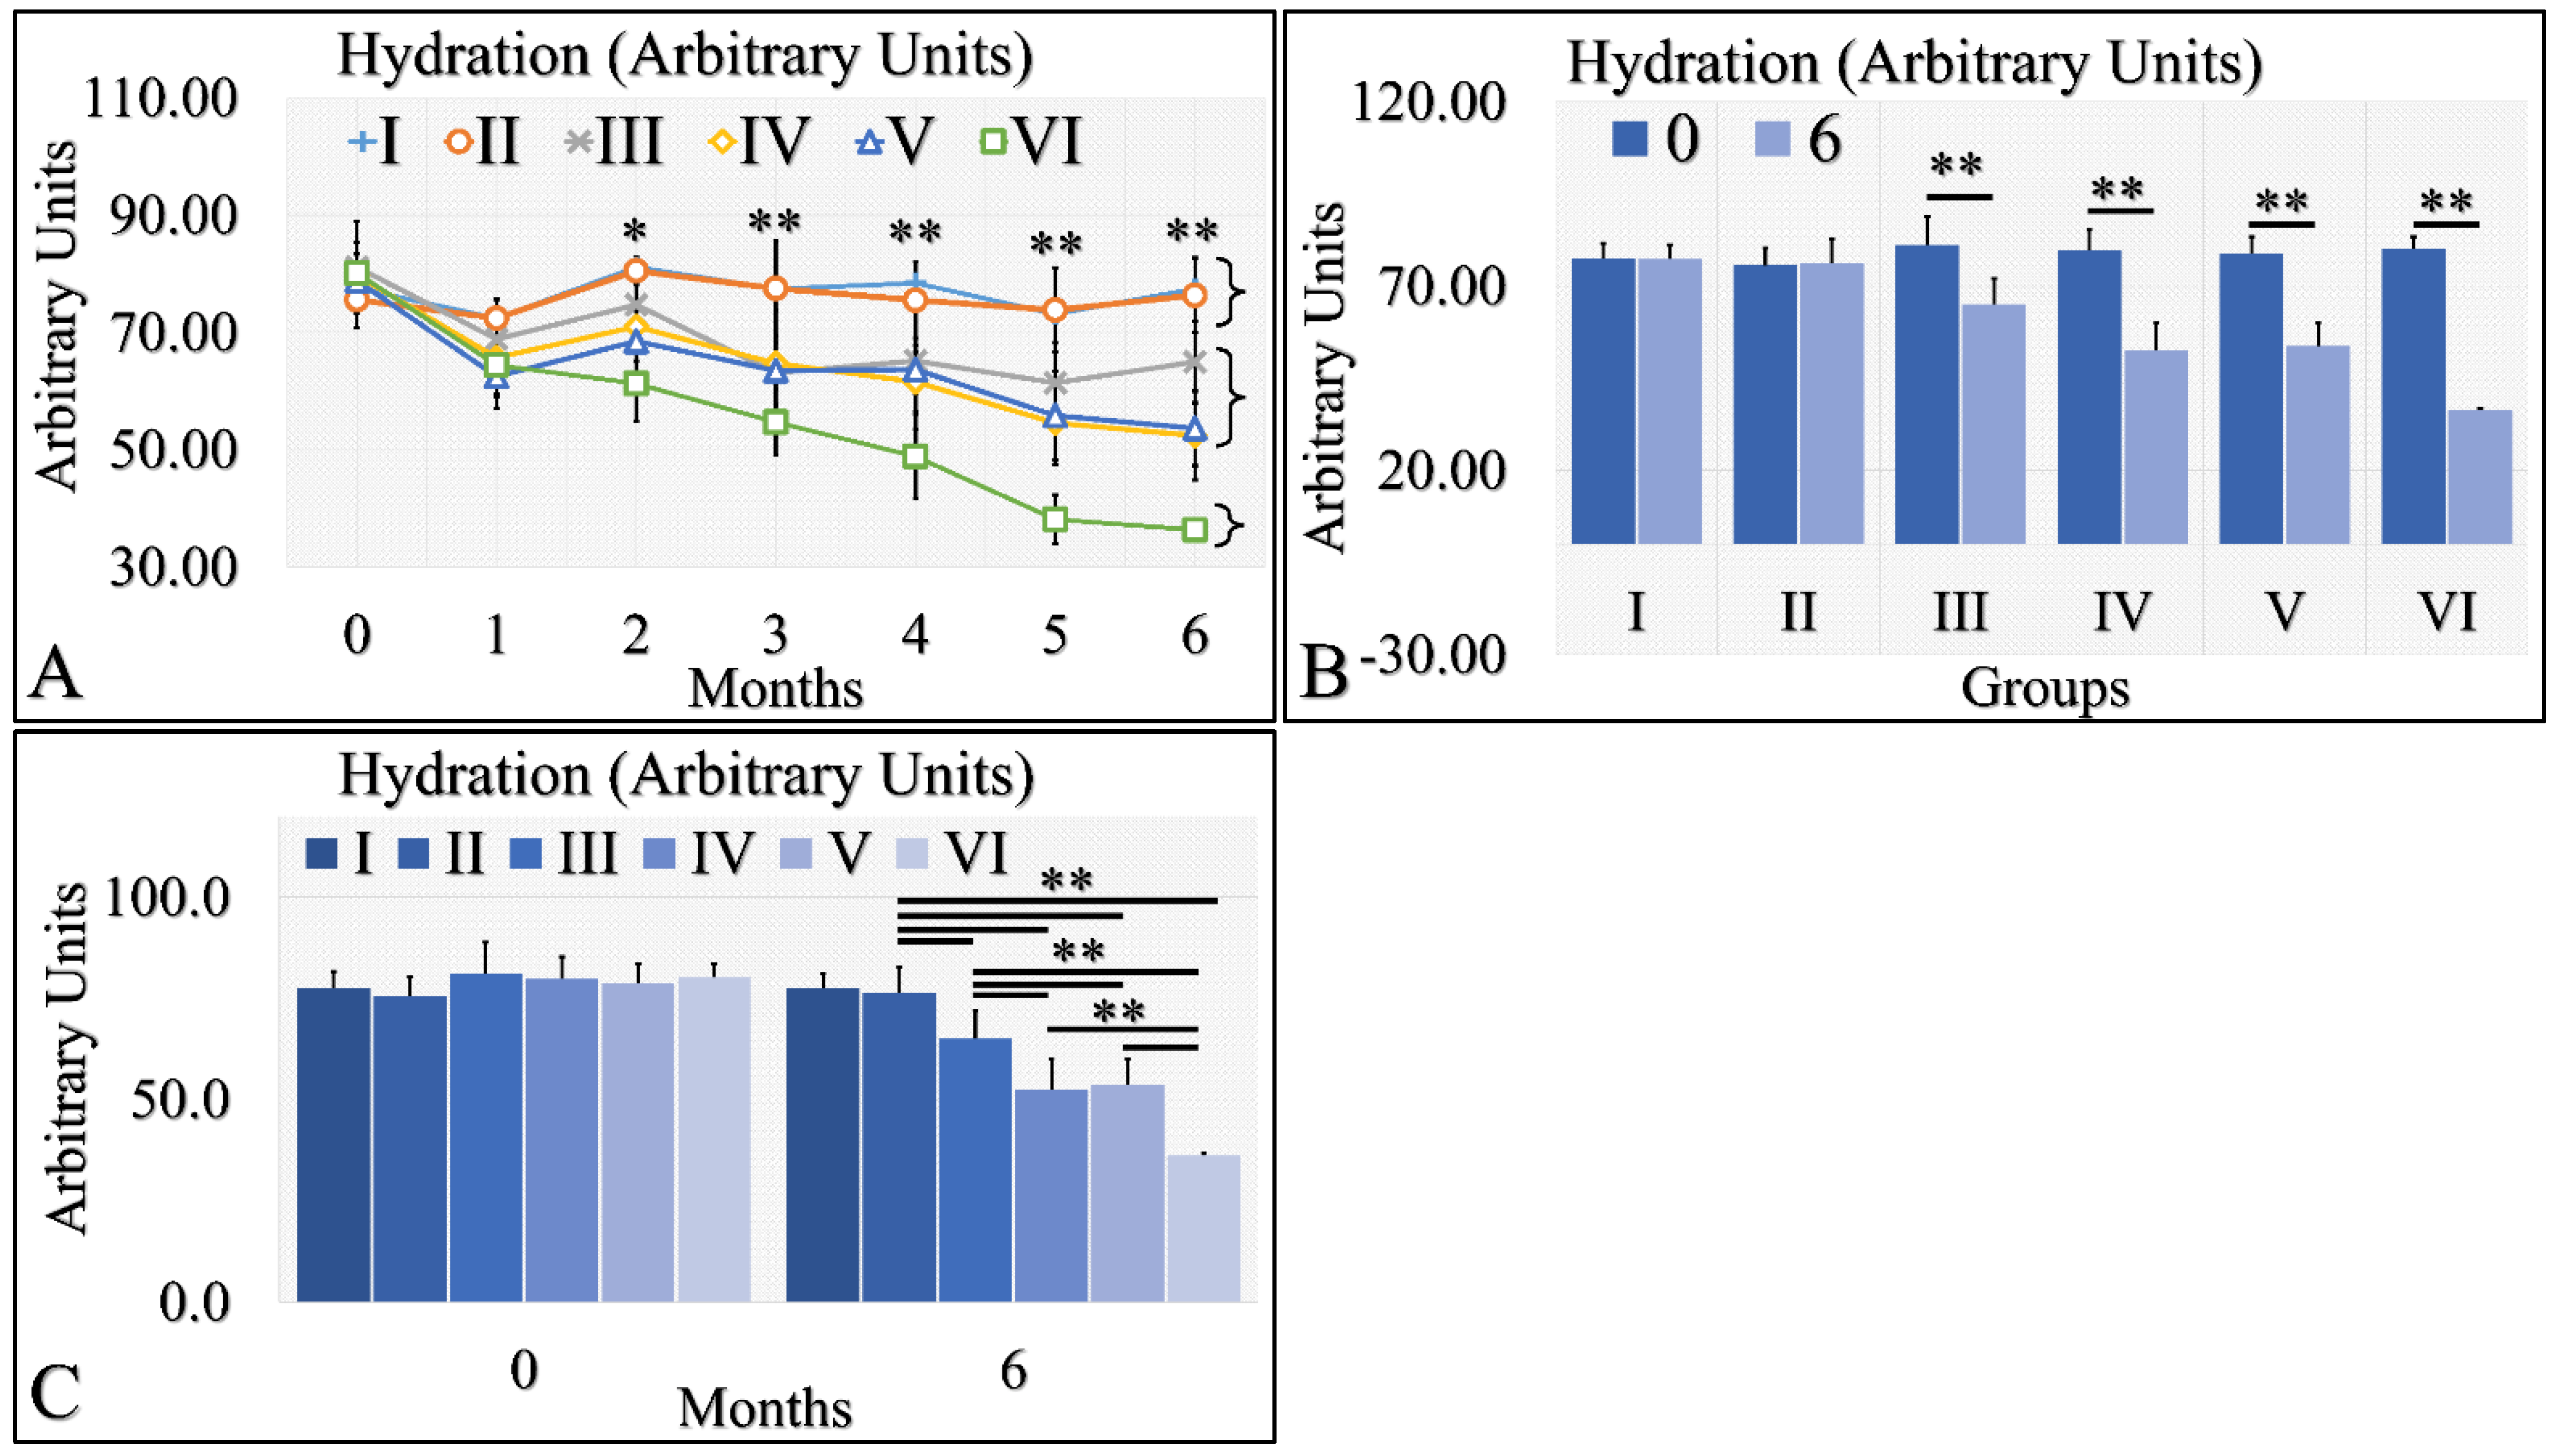
Hydration levels manifested three clusters; groups I and II, groups III, IV and V, and group VI manifested a significant decrease in hydration levels (A). Groups I and II did not manifest significant differences between month 0 and month 6, while groups III, IV, V and VI manifested significant decreases from month 0 to month 6 (B). Groups I and II manifested similar hydration levels at month 6, as well as groups IV and V (C). Groups III and VI manifested significantly different levels of hydration, as compared to all other (C). Hydration levels manifested a clear descending trend from the control group to the irradiated diabetic group (C) (Legend: I: No treatment, no diabetes induction, no irradiation, II: Type 2 diabetes induction, no irradiation, III: Type 1 diabetes induction, no irradiation, IV: No diabetes induction, irradiation, V: Type 2 diabetes induction, irradiation, VI: Type 1 diabetes induction, irradiation. In subfigure (A), ** indicates a significance of p << 0.01, as compared to the month 0 and to the other groups in the same month; and * indicates a significance of p < 0.05. In subfigures (B,C), ** depicts a significance of p << 0.01).
Figure 4.
Hydration levels manifested three clusters; groups I and II, groups III, IV and V, and group VI manifested a significant decrease in hydration levels (A). Groups I and II did not manifest significant differences between month 0 and month 6, while groups III, IV, V and VI manifested significant decreases from month 0 to month 6 (B). Groups I and II manifested similar hydration levels at month 6, as well as groups IV and V (C). Groups III and VI manifested significantly different levels of hydration, as compared to all other (C). Hydration levels manifested a clear descending trend from the control group to the irradiated diabetic group (C) (Legend: I: No treatment, no diabetes induction, no irradiation, II: Type 2 diabetes induction, no irradiation, III: Type 1 diabetes induction, no irradiation, IV: No diabetes induction, irradiation, V: Type 2 diabetes induction, irradiation, VI: Type 1 diabetes induction, irradiation. In subfigure (A), ** indicates a significance of p << 0.01, as compared to the month 0 and to the other groups in the same month; and * indicates a significance of p < 0.05. In subfigures (B,C), ** depicts a significance of p << 0.01).
![Cancers 16 01507 g004]()
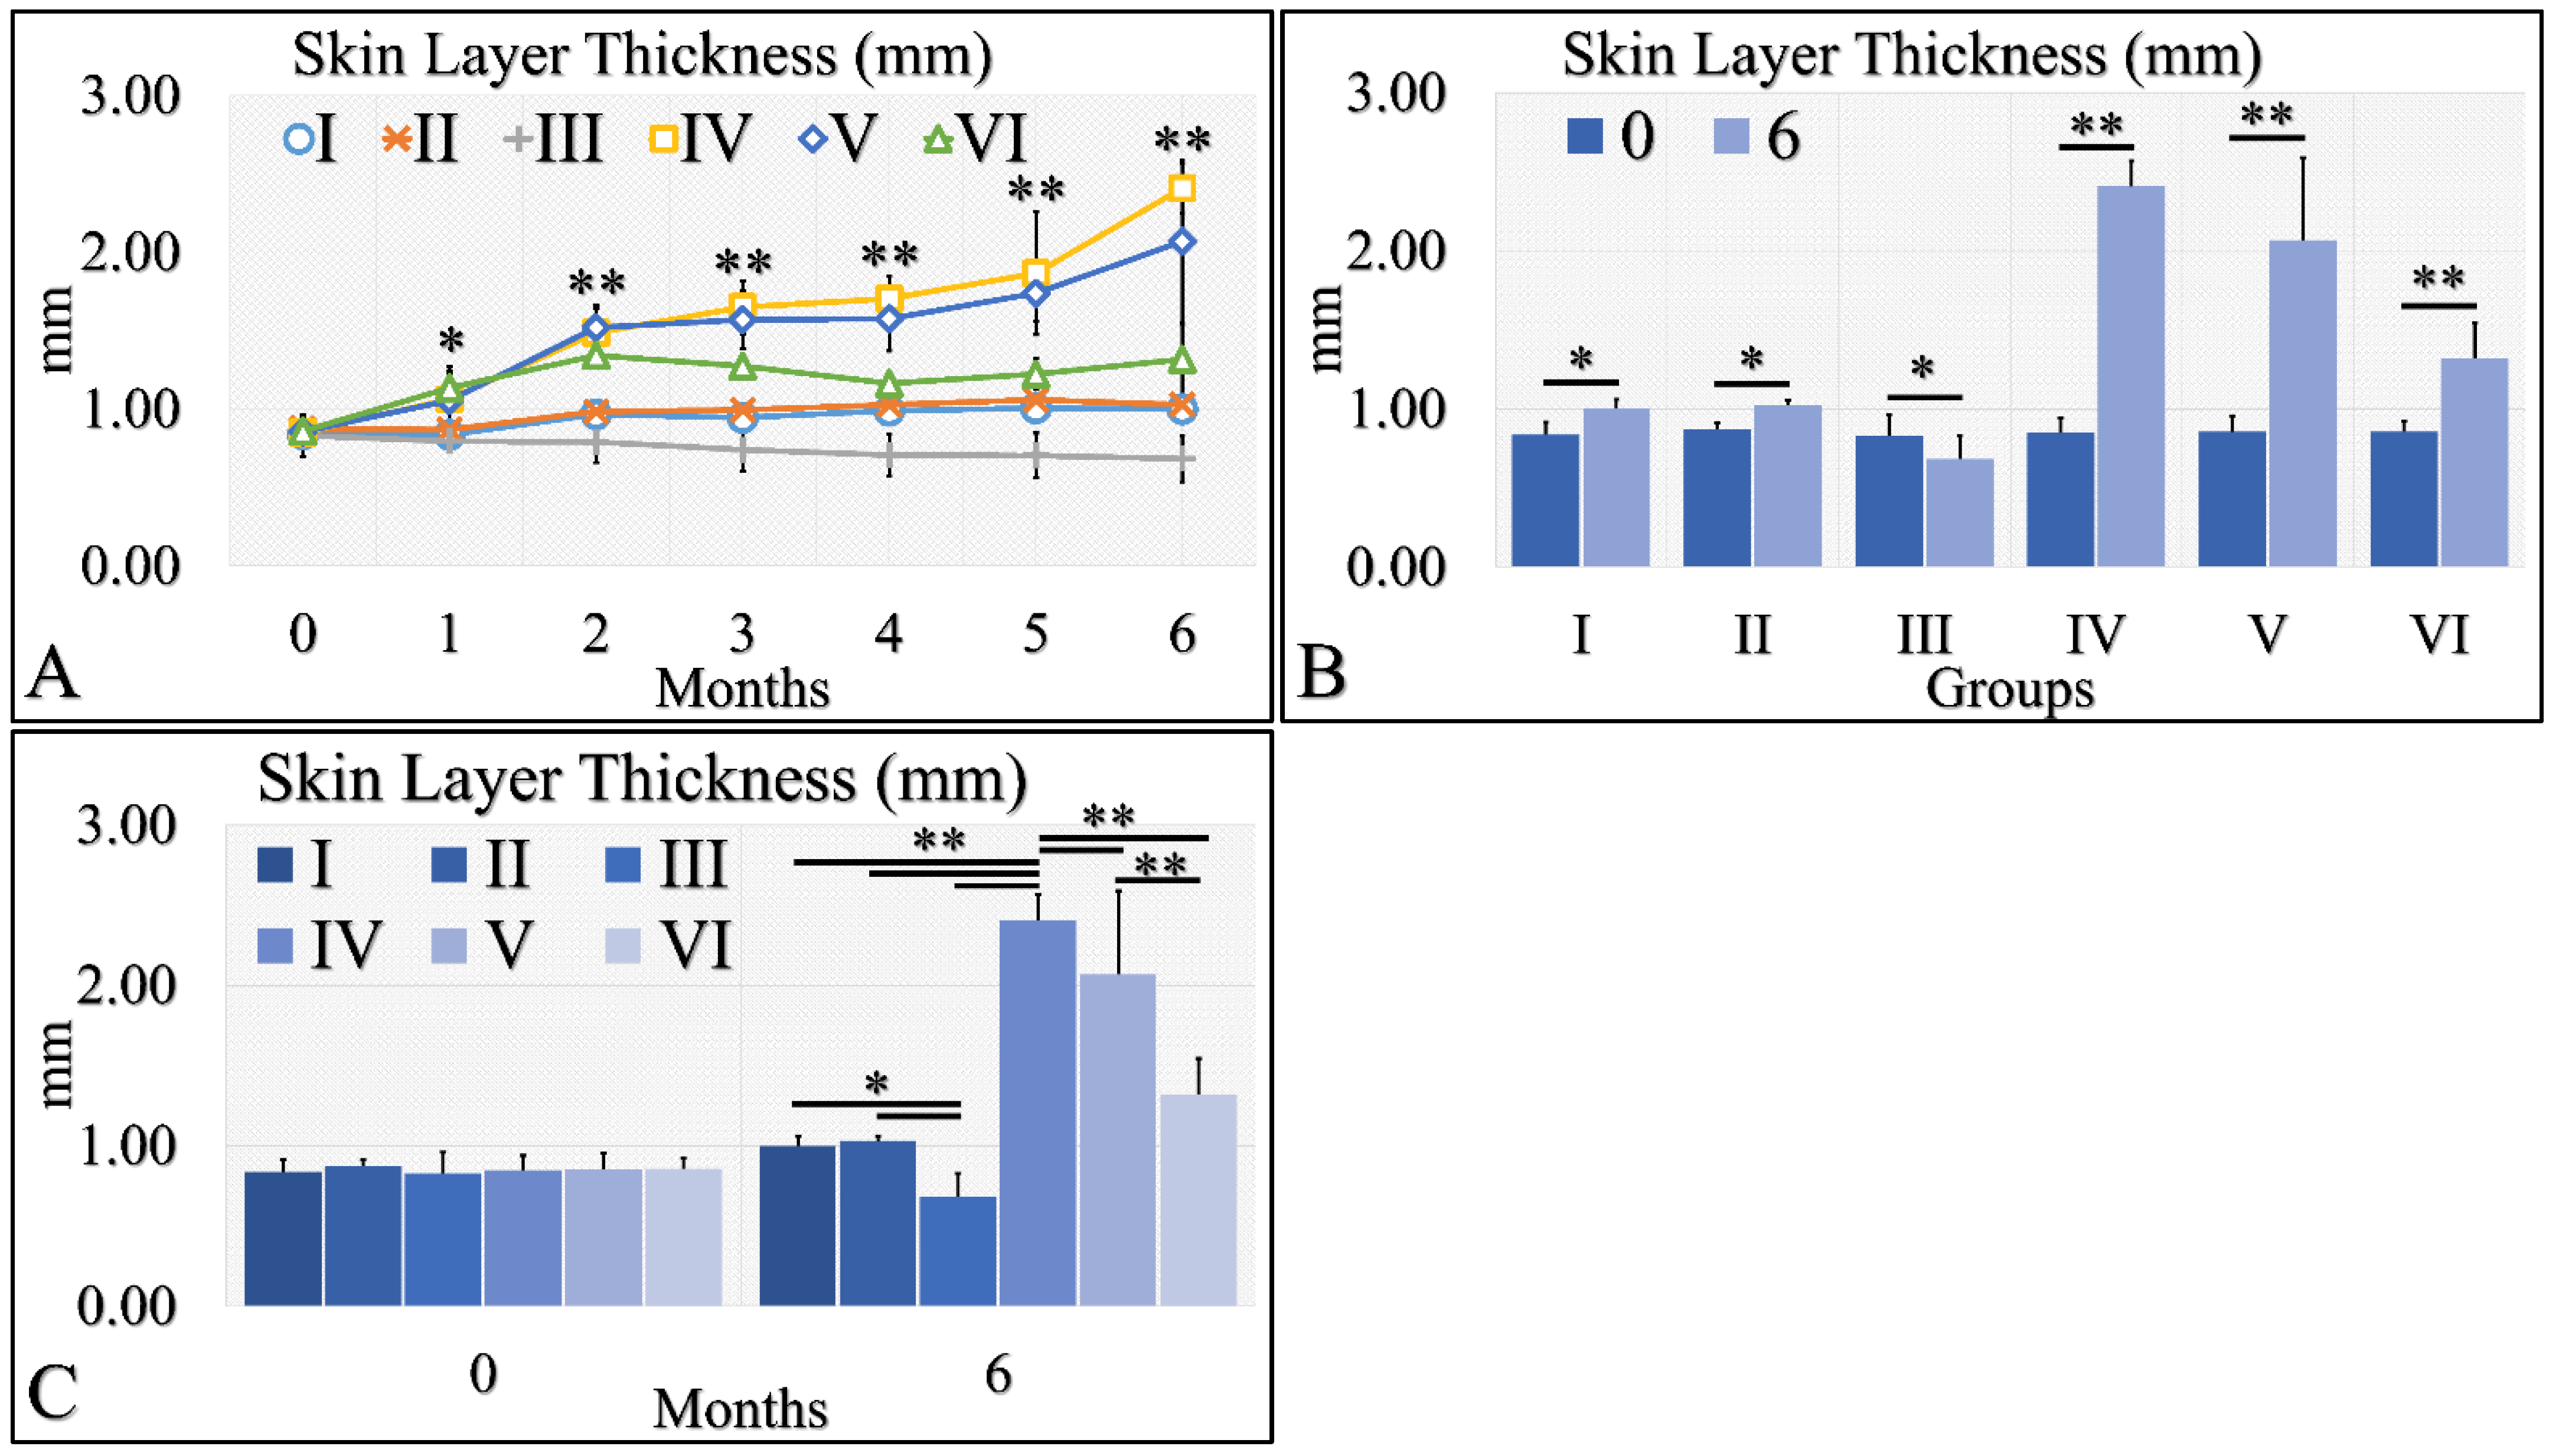
Figure 5.
Skin thickness was evaluated and groups IV and V, manifested the higher skin thickness, as compared to all other groups (A). In addition, groups IV and V manifested an ascending trend from month 0 to month 6 (A). Furthermore, all groups, except Group III, presented significantly higher skin thickness between months 0 and 6 (B). Finally, when comparing all groups at month 6, significant differences were manifested between all groups, with the exception of groups I and II (C) (Legend I: No treatment, no diabetes induction, no irradiation, II: Type 2 diabetes induction, no irradiation, III: Type 1 diabetes induction, no irradiation, IV: No diabetes induction, irradiation, V: Type 2 diabetes induction, irradiation, VI: Type 1 diabetes induction, irradiation. In subfigure (A), ** indicates a significance of p << 0.01, as compared to the month 0 and the other groups in the same month; and * indicates a significance of p < 0.05. In subfigures (B,C), ** depicts a significance of p << 0.01, * Depicts the significance of p < 0.05).
![Cancers 16 01507 g005]()
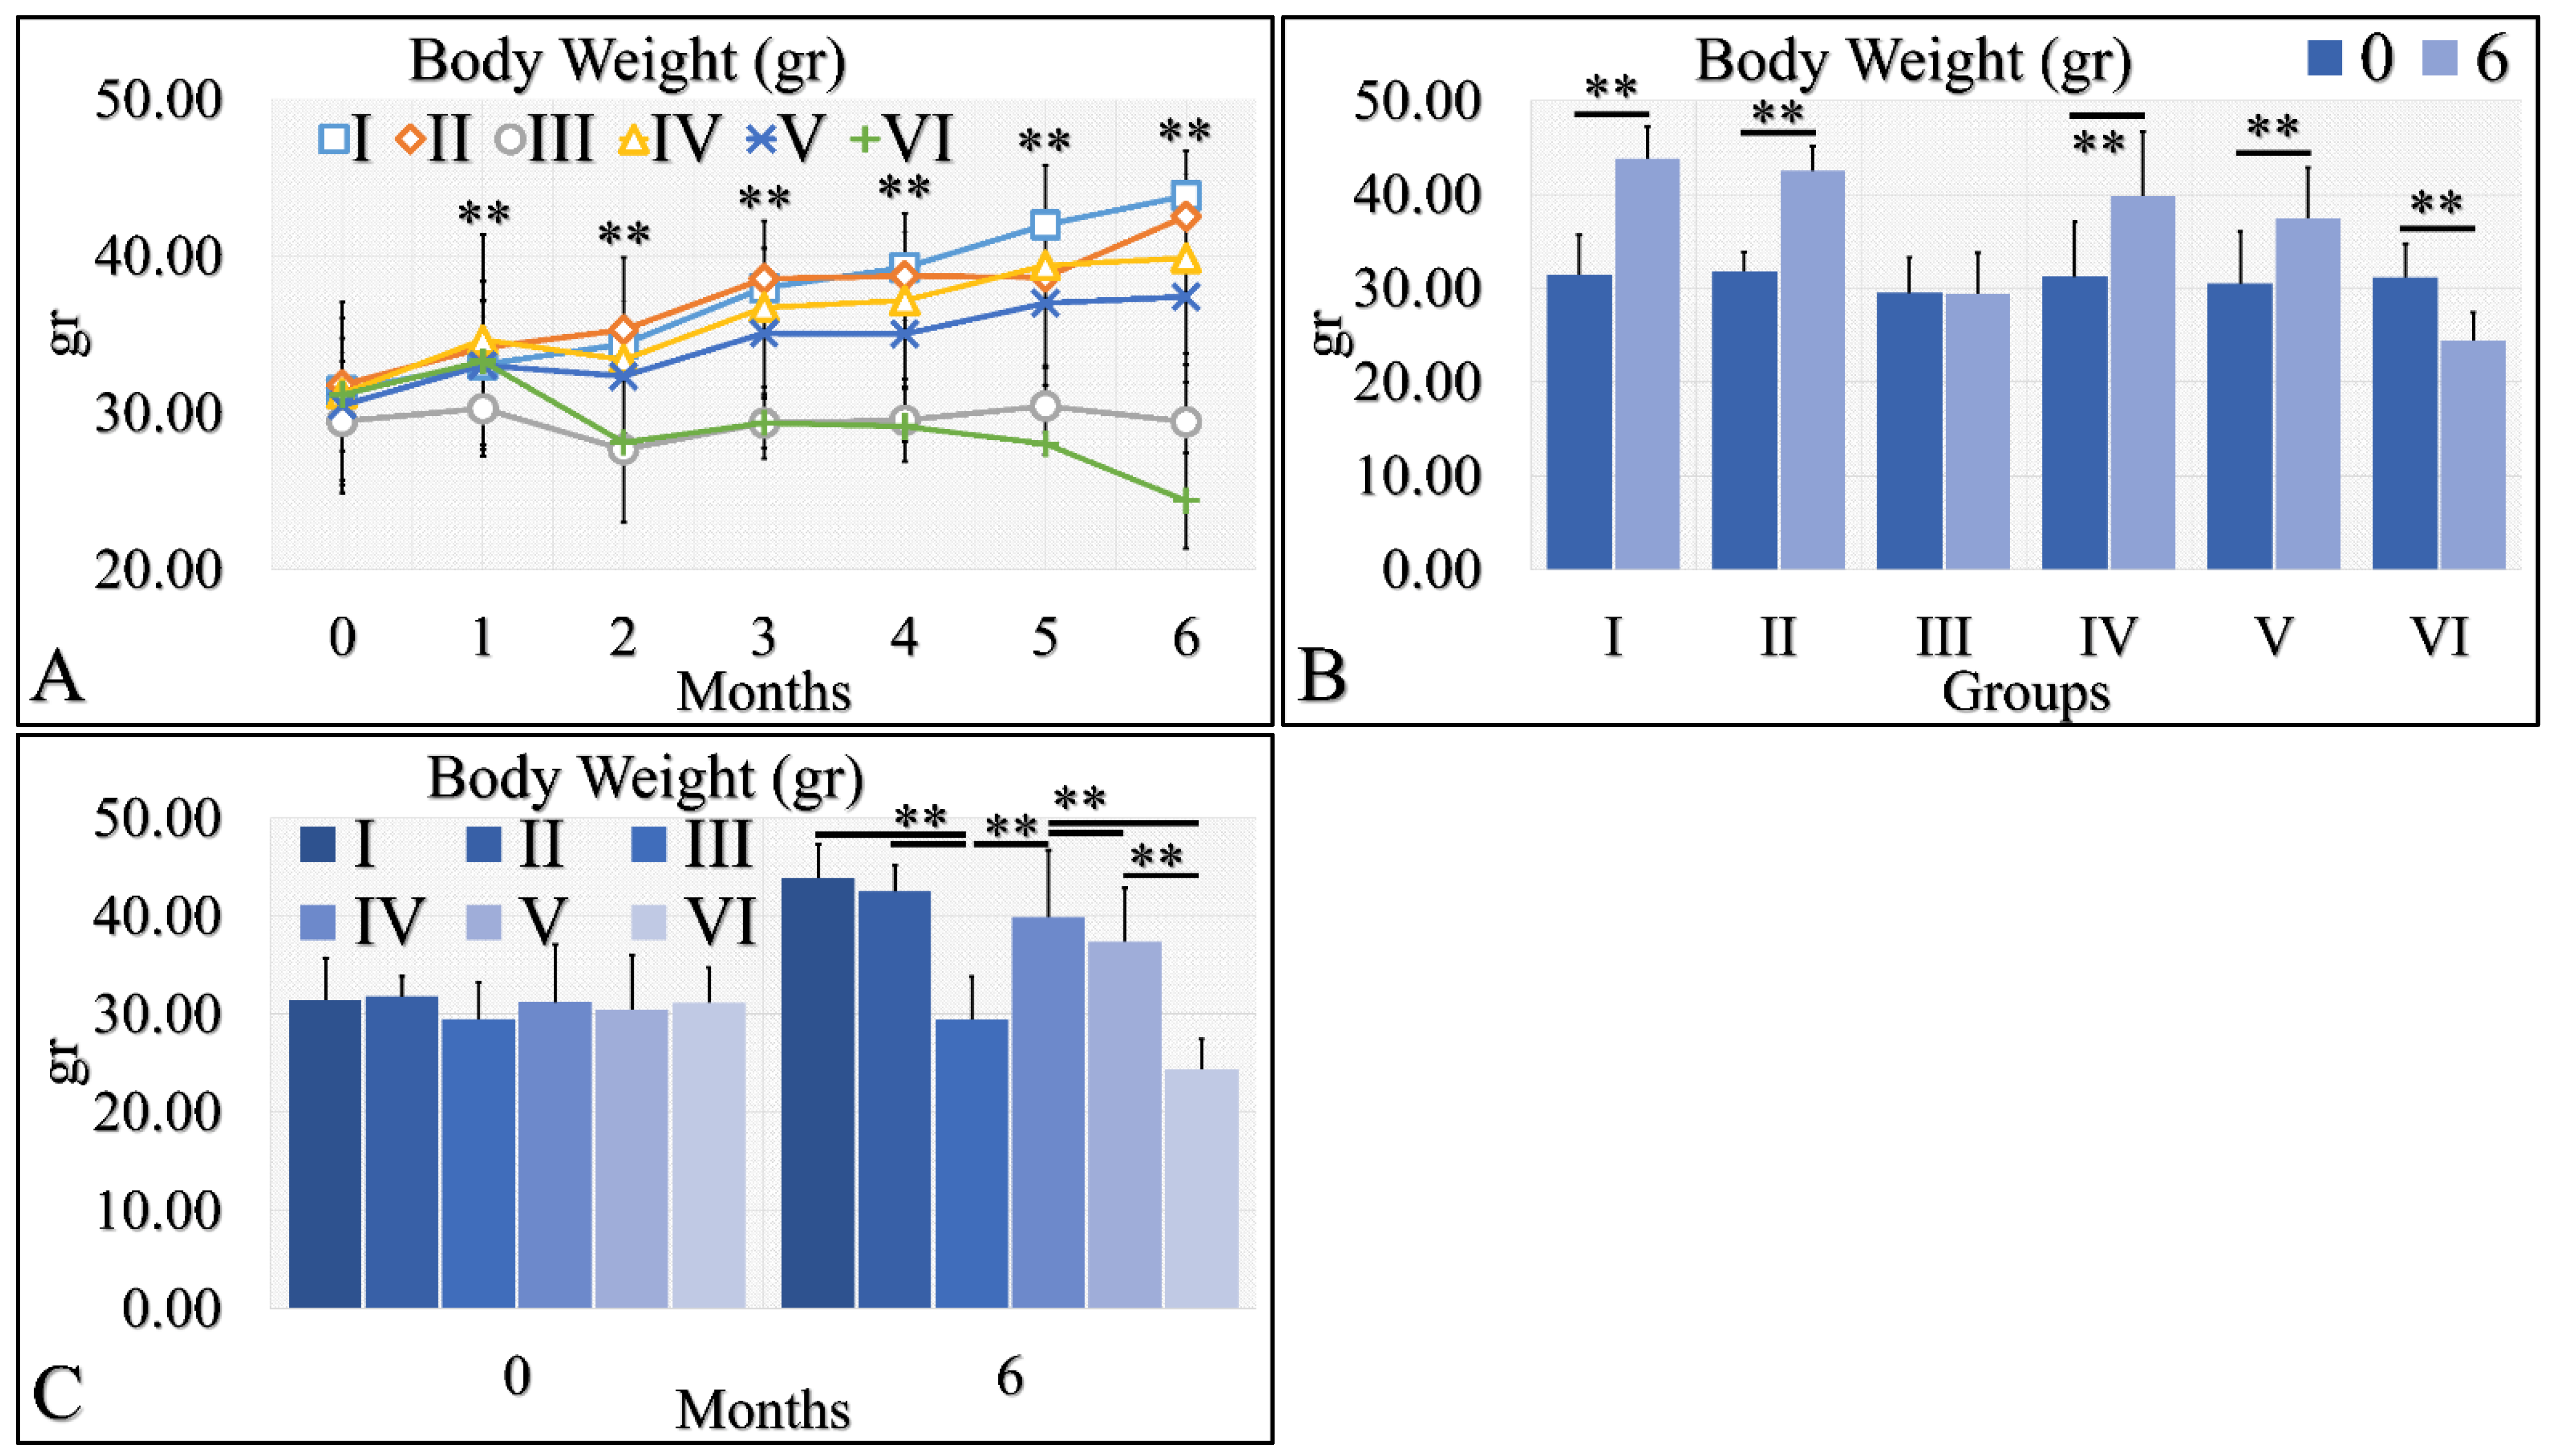
Figure 6.
Body weight was evaluated and measured in all experimental groups. The irradiated Type 1 diabetic mice (Group VI) manifested the lowest body weight, as compared to all other groups (A). This was followed by the Type 1 diabetic mice (Group III), while all other groups manifested an increase in body weight, with respect to time (A). The comparison of month 0 and month 6 for all experimental cases showed that groups I and II manifested a significant increase in body weight, while Group III did not manifest any differences (B). Groups IV and V manifested a significant increase in body weight and, on the contrary, the irradiated Type 1 diabetic mice lost weight after 6 months of treatment (B). Comparing mice body weight at month 6, groups III and VI manifested significantly lower body weight, as compared to the other groups, while control mice manifested the higher body weight (C) (Legend: I: No treatment, no diabetes induction, no irradiation, II: Type 2 diabetes induction, no irradiation, III: Type 1 diabetes induction, no irradiation, IV: No diabetes induction, irradiation, V: Type 2 diabetes induction, irradiation, VI: Type 1 diabetes induction, irradiation. In subfigure (A), ** indicates a significance of p << 0.01, as compared to the month 0 and to the other groups in the same month; In subfigures (B,C), ** depicts a significance of p << 0.01).
![Cancers 16 01507 g006]()
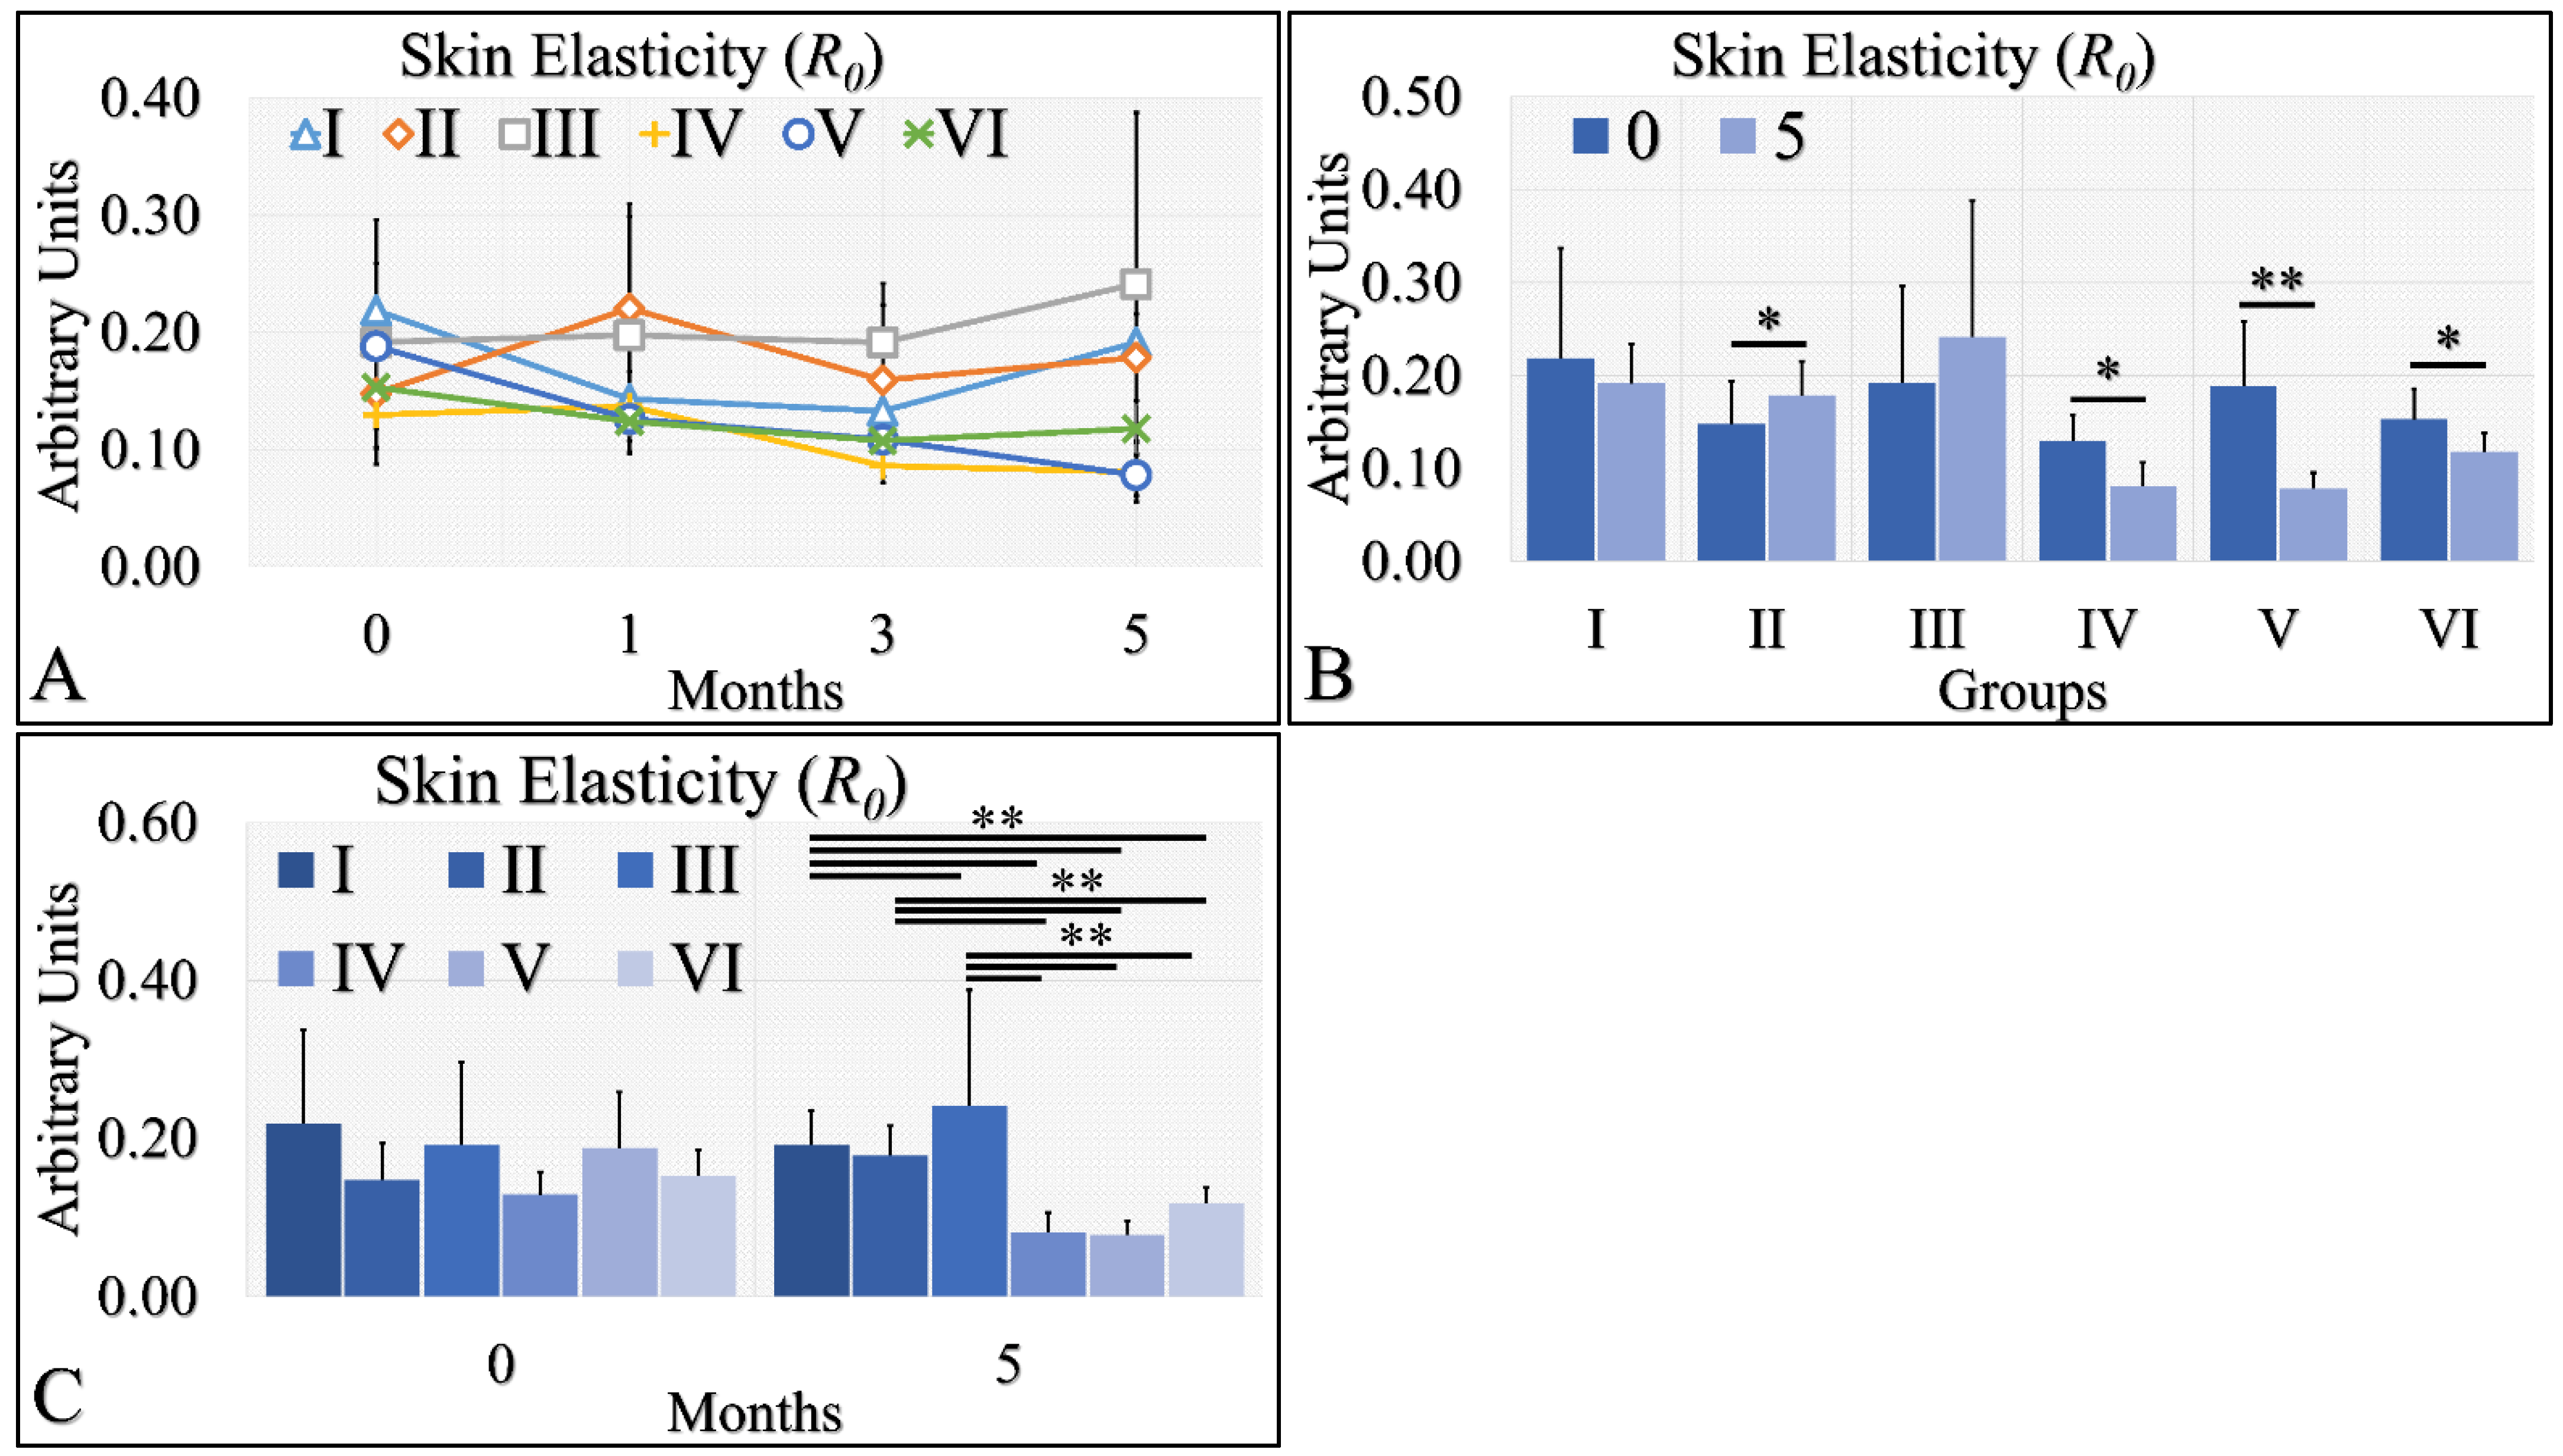
Figure 7.
Skin elasticity measurements can be divided into two classes; the highest levels were manifested by groups I, II, III; however, there no significant difference among them (A). On the other hand, the lowest levels of skin elasticity were observed by groups IV, V and VI also, with no significant difference among them (A). Comparing the skin elasticity between months 0 and 5, all groups manifested significant differences, except for groups I and III (B). Comparing the skin elasticity values at month 5, it was confirmed that no significant differences appeared between groups I, II, III, as well as IV, V and VI (C). Yet, groups I, II and III manifested significant differences with respect to groups IV, V and VI (C) (Legend: I: No treatment, no diabetes induction, no irradiation, II: Type 2 diabetes induction, no irradiation, III: Type 1 diabetes induction, no irradiation, IV: No diabetes induction, irradiation, V: Type 2 diabetes induction, irradiation, VI: Type 1 diabetes induction, irradiation. * Depicts the significance of p < 0.05. ** depicts a significance of p << 0.01).
![Cancers 16 01507 g007]()
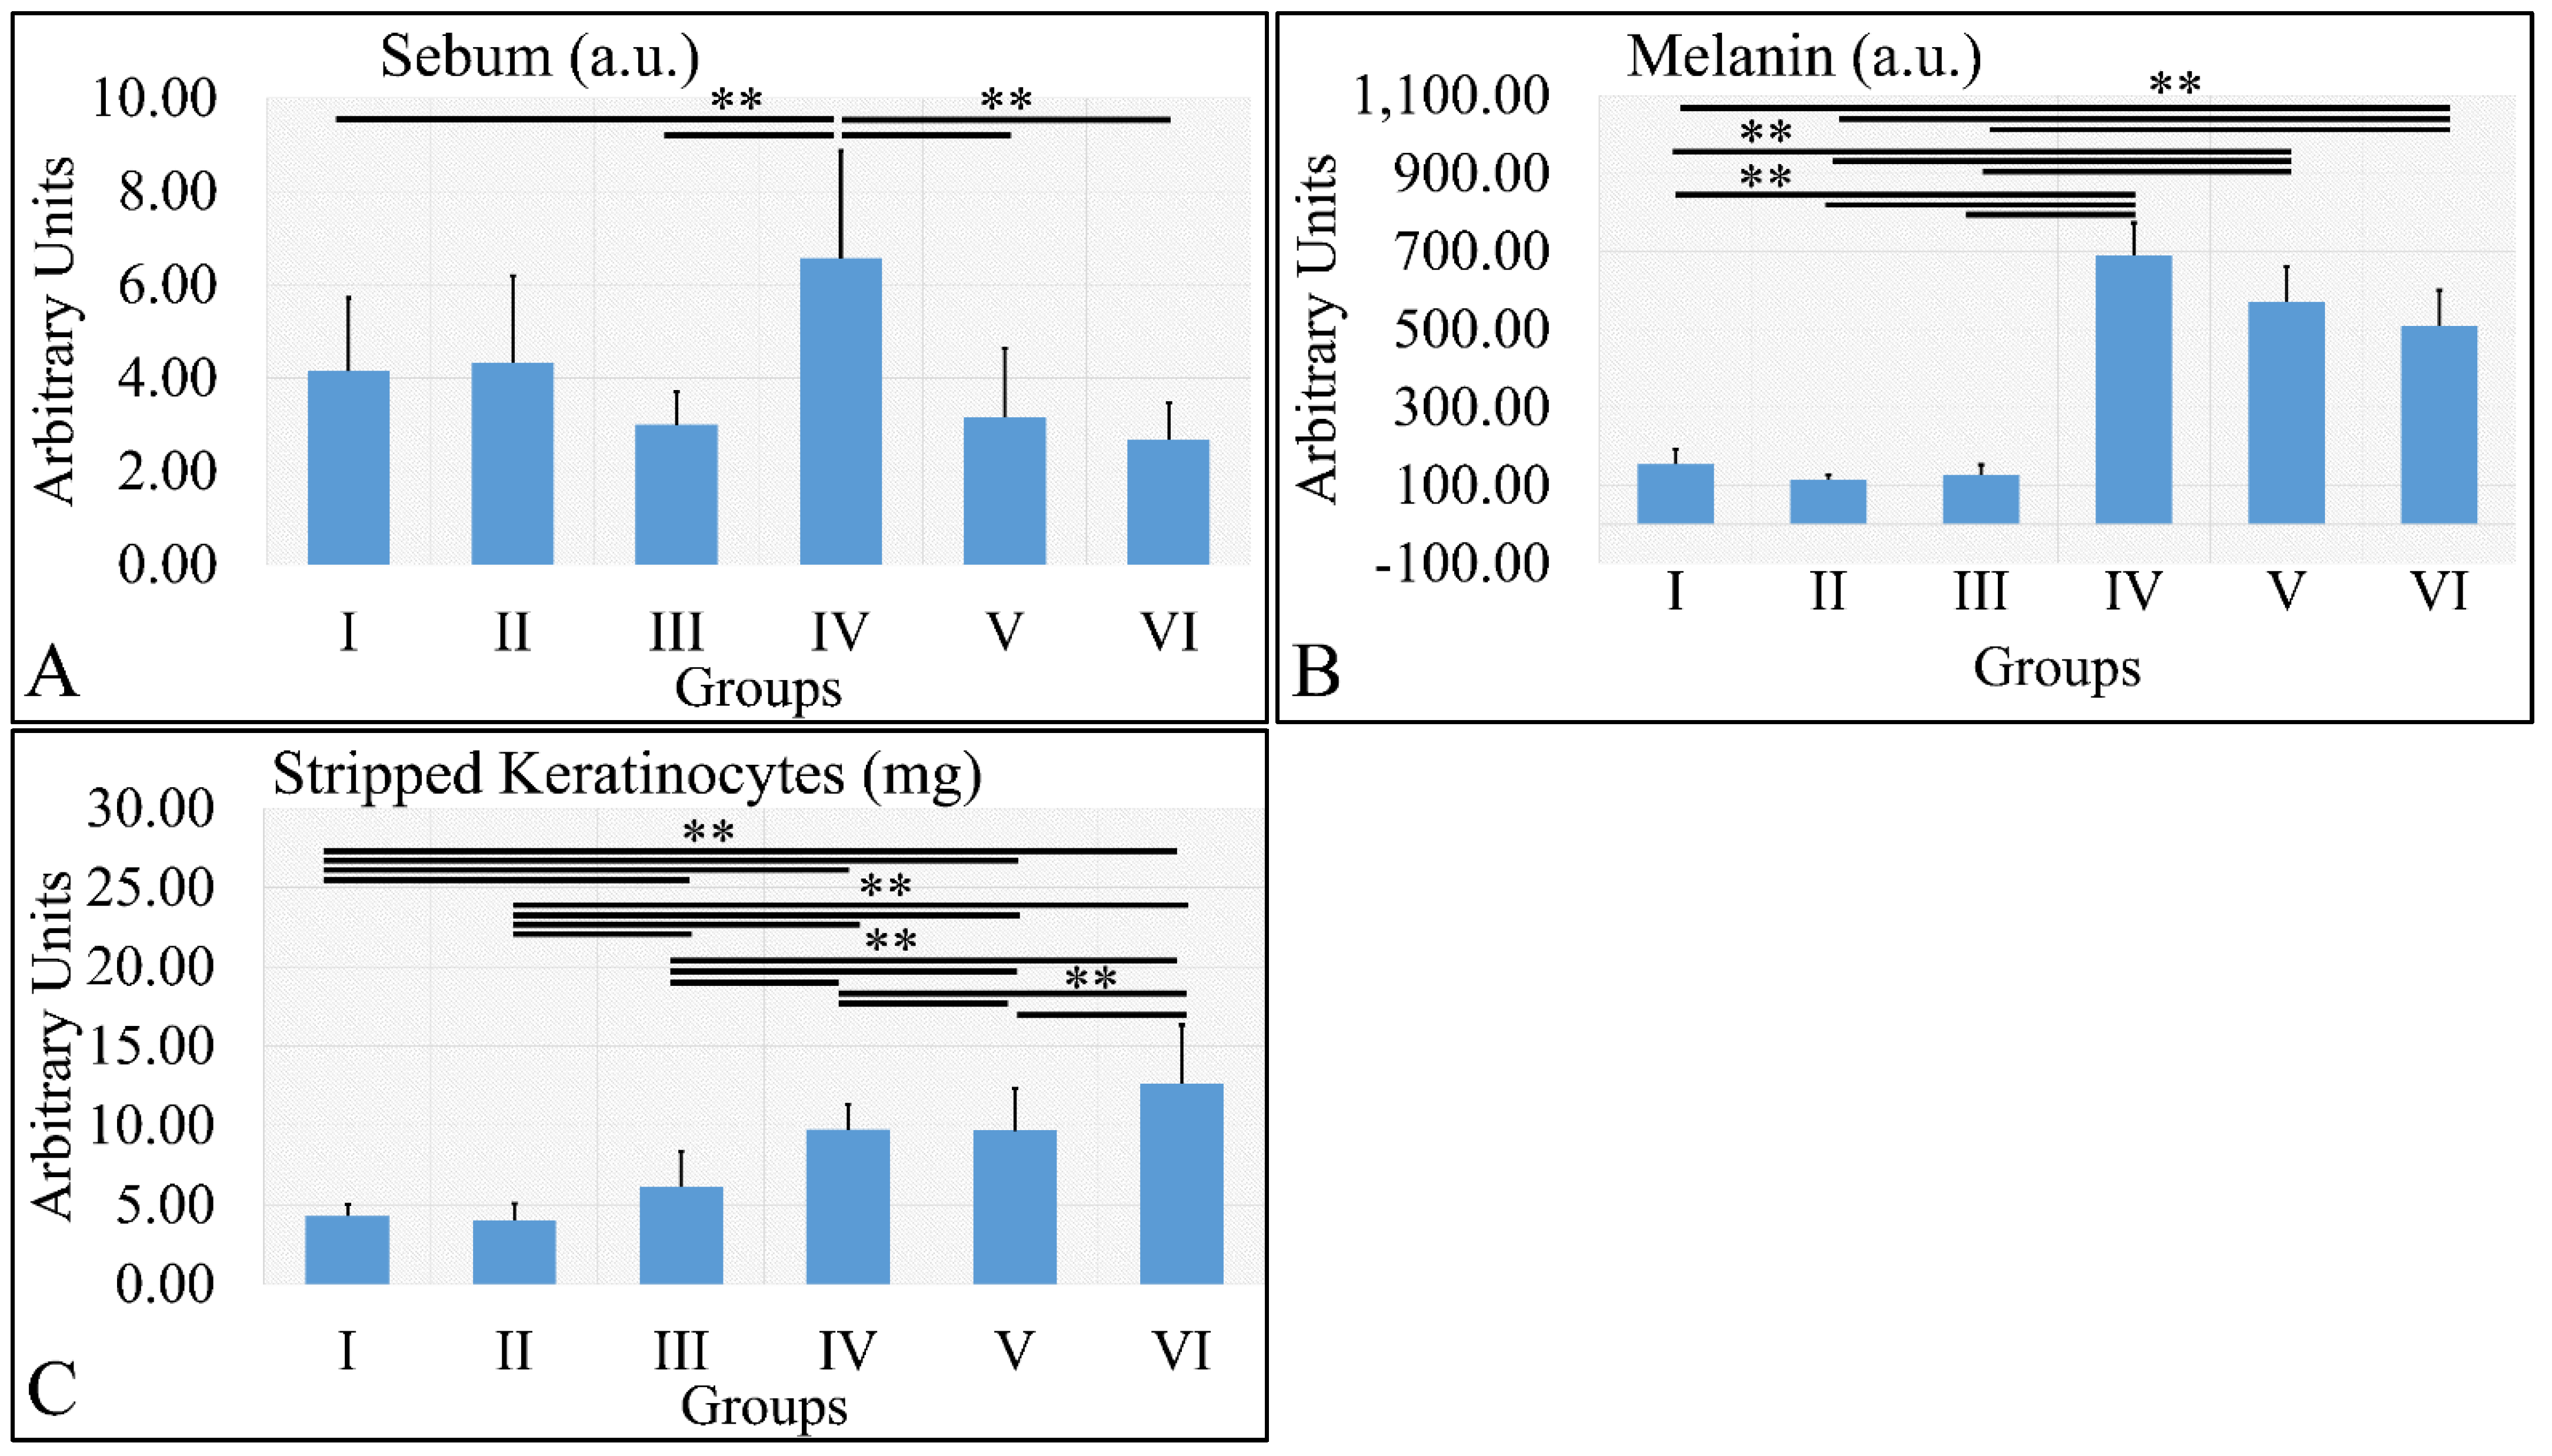
Figure 8.
Sebum manifested significantly higher levels for Group IV, as compared to all other groups (A). Melanin levels were significantly higher in all irradiated groups, as compared to the non-irradiated groups (B). Stripped keratinocytes were significantly more abundant between all groups, as compared to each other, with the exception of groups I and II, where no significant differences were observed (C) (Legend: I: No treatment, no diabetes induction, no irradiation, II: Type 2 diabetes induction, no irradiation, III: Type 1 diabetes induction, no irradiation, IV: No diabetes induction, irradiation, V: Type 2 diabetes induction, irradiation, VI: Type 1 diabetes induction, irradiation. ** depicts a significance of p < 0.01).
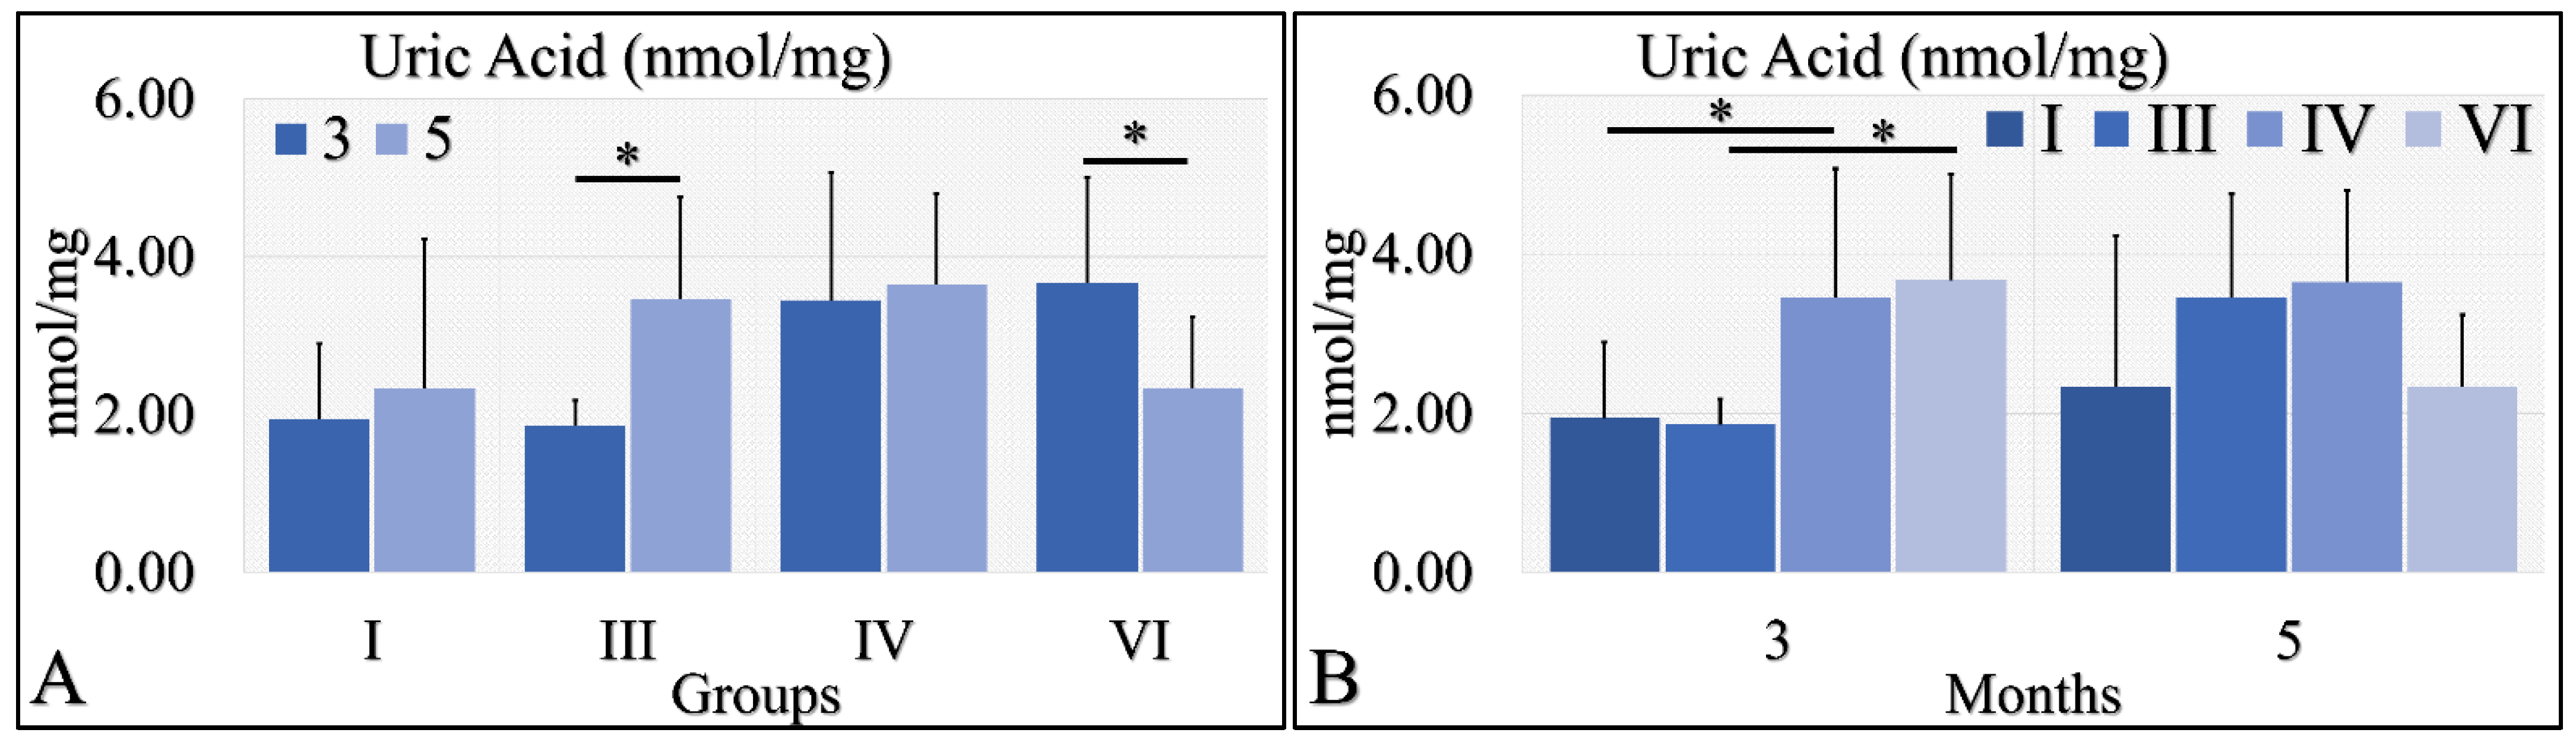
Figure 9.
Uric acid measurements showed that Group III manifested significantly higher levels at month 5, as compared to month 3 (A), as well as Group VI manifested significantly lower levels at month 5, as compared to month 3 (A). No significant differences were observed at month 5 among all groups (B). Yet, irradiated control and irradiated diabetic mice manifested significantly higher levels of uric acid, as compared to non-irradiated groups (B) (Legend: I: No treatment, no diabetes induction, no irradiation, II: Type 2 diabetes induction, no irradiation, III: Diabetes induction, no irradiation, IV: No diabetes induction, irradiation, V: Type 2 diabetes induction, irradiation, VI: Diabetes induction, irradiation. * depicts a significance of p < 0.05).
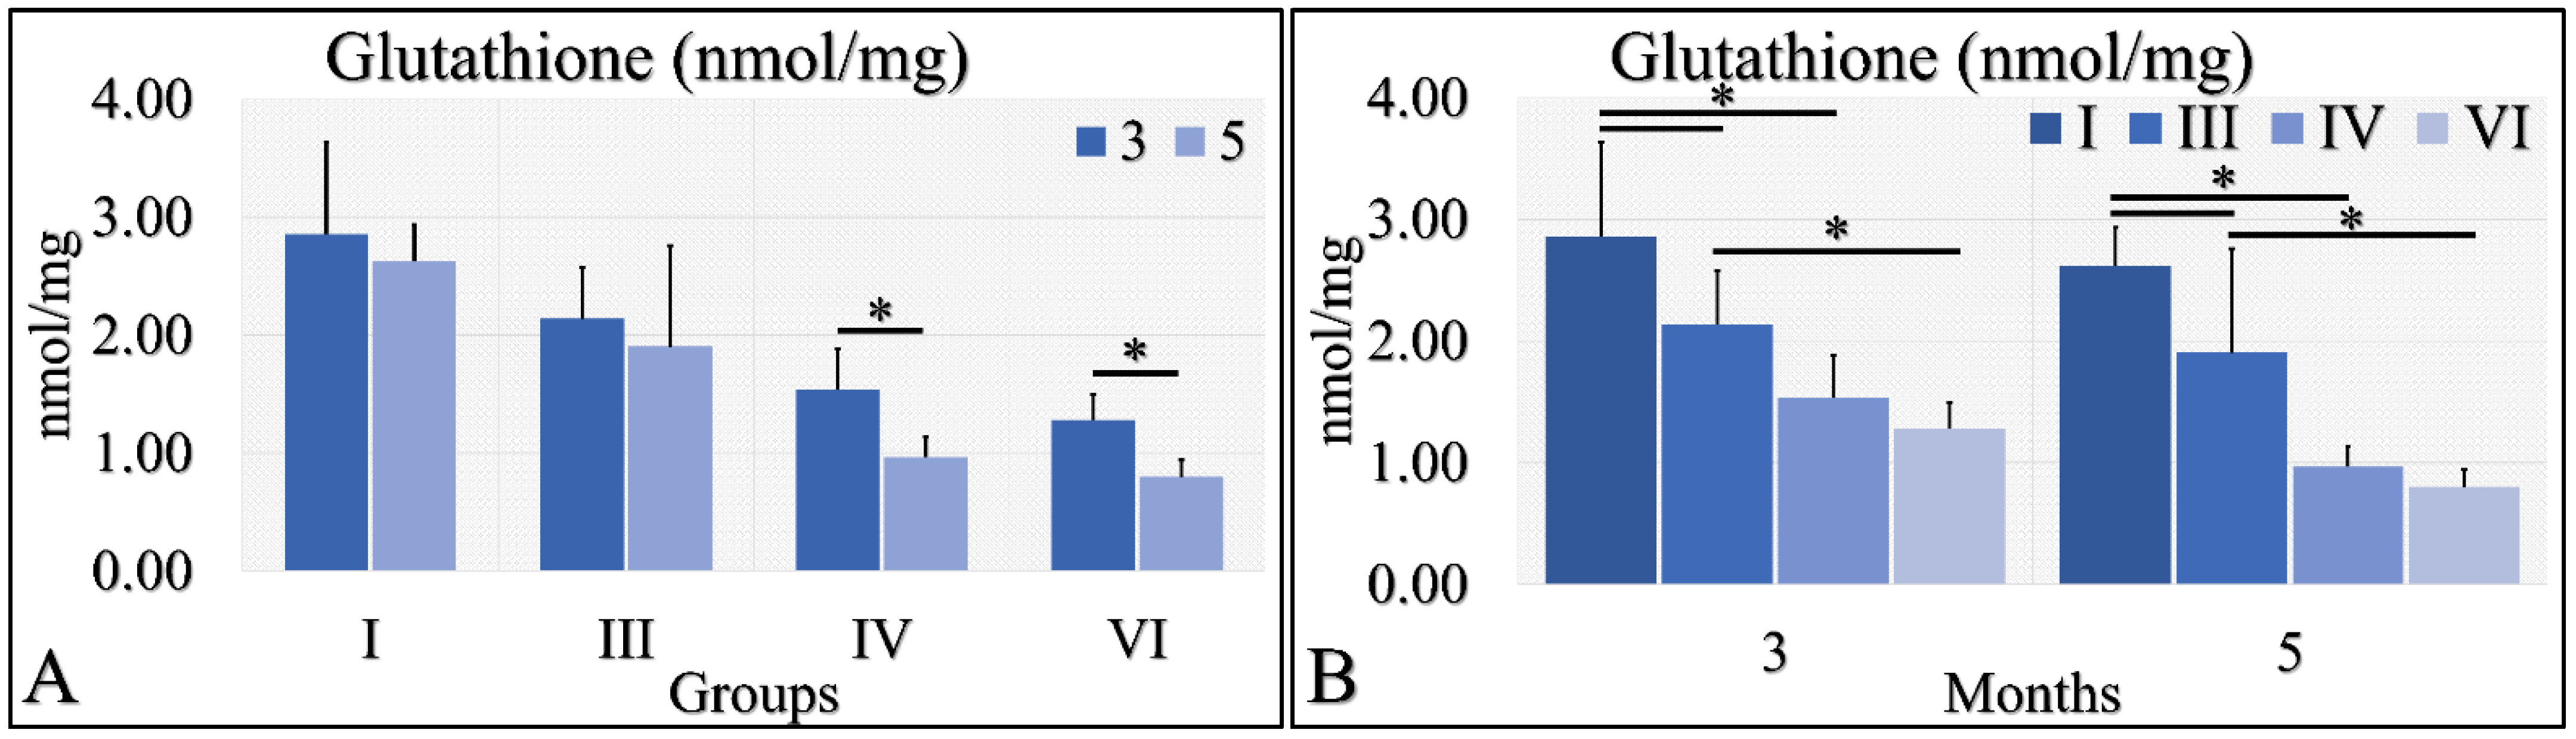
Figure 10.
Glutathione measurements showed that Group IV manifested significantly higher levels at month 3, as compared to month 5 (A); and group VI manifested significantly higher levels at month 3, as compared to month 5 (A). When comparing the experimental groups amongst them, we have found that, in both months, control mice (Group I) manifested higher glutathione levels, as compared to diabetic (Group III) and irradiated diabetic (group VI) mice; we also found that diabetic (Group III) mice manifested significantly higher levels, as compared to irradiated diabetic (Group VI) mice (B) (Legend: I: No treatment, no diabetes induction, no irradiation, II: Type 2 diabetes induction, no irradiation, III: Diabetes induction, no irradiation, IV: No diabetes induction, irradiation, V: Type 2 diabetes induction, irradiation, VI: Diabetes induction, irradiation. * depicts the significance of p < 0.05).
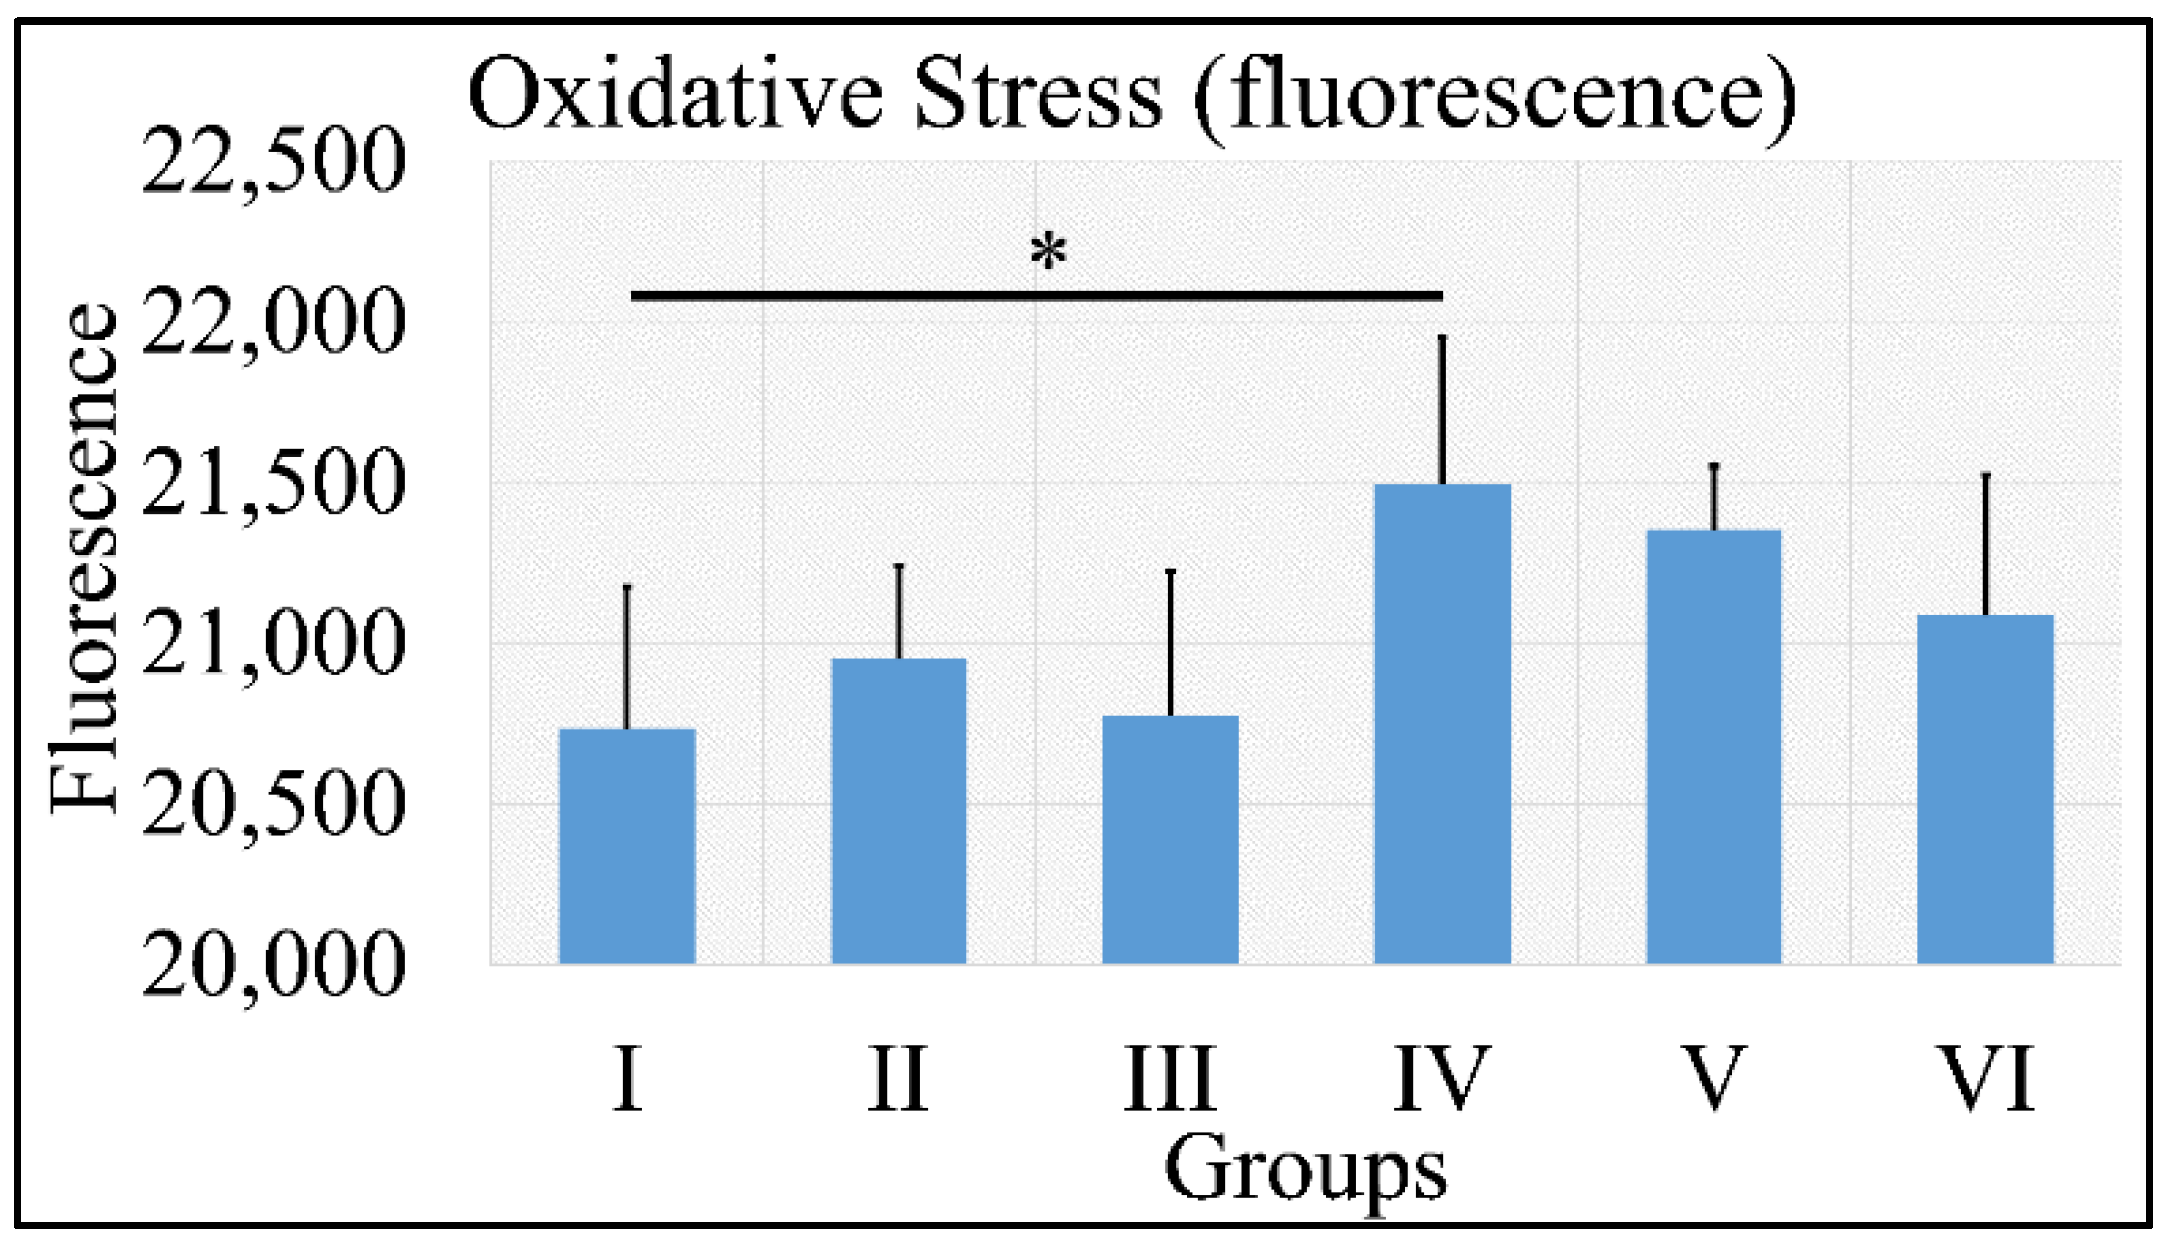
Figure 11.
ROS measurements manifested that no significant differences were found among all groups, with the exception of Group IV, which manifested significantly higher ROS levels, as compared to Group I (Legend: I: No treatment, no diabetes induction, no irradiation, II: Type 2 diabetes induction, no irradiation, III: Type 1 diabetes induction, no irradiation, IV: No diabetes induction, irradiation, V: Type 2 diabetes induction, irradiation, VI: Type 1 diabetes induction, irradiation. * depicts the significance of p < 0.05).
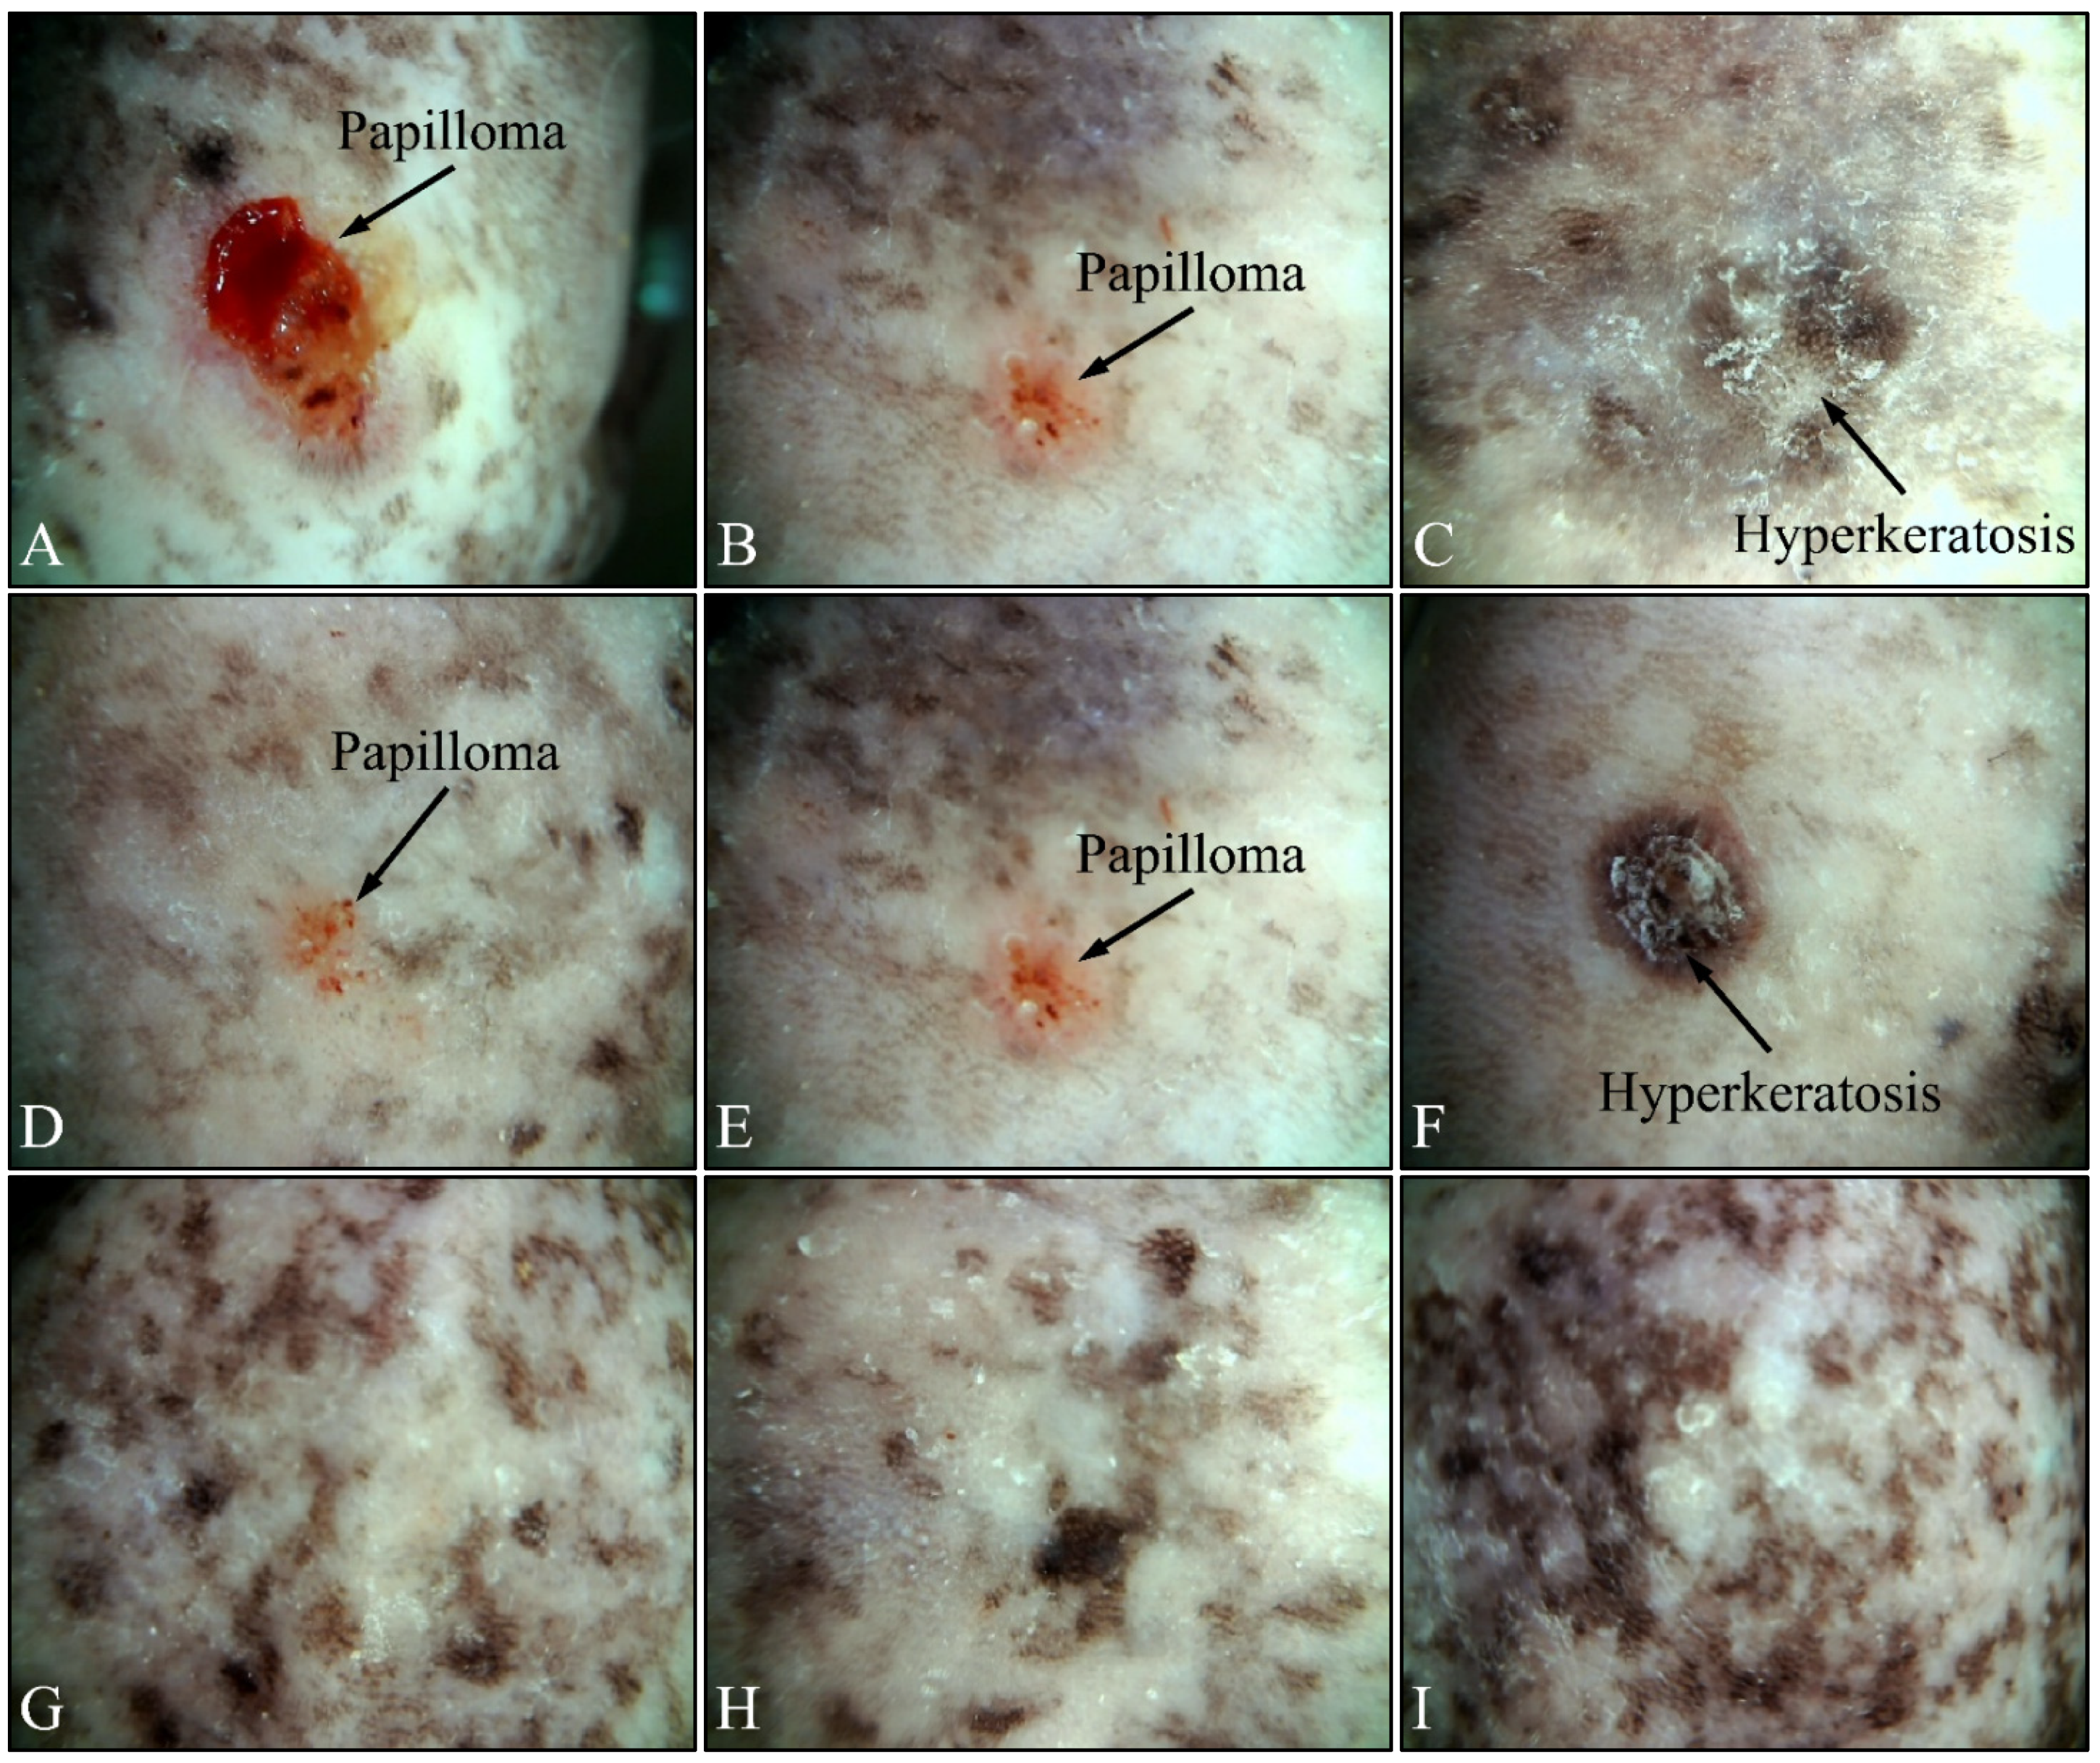
Figure 12.
Dermatoscopic evaluation of mice experimental groups. Control irradiated mice manifested the presence of papilloma and hyperkeratosis after six months of treatment (A–C). In addition, irradiated Type 2 diabetic mice also manifested papilloma and hyperkeratosis, yet to a lower extent, as compared to the control group (D–F). On the contrary, irradiated Type 1 diabetic mice did not manifest any papilloma or hyperkeratosis (G–I).
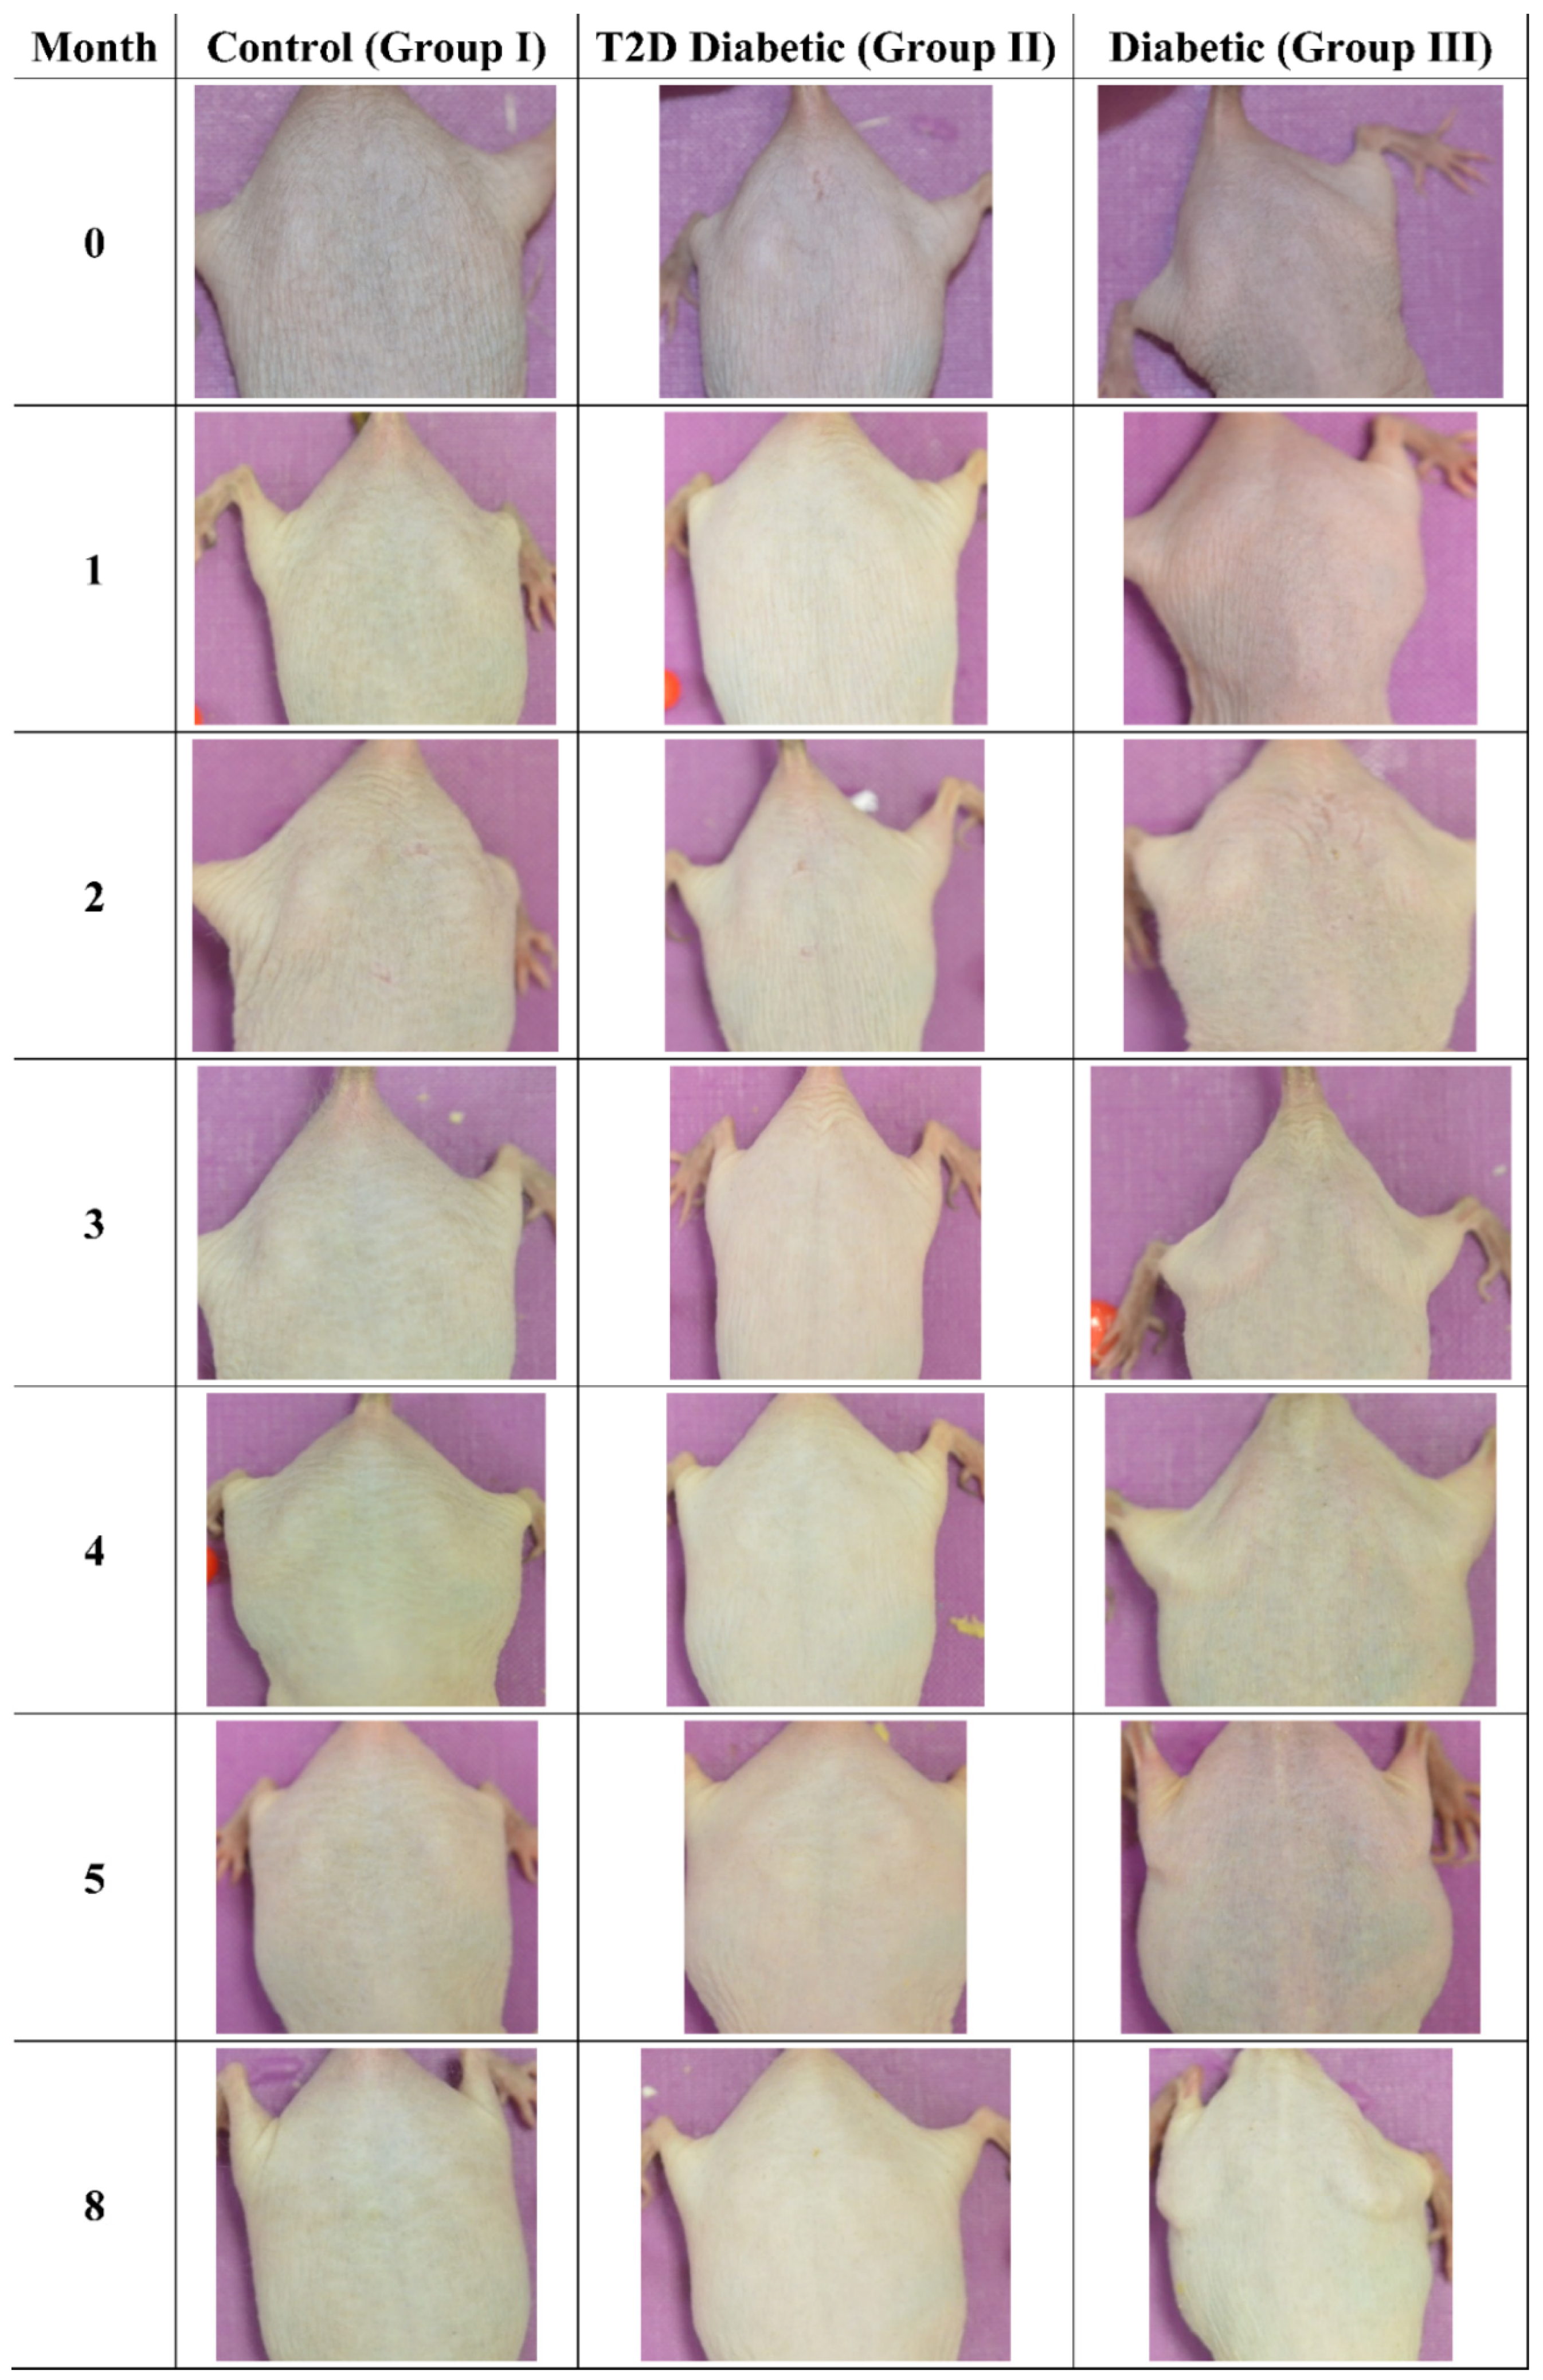
Figure 13.
Photographic evaluation of UV irradiation effects on the experimental model. Non-irradiated mice manifested no skin benign or malignant transformations. (T2D: Type 2 Diabetes, Diabetic: Type 1 Diabetes).
Figure 13.
Photographic evaluation of UV irradiation effects on the experimental model. Non-irradiated mice manifested no skin benign or malignant transformations. (T2D: Type 2 Diabetes, Diabetic: Type 1 Diabetes).
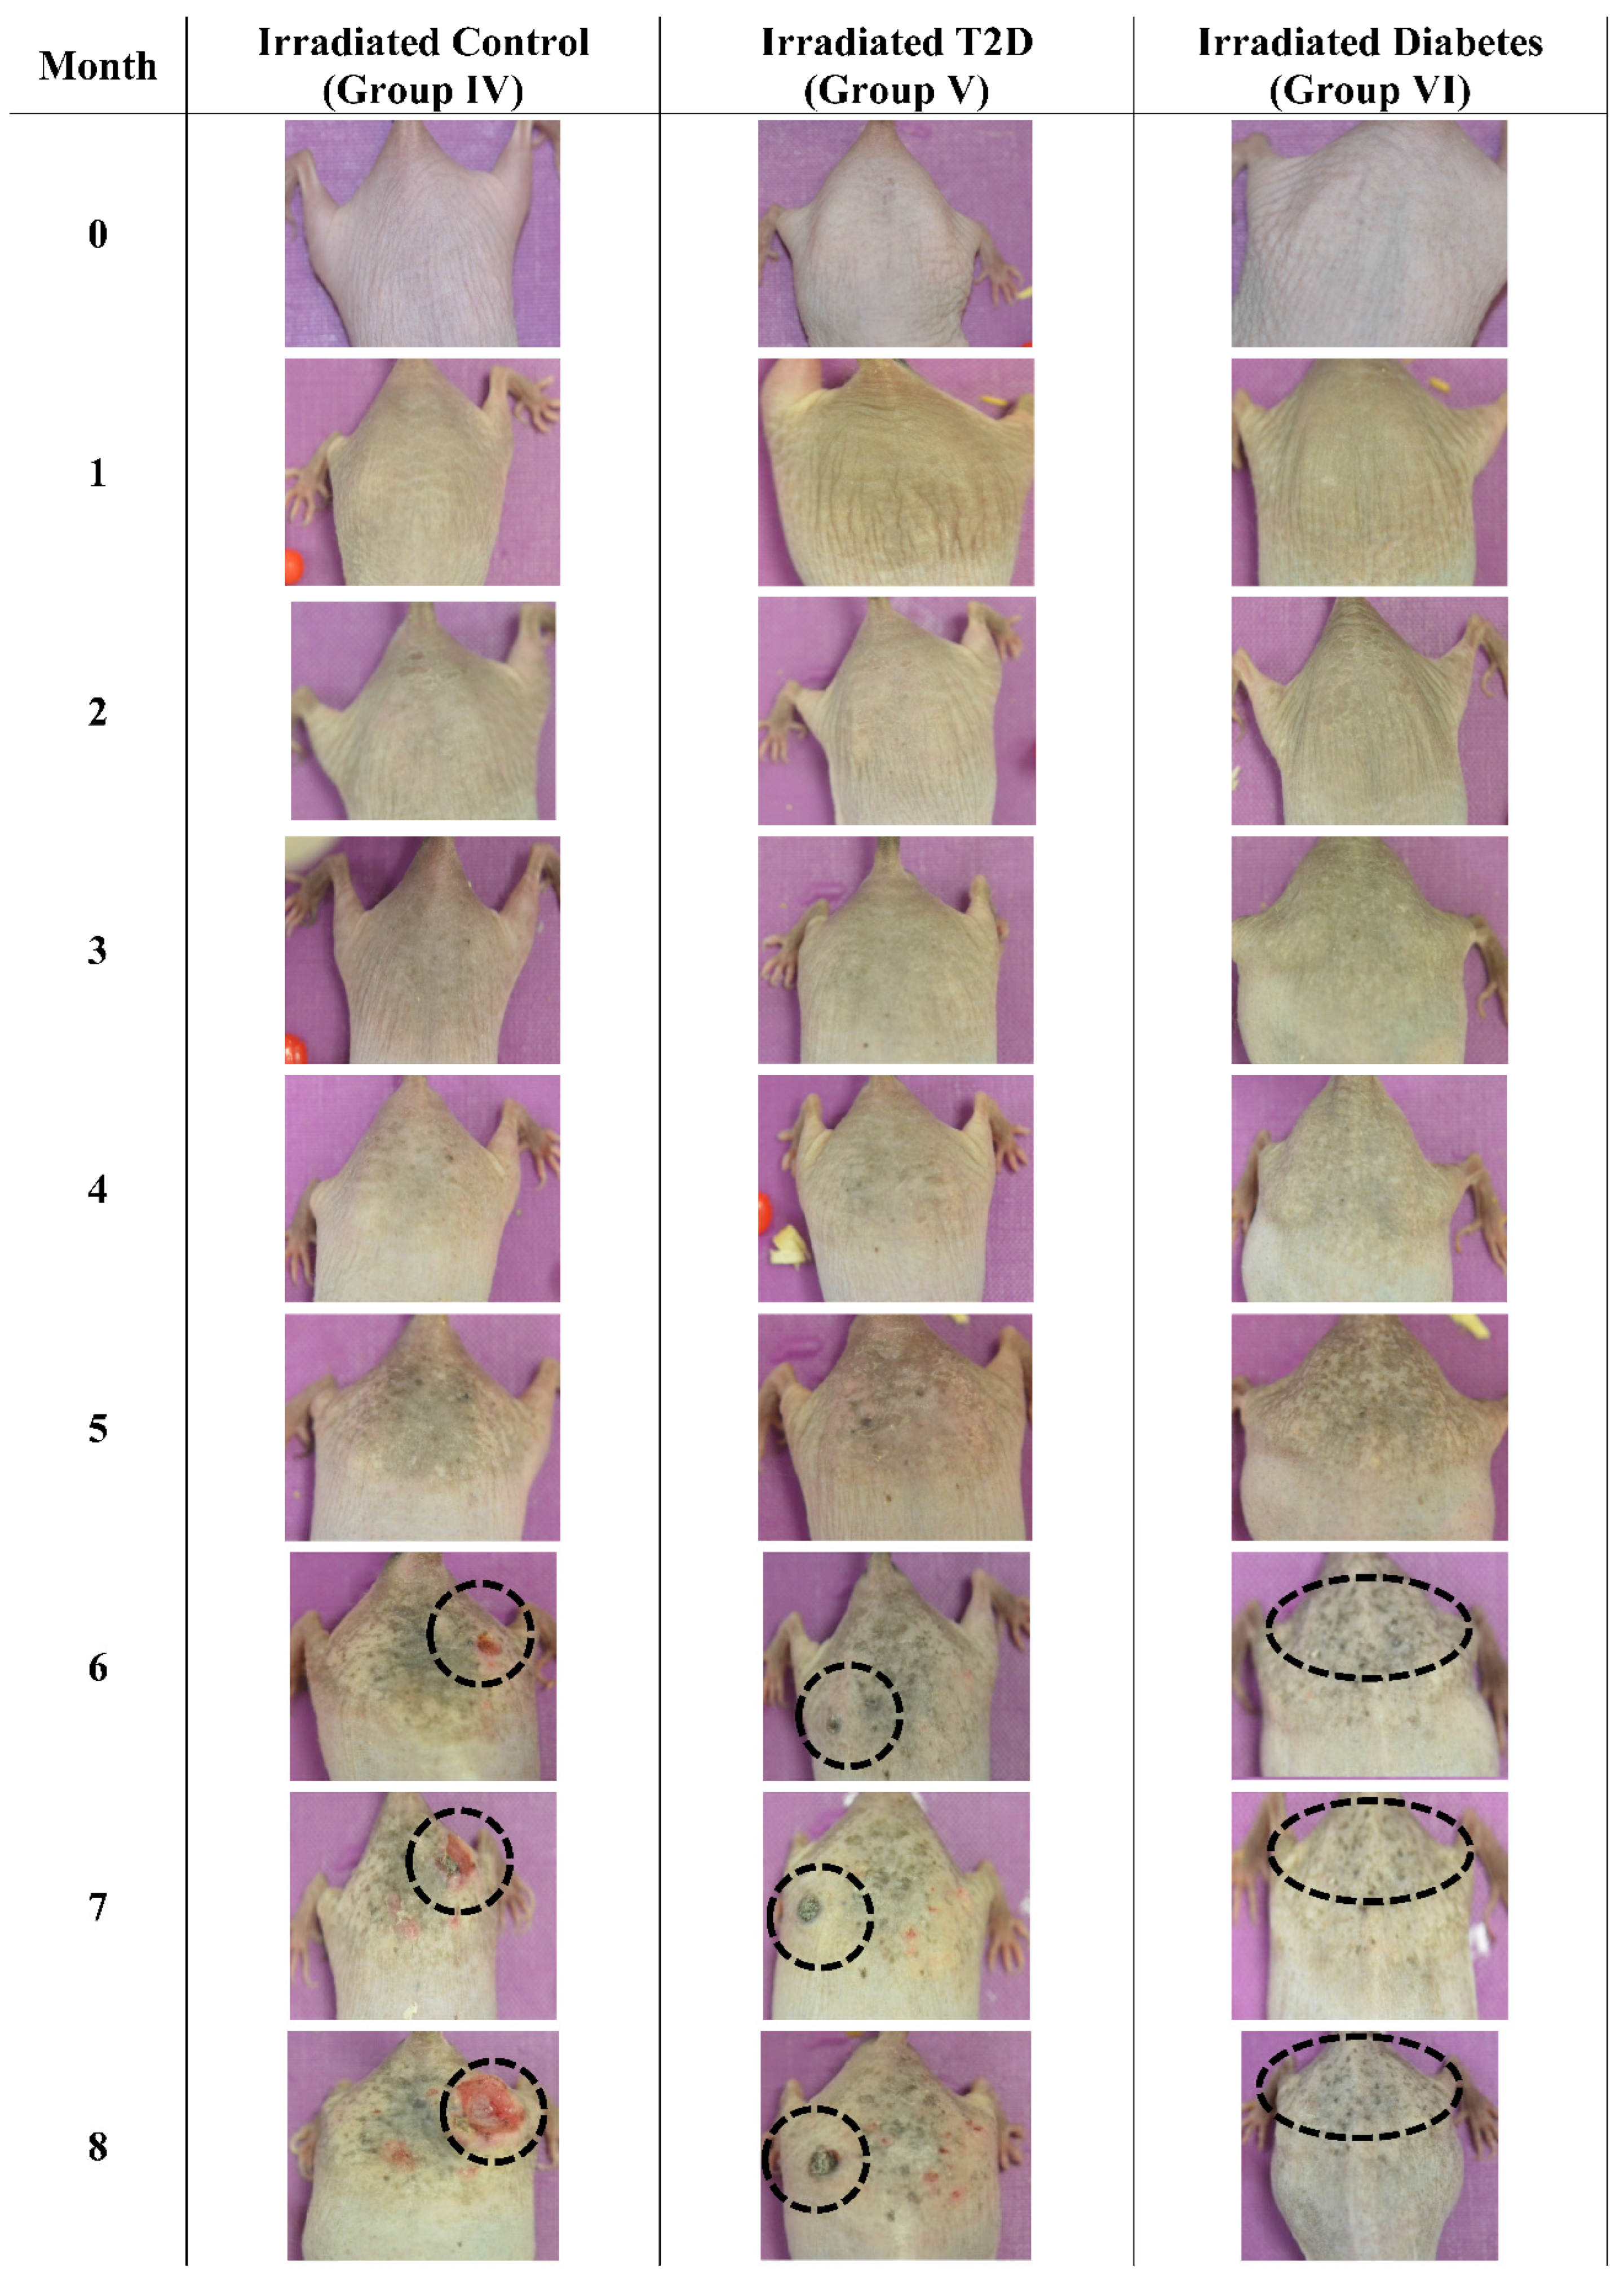
Figure 14.
Photographic evaluation of UV irradiation effects on the experimental model. Irradiated control mice (no induced diabetes) manifested squamous cell carcinoma (dashed line), while irradiated Type 2 diabetic mice manifested milder squamous cell carcinoma (dashed line). On the other hand, irradiated Type 1 diabetic mice did not manifest any serious skin aberrations (dashed line) (T2D: Type 2 Diabetes, Diabetes: Type 1 diabetes).
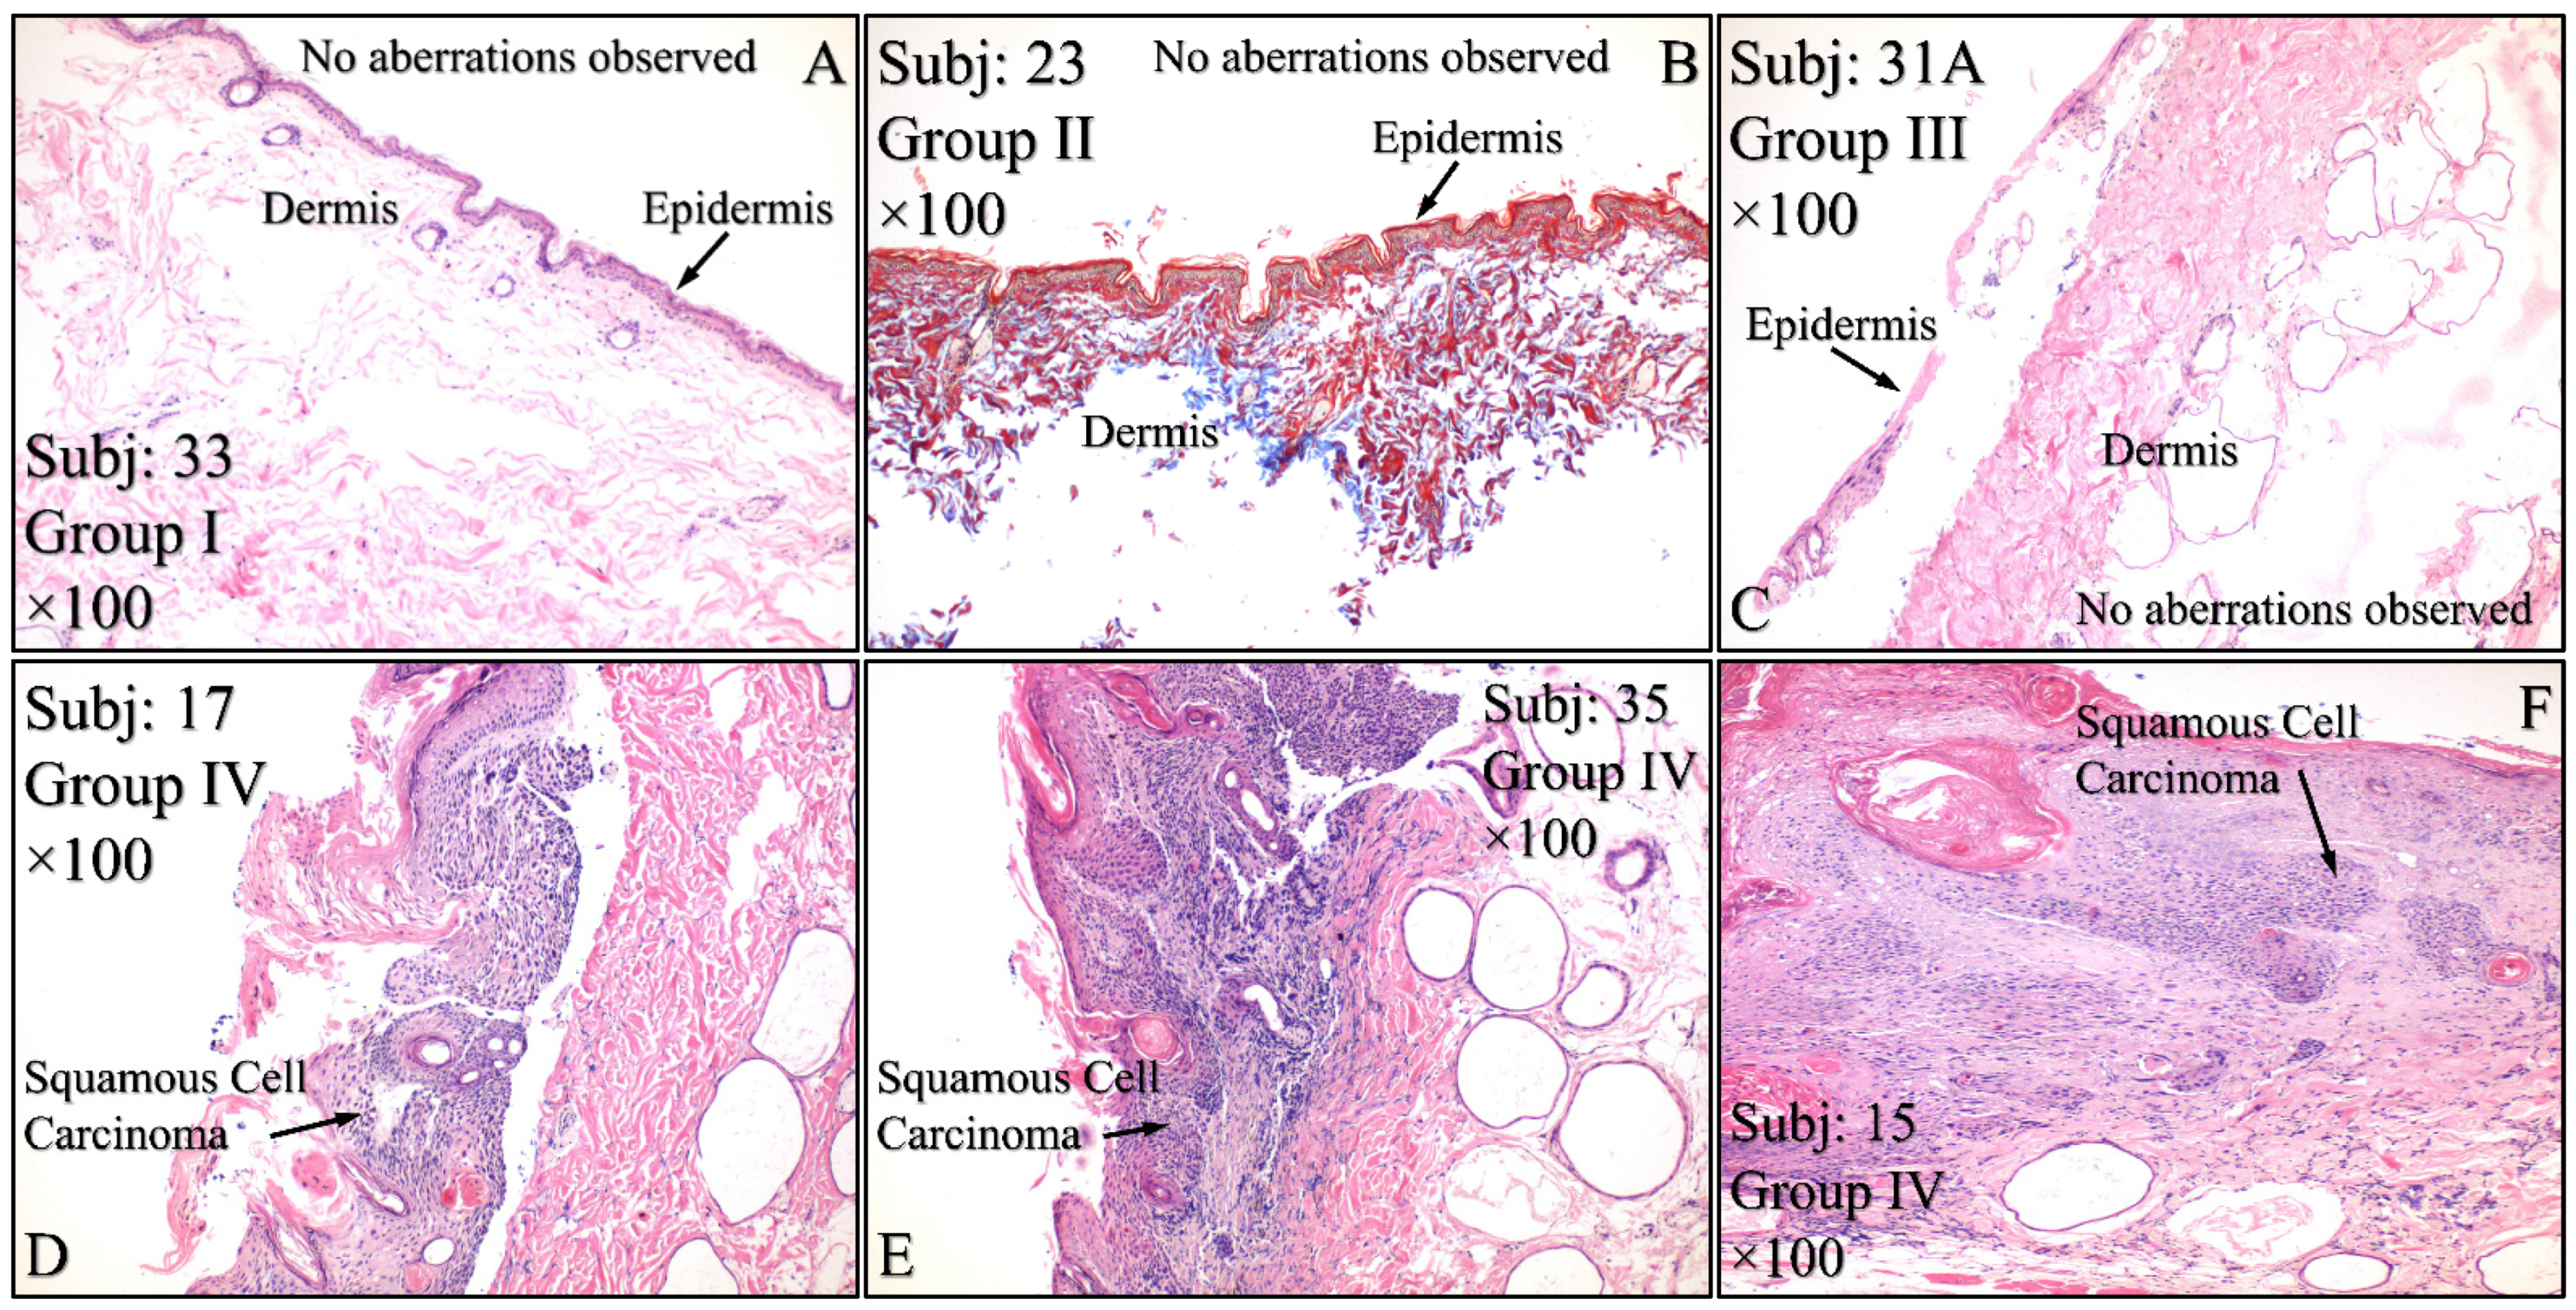
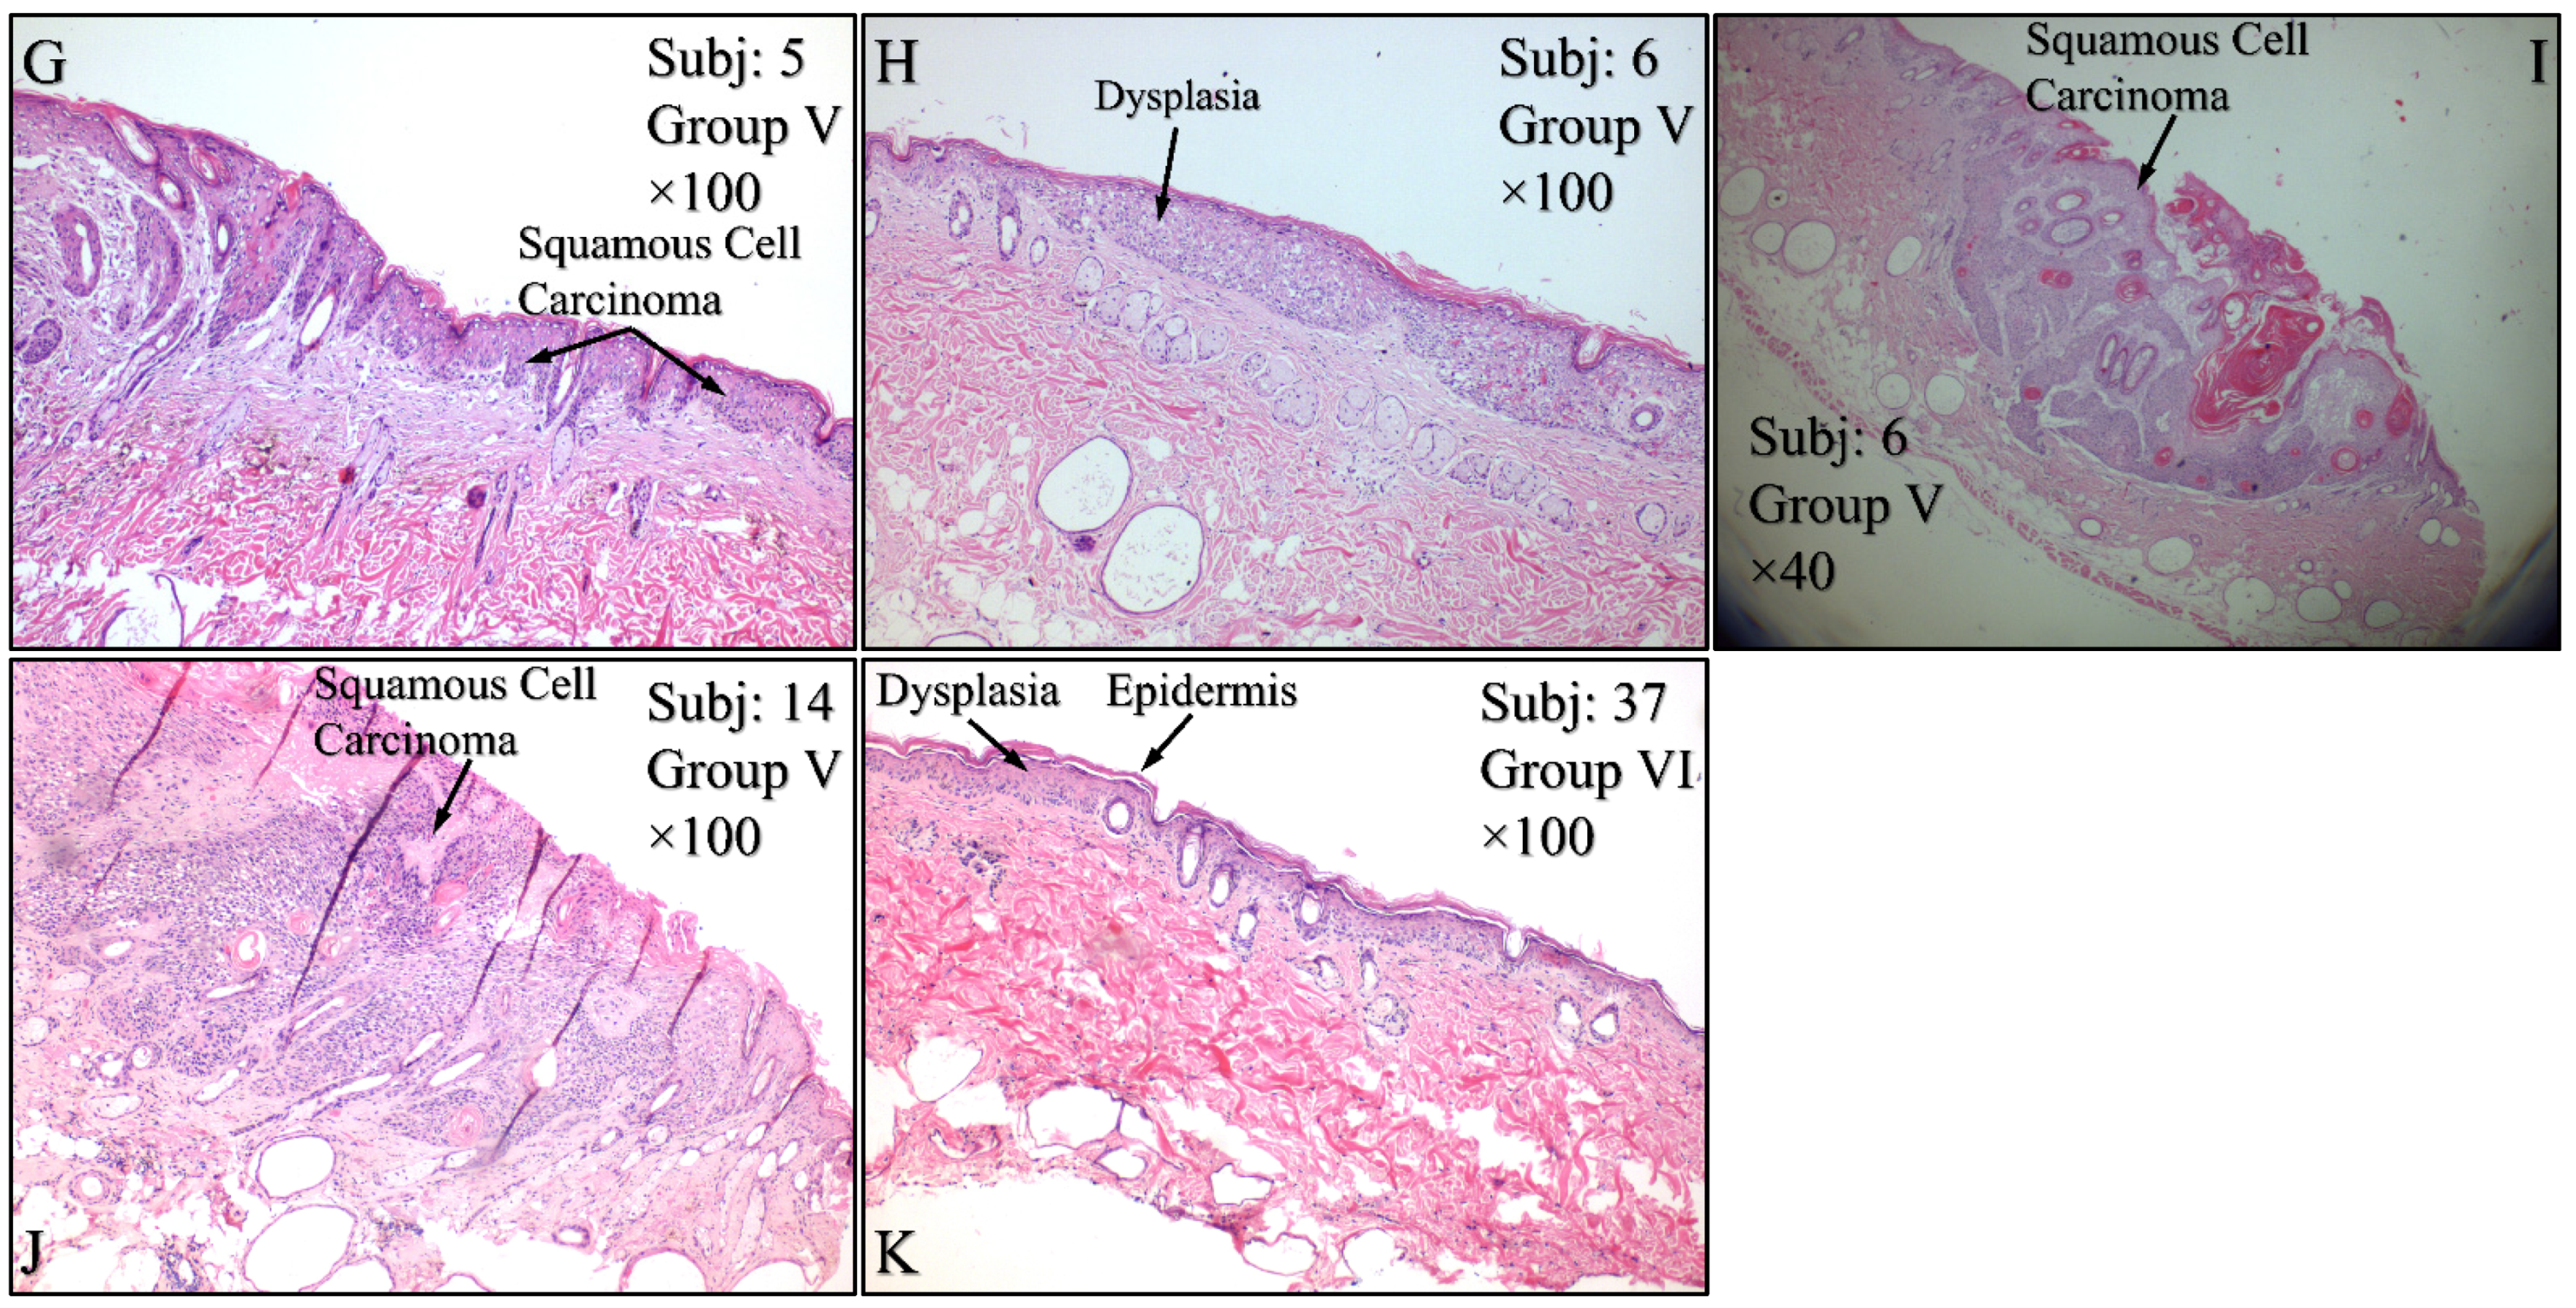
Figure 15.
Histological evaluations of the experimental groups. Control animals (Group I) manifested no cytological transformations (A), as well as those animals in Group II (B) and Group III (C). On the other hand, diabetes-free irradiated mice (Group IV) manifested squamous cell carcinoma (SCC), which was manifested as a high-grade, well-differentiated, non-invasive SCC (D), high-grade, well-differentiated, invasive SCC (E) and high-grade, moderately differentiated, invasive SCC (F). Similar results were manifested by animals in Group V (irradiated with Type 2 diabetes), where mice were presented with invasive high-grade, well-differentiated SCC (G), dysplastic (H) and high-grade, well-differentiated, non-invasive SCC (I) and high-grade, well differentiated, moderatelly invasive SCC (J). Interestingly, Group VI mice (irradiated with Type 1 diabetes) manifested acanthosis and dysplasia but no neoplastic transformation (K) (Legend: I: No treatment, no diabetes induction, no irradiation, II: Type 2 diabetes induction, no irradiation, III: Type 1 diabetes induction, no irradiation, IV: No diabetes induction, irradiation, V: Type 2 diabetes induction, irradiation, VI: Type 1diabetes induction, irradiation, Subj: Subject).
![Cancers 16 01507 g015a]()
![Cancers 16 01507 g015b]()
Figure 16.
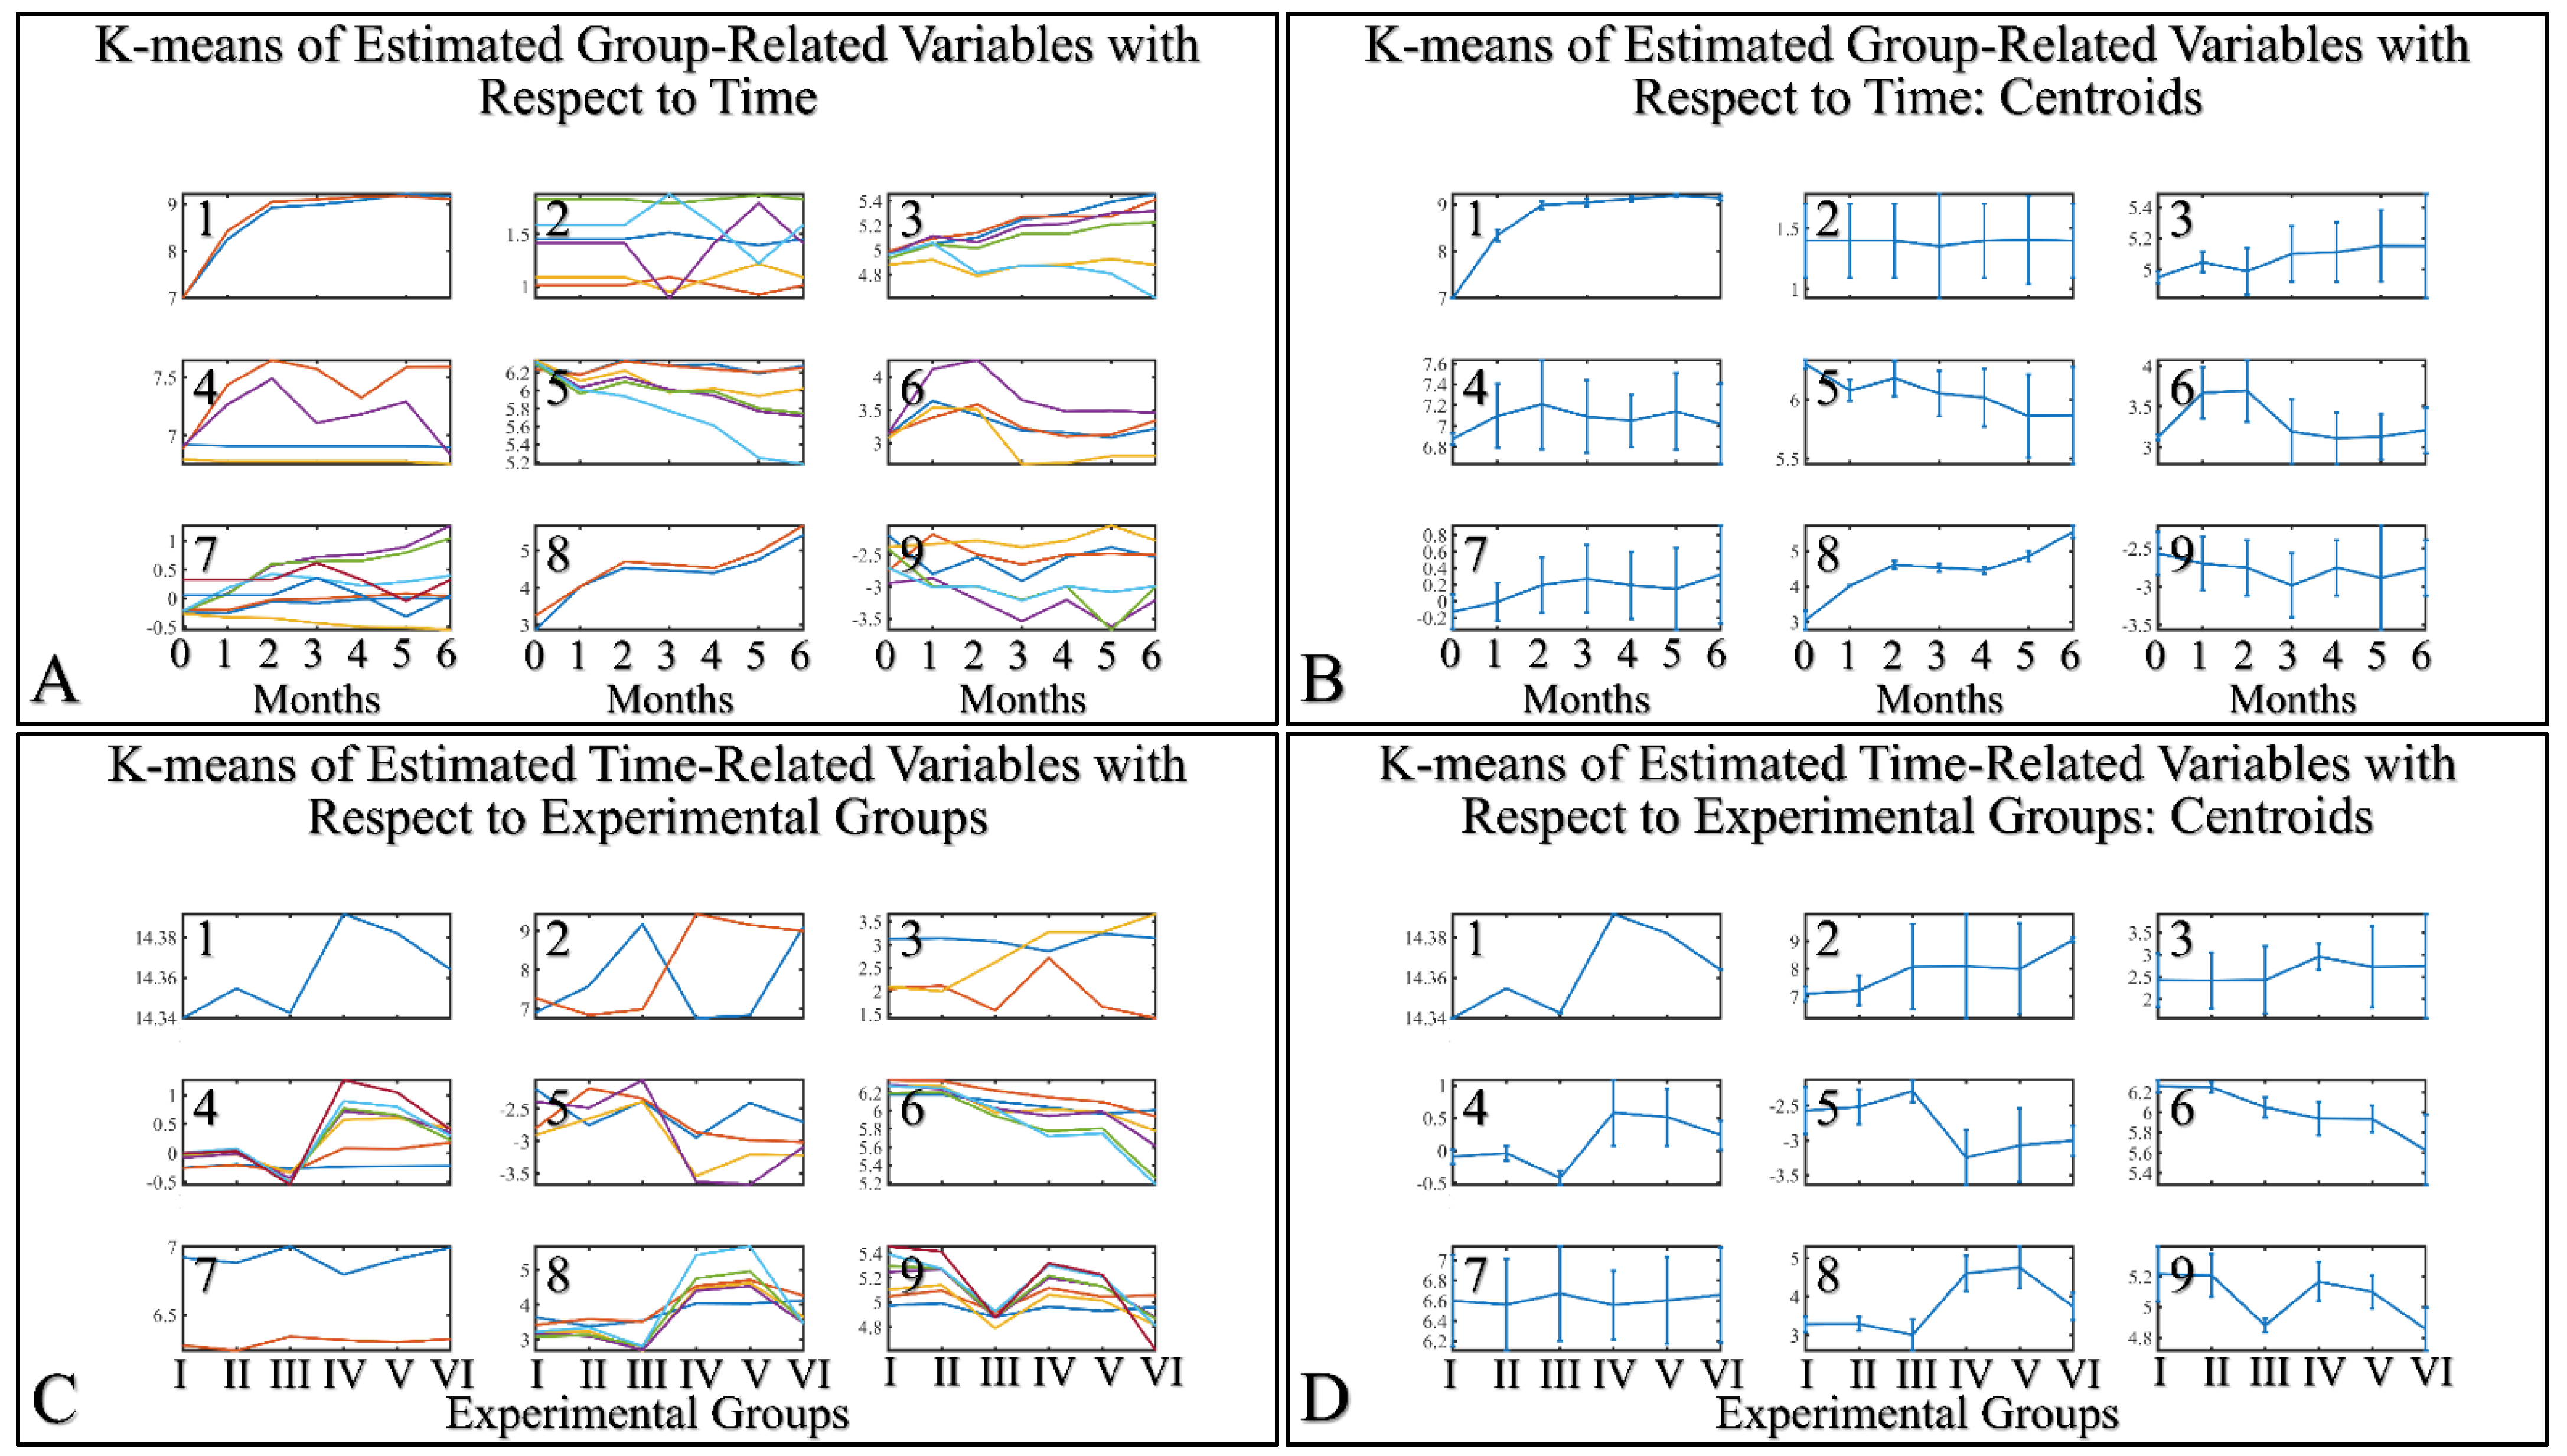
K–means clustering. Two separate analyses were performed. The first included the k-means of the estimated experimental group–related variables with respect to time (A,B). The second included the k–means of the estimated time related variable with respect to the experimental groups (C,D). Each analysis included the complete datasets, which is the actual presentation of all data and their respective clusters (A,C) and the centroids (B,D).
Figure 16.
K–means clustering. Two separate analyses were performed. The first included the k-means of the estimated experimental group–related variables with respect to time (A,B). The second included the k–means of the estimated time related variable with respect to the experimental groups (C,D). Each analysis included the complete datasets, which is the actual presentation of all data and their respective clusters (A,C) and the centroids (B,D).
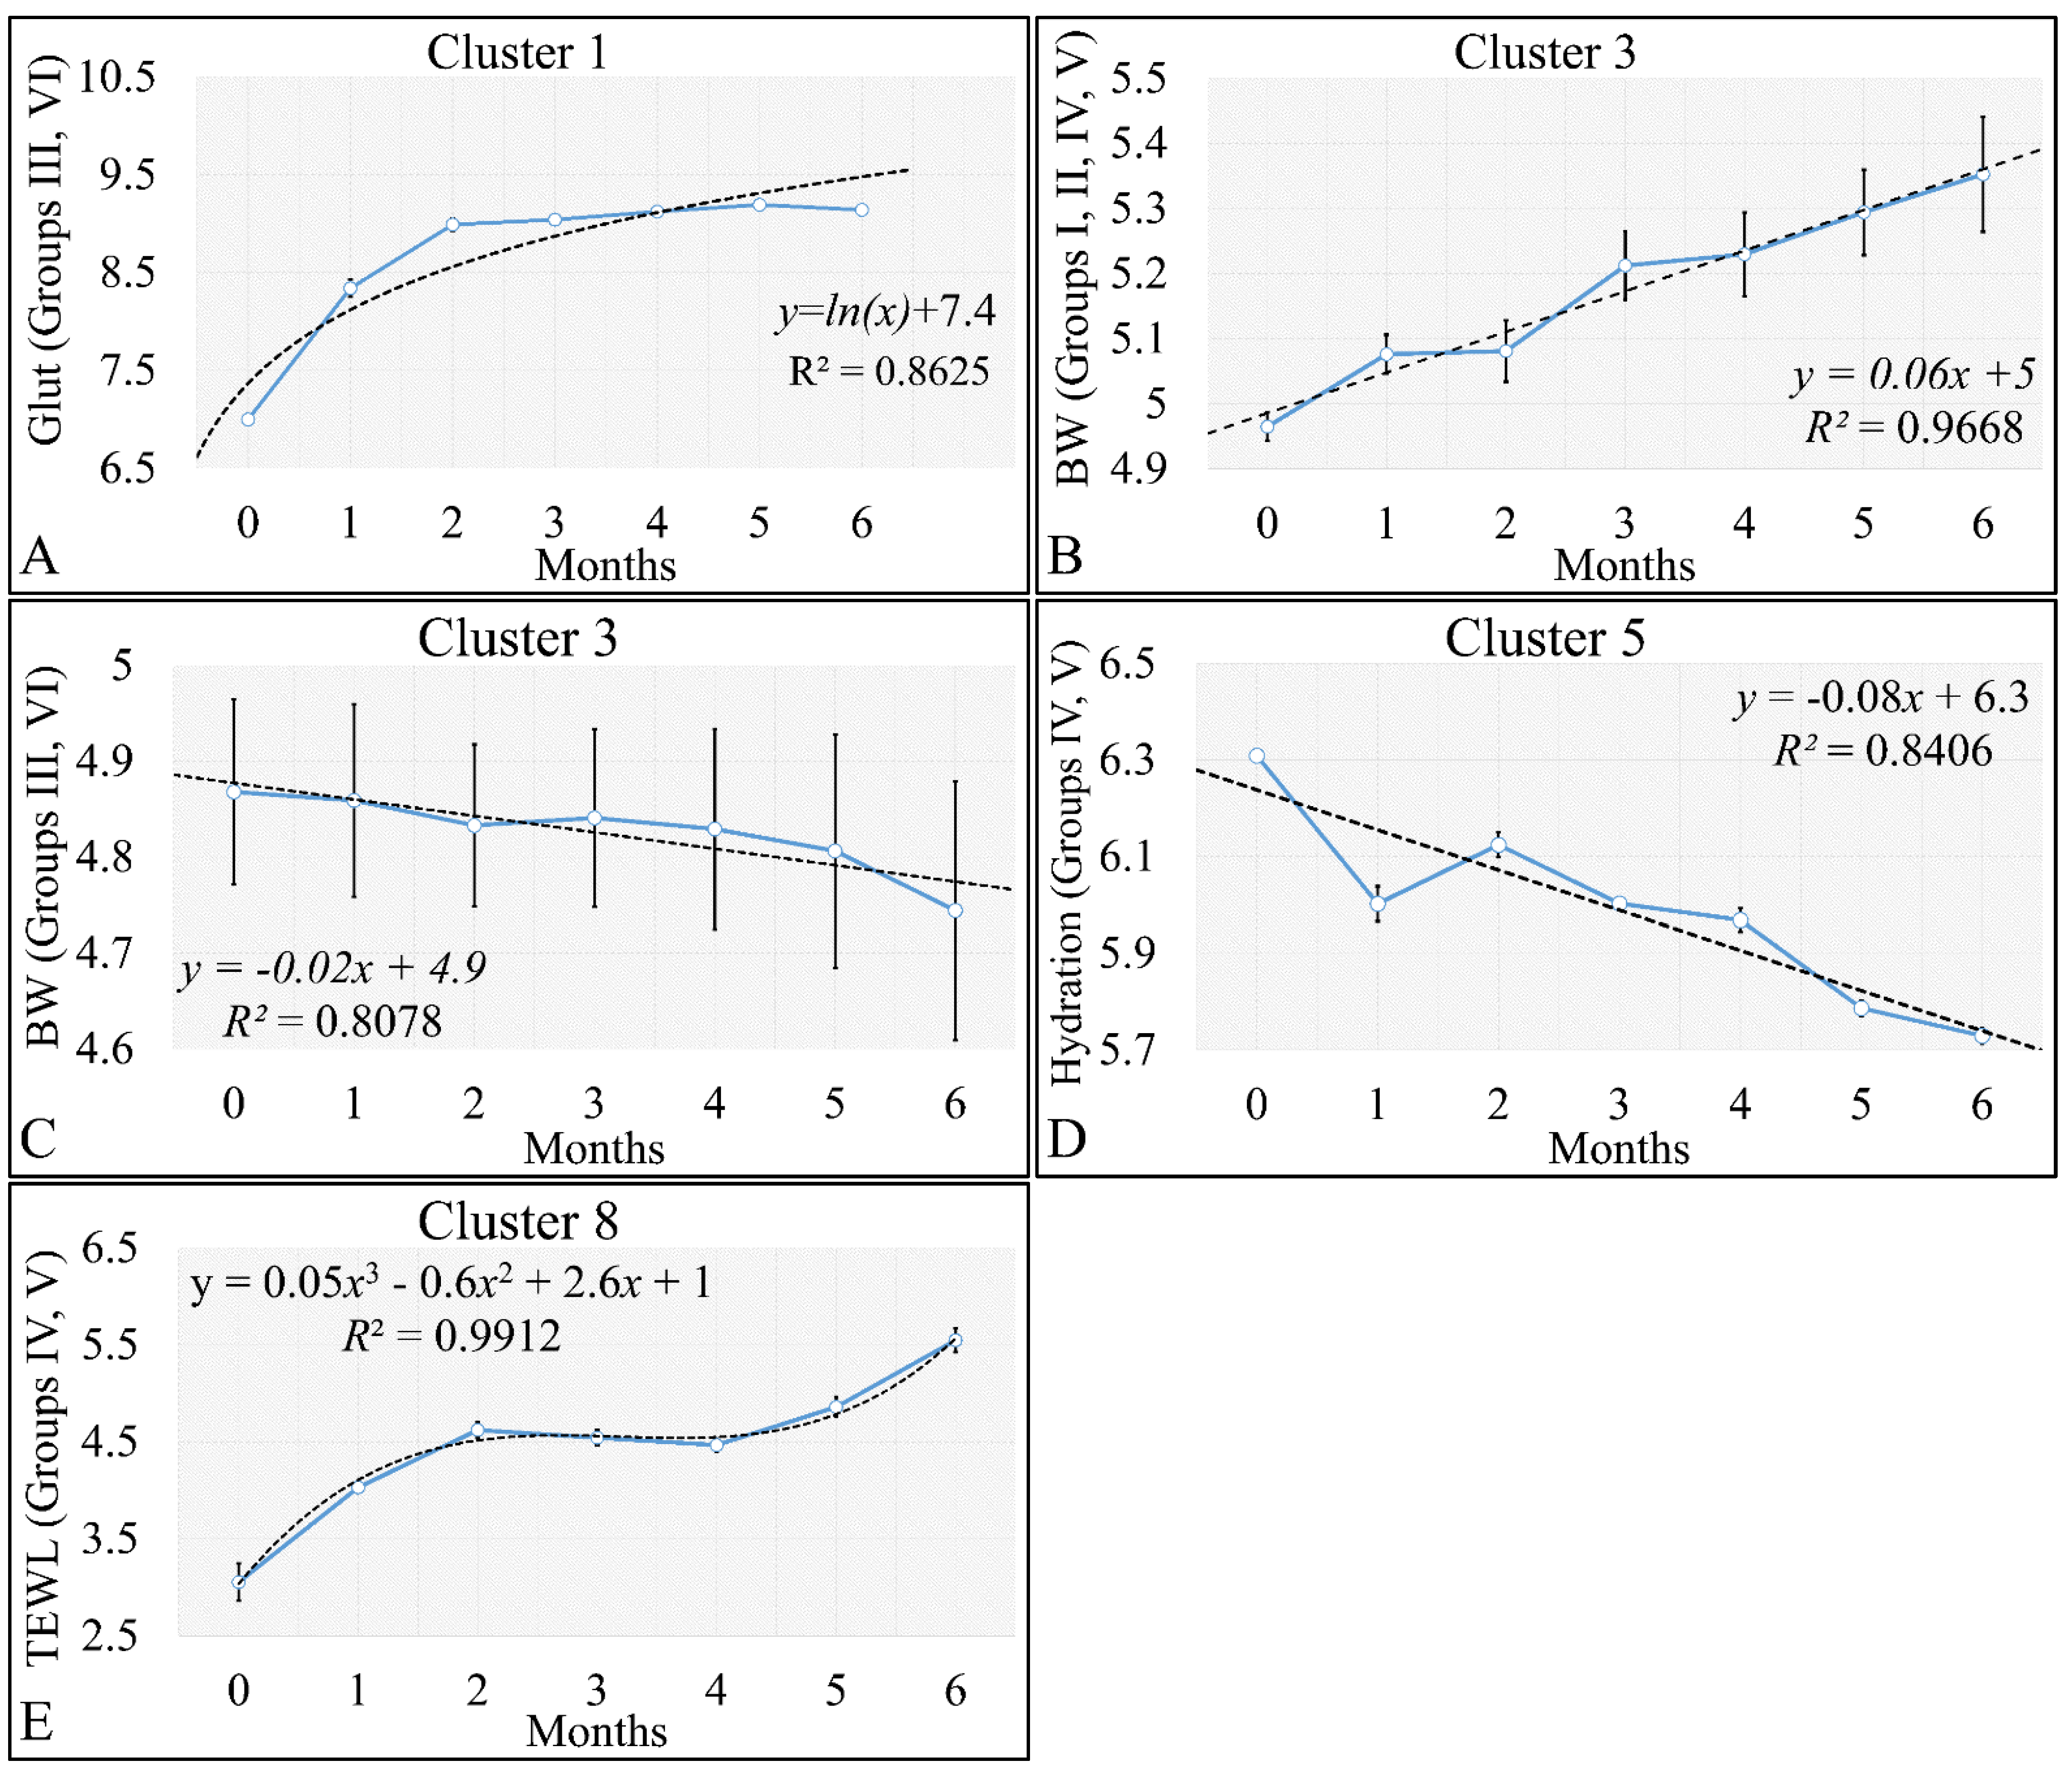
Figure 17.
Analysis of the k–means clustering presented in
Figure 16A–C. Certain patterns arose from the analysis of k–means clusters. Linear behavior was searched for all groups with respect to time. Cluster 1 showed that glutathione in groups III and IV (non–irradiated diabetic and irradiated non–diabetic mice) could be described by a logarithmic function (
A). Yet, body weight (BW) for groups I, II, IV, V manifested a linear increase, which confirmed that the diabetic mice (groups III and VI) were not gaining weight (
B). This was confirmed by cluster 3, where the algorithm successfully classified groups III and VI together (
C). Interestingly, the k–means algorithm classified together groups IV and V with respect to their hydration levels (
D). Finally, another interesting result came from the classification of TEWL measurements, where it appeared that month 3 was a critical point of turn for groups IV and V (
E) (Legend: I: No treatment, no diabetes induction, no irradiation, II: Type 2 diabetes induction, no irradiation, III: Type 1 diabetes induction, no irradiation, IV: No diabetes induction, irradiation, V: Type 2 diabetes induction, irradiation, VI: Type 1 diabetes induction, irradiation).
![Cancers 16 01507 g017]()
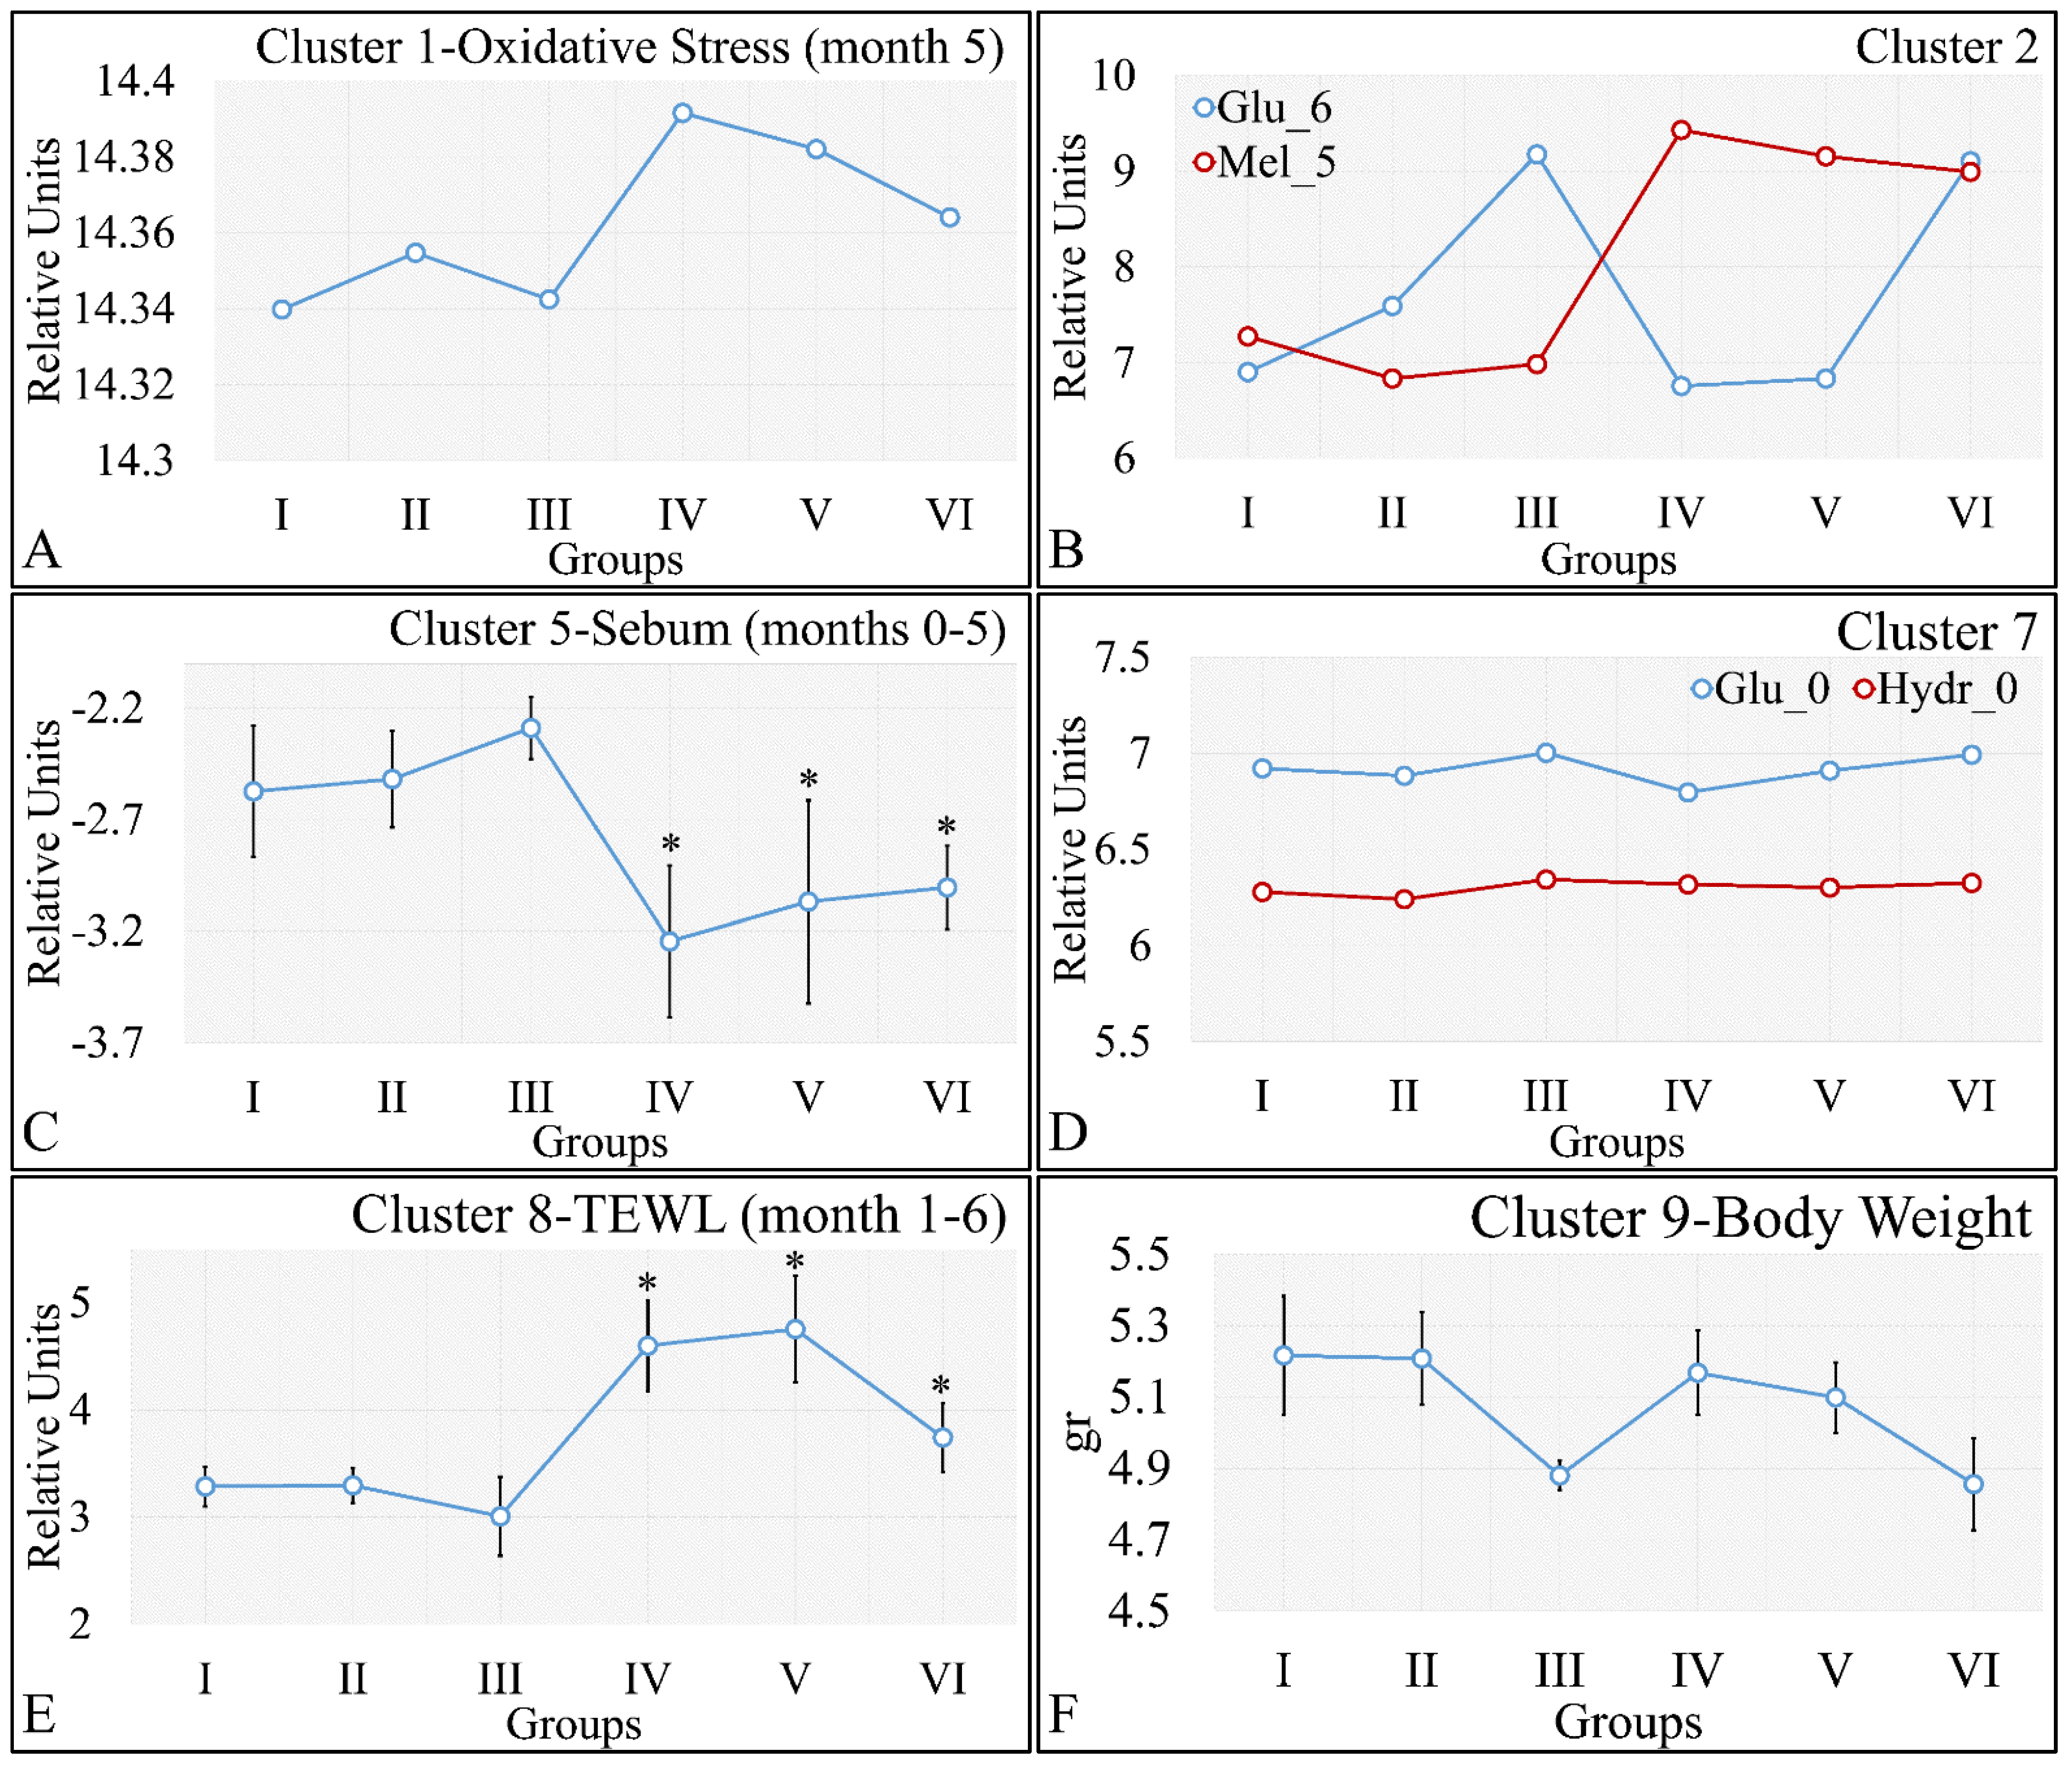
Figure 18.
Analysis of the k-means clustering presented in
Figure 18A–F. Certain patterns arose from the analysis of k-means clusters. Cluster 1 showed that oxidative stress manifested a descending pattern of groups IV–VI (
A). Cluster 2 showed that glucose and melanin manifested symmetrical behavior for the experimental groups (
B). At the same time, sebum in groups IV–VI manifested significantly higher levels, as compared to sebum in groups I–III (
C). Hydration manifested similar levels for all groups, indicating that the experimental model started from the same reference level (
D). Similarly, as in the case of sebum, groups IV–VI manifested significantly higher levels, as compared to groups I–III (
E). Weight loss was affected by diabetes and not by irradiation, since groups I, IV, and II, V, as well as III and VI, manifested comparable levels (
F) (Legend: I: No treatment, no diabetes induction, no irradiation, II: Type 2 diabetes induction, no irradiation, III: Type 1 diabetes induction, no irradiation, IV: No diabetes induction, irradiation, V: Type 2 diabetes induction, irradiation, VI: Type 1 diabetes induction, irradiation, TEWL: Trans-Epidermal Water Loss). * Depicts the significance of
p < 0.05.
![Cancers 16 01507 g018]()
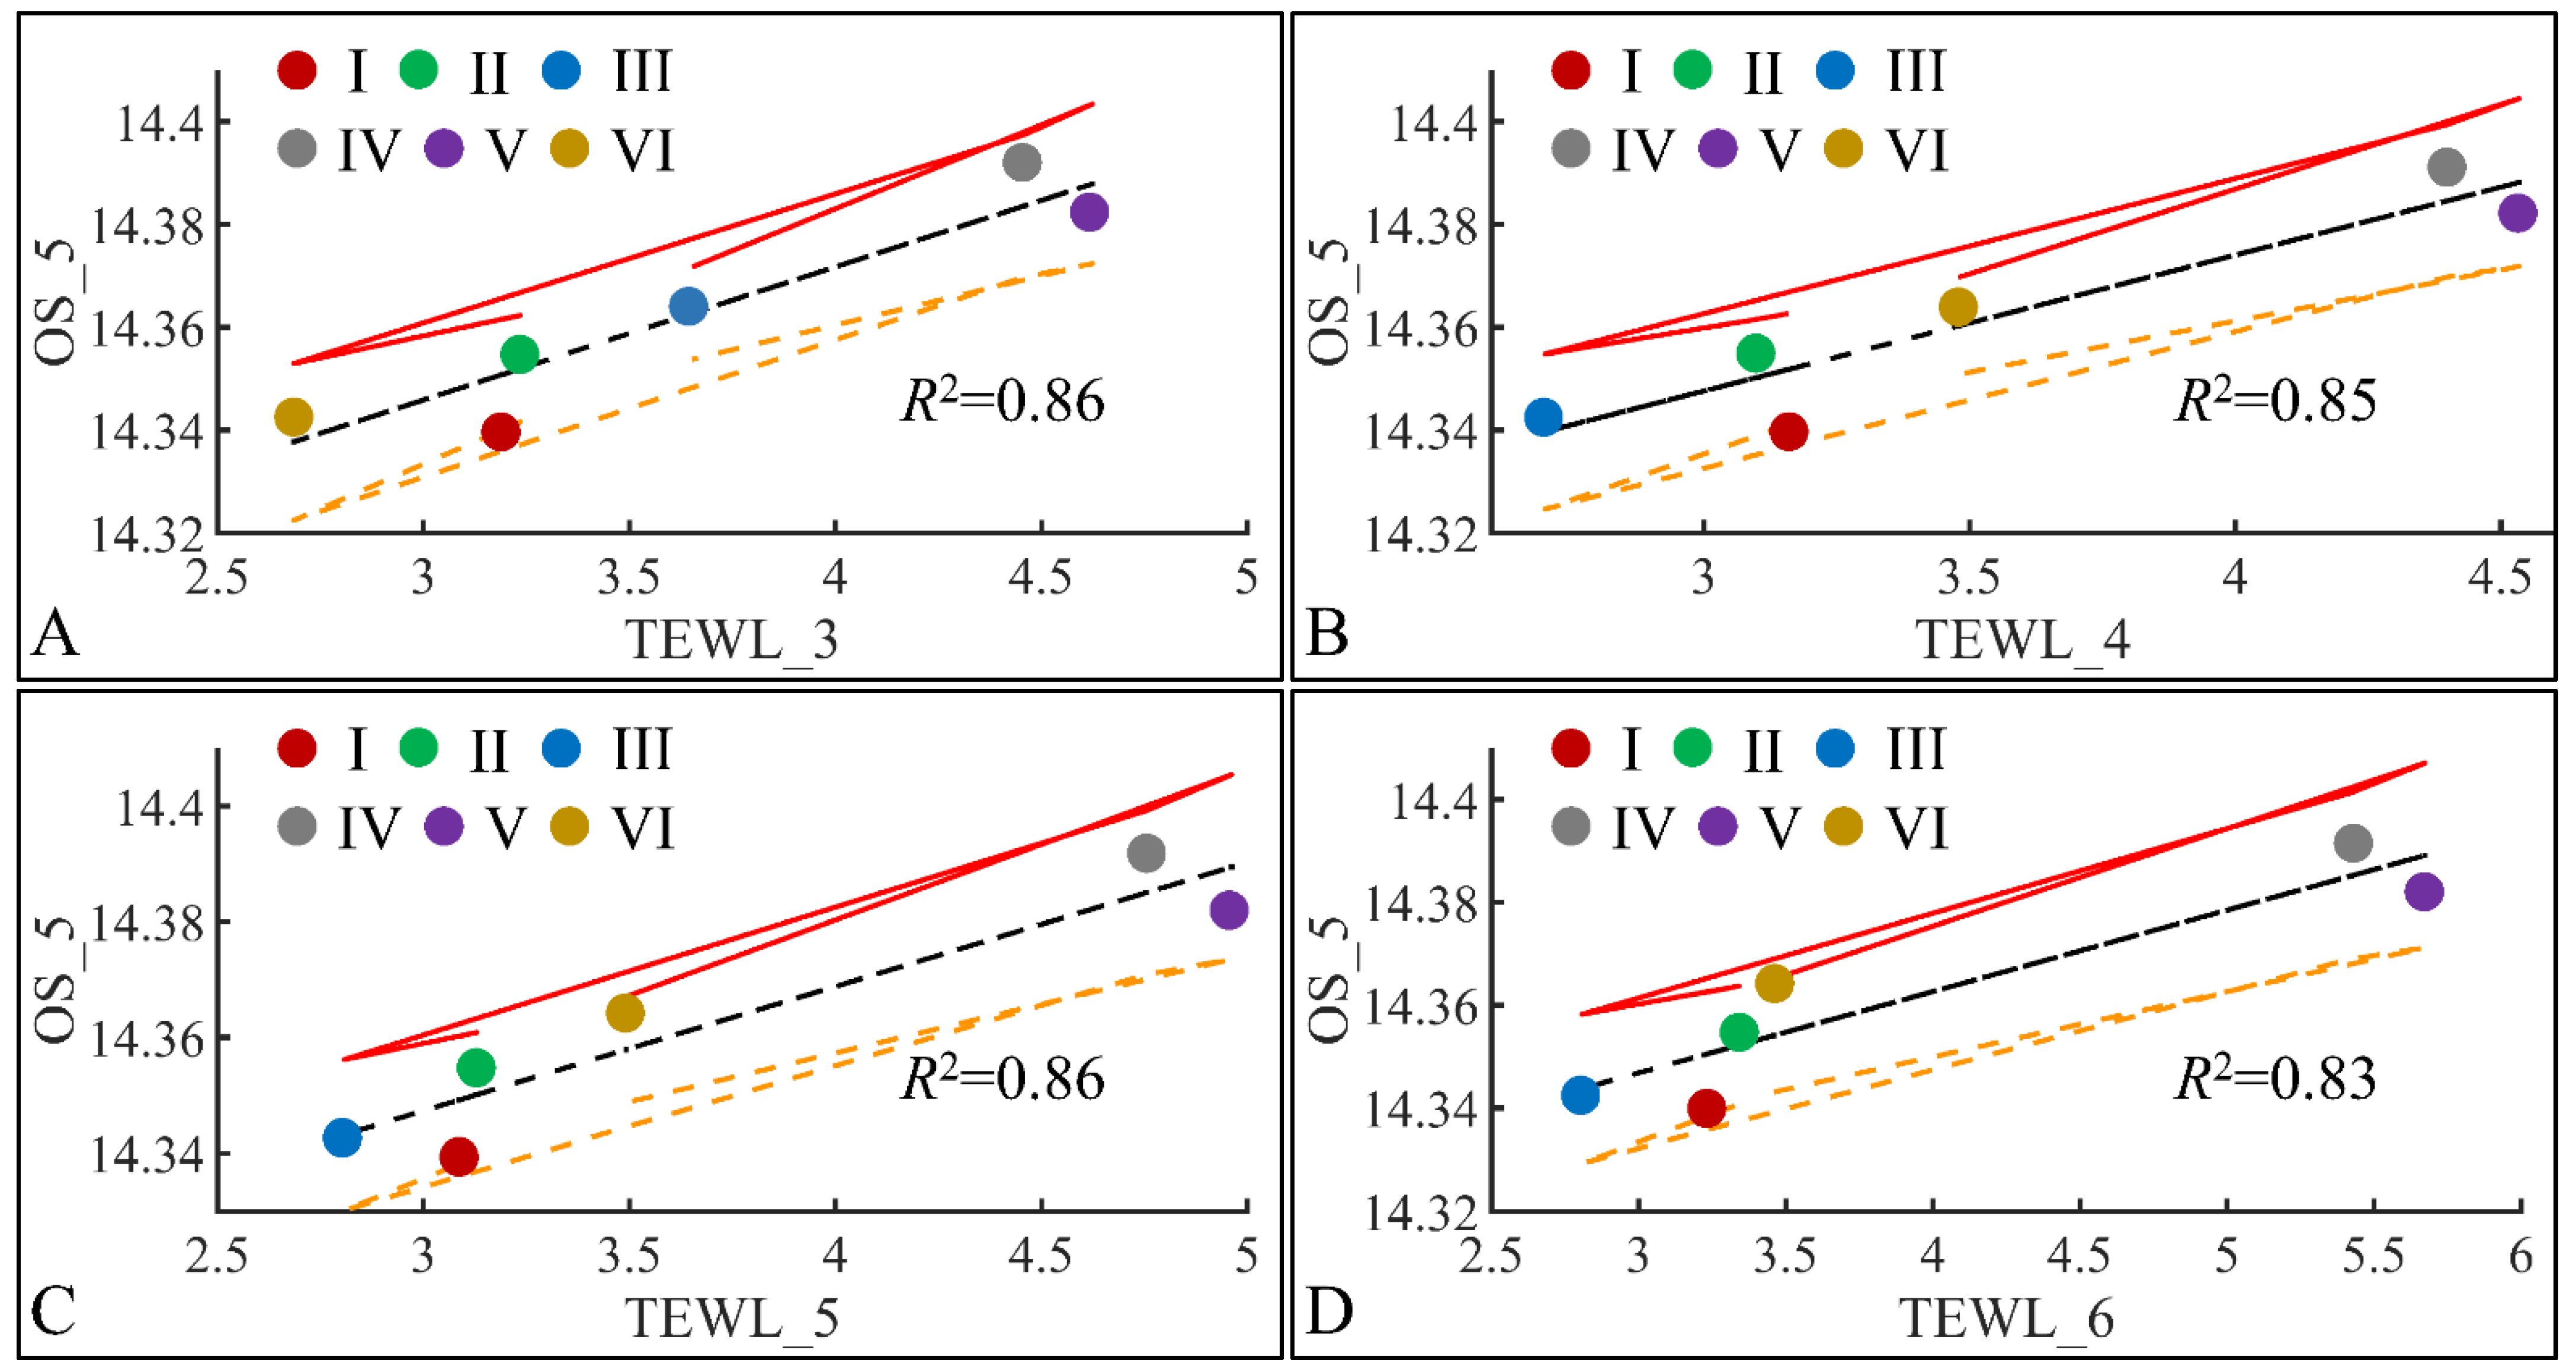
Figure 19.
Regression analysis of evaluated variables, with respect to groups. The values of each variable, with respect to time, were regressed within experimental groups. Overall, oxidative stress (OS) on the fifth month (OS_5) was found to have significant correlations to TEWL for months 3 (TEWL_3) (A), 4 (TEWL_4) (B), 5 (TEWL_5) (C) and 6 (TEWL_6) (D) (Legend: I: No treatment, no diabetes induction, no irradiation, II: Type 2 diabetes induction, no irradiation, III: Type 1 diabetes induction, no irradiation, IV: No diabetes induction, irradiation, V: Type 2 diabetes induction, irradiation, VI: Type 1 diabetes induction, irradiation, TEWL: Trans-Epidermal Water Loss).
Figure 20.
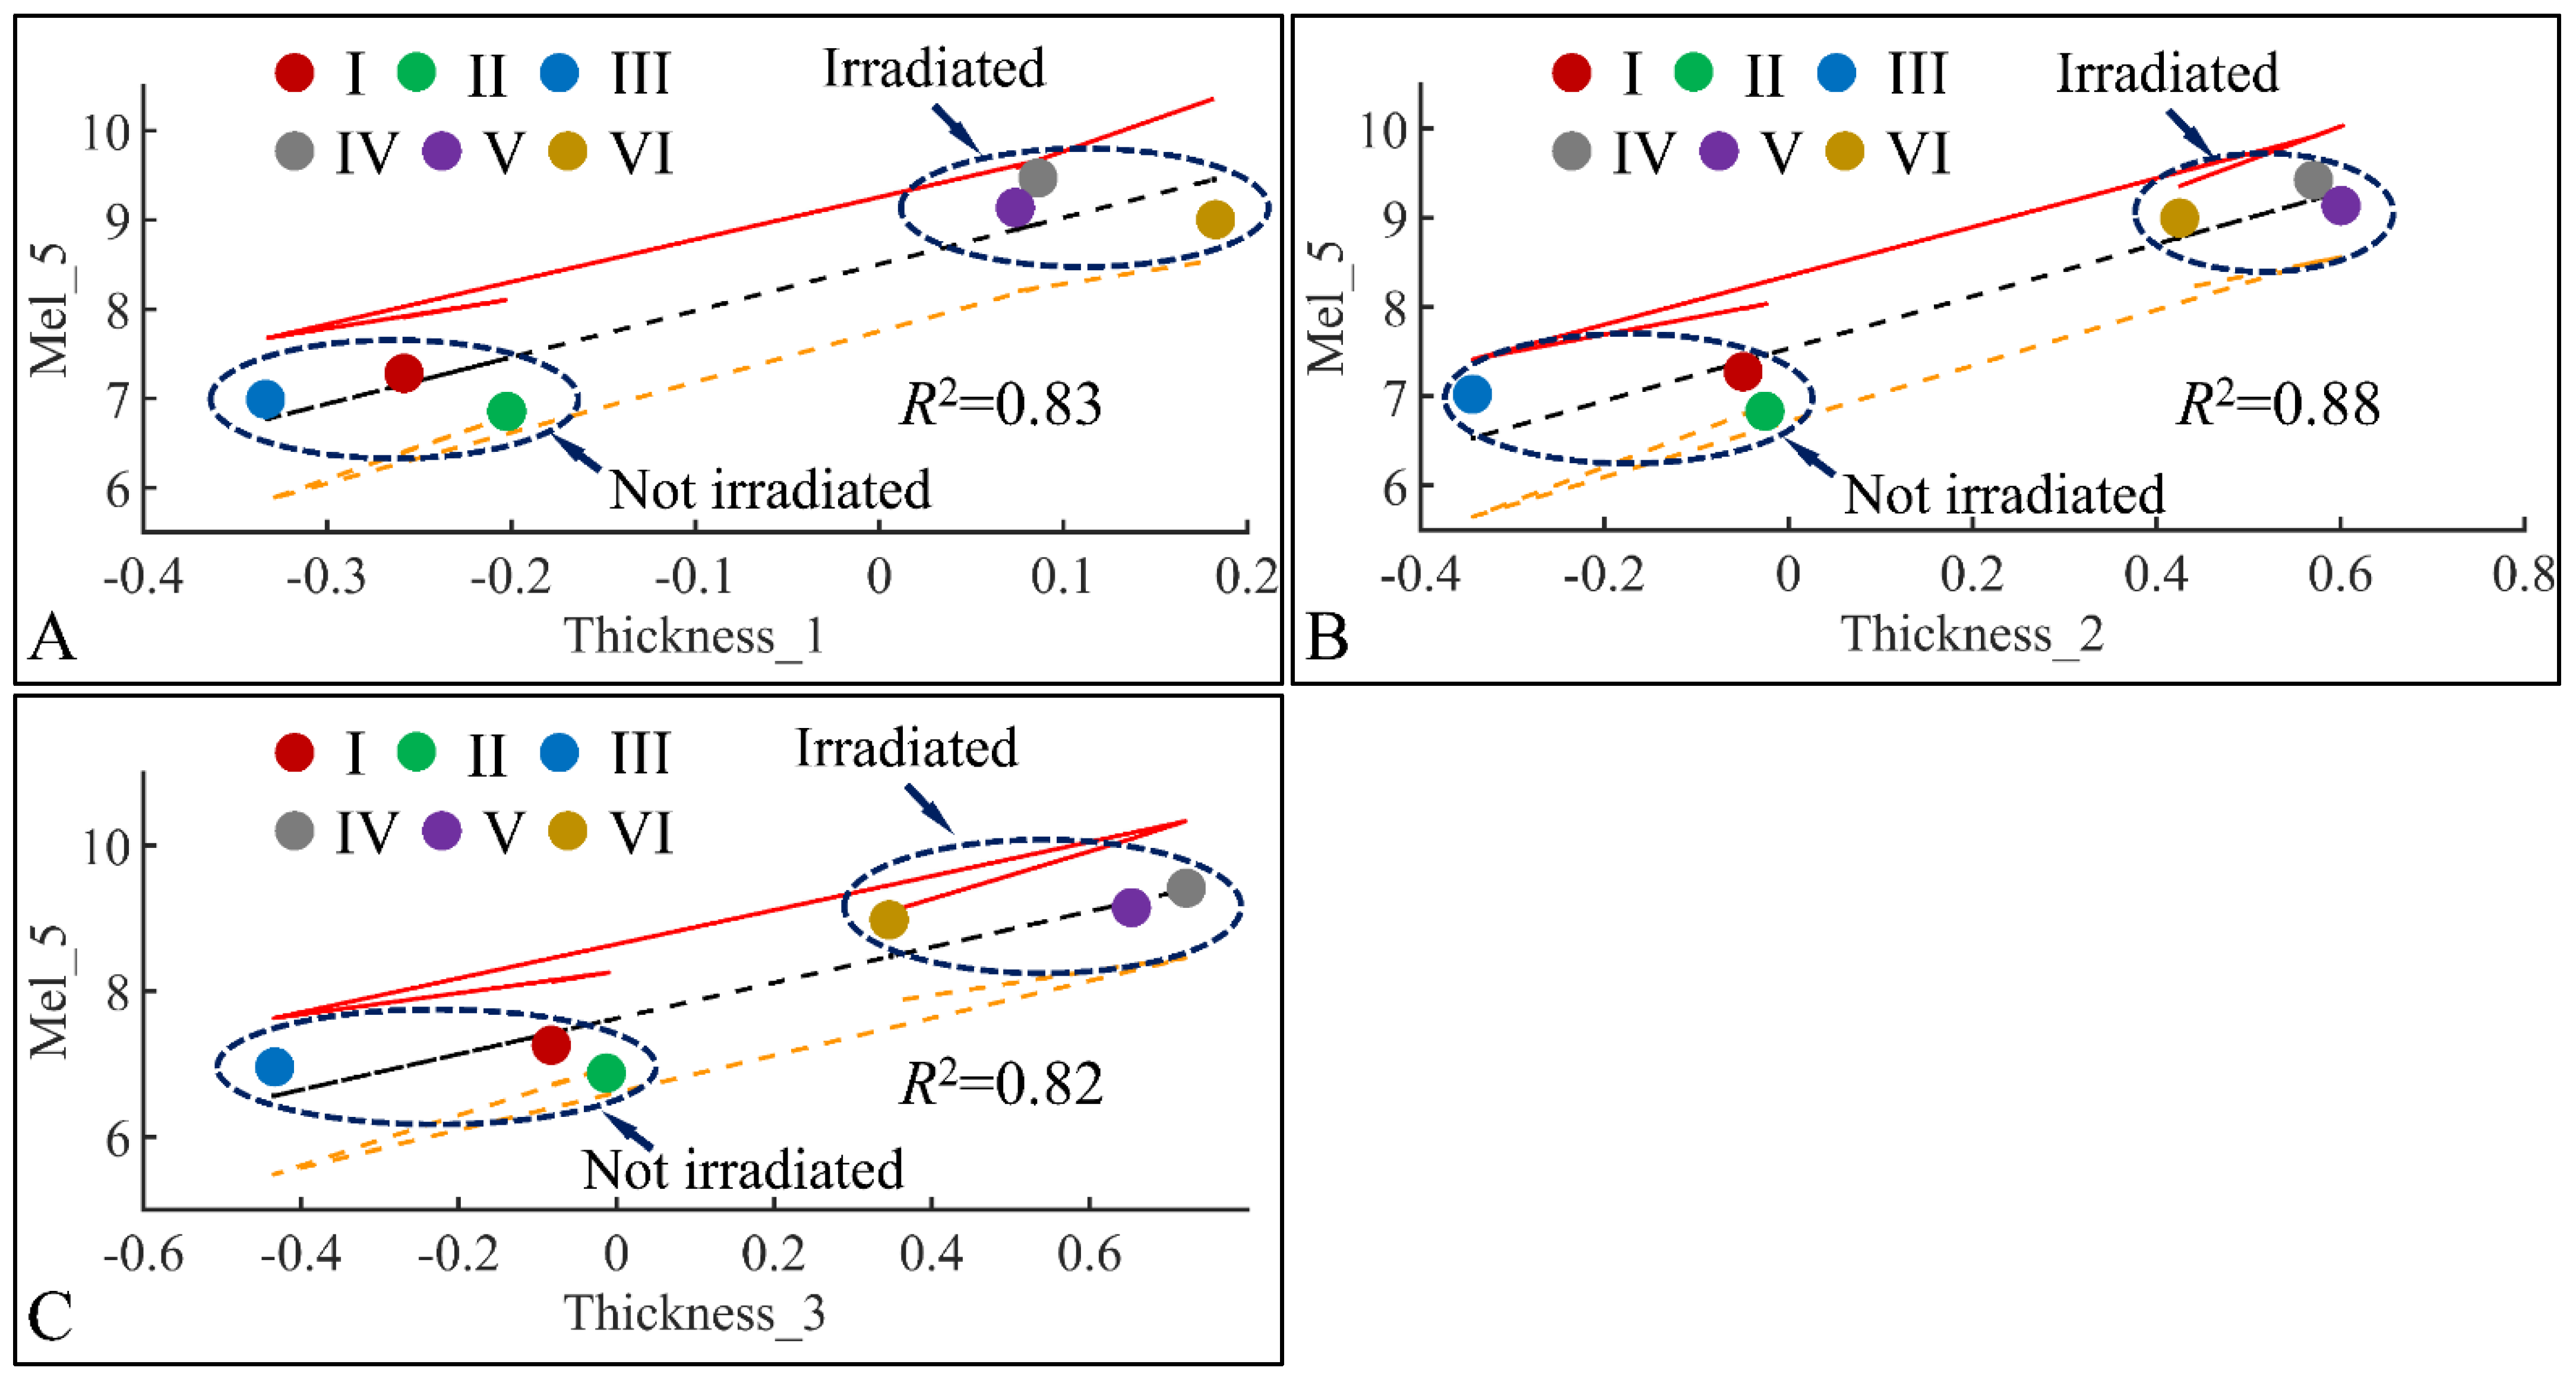
Regression analysis of evaluated variables with respect to groups. The values of each variable with respect to time was regressed within experimental groups. Overall, melanin (Mel) on the fifth month (Mel_5) was found to have significant correlations to skin thickness (Thickness) for months 1 (Thickness_1) (A), 2 (Thickness_2) (B) and 3 (Thickness_3) (C) (Legend: I: No treatment, no diabetes induction, no irradiation, II: Type 2 diabetes induction, no irradiation, III: Type 1 diabetes induction, no irradiation, IV: No diabetes induction, irradiation, V: Type 2 diabetes induction, irradiation, VI: Type 1 diabetes induction, irradiation).
Figure 20.
Regression analysis of evaluated variables with respect to groups. The values of each variable with respect to time was regressed within experimental groups. Overall, melanin (Mel) on the fifth month (Mel_5) was found to have significant correlations to skin thickness (Thickness) for months 1 (Thickness_1) (A), 2 (Thickness_2) (B) and 3 (Thickness_3) (C) (Legend: I: No treatment, no diabetes induction, no irradiation, II: Type 2 diabetes induction, no irradiation, III: Type 1 diabetes induction, no irradiation, IV: No diabetes induction, irradiation, V: Type 2 diabetes induction, irradiation, VI: Type 1 diabetes induction, irradiation).
Figure 21.
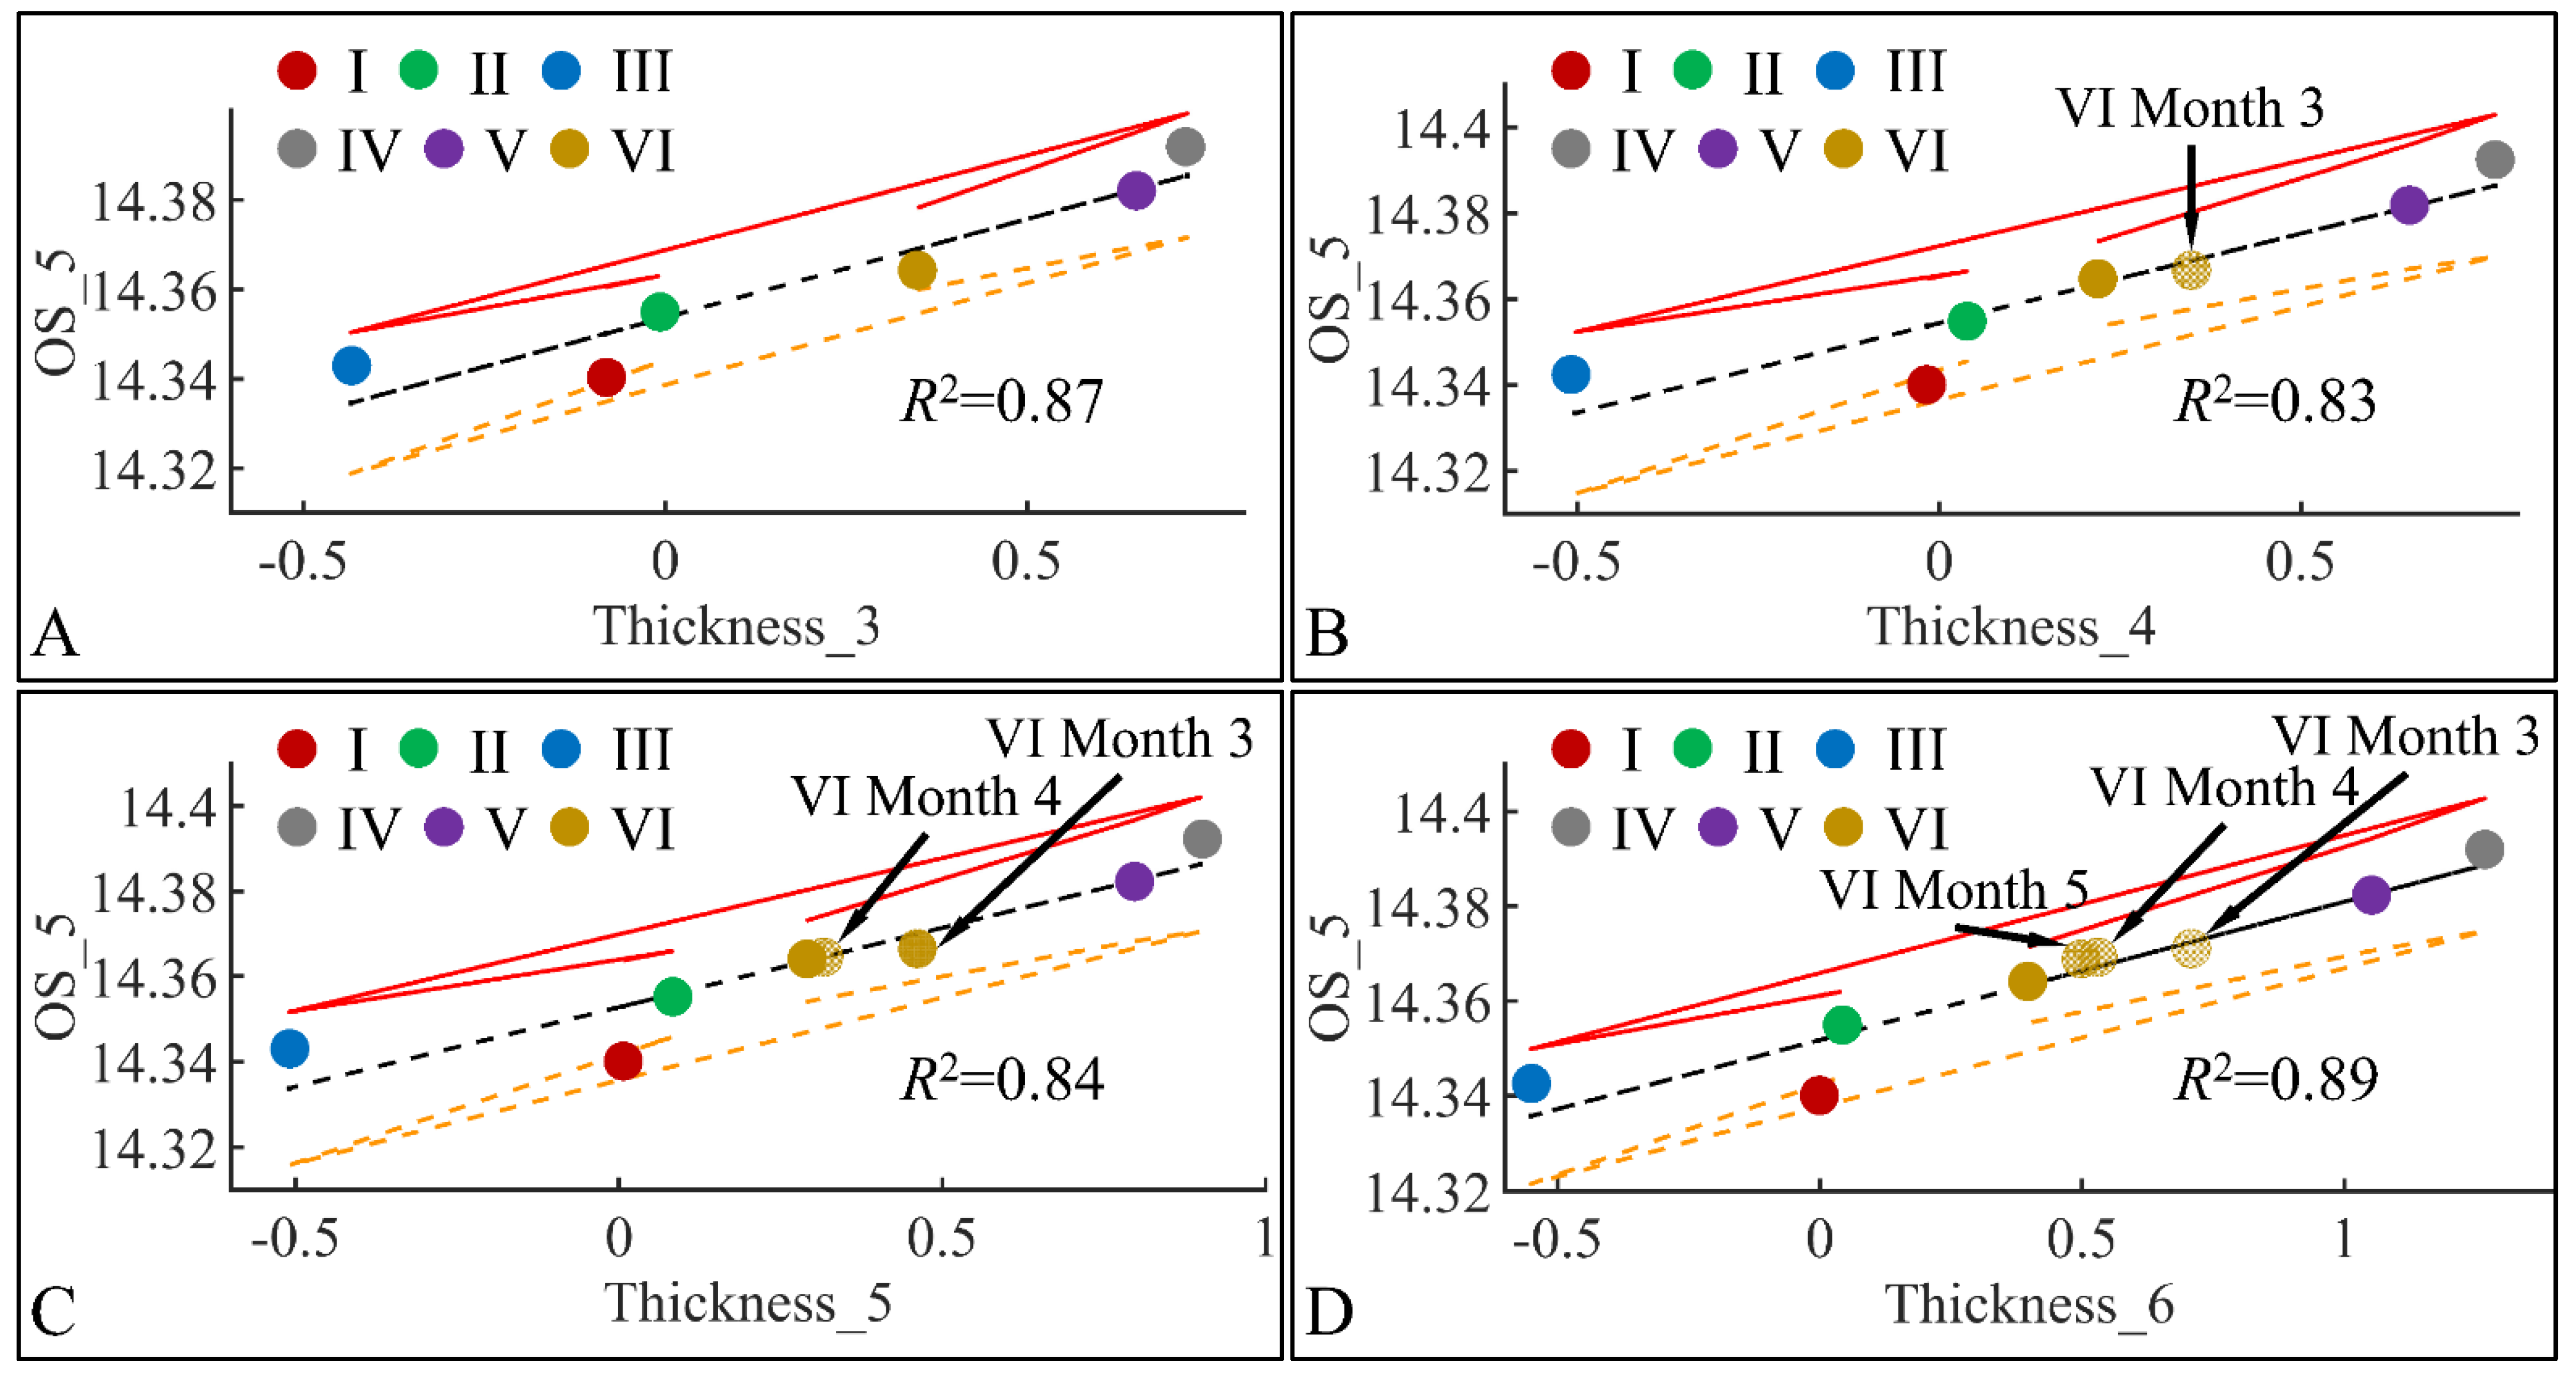
Regression analysis of evaluated variables, with respect to groups. The values of each variable, with respect to time, were regressed within experimental groups. Overall, oxidative stress (OS) on the fifth month (OS_5) was found to have significant correlations to skin thickness (Thickness) for months 3 (Thickness_3) (A), 4 (Thickness_4) (B), 5 (Thickness_5) (C) and 6 (Thickness_6) (D) (Legend: I: No treatment, no diabetes induction, no irradiation, II: Type 2 diabetes induction, no irradiation, III: Type 1 diabetes induction, no irradiation, IV: No diabetes induction, irradiation, V: Type 2 diabetes induction, irradiation, VI: Type 1 diabetes induction, irradiation).
Figure 21.
Regression analysis of evaluated variables, with respect to groups. The values of each variable, with respect to time, were regressed within experimental groups. Overall, oxidative stress (OS) on the fifth month (OS_5) was found to have significant correlations to skin thickness (Thickness) for months 3 (Thickness_3) (A), 4 (Thickness_4) (B), 5 (Thickness_5) (C) and 6 (Thickness_6) (D) (Legend: I: No treatment, no diabetes induction, no irradiation, II: Type 2 diabetes induction, no irradiation, III: Type 1 diabetes induction, no irradiation, IV: No diabetes induction, irradiation, V: Type 2 diabetes induction, irradiation, VI: Type 1 diabetes induction, irradiation).
Figure 22.
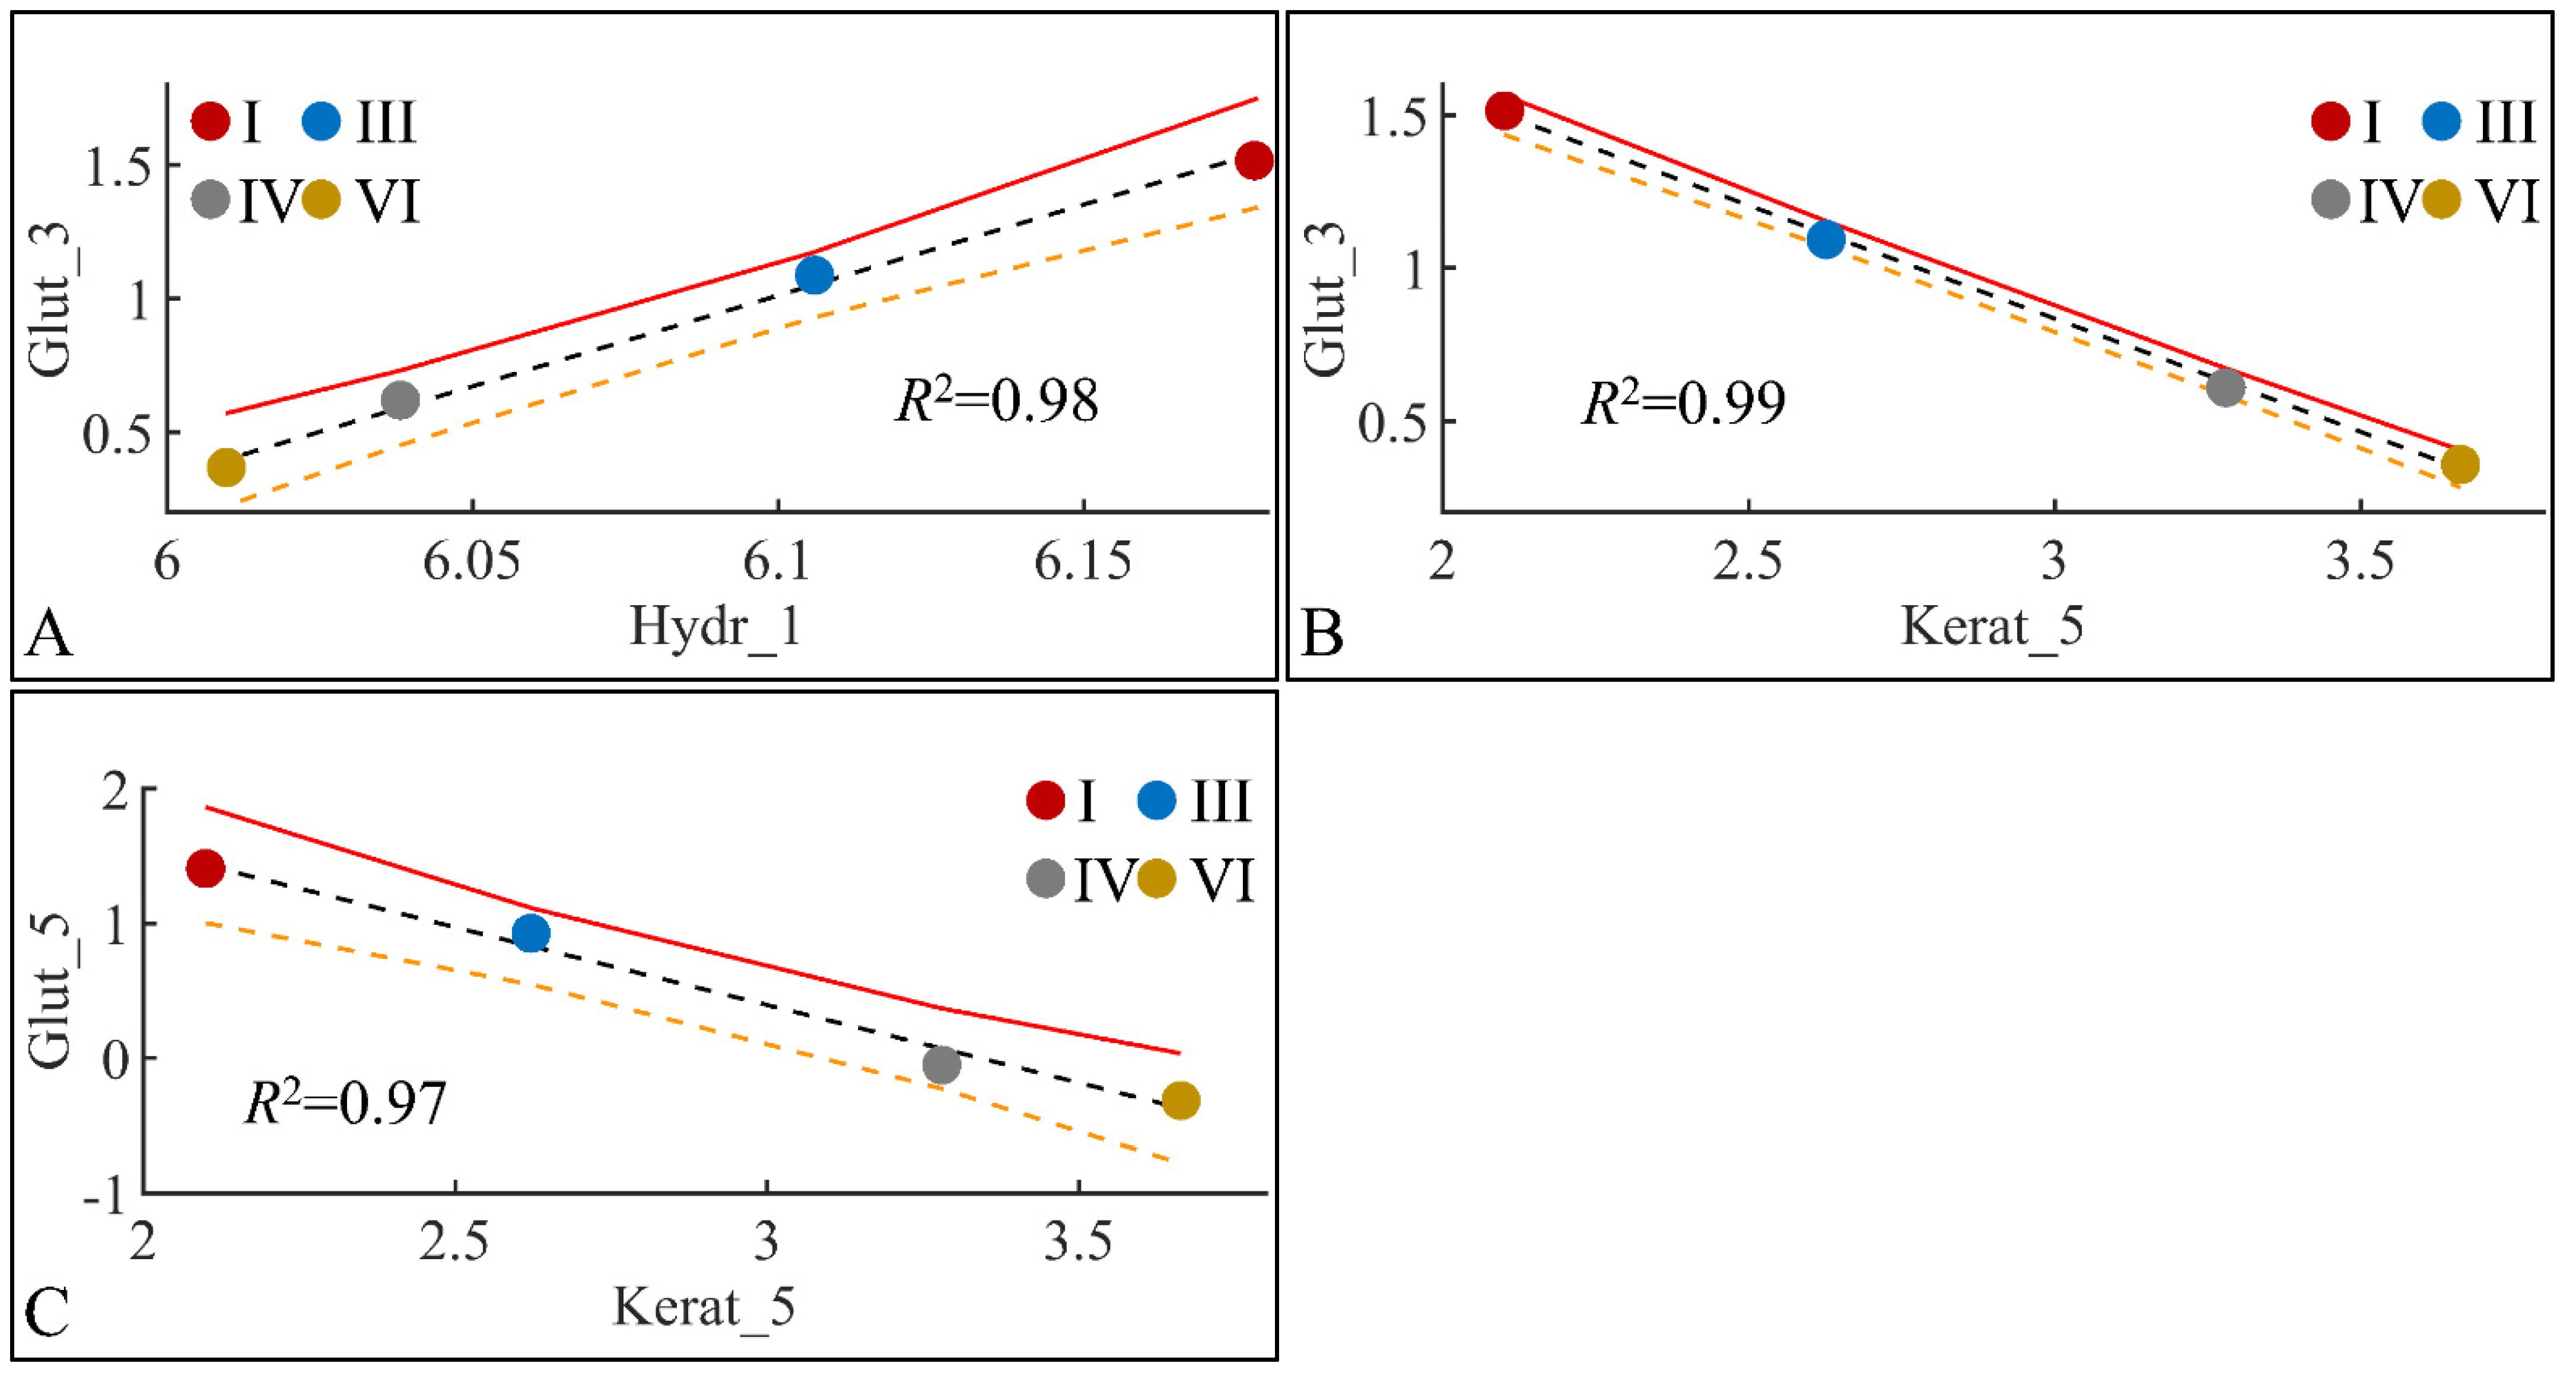
Regression analysis of evaluated variables, with respect to groups. The values of each variable, with respect to time, were regressed within experimental groups. Overall, glutathione (Glut) in the third month (Glut_3) was found to have significant correlations with skin hydration (Hydr) for months 1 (Hydr_1) (A), and keratinocyte mass (Kerat) for month 5 (Kerat_5) (B). At the same time, glutathione in month five (Glut_5) manifested significant correlation with keratinocyte mass in month five (Kerat_5) (C) (Legend: I: No treatment, no diabetes induction, no irradiation, II: Type 2 diabetes induction, no irradiation, III: Type 1 diabetes induction, no irradiation, IV: No diabetes induction, irradiation, V: Type 2 diabetes induction, irradiation, VI: Type 1 diabetes induction, irradiation).
Figure 22.
Regression analysis of evaluated variables, with respect to groups. The values of each variable, with respect to time, were regressed within experimental groups. Overall, glutathione (Glut) in the third month (Glut_3) was found to have significant correlations with skin hydration (Hydr) for months 1 (Hydr_1) (A), and keratinocyte mass (Kerat) for month 5 (Kerat_5) (B). At the same time, glutathione in month five (Glut_5) manifested significant correlation with keratinocyte mass in month five (Kerat_5) (C) (Legend: I: No treatment, no diabetes induction, no irradiation, II: Type 2 diabetes induction, no irradiation, III: Type 1 diabetes induction, no irradiation, IV: No diabetes induction, irradiation, V: Type 2 diabetes induction, irradiation, VI: Type 1 diabetes induction, irradiation).
Figure 23.
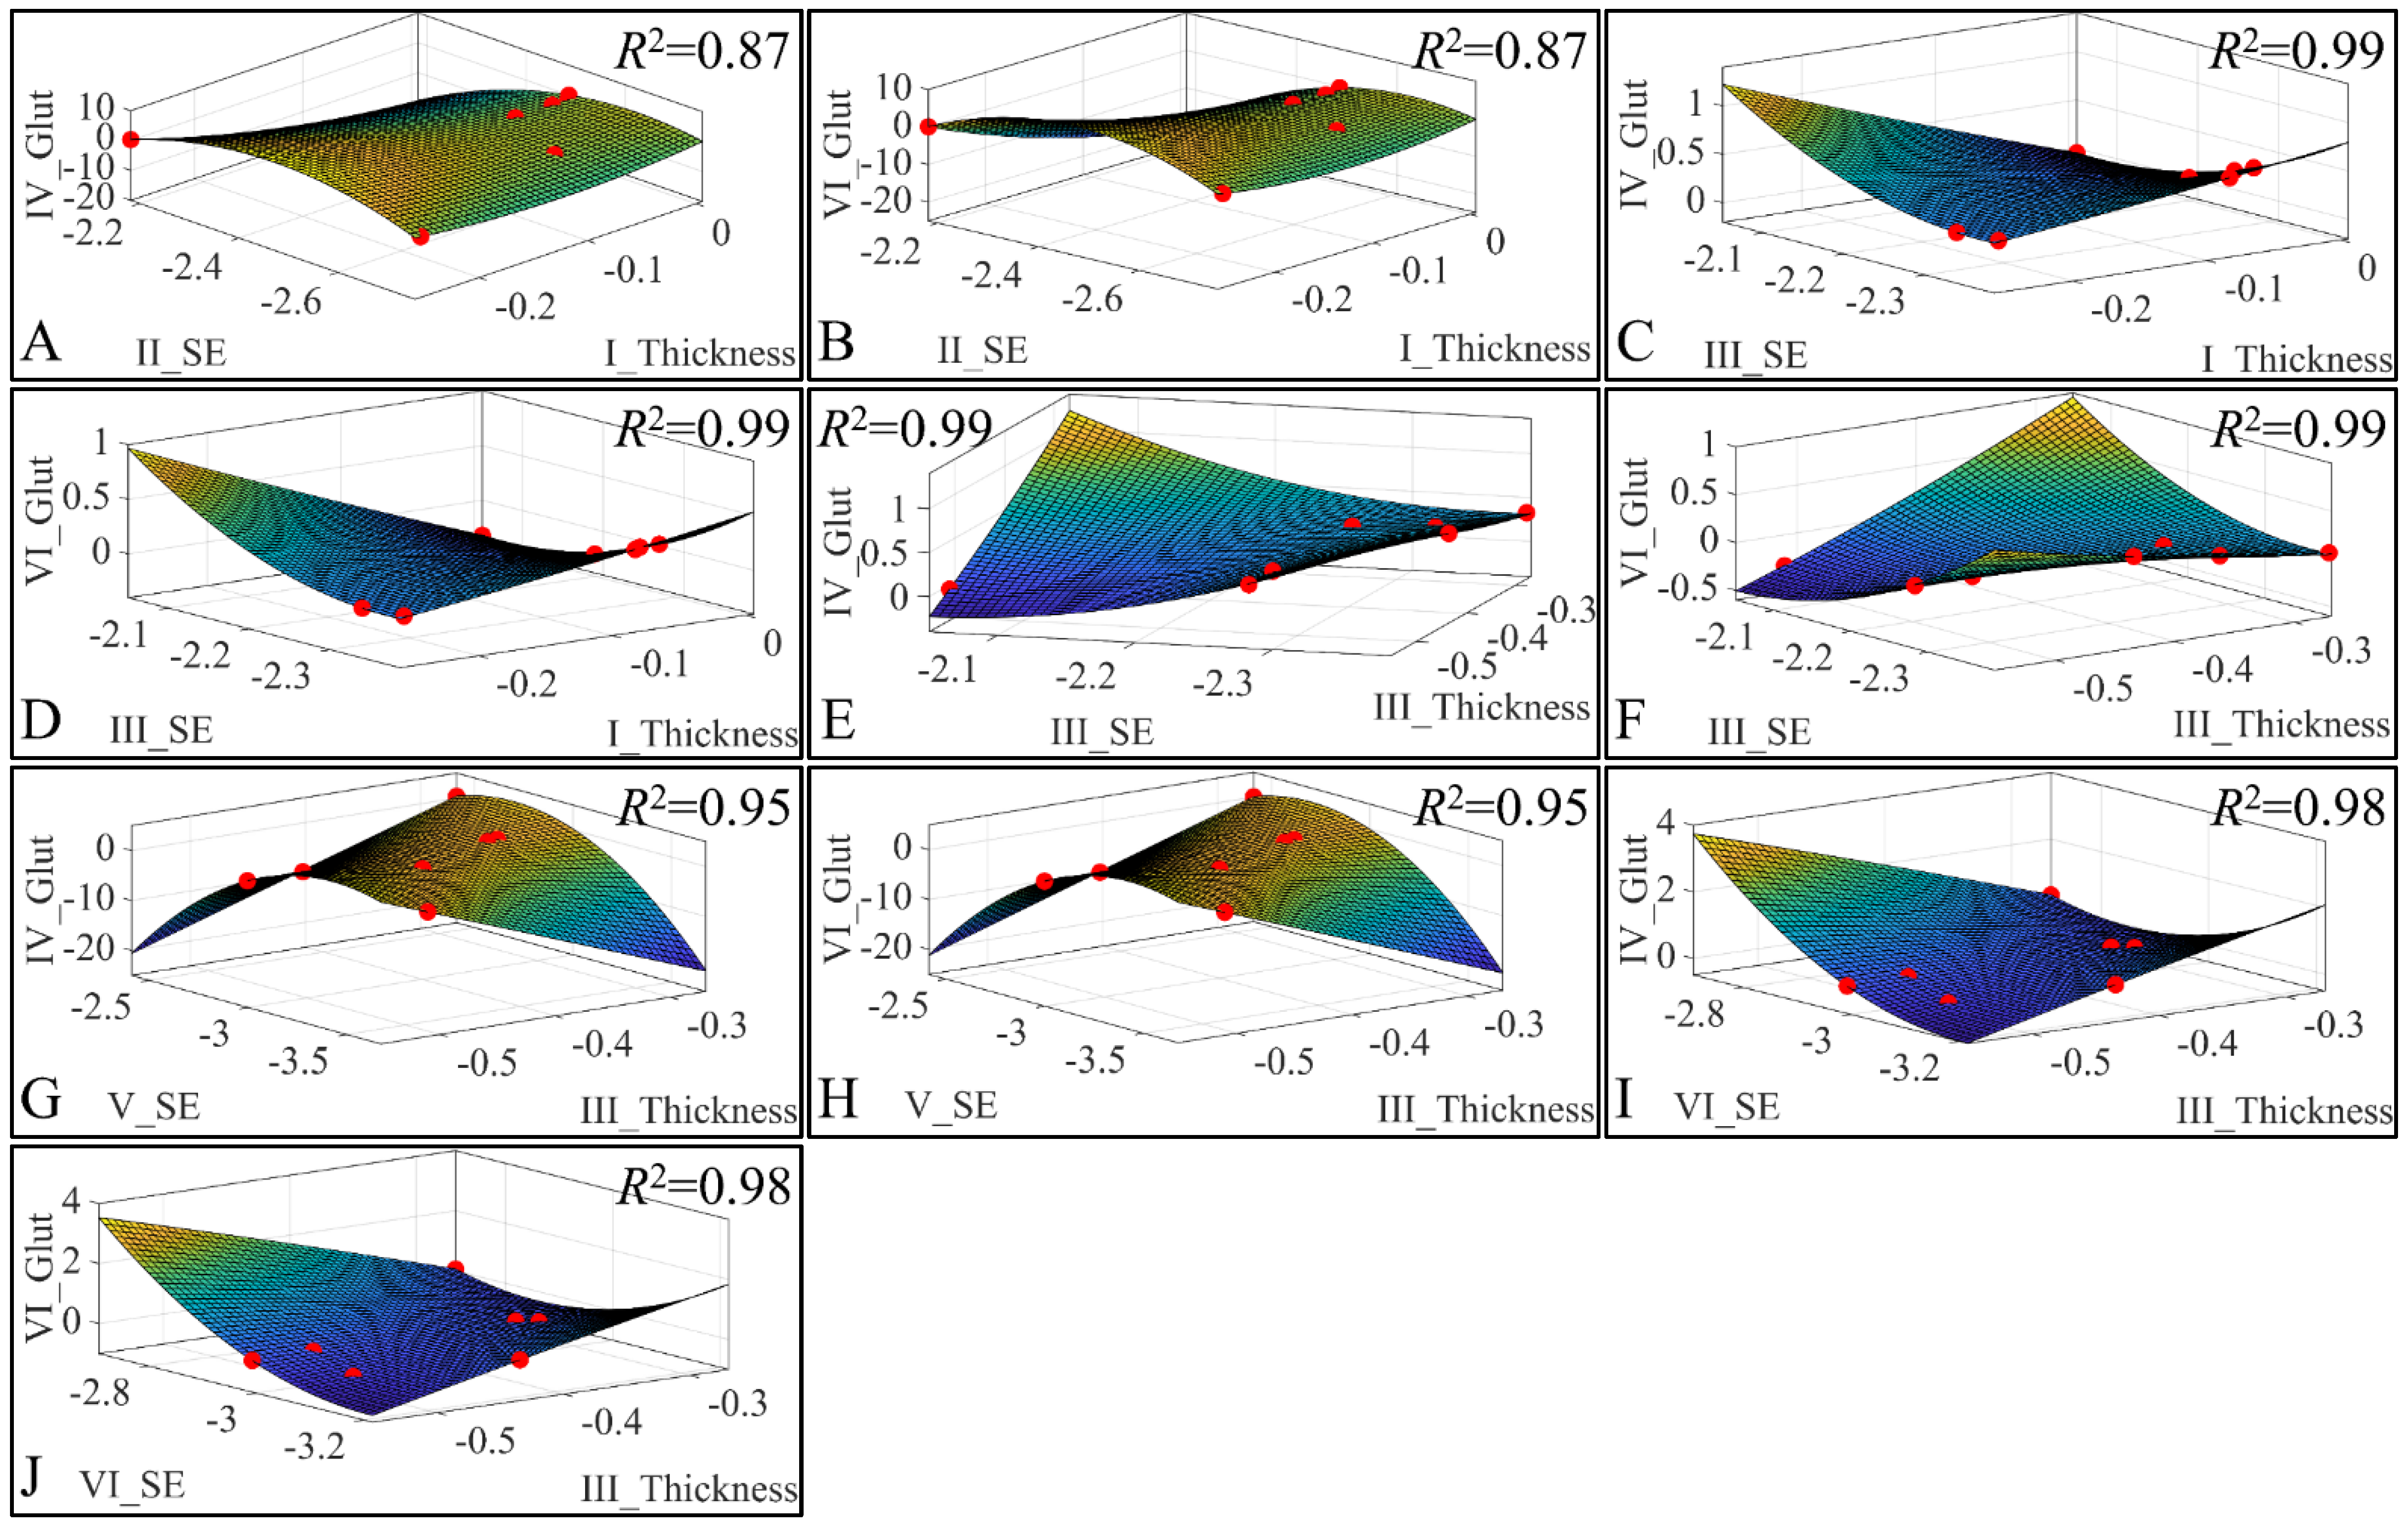
3D regression analysis of evaluated variables, with respect to groups. Significant correlations were observed between skin thickness (Thickness) of Group I, sebum (SE) for Group II, glutathione (Glut) for Group IV (A) and glutathione for Group VI (B). Significant correlations were observed between skin thickness (Thickness) of Group I, sebum (SE) for Group III, glutathione (Glut) for Group IV (C) and Glutathione for group VI (D). Further, significant correlations were observed between skin thickness (Thickness) of Group III, sebum (SE) for Group III, glutathione (Glut) for Group IV (E) and glutathione for Group VI (F). In addition, significant correlations were observed between skin thickness (Thickness) of Group III, sebum (SE) for Group V, glutathione (Glut) for Group IV (G) and glutathione for Group VI (H). Finally, significant correlations were observed between skin thickness (Thickness) of group III, sebum (SE) for Group VI, glutathione (Glut) for Group IV (I) and glutathione for Group VI (J) (Legend: I: No treatment, no diabetes induction, no irradiation, II: Type 2 diabetes induction, no irradiation, III: Type 1 diabetes induction, no irradiation, IV: No diabetes induction, irradiation, V: Type 2 diabetes induction, irradiation, VI: Type 1 diabetes induction, irradiation).
Figure 23.
3D regression analysis of evaluated variables, with respect to groups. Significant correlations were observed between skin thickness (Thickness) of Group I, sebum (SE) for Group II, glutathione (Glut) for Group IV (A) and glutathione for Group VI (B). Significant correlations were observed between skin thickness (Thickness) of Group I, sebum (SE) for Group III, glutathione (Glut) for Group IV (C) and Glutathione for group VI (D). Further, significant correlations were observed between skin thickness (Thickness) of Group III, sebum (SE) for Group III, glutathione (Glut) for Group IV (E) and glutathione for Group VI (F). In addition, significant correlations were observed between skin thickness (Thickness) of Group III, sebum (SE) for Group V, glutathione (Glut) for Group IV (G) and glutathione for Group VI (H). Finally, significant correlations were observed between skin thickness (Thickness) of group III, sebum (SE) for Group VI, glutathione (Glut) for Group IV (I) and glutathione for Group VI (J) (Legend: I: No treatment, no diabetes induction, no irradiation, II: Type 2 diabetes induction, no irradiation, III: Type 1 diabetes induction, no irradiation, IV: No diabetes induction, irradiation, V: Type 2 diabetes induction, irradiation, VI: Type 1 diabetes induction, irradiation).
![Cancers 16 01507 g023]()
Figure 24.
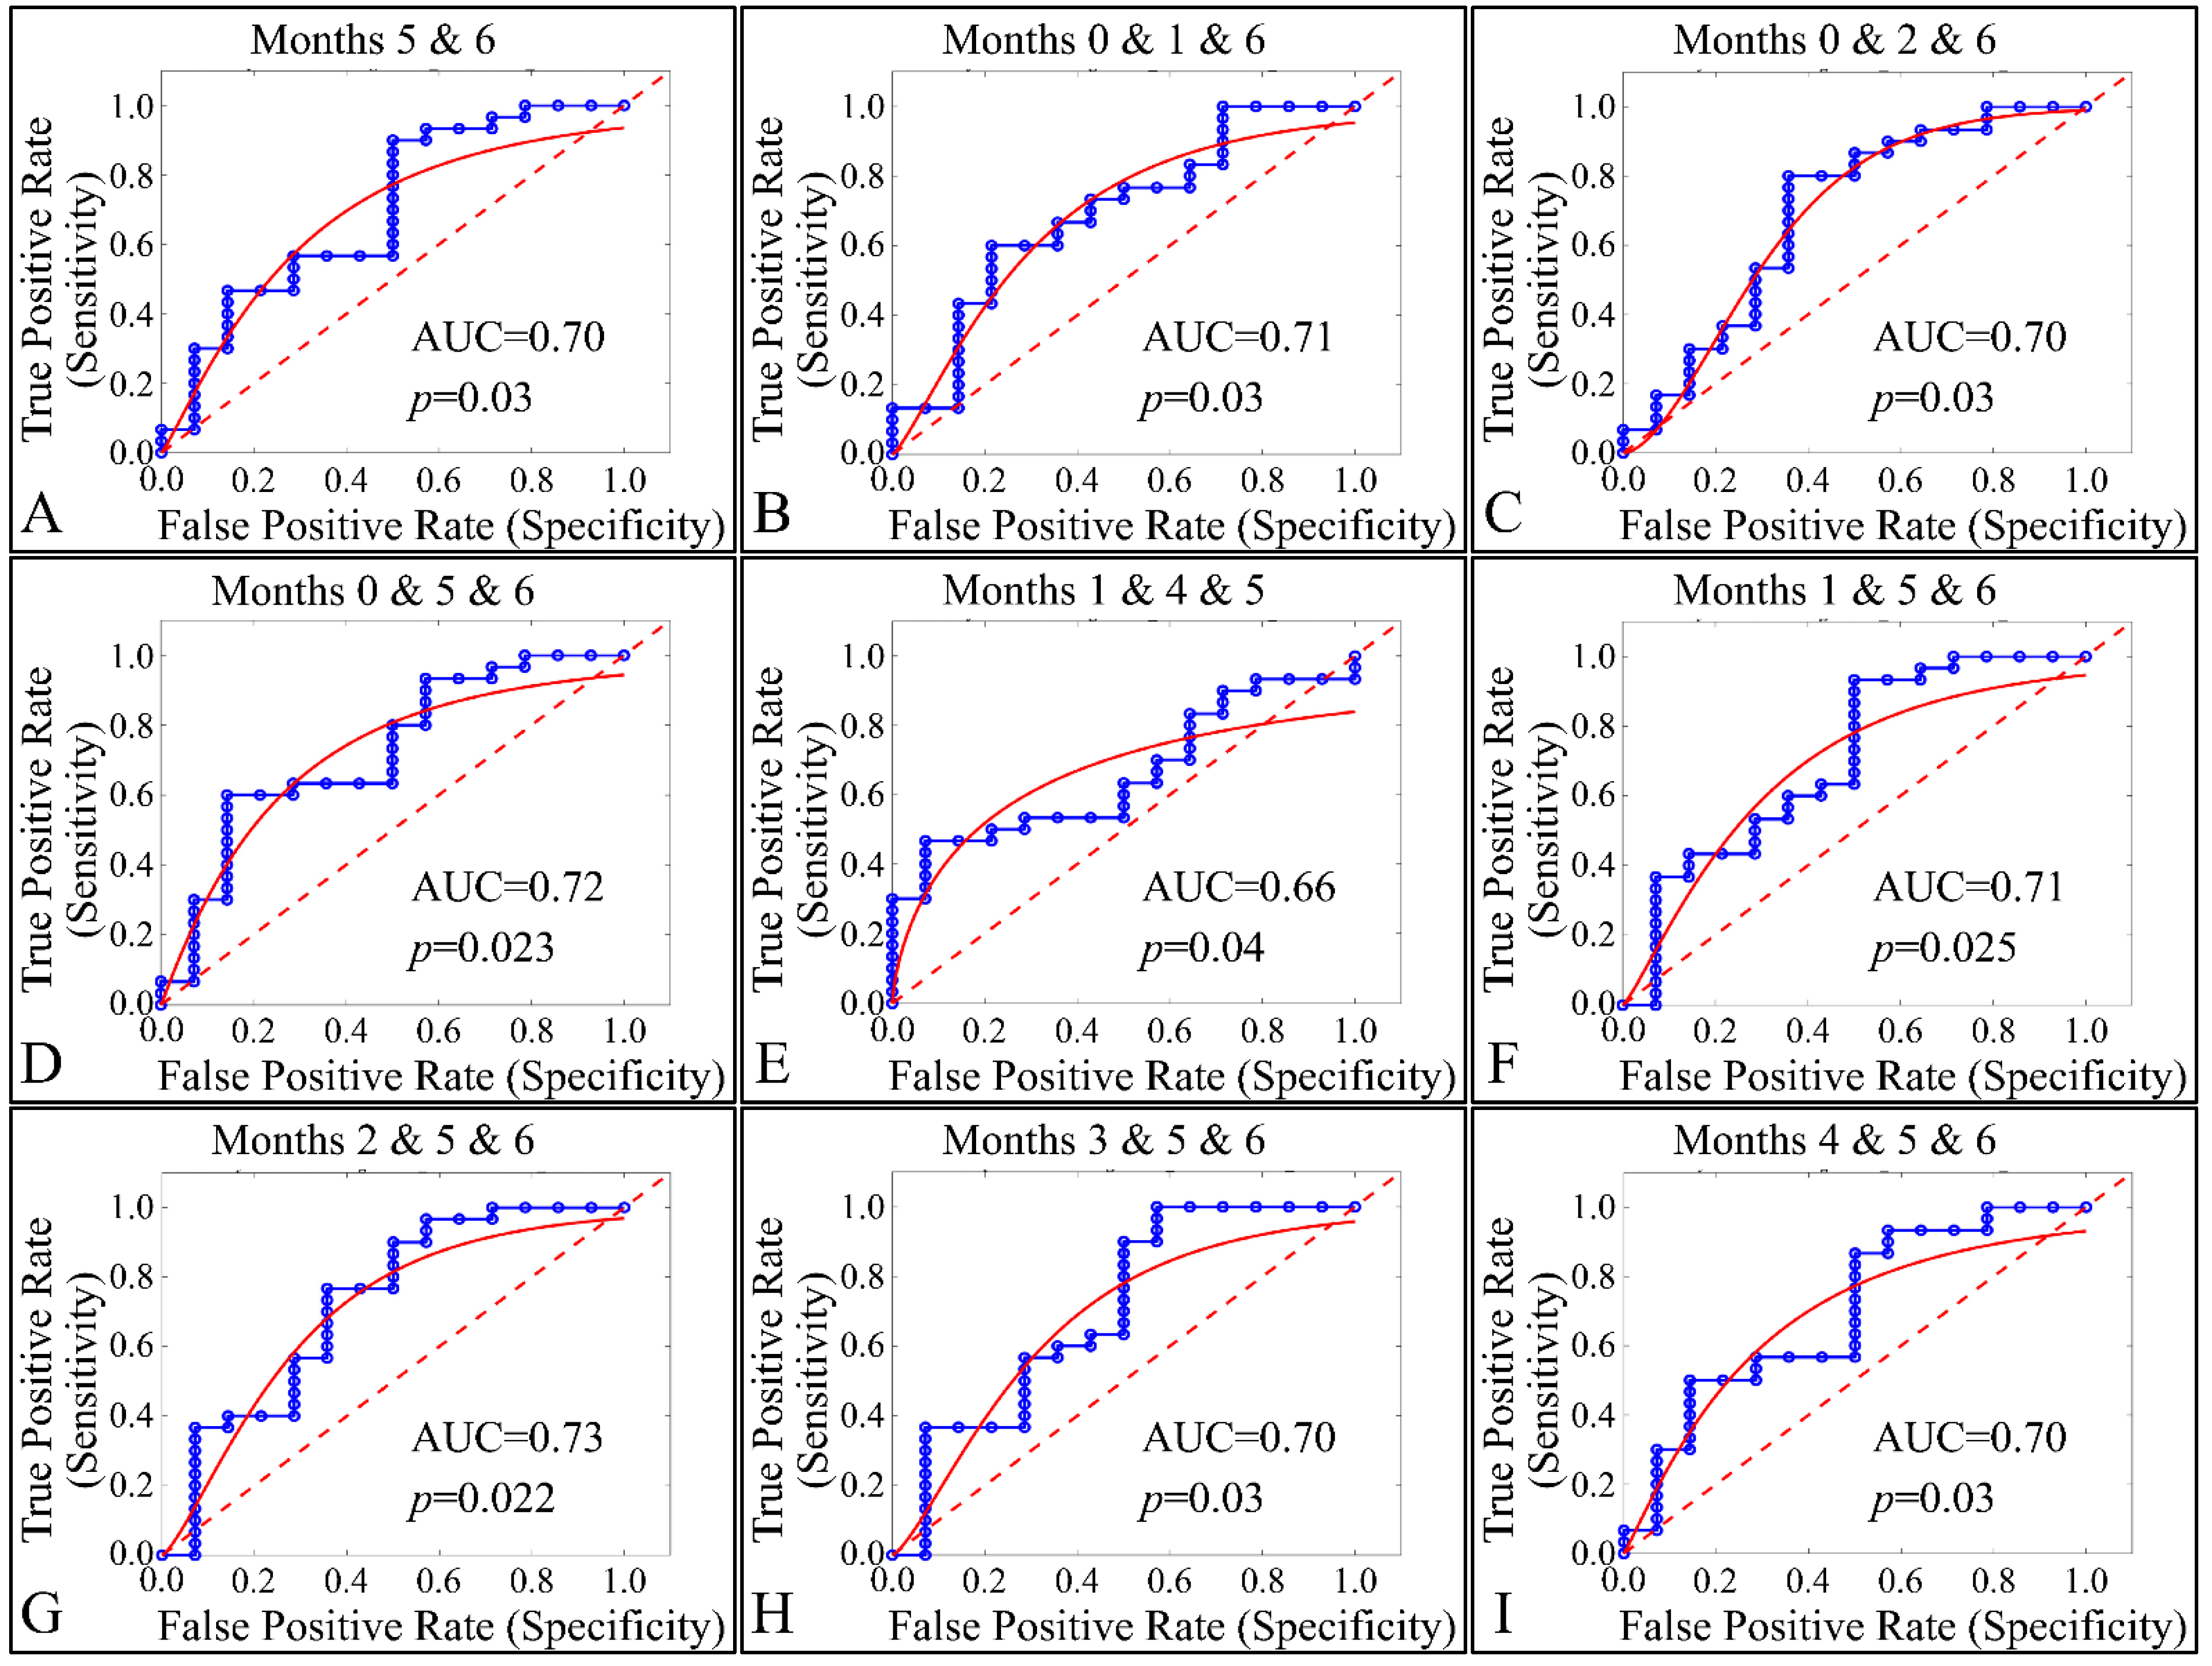
ROC analysis of estimated variables, with respect to time and the presence of tumor. Multi-class analysis was able to discriminate between tumor and non-tumor presenting animals, with respect to the duration of the experiment, i.e., months 5 and 6 (A), 0,1, 6 (B), 0, 2, 6 (C), 0, 5, 6 (D), 1, 4, 5 (E), 1, 5, 6 (F), 2, 5, 6 (G), 3, 5, 6 (H) and 4, 5, 6 (I) (Legend: I: No treatment, no diabetes induction, no irradiation, II: Type 2 diabetes induction, no irradiation, III: Type 1 diabetes induction, no irradiation, IV: No diabetes induction, irradiation, V: Type 2 diabetes induction, irradiation, VI: Type 1 diabetes induction, irradiation AUC: Area Under the Curve).
Figure 24.
ROC analysis of estimated variables, with respect to time and the presence of tumor. Multi-class analysis was able to discriminate between tumor and non-tumor presenting animals, with respect to the duration of the experiment, i.e., months 5 and 6 (A), 0,1, 6 (B), 0, 2, 6 (C), 0, 5, 6 (D), 1, 4, 5 (E), 1, 5, 6 (F), 2, 5, 6 (G), 3, 5, 6 (H) and 4, 5, 6 (I) (Legend: I: No treatment, no diabetes induction, no irradiation, II: Type 2 diabetes induction, no irradiation, III: Type 1 diabetes induction, no irradiation, IV: No diabetes induction, irradiation, V: Type 2 diabetes induction, irradiation, VI: Type 1 diabetes induction, irradiation AUC: Area Under the Curve).
Table 1.
The experimental groups involved in the study.
Table 1.
The experimental groups involved in the study.
| Group | Diabetes | Irradiation | Description |
|---|
| I | NO | NO | Control/Reference |
| II | T2D | NO | Type 2 diabetes induction (20 mg/kg streptozocin, low dose) |
| III | T1D | NO | Type 1 diabetes induction (30 mg/kg streptozocin, high dose) |
| IV | NO | YES | Control/Reference, UV Irradiation |
| V | T2D | YES | Type 2 diabetes induction (20 mg/kg streptozocin, low dose), UV Irradiation |
| VI | T1D | YES | Type 1 diabetes induction (30 mg/kg streptozocin, high dose), UV Irradiation |
Table 2.
The raw values of glucose measurements in the experimental mouse model (Legend: I: no treatment, no diabetes induction, no irradiation, II: Type 2 diabetes induction (low dose), no irradiation, III: Type 1 diabetes induction (high dose), no irradiation, IV: No diabetes induction, irradiation, V: Type 2 diabetic diabetes induction, irradiation, VI: Type 1 diabetes induction, irradiation). NaN: Not a Number (no measure was taken of reference mice).
| | Glucose in mg/dL (Mean ± SD) |
|---|
| Group | | Month 0 | 1st Month | 2nd Month | 3rd Month | 4th Month | 5th Month | 6th Month |
| I | 121.14 ± 2 8.57 | NaN | NaN | NaN | NaN | NaN | 119.43 ± 15.33 |
| II | 118.00 ± 16.86 | 173.00 ± 43.29 | 200.83 ± 29.96 | 190.17 ± 25.25 | 160.33 ± 37.15 | 192.17 ± 47.88 | 192.83 ± 73.20 |
| III | 128.17 ± 14.15 | 304.67 ± 111.39 | 487.67 ± 40.35 | 506.00 ± 58.16 | 543.00 ± 46.77 | 594.00 ± 08.04 | 578.25 ± 26.54 |
| IV | 111.14 ± 19.97 | NaN | NaN | NaN | NaN | NaN | 108.00 ± 18.89 |
| V | 120.17 ± 23.49 | 154.00 ± 34.79 | 179.67 ± 37.67 | 137.83 ± 20.20 | 145.50 ± 35.12 | 156.50 ± 15.19 | 114.00 ± 18.48 |
| VI | 127.29 ± 32.70 | 344.14 ± 119.02 | 529.71 ± 58.68 | 547.43 ± 44.22 | 572.00 ± 47.61 | 575.67 ± 38.72 | 550.00 ± 70.71 |
Table 3.
TEWL measurements in the experimental mouse model (Legend: I: No treatment, no diabetes induction, no irradiation, II: Type 2 diabetes induction, no irradiation, III: Type 1 diabetes induction, no irradiation, IV: No diabetes induction, irradiation, V: Type 2 diabetes induction, irradiation, VI: Type 1 diabetes induction, irradiation).
| Transepidermal Water Loss (TEWL) in gr/m2/h (Mean ± SD) |
|---|
| Group | | 0 Month | 1st Month | 2nd Month | 3rd Month | 4th Month | 5th Month | 6th Month |
| I | 8.73 ± 01.30 | 12.46 ± 03.92 | 10.71 ± 01.41 | 9.14 ± 00.69 | 8.93 ± 00.89 | 8.49 ± 01.12 | 9.33 ± 01.04 |
| II | 8.84 ± 01.10 | 10.46 ± 02.50 | 12.00 ± 02.65 | 9.42 ± 00.49 | 8.58 ± 01.02 | 8.75 ± 01.60 | 10.13 ± 01.03 |
| III | 8.41 ± 01.67 | 11.60 ± 02.89 | 11.40 ± 02.40 | 6.43 ± 01.37 | 6.50 ± 01.89 | 7.00 ± 01.54 | 7.00 ± 03.46 |
| IV | 7.27 ± 01.10 | 16.36 ± 06.73 | 23.21 ± 04.79 | 22.00 ± 03.83 | 21.07 ± 03.14 | 27.00 ± 05.60 | 42.86 ± 08.38 |
| V | 9.48 ± 01.42 | 16.30 ± 04.45 | 26.08 ± 03.80 | 24.67 ± 07.00 | 23.17 ± 03.06 | 31.17 ± 01.83 | 51.00 ± 06.81 |
| VI | 8.84 ± 01.21 | 17.36 ± 04.46 | 19.14 ± 02.79 | 12.57 ± 00.98 | 11.14 ± 01.95 | 11.25 ± 01.37 | 11.00 ± 04.36 |
Table 4.
The raw values of skin hydration measurements in the experimental mouse model (Legend: I: No treatment, no diabetes induction, no irradiation, II: Type 2 diabetes induction, no irradiation, III: Type 1 diabetes induction, no irradiation, IV: No diabetes induction, irradiation, V: Type 2 diabetes induction, irradiation, VI: Type 1 diabetes induction, irradiation).
| Hydration in Arbitrary Units (Mean ± SD) |
|---|
| Group | | Month 0 | 1st Month | 2nd Month | 3rd Month | 4th Month | 5th Month | 6th Month |
| I | 77.57 ± 04.08 | 72.43 ± 01.40 | 81.14 ± 04.53 | 77.43 ± 03.91 | 78.43 ± 04.16 | 73.14 ± 02.73 | 77.43 ± 03.74 |
| II | 75.57 ± 04.83 | 72.43 ± 03.21 | 80.50 ± 02.35 | 77.50 ± 08.04 | 75.50 ± 06.47 | 73.83 ± 07.19 | 76.33 ± 06.41 |
| III | 81.14 ± 07.78 | 68.86 ± 05.34 | 74.71 ± 04.61 | 63.14 ± 10.64 | 65.14 ± 11.61 | 61.40 ± 06.84 | 65.00 ± 07.00 |
| IV | 79.71 ± 05.62 | 65.71 ± 06.16 | 71.00 ± 02.77 | 64.71 ± 03.50 | 61.57 ± 05.13 | 54.57 ± 07.11 | 52.43 ± 07.57 |
| V | 78.83 ± 04.58 | 62.50 ± 03.51 | 68.50 ± 03.39 | 63.50 ± 05.79 | 63.67 ± 04.13 | 55.83 ± 07.60 | 53.67 ± 06.38 |
| VI | 80.14 ± 03.29 | 64.43 ± 07.48 | 61.29 ± 06.45 | 54.71 ± 05.65 | 48.86 ± 07.20 | 38.14 ± 04.18 | 36.33 ± 00.58 |
Table 5.
The raw values of skin layer thickness measurements in the experimental mouse model (Legend: I: No treatment, no diabetes induction, no irradiation, II: Type 2 diabetes induction, no irradiation, III: Type 1 diabetes induction, no irradiation, IV: No diabetes induction, irradiation, V: Type 2 diabetes induction, irradiation, VI: Type 1 diabetes induction, irradiation).
| Skin Layer Thickness (mm) (Mean ± SD) |
|---|
| | | 0 Month | 1st Month | 2nd Month | 3rd Month | 4th Month | 5th Month | 6th Month |
| Group | I | 0.84 ± 00.08 | 0.84 ± 00.10 | 0.97 ± 00.13 | 0.94 ± 00.07 | 0.99 ± 00.10 | 1.00 ± 00.06 | 1.00 ± 00.06 |
| II | 0.87 ± 00.04 | 0.87 ± 00.06 | 0.98 ± 00.05 | 0.99 ± 00.04 | 1.03 ± 00.05 | 1.06 ± 00.08 | 1.03 ± 00.03 |
| III | 0.83 ± 00.13 | 0.79 ± 00.06 | 0.79 ± 00.13 | 0.74 ± 00.14 | 0.71 ± 00.13 | 0.70 ± 00.14 | 0.68 ± 00.15 |
| IV | 0.85 ± 00.09 | 1.06 ± 00.18 | 1.49 ± 00.18 | 1.65 ± 00.17 | .70 ± 00.14 | 1.86 ± 00.39 | 2.41 ± 00.16 |
| V | 0.86 ± 00.10 | 1.05 ± 00.22 | 1.52 ± 00.12 | 1.57 ± 00.18 | 1.58 ± 00.21 | 1.74 ± 00.18 | 2.07 ± 00.52 |
| VI | 0.86 ± 00.06 | 1.13 ± 00.09 | 1.34 ± 00.08 | 1.27 ± 00.06 | 1.16 ± 00.06 | 1.22 ± 00.10 | 1.32 ± 00.23 |
Table 6.
Body weight measurements in the experimental mouse model (Legend: I: No treatment, no diabetes induction, no irradiation, II: Type 2 diabetes induction, no irradiation, III: Type 1 diabetes induction, no irradiation, IV: No diabetes induction, irradiation, V: Type 2 diabetes induction, irradiation, VI: Type 1 diabetes induction, irradiation).
| Body Weight (gr) (Mean ± SD) |
|---|
| | | 0 Month | 1st Month | 2nd Month | 3rd Month | 4th Month | 5th Month | 6th Month |
| Group | I | 31.41 ± 04.24 | 33.09 ± 02.66 | 34.39 ± 05.58 | 37.99 ± 04.90 | 39.27 ± 04.57 | 42.00 ± 03.28 | 43.86 ± 03.44 |
| II | 31.79 ± 02.08 | 34.16 ± 02.00 | 35.30 ± 01.84 | 38.57 ± 02.61 | 38.73 ± 02.81 | 38.67 ± 03.53 | 42.55 ± 02.65 |
| III | 29.47 ± 03.80 | 30.29 ± 03.06 | 27.67 ± 04.64 | 29.36 ± 02.29 | 29.53 ± 02.65 | 30.44 ± 02.44 | 29.43 ± 04.38 |
| IV | 31.23 ± 05.84 | 34.67 ± 06.71 | 33.40 ± 06.51 | 36.73 ± 05.53 | 37.17 ± 05.57 | 39.41 ± 06.38 | 39.89 ± 06.83 |
| V | 30.48 ± 05.57 | 33.03 ± 05.35 | 32.35 ± 03.82 | 35.08 ± 05.44 | 35.03 ± 05.11 | 37.00 ± 05.22 | 37.42 ± 05.46 |
| VI | 31.17 ± 03.60 | 33.30 ± 03.84 | 28.11 ± 00.56 | 29.36 ± 01.60 | 29.14 ± 00.97 | 28.03 ± 00.69 | 24.40 ± 03.03 |
Table 7.
The raw values of skin elasticity measurements in the experimental mouse model (Legend: I: No treatment, no diabetes induction, no irradiation, II: Type 2 diabetes induction, no irradiation, III: Type 1 diabetes induction, no irradiation, IV: No diabetes induction, irradiation, V: Type 2 diabetes induction, irradiation, VI: Type 1 Diabetes induction, irradiation).
| Skin Elasticity (Arbitrary Units) (Mean ± SD) |
|---|
| | | 0 Month | 1st Month | 3rd Month | 5th Month |
| Group | I | 0.22 ± 00.12 | 0.14 ± 00.03 | 0.13 ± 00.03 | 0.19 ± 00.04 |
| II | 0.15 ± 00.05 | 0.22 ± 00.09 | 0.16 ± 00.08 | 0.18 ± 00.04 |
| III | 0.19 ± 00.10 | 0.20 ± 00.10 | 0.19 ± 00.03 | 0.24 ± 00.15 |
| IV | 0.13 ± 00.03 | 0.14 ± 00.03 | 0.09 ± 00.01 | 0.08 ± 00.03 |
| V | 0.19 ± 00.07 | 0.13 ± 00.03 | 0.11 ± 00.02 | 0.08 ± 00.02 |
| VI | 0.15 ± 00.03 | 0.12 ± 00.01 | 0.11 ± 00.01 | 0.12 ± 00.02 |
Table 8.
The raw values of sebum, melanin, and stripped keratinocyte measurements in the experimental mouse model (Legend: I: No treatment, no diabetes induction, no irradiation, II: Type 2 diabetes induction, no irradiation, III: Type 1 diabetes induction, no irradiation, IV: No diabetes induction, irradiation, V: Type 2 diabetes induction, irradiation, VI: Type 1 diabetes induction, irradiation).
| Sebum, Melanin and Keratinocytes (Mean ± SD) |
|---|
| | | Sebum | Melanin | Keratinocytes |
| | | 5th Month | 6th Month | 6th Month |
| Group | I | 4.14 ± 01.57 | 154.71 ± 37.50 | 4.29 ± 00.76 |
| II | 4.33 ± 01.86 | 114.00 ± 11.87 | 4.00 ± 01.10 |
| III | 3.00 ± 00.71 | 126.50 ± 26.84 | 6.17 ± 02.23 |
| IV | 6.57 ± 02.30 | 690.00 ± 83.38 | 9.71 ± 01.60 |
| V | 3.17 ± 01.47 | 570.17 ± 91.95 | 9.67 ± 02.66 |
| VI | 2.67 ± 00.82 | 509.33 ± 91.43 | 12.67 ± 03.67 |
Table 9.
The raw values of glutathione, uric acid and ROS measurements in the experimental mouse model (Legend: I: No treatment, no diabetes induction, no irradiation, II: Type 2 diabetes induction, no irradiation, III: Type 1 diabetes induction, no irradiation, IV: No diabetes induction, irradiation, V: Type 2 diabetes induction, irradiation, VI: Type 1 diabetes induction, irradiation).
| | | Glutathione (nmol/mg)
(Mean ± SD) | Uric Acid (nmol/mg)
(Mean ± SD) | Oxidative Stress (Fluorescence)
(Mean ± SD) |
|---|
| | | 3rd Month | 5th Month | 3rd Month | 5th Month | 5th Month |
| Group | I | 2.86 ± 00.78 | 2.62 ± 00.31 | 1.94 ± 00.96 | 2.33 ± 01.90 | 20,735.71 ± 438.64 |
| II | 0.00 ± 00.00 | 0.00 ± 00.00 | 0.00 ± 00.00 | 0.00 ± 00.00 | 20,951.00 ± 287.05 |
| III | 2.14 ± 00.44 | 1.90 ± 00.86 | 1.86 ± 00.32 | 3.46 ± 01.29 | 20,773.60 ± 448.94 |
| IV | 1.54 ± 00.35 | 0.97 ± 00.17 | 3.45 ± 01.62 | 3.65 ± 01.15 | 21,493.14 ± 461.08 |
| V | 0.00 ± 00.00 | 0.00 ± 00.00 | 0.00 ± 00.00 | 0.00 ± 00.00 | 21,351.75 ± 198.56 |
| VI | 1.28 ± 00.22 | 0.80 ± 00.14 | 3.67 ± 01.33 | 2.34 ± 00.90 | 21,087.33 ± 437.39 |


 ,
, 


