Article

Drug Cost Avoidance Resulting from Participation in Clinical Trials: A 10-Year Retrospective Analysis of Cancer Patients with Solid Tumors

by
Maria-Josep Carreras
1,*,
Berta Renedo-Miró
1,
Carolina Valdivia
1,
Elena Tomás-Guillén
2,
Anna Farriols
1,
Laura Mañós
1,
Jana Vidal
1,
María Alcalde
1,†,
Isabel De la Paz
1,‡,
Inés Jiménez-Lozano
1,§,
Maria-Eugenia Palacio-Lacambra
1,
Nuria Sabaté
1,‖,
Enriqueta Felip
3,
Elena Garralda
3,
Margarita Garau
1,¶,
Maria-Queralt Gorgas
1,
Josep Monterde
2 and
Josep Tabernero
3
1
Pharmacy Department, Vall d’Hebron University Hospital, E-08035 Barcelona, Spain
2
Asserta Global Healthcare Solutions, Sant Quirze del Vallés, E-08192 Barcelona, Spain
3
Medical Oncology Department, Vall d’Hebron University Hospital, Vall d’Hebron Institute of Oncology (VHIO), E-08035 Barcelona, Spain
*
Author to whom correspondence should be addressed.
Current Address: Pharmacy Unit, Catalan Institute of Oncology (ICO Badalona), E-08916 Badalona, Spain.
Current Address: CSG Consulting Iberia at Alira Health, E-08029 Barcelona, Spain.
§
Current Address: Pharmacy Department, Alt Penedès Comarcal Hospital, E-08720 Vilafranca del Penedès, Spain.
Current Address: Pharmacy Department, Catalan Institute of Oncology (ICO Girona), E-17007 Girona, Spain.
Current Address: Pharmacy Department, Medicine Coordination and Strategy Unit (UCEM), Catalan Health Institute (ICS), E-08007 Barcelona, Spain.
Cancers 2024, 16(8), 1529; https://doi.org/10.3390/cancers16081529
Submission received: 13 February 2024 / Revised: 13 April 2024 / Accepted: 15 April 2024 / Published: 17 April 2024
(This article belongs to the Special Issue Advances in Cancer Data and Statistics)

Abstract

:

Simple Summary

In the present framework of constraints on healthcare budgets, an assessment of costs of antineoplastic drugs is a crucial step in contributing to the sustainability of public-payer systems. This study evaluated the characteristics of cancer clinical trials and potential drug cost avoidance in a large population of adult cancer patients with solid tumors enrolled in clinical trials over a 10-year period (2010–2019). These trials were conducted at the Medical Oncology Department of Vall d’Hebron University Hospital in Barcelona (Spain), one of the largest tertiary care centers in the country. Based on the data of 2930 clinical trials with 10,488 participants, it was found that the total cost of antineoplastic drugs supplied by sponsors in the clinical trials setting was EUR 107,306,084, with a potential cost savings of EUR 92,662,609. Participation in sponsored clinical trials in which drugs are provided free of charge yields considerable cost savings, with benefits in clinical strategies to reduce drug expenditures.

Abstract

The objective of this single-center retrospective study was to describe the clinical characteristics of adult patients with solid tumors enrolled in cancer clinical trials over a 10-year period (2010–2019) and to assess drug cost avoidance (DCA) associated with sponsors’ contributions. The sponsors’ contribution to pharmaceutical expenditure was calculated according to the actual price (for each year) of pharmaceutical specialties that the Vall d’Hebron University Hospital (HUVH) would have had to bear in the absence of sponsorship. A total of 2930 clinical trials were conducted with 10,488 participants. There were 140 trials in 2010 and 459 in 2019 (228% increase). Clinical trials of high complexity phase I and basket trials accounted for 34.3% of all trials. There has been a large variation in the pattern of clinical research over the study period, whereas, in 2010, targeted therapy accounted for 79.4% of expenditure and cytotoxic drugs for 20.6%; in 2019, immunotherapy accounted for 68.4%, targeted therapy for 24.4%, and cytotoxic drugs for only 7.1%. A total of four hundred twenty-one different antineoplastic agents were used, the variability of which increased from forty-seven agents in 2010, with only seven of them accounting for 92.8% of the overall pharmaceutical expenditure) to three hundred seventeen different antineoplastic agents in 2019, with thirty-three of them accounting for 90.6% of the overall expenditure. The overall expenditure on antineoplastic drugs in clinical care patients not included in clinical trials was EUR 120,396,096. The total cost of antineoplastic drugs supplied by sponsors in a clinical trial setting was EUR 107,306,084, with a potential DCA of EUR 92,662,609. Overall, clinical trials provide not only the best context for the progress of clinical research and healthcare but also create opportunities for reducing cancer care costs.

1. Introduction

Timely and accurate integration of scientific advances in evidence-based practice is a continuing challenge for the oncology clinician, given the increasing number of new drug approvals and expanded indications for previously approved drugs. All currently available antineoplastic therapies are developed through the clinical trial process led by the pharmaceutical industry and academic research [1]. Commercially sponsored clinical trials are responsible for the development of new anti-cancer drugs, although commercial interests and market expectations do not always coincide with clinical needs. Academic research optimizes the use of drugs in a clinical setting and develops new drug combinations with a strong focus on patients and their unmet needs. Based on clinical trials registered at `ClinicalTrials.gov’, 65% of trials are being supported by health systems, governmental funds, university bodies, and other research organizations [2]. Data from the European Clinical Trials Database (EudraCT) for the period 2005–2013 show that non-commercial sponsors conducted an important proportion (39%) of clinical trials [2]. However, recent statistics (2005–2022) have shown that the percentage of non-commercial trials has decreased to 20% [3], a dangerous trend that will ultimately prove detrimental to cancer care. Moreover, progress in other areas, such as radiation therapy and surgery, can only be achieved by research conducted almost exclusively in academic centers, so the overall contribution of non-commercial institutions to clinical research would be much higher.
Patients benefit from clinical trials due to access to experimental treatments when no other options exist, and to new therapies not yet available, while contributing to the advancement of medical research. In the framework of increasing concerns about the costs of cancer care, data on the cost savings derived from academic clinical trials is limited. Case–control comparisons have shown that participation in cancer clinical trials did not result in significant increases in the direct costs of medical care [4,5,6,7,8,9], but the provision of investigational drug services at academic institutions accounted for substantial drug cost avoidance (DCA) in different disease categories and therapeutic areas, including oncology [10,11,12].
In an analysis of 88 clinical trials with cancer patients in 11 hospitals in Germany from 2002 to 2005, an actual cost saving of EUR 1.5 million was reported [13]. In a lung cancer unit of the Italian National Institute for Cancer Research, the enrolment of 44 patients in 12 sponsored clinical trials allowed the saving of 30% of the pharmaceutical expenses for anti-neoplastic agents in 2010, with additional income from the grants received for each enrolled patient [14]. In a study of 17 phase III clinical trials and 3195 patients conducted by the NCIC Clinical Trials Group in Canada from 1999 to 2011, the total DCA was estimated at CAD 27,952,512, of which targeted therapy constituted 43% [15]. In a study of 357 oncology patients treated on 53 different trial protocols in 2009 and 2010 in a single UK institution, there was an average treatment cost saving of GBP 885,275, largely attributable to pharmaceutical company provision of free drug supplies [16]. In a review of five phase III multicenter, international clinical trials with currently marketed drugs in 136 prostate cancer patients, a total cost avoidance of EUR 696,002 (EUR 5118 per patient) during the study period (1996–2013) was estimated [17]. In another study of 89 breast cancer patients included in 37 clinical trials between 2014 and 2016, the use of an investigational drug as compared to the best standard of care treatments was associated with a total cost avoidance of EUR 957,246 (EUR 10,756 per patient) [18]. In a single Spanish National Health System institution, the overall cost of treatment for 68 adult cancer patients enrolled in 20 different clinical trials was 79% lower in comparison to the routine standard of care, with an average treatment cost per patient and protocol ranging from an excess of EUR 8193 to a saving of EUR 59,770 [19].
However, real-world evidence of drug cost avoidance (DCA) from a large number of sponsored clinical trials in cancer patients is still lacking. Therefore, the objective of the study was to analyze the pharmaceutical antineoplastic expenditure and potential drug cost savings in a large cohort of adult cancer patients with solid tumors enrolled in sponsored clinical trials in a single institution over a 10-year period. The analysis of data by phases of the trials, pharmacological drug classes, tumor location, and active drugs is a differential contribution of the study. Assessment of drug cost savings in a very large cohort of patients with solid tumors will contribute to removing concerns regarding the additional costs of clinical trial settings.

2. Materials and Methods

2.1. Design and Patients

This was a single-center retrospective study of adult cancer patients with solid tumors enrolled in any ongoing clinical trial over a 10-year period (2010–2019) in the Medical Oncology Department of Vall d’Hebron University Hospital (HUVH) in Barcelona, Spain. Data on the pharmaceutical expenditure of adult cancer patients with solid tumors treated at HUVH during the same 10-year period in the health care setting, that is, outside the clinical trial setting, were previously reported [20].
The hospital is the largest tertiary care center in Catalonia and one of the largest in the country. It belongs to the network of medical centers of the national public health system, which provides healthcare services free of charge to all Spanish citizens independently of their demographic characteristics, socioeconomic status, or tax contribution level. In the case of oncological patients, antineoplastic treatments are reimbursed to the hospital by the public health authority. The HUVH has a reference population of 430,000 inhabitants and an annual budget of EUR 630 million [21]. The Medical Oncology Department develops extensive clinical and research activities in coordination with the Vall d’Hebron Institute of Oncology (VHIO). The Pharmacy Department provides services to the general, traumatology, and pediatric/maternal areas, and integrates the Outpatient Prescriptions Unit and the Pharmacy Oncology Unit with various subunits located at the different oncology day hospitals.
Inclusion criteria were: patients of both genders, aged 18 years or older, diagnosed with malignant solid tumors, enrolled in a clinical trial, and treated with any specific antineoplastic drug by the parenteral or oral routes. The parenteral route included intravenous, intramuscular, and subcutaneous drug delivery. Patients with solid tumors not enrolled in a clinical trial were excluded. Approval by the Clinical Research Ethics Committee was waived because of the quality of care nature of the study.

2.2. Study Variables

For each patient, the following variables were recorded: phase of the clinical trial including phase 0; phase I and basket trials; phase II (tumor-specific); phase III; post-authorization and rollover studies; cancer type, classified by body location/system following the National Cancer Institute classification [22]; and pharmacological classes of antineoplastic drugs categorized following the International Common Denomination of Drugs (ICD) or International Non-Proprietary Names (INN) or the Spanish Agency of Medicines and Medical Devices [23], grouped into cytotoxic drugs, immunotherapy, targeted therapy, and other active drugs. For these subgroups, the number of patients and pharmaceutical expenditures for each natural year of the study period were recorded depending on the availability of data.

2.3. Pharmaceutical Expenditure, Sponsor Contribution, and Drug Cost Avoidance

The data for the sample of patients enrolled in clinical trials during the 2010–2019 study period were obtained from the Fundanet (Cantabria, Spain) CTMS (Clinical Trials Management) software (V.2020-13) (https://vhio.fundanetsuite.com/EstudiosClinicos/ (accessed 20 June 2020)) of the VHIO Center of Clinical Trials. Data extracted from this database were imported to the Microsoft Excel program to obtain the following information for each study year: number of clinical trials actively recruiting patients; number of clinical trials with actively recruited patients categorized by phases and cancer type; number of recruited patients by trial phases; and number of patients on active treatment by trial phases.
The costs of all pharmaceutical specialties provided by the sponsors were considered whenever they were marketed drugs at the time of prescription. In randomized double-blind clinical trials, in which the Pharmacy Service was masked regarding the identification of the investigational drug before opening the randomization code, the costs of the doses were calculated by applying the allocation ratio to the number of randomized arms of the protocol. Two types of economic analysis were performed:
(1) The economic contribution of the sponsor in the provision of drugs to carry out clinical trials was calculated according to the actual cost (for each year) of the pharmaceutical specialties that the Vall d’Hebron University Hospital would have had to purchase to carry out these clinical trials in the absence of sponsorship. Details of the calculation of pharmaceutical expenditure and the direct cost of acquiring the pharmaceutical specialties of antineoplastic drugs were previously reported [20].
(2) To obtain the estimated potential annual DCA in the total population of the clinical trials, the mean cost of antineoplastic treatment per patient and year, in each tumor location, of the population of patients treated in our center in the healthcare setting, that is, not included in clinical trials, in the same period (2010–2019), was previously calculated. For this calculation, data were used from the exhaustive analysis of pharmaceutical expenditure involved in antineoplastic treatment of the healthcare population previously reported in our previous study [20]. This mean cost obtained per patient in the healthcare setting outside of clinical trials (in each year and each tumor location) was applied to the number of participants in clinical trials to obtain an estimate of the pharmaceutical expenditure that these patients would have incurred with the treatment that would have been prescribed and used in these patients on the same dates if they had been treated in our healthcare population. The potential annual DCA by tumor location was calculated for clinical trial participants treated with intravenous antineoplastic medications only, as data on tumor locations in patients receiving oral antineoplastic medications in the clinical trial were not available in the anonymized database.

2.4. Statistical Analysis

The data are reported as descriptive statistics. Categorical variables are expressed as frequencies and percentages, and quantitative variables as the mean and standard deviation (SD) or the median and interquartile range (IQR) (25th–75th percentile) if non-normal distributions of data. Analyses were performed using the Pharmacy Analytics Manager (V.2022.1.0) (https://www.asserta.net (accessed on 20 July 2020)).

3. Results

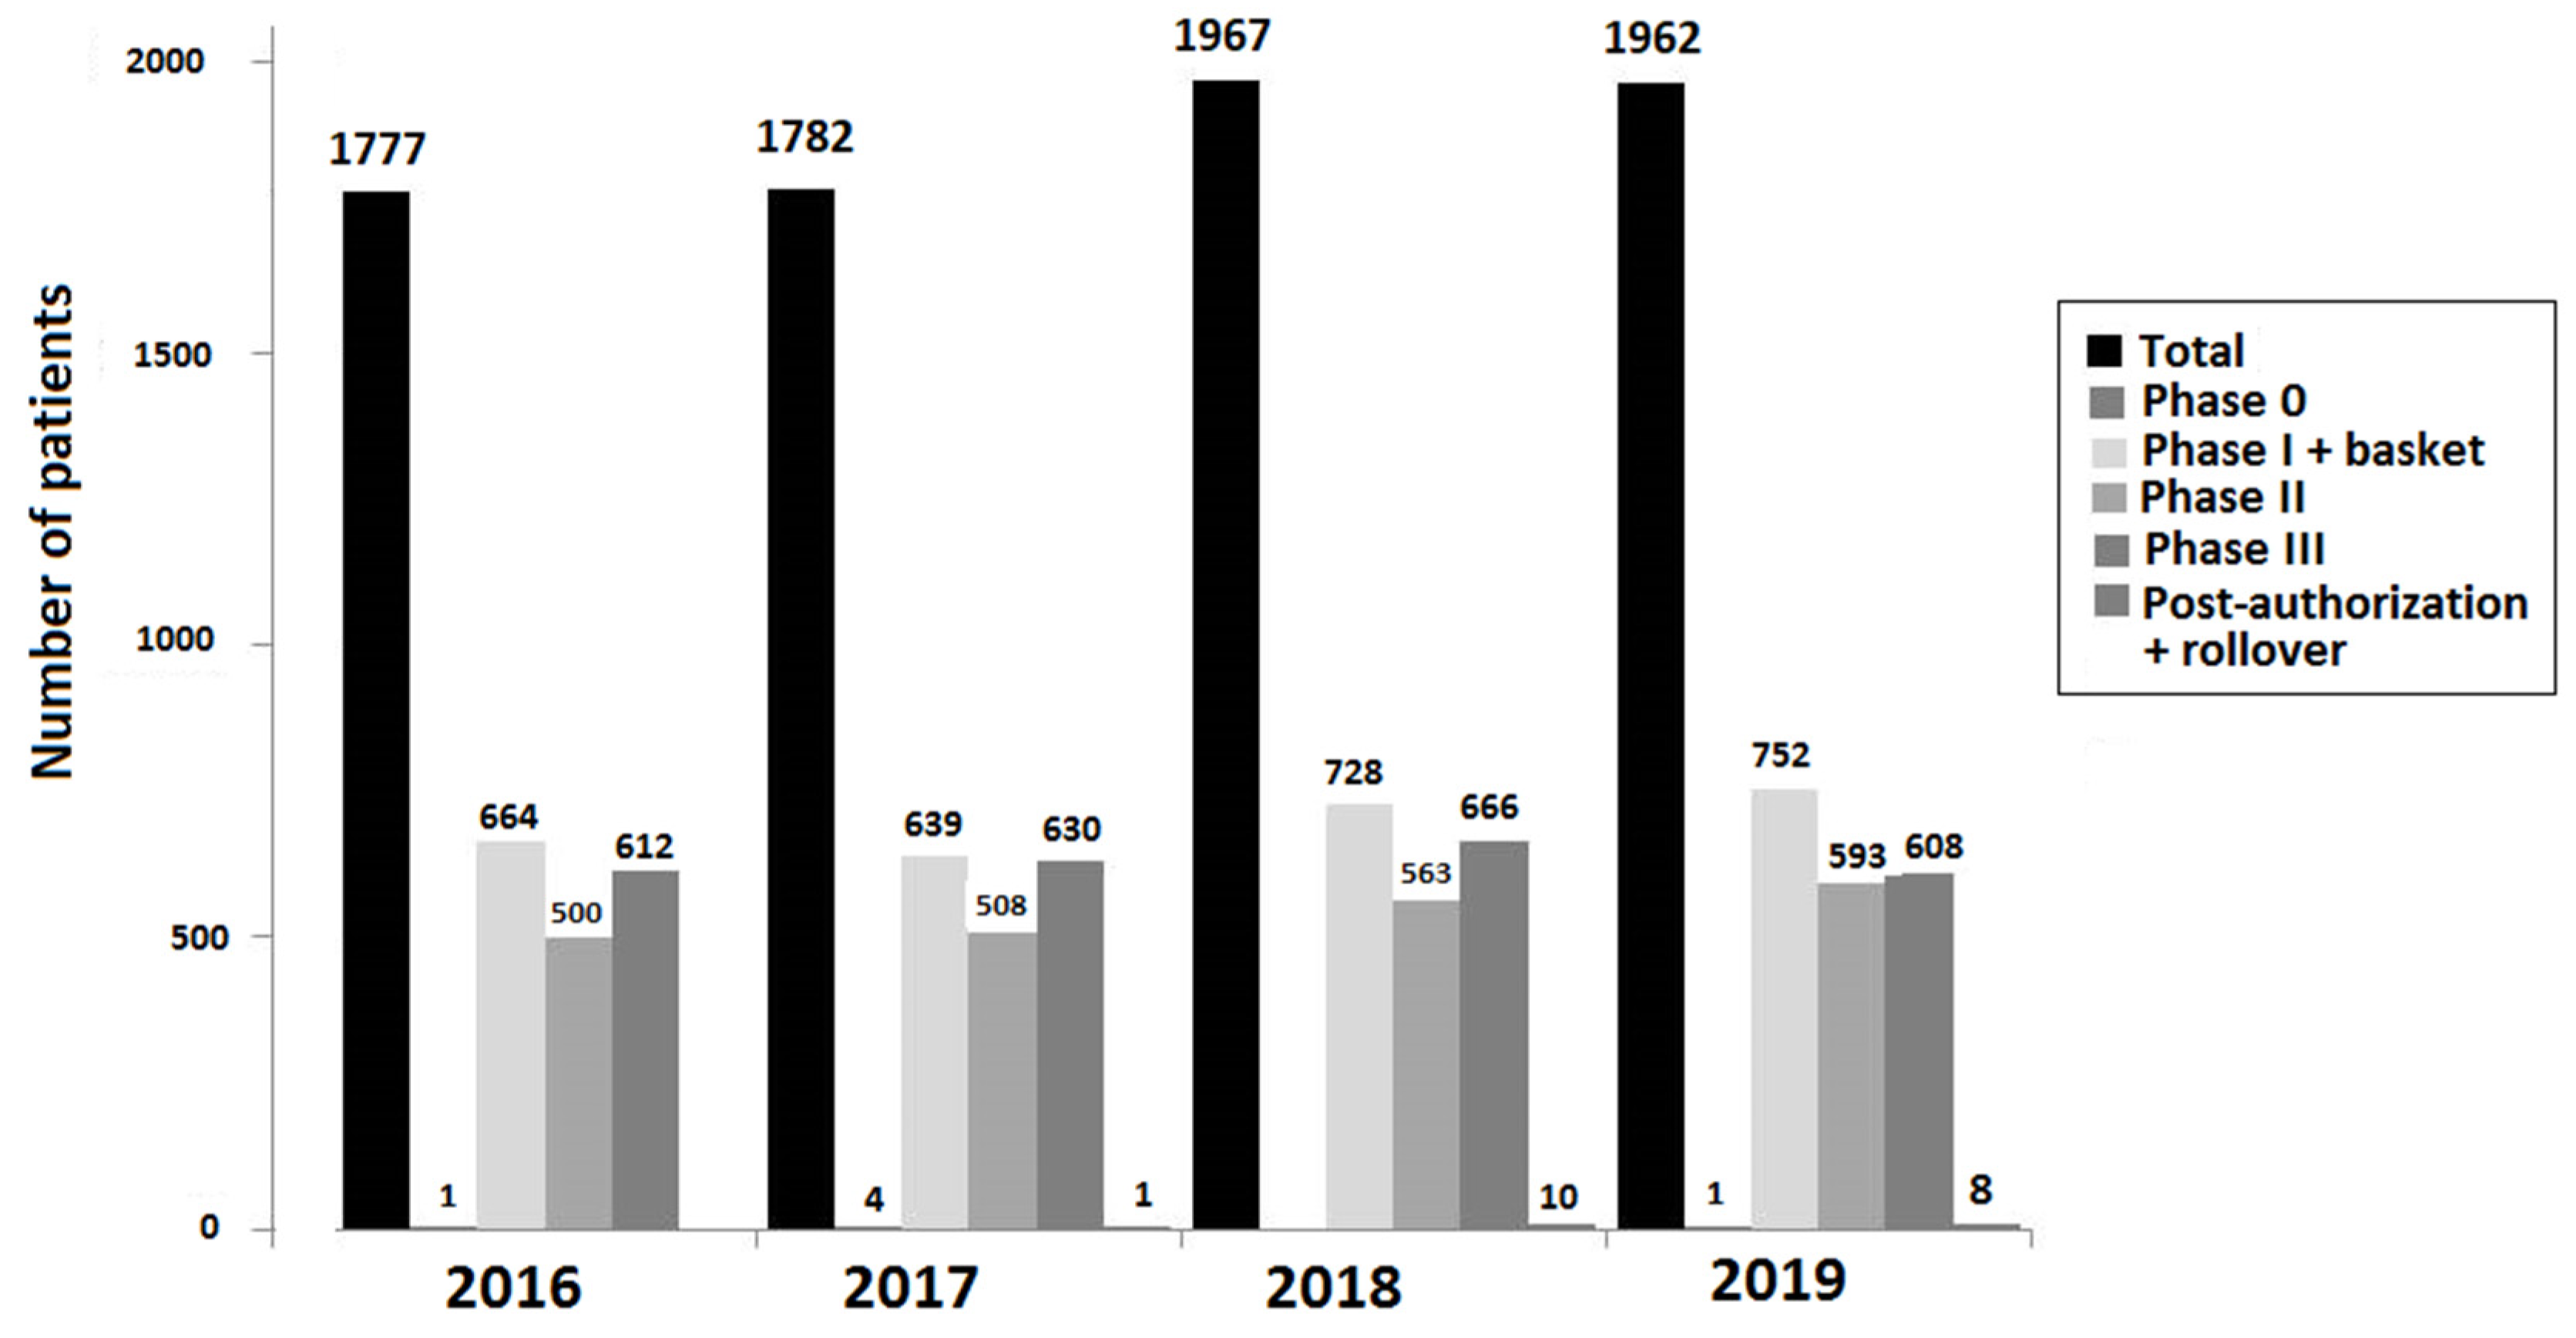
3.1. Clinical Trials and Patient Population

A total of 2930 clinical trials with active recruitment were conducted at the Medical Oncology Department between 2010 and 2019 for solid tumor treatment. There were 140 in 2010 and 459 in 2019, an increase of 228%. As shown in Table 1, clinical trials of high complexity phase I and basket trials accounted for 34.3% of all the trials. Also, clinical trials focused on a specific tumor type accounted for the largest percentage (76.5%), but trials not involving a specific tumor type increased markedly from 36 in 2010 to 103 in 2019, an increase of 186%.
Between 2010 and 2019, specific antineoplastic treatment was delivered in the clinical trial setting to 10,488 patients, 4964 (47.3%) of whom were treated with intravenously administered drugs, and 5524 (52.7%) with oral drugs. The number of patients on active treatment in the different phases of the clinical trials between 2016 and 2019 is shown in Figure 1.

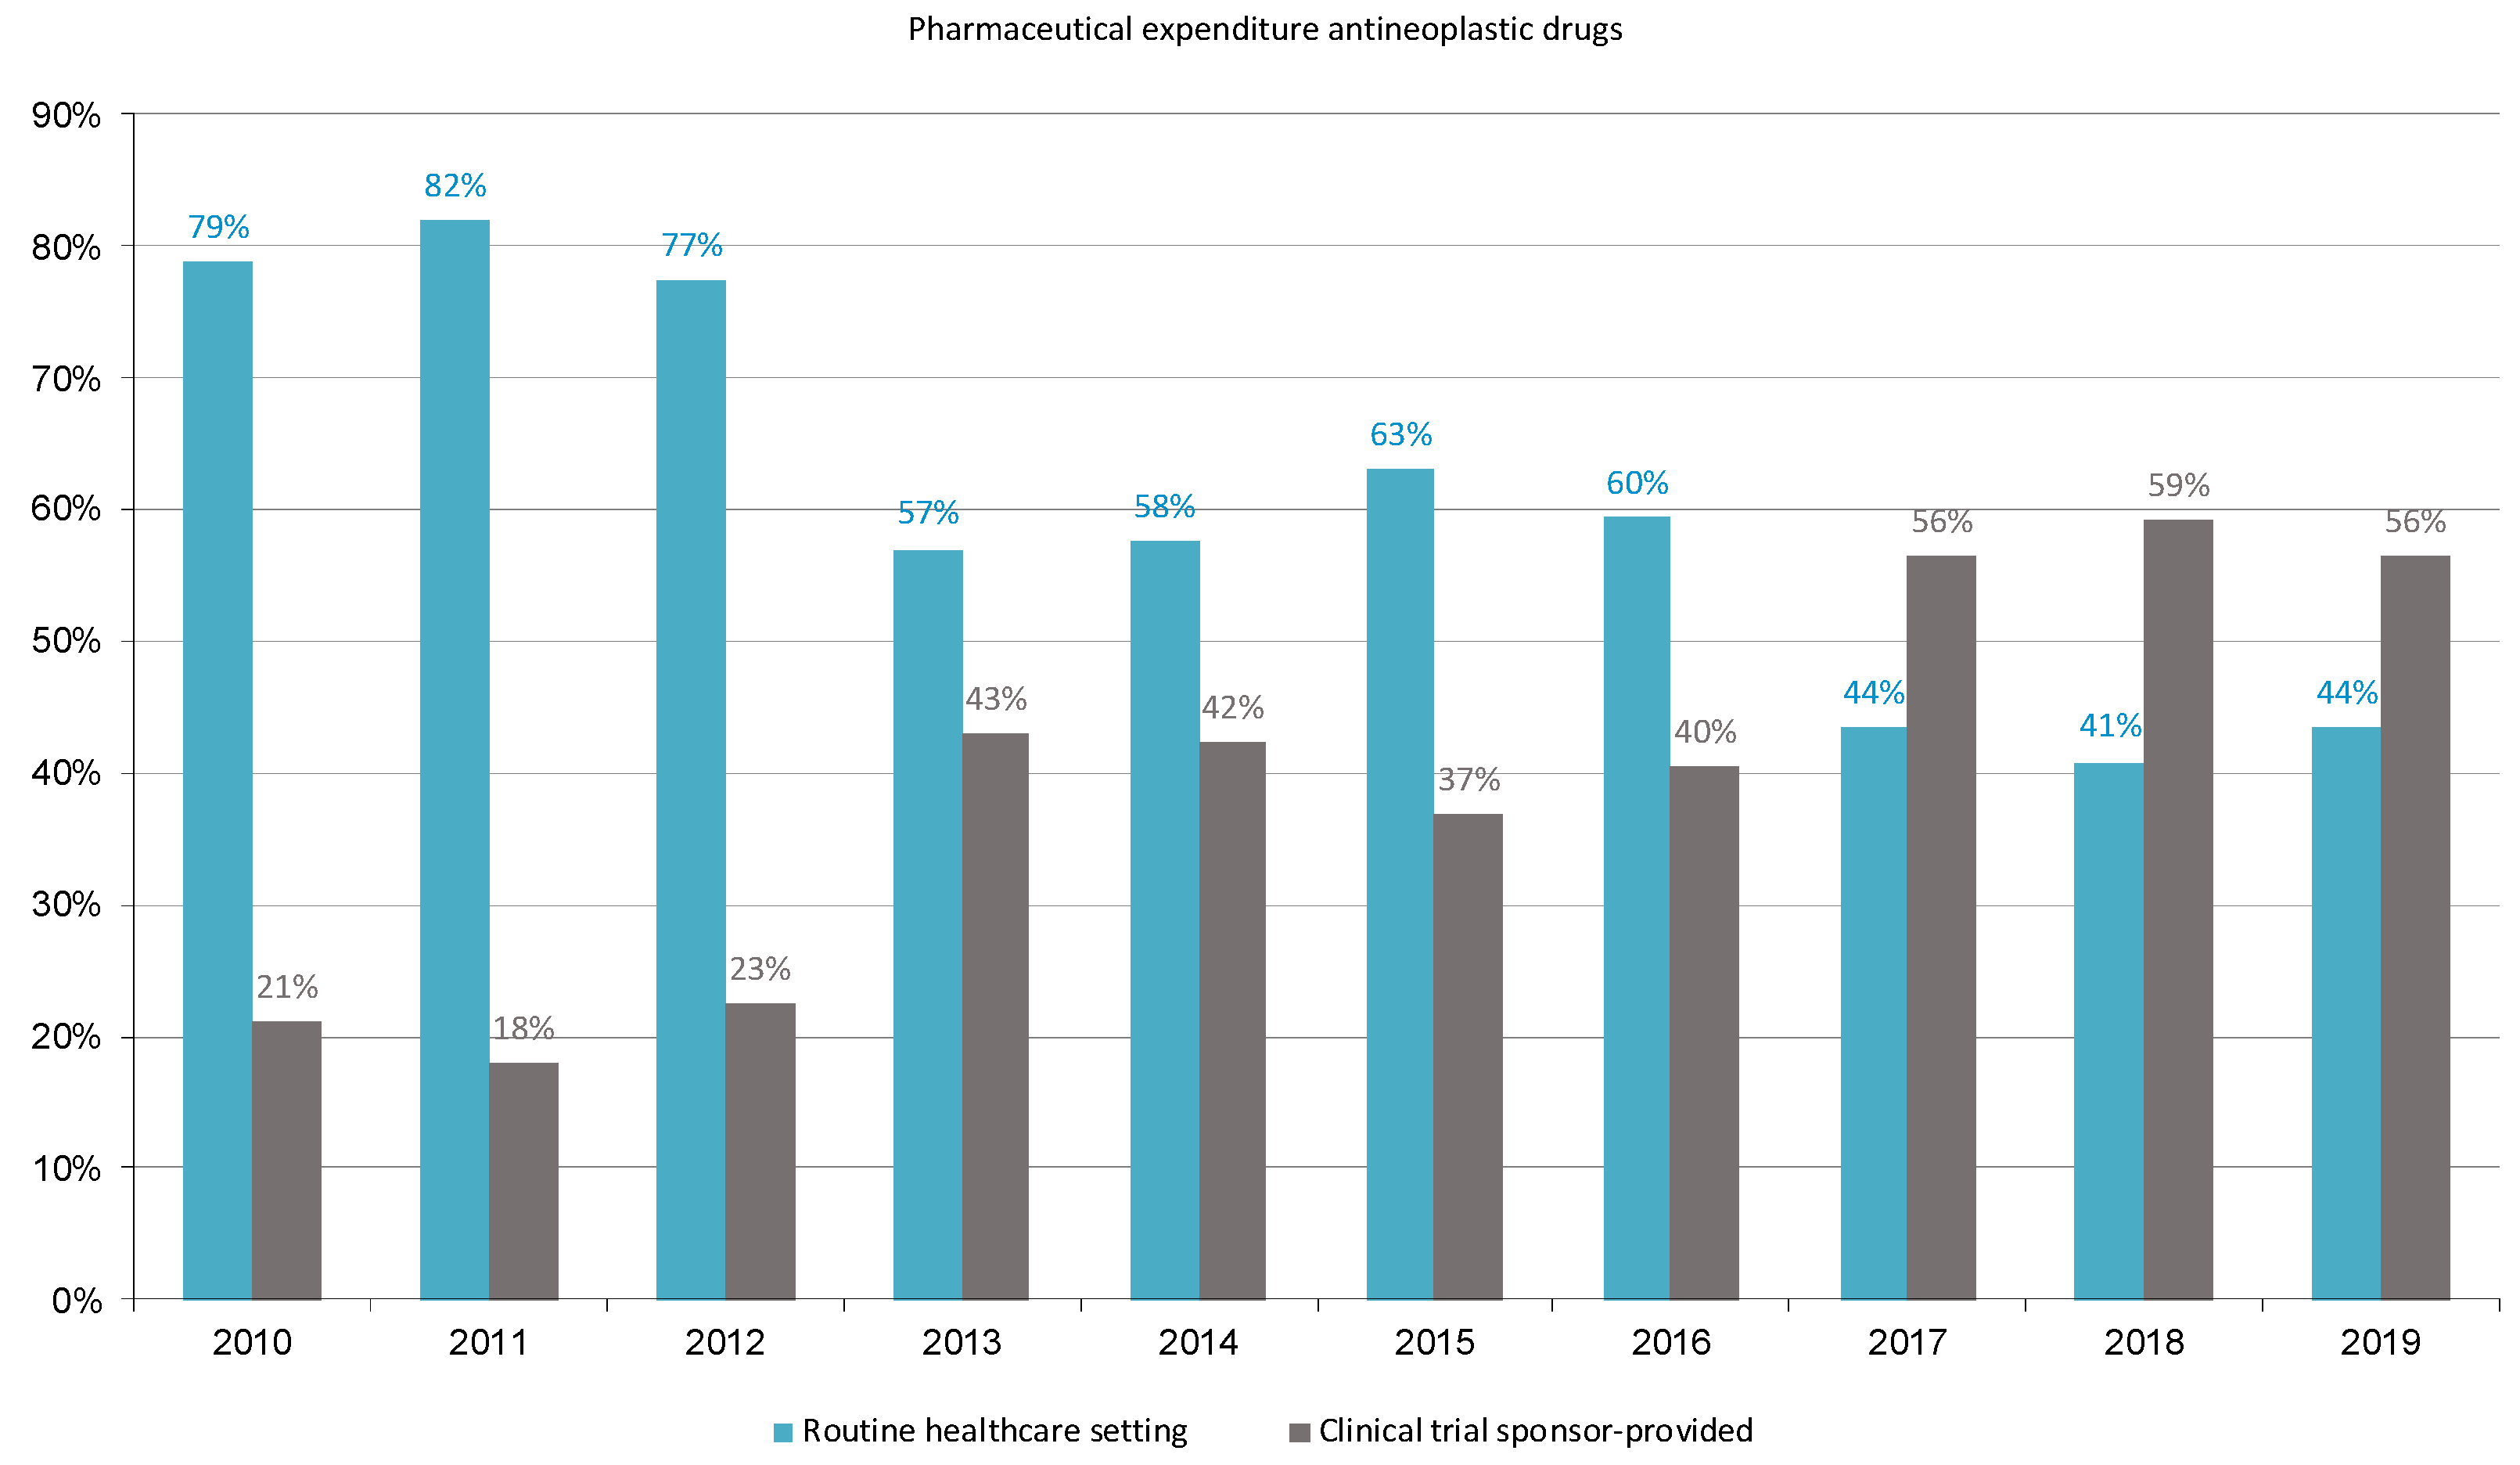
3.2. Pharmaceutical Expenditure on Cancer Treatment in Clinical Trials (Financial Contribution from the Sponsor)

The overall pharmaceutical expenditure during the study period (2010–2019) based on the contribution of the sponsor was EUR 107,306,084, divided into EUR 72,266,379 for treatment with intravenous antineoplastic drugs, and EUR 35,039,705 for oral drugs (Table 2).

3.3. Expenditure by Pharmacological Classes

Expenditures by pharmacological classes and types of antineoplastic drugs were available for the period between 2013 and 2019. The overall use of intravenous and oral antineoplastic drugs accounted for 94% of the expenditures (EUR 100,944,351). As shown in Table 3, targeted therapy was associated with the largest expenditure (58%), followed by immunotherapy (35.3%), and cytotoxic drugs (6.7%). There was a marked increase in expenditures from a total of EUR 5,177,221 in 2013 to EUR 27,572,327 in 2019. However, annual increases varied from 5.1% (2014 to 2015) to 92.1% (2016–2017) and 6% (2018–2019).
The data on pharmaceutical expenditure by pharmacological classes for the complete 10-year study period were available for intravenous antineoplastic agents (Table 4). There was a large variation in the pattern of clinical research over the study period: in 2010, targeted therapy accounted for 79.4% of expenditure and cytotoxic drugs for 20.6%; in 2019, immunotherapy accounted for 68.4%, targeted therapy for 24.4%, and cytotoxic drugs for only 7.1%. Also, the percentages of patients treated with these pharmacological classes in 2010 and 2019 showed important changes, from 75.2% to 33.8% for cytotoxics, 0.8% to 67.2% for immunotherapy, and 54.2% to 28% for targeted therapy.

3.4. Expenditure by Antineoplastic Agent

The antineoplastic agents used for treating patients included in clinical trials between 2010 and 2019 are shown in Table S1 of the Supplementary Materials. A total of four hundred twenty-one different antineoplastic agents were used, the variability of which increased from forty-seven agents in 2010, with only seven of them accounting for 92.8% of the overall pharmaceutical expenditure) to three hundred seventeen different antineoplastic agents in 2019, with thirty-three of them accounting for 90.6% of the overall expenditure (Table 5).

3.5. Expenditure by Tumor Location

In 2010, patients with 17 tumor locations received intravenous antineoplastic drugs, with five tumor sites (breast, colon, ovary, non-small cell lung cancer, and prostate) accounting for 90% of all cancer cost treatment, but this number increased to 30 tumor locations, with fifteen tumor sites, in particular non-small cell lung cancer, advanced solid tumors, breast, colon, and ovary accounting for 90% of expenditure in 2019 (Table 6). Also, the highest percentages of patients treated in 2019 corresponded to advanced solid tumors (20.2%) and non-small cell lung cancer (17.5%).
The pharmaceutical expenditures by tumor location for each study year in patients enrolled in clinical trials treated with intravenous antineoplastic agents are shown in Table S2 of the Supplementary Material.

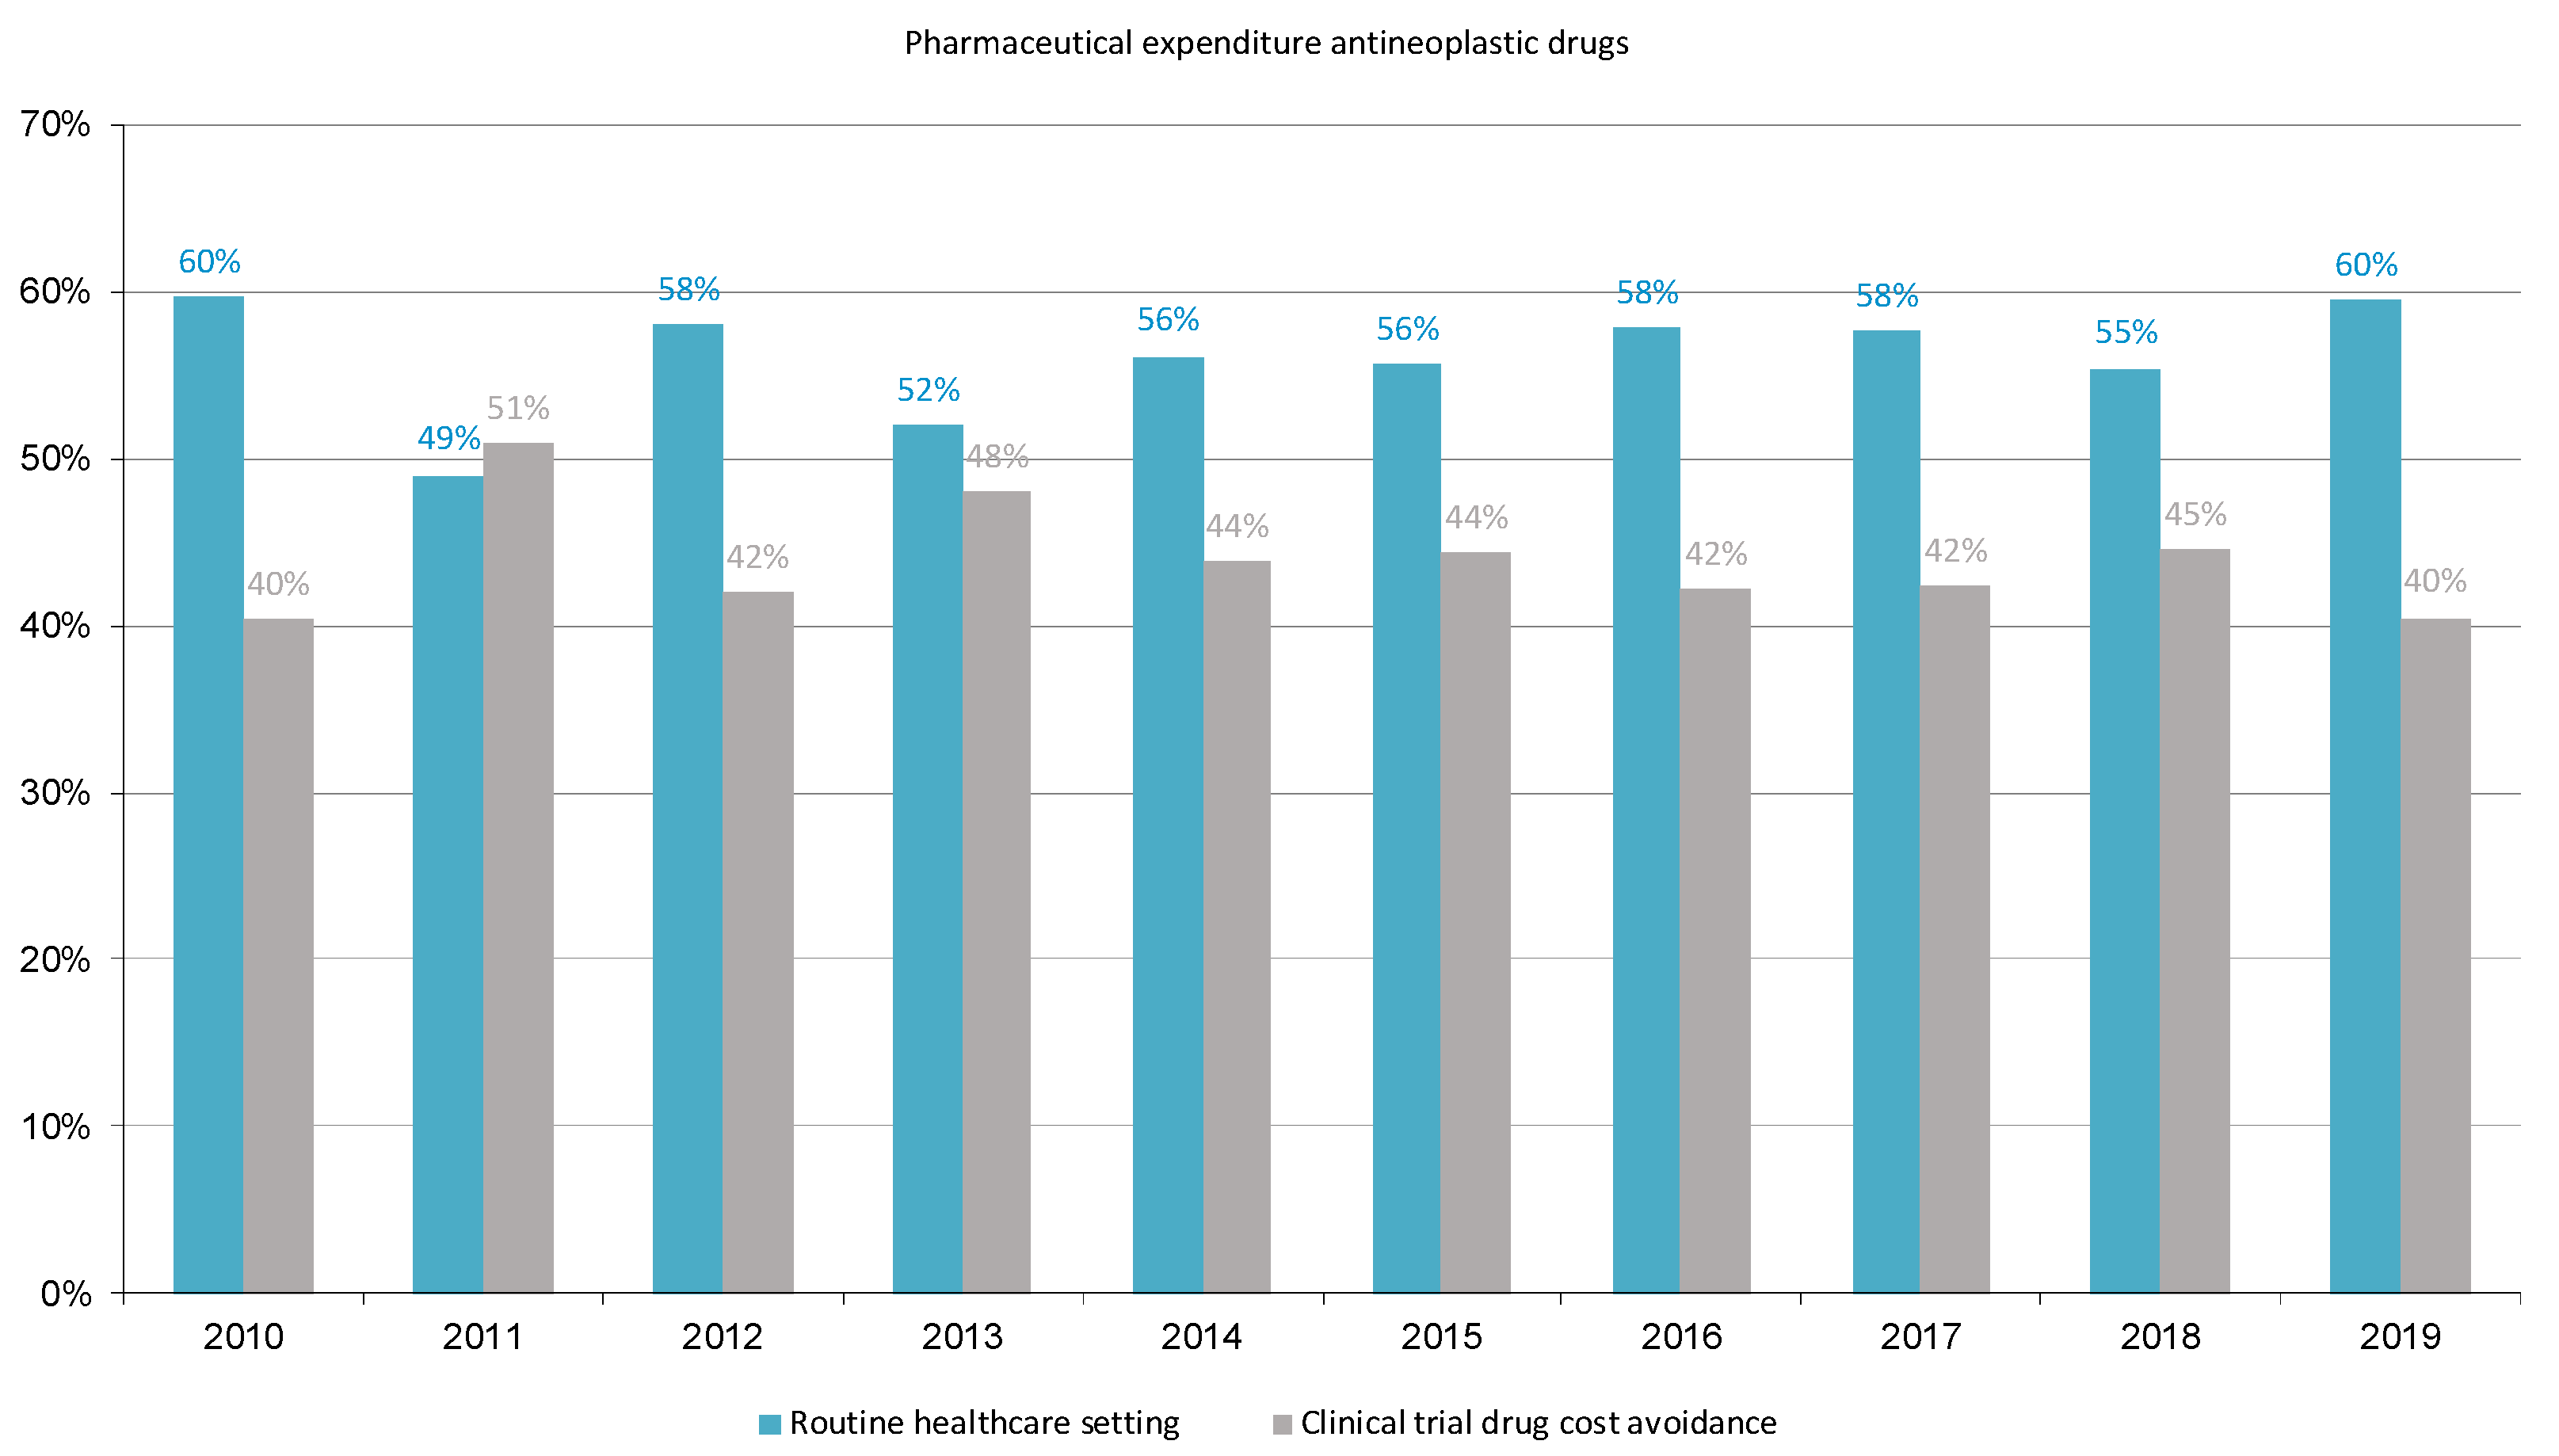
3.6. Estimation of Potential Drug Cost Avoidance

The estimated potential drug cost of antineoplastic treatments avoided for patients included in clinical trials during the study period is shown in Table 7. The total pharmaceutical expenditure avoided was EUR 92,662,609, divided into EUR 34,463,891 for the use of antineoplastic agents administered intravenously, and EUR 58,198,718 for those given by the oral route.
The mean cost obtained per patient in the healthcare setting outside of clinical trials (in each year and each tumor location) is presented in Table S3 of the Supplementary Material. Applying this mean cost per patient to each patient included in a clinical trial allowed us to obtain a distribution of potential DCA by tumor location and study years, shown in Table S4 of the Supplementary Material (for intravenous drugs only). Breast cancer, rectal cancer, non-small cell lung cancer, and melanoma were the tumor locations in the upper rank of DCA.
To put into context what the savings in clinical trials have represented for our institution, previously reported data on pharmaceutical expenditure on antineoplastic drugs for patients with solid tumors treated in the healthcare setting (outside clinical trials) at our center are presented (EUR 120,396,096) for the same study period 2010–2019 [20]. The total cost of antineoplastic drugs supplied by sponsors in the clinical trials setting was EUR 107,306,084, with a potential DCA of EUR 92,662,609 (Table 8).
Figure 2 shows the percentages of pharmaceutical expenditure on antineoplastic drugs for the treatment of patients with solid cancers during the study period in the two populations of patients treated in the routine healthcare setting (mean cost 66%, range 41% to 82%) and participants in clinical trials with sponsor financing (mean cost 44%, range 18% to 59%). On the other hand, the economic contribution of the sponsors accounted for 89% of the expenditure incurred by HUVH for treating cancer patients with antineoplastic drugs in the routine healthcare setting.
Figure 3 shows the percentages of pharmaceutical expenditure on antineoplastic drugs for solid cancers during the study period in the routine healthcare setting (mean cost 62%, range 49% to 60%) and the potentially avoided expenditure due to the performance of clinical trials (mean cost 48%, range 40% to 51%). Also, DCA accounted for 77% of the expenditure incurred by HUVH for treating cancer patients with antineoplastic drugs in the routine healthcare setting.

4. Discussion

The Vall d’Hebron Institute of Oncology (VHIO) is an oncology center of excellence and innovation, in which investigators and clinicians follow a translational research model working in multidisciplinary teams focused on advancing in the field of personalized and specific therapies against cancer. Scientific activity at the VHIO is based on three main programs, including preclinical research, translational research, and clinical research and transversal technologies. Each program incorporates high-level research teams dedicated to ensuring that research results can be implemented and translated into tangible benefits for patients (https://vhio.net). During the study period of 2010–2019, we identified a high number of clinical studies for the treatment of solid tumors with patients being recruited or actively participating in clinical trials. In 2019, there were 459 clinical trials with ongoing recruitment, 162 (35.3%) of which were phase I and basket trials. Also, in 2019, the total number of 1962 patients treated in clinical trials accounted for 41.4% of all cancer patients with solid tumors treated at the Medical Oncology Department, 38.4% participating in 162 phase I and basket trials. According to the Spanish Registry of Clinical Studies (REEC), in August 2020, 597 clinical cancer trials in adults with active recruitment were registered in this database, 188 (31.5%) of which were phase I trials [24]. These data show the leadership role of VHIO and HUVH in the overall and complex cancer clinical research landscape in Spain.
In the 2010–2019 study period, a total number of 10,488 patients were included in clinical trials, with treatments that resulted in drug contributions by sponsors for our center of EUR 107,306,084. The potential estimated DCA, according to our approximation, is EUR 92,662,609. In all the cases, the drug cost estimations were based on the same actual purchase price for the HUVH of the pharmaceutical specialties corresponding to the doses prescribed at the time of each prescription. The lower amount obtained from the calculation of the DCA is explained by the lower drug cost of antineoplastics used in routine healthcare conditions (used for the calculation of the DCA) as compared to innovative high-cost therapies in clinical trials (economic contribution of the sponsor). The distribution of expenses in each of the two populations clearly indicates greater use of innovative and high-cost therapies in the clinical trial population compared to the routine healthcare population; the expenses in targeted therapy plus immunotherapy were 93.31% compared to 81.37%, and in cytotoxic plus other drugs were 6.69% compared to 18.63%, respectively [20]. Also, the economic contribution of sponsors and DCA corresponded to 89% and 77%, respectively, of the total pharmaceutical expenditure of HUVH in antineoplastic agents for treating cancer patients with solid tumors in the routine healthcare setting over the 10-year study period.
Academic research has been considered a source of sustainability of public healthcare systems [25,26], with trial sponsors providing tangible benefits [27,28]. However, quantification of DCA in cancer patients treated in clinical trials has not been consistently documented, particularly due to deficient infrastructure information systems of hospitals, and because trial drugs provided by sponsors are not systematically included in pharmacoeconomic analyses of cancer medications [29]. Previous studies addressing the cancer treatment costs of participants in cancer clinical trials have been carried out in the framework of healthcare systems in the USA, Canada, Germany, the UK, Italy, Taiwan, and Spain [10,11,12,13,14,15,16,17,18,30]. All of these studies have documented economic benefits for the medical center when patients participating in clinical trials receive drugs financed by external sources, although the results are difficult to compare due to differences in the design of the studies and methodological heterogeneity in the analysis of avoided costs, such as estimations of expenditures of commercialized or non-commercialized investigational drugs only, the regimen of the control arm, the standard of care treatment, and cost allocation of drugs with prices from different sources, etc.). Our study has made two estimates: that of the cost to the HUVH of the drugs provided by the promoter (which would coincide with the strategy of Calvin-Lamas et al. [17]) and would be interpreted as an avoided cost for the hospital if the center financed the studies carried out, and the cost avoided in the treatment of patients included in a clinical trial (DCA) if these patients were treated like routine healthcare patients. This strategy represents a more realistic approach to care practice than the consideration of theoretical costs of the standard alternative or the control arms of the trials [10,11,13,14,17,18]. Our study has other distinctive features compared with previous publications, including the 10-year study period, the large number of patients, the inclusion of different phases of the trials, and the analysis by pharmacological classes, route of administration, tumor location, and individual antineoplastic agents.
The pattern of clinical research by pharmacological classes showed an important variation over the 10-year study period, with the proportion of cytotoxic drugs decreasing from 20.6% in 2010 to 7.1% in 2019 and targeted therapy from 79.4% to 24.4%, whereas immunotherapy accounted for 68.4% in 2019. In the study by Shen et al. [12] conducted in 2008 at the most prominent medical center in Taiwan, targeted therapy accounted for 84.1% of the total cost avoidance of anti-cancer trials, with lapatinib as the most prominent drug. In the analysis of phase III trials between 1999 and 2011 by Tang et al. [15], targeted therapy constituted 43% of total DCA.
In patients treated with intravenous antineoplastic drugs, a total of 40 tumor locations were treated with 421 different antineoplastic drugs, which indicates the high representatively of the clinical trial setting in our clinical practice. A total of 15 cancer sites accounted for 90% of the economic contribution of sponsors, particularly non-small cell lung cancer, advanced solid tumors, and breast, colon, and ovarian cancer.
In fact, most of the previous studies on clinical trials analyzed a single tumor site, such as lung cancer and mesothelioma [14], prostate [17], breast [18], or cancer in general, without specification of the organ affected. Bredin et al. [30] evaluated 37 clinical trials grouped into five tumor groups (lung, gynecology, neurology, hematology, and genitourinary) and showed a large range of cost avoidance per patient due to a combination of factors, including the duration patients remain on the study (which varies widely among the tumor groups), the number of days in each cycle a drug is administrated, and the price of the drugs. Of the 17 clinical trials in the study by Tang et al. [15], most trials involved breast, lung, and ovarian tumors. In our study, in 2019, clinical trials with intravenous and oral antineoplastic agents were analyzed, with the inclusion of a total of 1122 different patients, which accounted for 25.8% of gastrointestinal tumors, 23.3% of lung cancer, 13% of breast tumors, 11.8% of gynecologic tumors, and 9.5% of genitourinary tumors. The antineoplastic agents representing 50% of the financial contribution of sponsors were pembrolizumab (13%), nivolumab (9%), cabozantinib (8.7%), atezolizumab (7.2%), bevacizumab (6.2%), and palbociclib (5.3%).
The fact that we have not considered the contribution, or costs avoided, of the supportive therapy is a limitation in the study. According to Bredin et al. [30], antiemetics and colony-stimulating growth factors account for 2.9% of costs regarding conventional cytotoxics, and anti-diarrheal and antihistamines for 0.28% regarding targeted therapy. In our previous study [20], supportive therapy (antiemetics, erythropoietins, colony-stimulating growth factors, and hypocalcemia medications) accounted for 4.6% of the total pharmaceutical expenditure for the treatment of solid tumors in patients treated in the routine healthcare setting, and although this percentage is low, it showed a decreasing trend along the years, with only 1.4% in 2019. Other aspects involved in the costs of the clinical trials, such as administrative or infrastructure variables, were not evaluated.
Regarding differences between commercial and non-commercial clinical trials, extrapolation of results from healthcare systems with different public or private financial structures is a complex issue. In an analysis of the financial sustainability of an oncology clinical trial unit from a Canadian medical center between 2007 and 2011, the authors describe the negative income of the trials promoted by cooperative groups due to not-funded or underfunded follow-up costs, so the unit accrued more patients in new clinical trials or existing industry-funded trials to offset that deficit, but as the number of patients on follow-up increased, the fiscal deficit grows larger each year, perpetuating the cycle [31]. Although patients included in clinical trials receive more frequent clinical visits, which translate into a higher number of tests and procedures, those receiving the routine healthcare standard of care (SOC) also receive costly therapies [8], and the differences disappear due to the free provision of antineoplastic drugs in clinical trials by the sponsors, which accounts for the largest difference in pharmaceutical expenditure between the two populations [9]. In a retrospective cost analysis of 68 adult cancer patients treated in 20 different clinical trials in a single Spanish institution, it was detected that although the load of procedures was 32% higher, the costs for the pharmacological treatment system were 79% lower in the cohort of clinical trial patients, and it was concluded that in the entirety of the clinical trial units, the most favorable scenario is a balanced portfolio of both commercial and non-commercial trials [19].
As a relevant limitation of our study, we do not assess the general costs of the administrative infrastructure for the execution of clinical trials, nor of the costs of all medical procedures (e.g., medical visits, management of adverse effects, lack of efficacy of treatments carried out, etc.). Also, other factors contributing to further analysis of the meaningfulness of cost savings from enrollment in clinical trials having access to free medications, such as patients’ demographic characteristics or their socio-economic status, were not evaluated. These objectives were not in the scope of our work, which does not aim to evaluate the sustainability of the clinical trials unit (financed mostly by the private resources generated by the trials themselves) but aims to contribute knowledge to the expenditure contributed in drugs by the promoters and to the expenditure potentially avoided in the specific subject of pharmacological treatment from the perspective of reimbursement by the national health system. The study of the economic burden represented by clinical trials has been carried out from the payer’s perspective, that is, the national public health administration because, in our country, all citizens regardless of their social, demographic, or economic status have universal free access to all funded oncological treatments through the Spanish national healthcare system. Overall, clinical trials provide not only the best context for the progress of clinical research and healthcare but also create opportunities for reducing public cancer-care costs [32].
In summary, the added value of the present analysis is based on its relevant differences compared with previous studies [4,5,6,7,8,9,10,11,12,13,14,15,16,17,18,19,30], that is, the assessment of all consecutive cancer patients enrolled in sponsored clinical trials, considering all tumor locations, and treated at the Medical Oncology Department of the largest hospital in Spain in which the largest number of oncological clinical trials are performed in the country. The analysis of 2930 clinical trials with the enrollment of 10,488 patients with solid tumors located at 30 sites showed an impressive DCA of EUR 92,662,609. The detail of the data presented may be of interest for comparative purposes in studies by other authors.

5. Conclusions

The pattern of research through oncological clinical trials at the HUVH has allowed early access to innovation and a contribution to knowledge that reverts to clinical care practice. At the same time, it implies a lightening of the economic burden on the healthcare system by the impact of the free supply of investigational drugs and the potential avoided pharmaceutical expenditure from the perspective of reimbursement by the national health system, according to an approximation of the cost of treating patients in the trial setting with the actual clinical practice of the routine healthcare population.

Supplementary Materials

The following supporting information can be downloaded at: https://www.mdpi.com/article/10.3390/cancers16081529/s1, Table S1: Pharmaceutical expenditure (EUR) by antineoplastic agent and study year (2010–2019) in patients treated in clinical trials. Table S2: Pharmaceutical expenditure (EUR) by tumor location and study year (2010–2019) in patients treated with intravenous antineoplastic agents in clinical trials. Table S3: Mean annual cost of antineoplastic treatment per patient (EUR) per tumor location and study year (2010–2019), in patients treated in the healthcare setting. Table S4: Potential drug cost (EUR) avoided, by tumor location and study year (2010–2019), in patients treated with intravenous antineoplastic agents in clinical trials.

Author Contributions

Conceptualization, methodology, validation, investigation, visualization, writing—original draft preparation, M.-J.C.; software, validation, formal analysis and data curation, E.T.-G. and J.M.; methodology and investigation, B.R.-M., C.V., A.F., L.M., J.V., M.A., I.D.l.P., I.J.-L., M.-E.P.-L., N.S., E.F., E.G. and M.G.; all these authors contribute equally; methodology, investigation, and resources, M.-Q.G.; conceptualization, methodology, validation, investigation, supervision, writing—review and editing, J.T. The authors declined the use of artificial intelligence, language models, machine learning, or similar technologies to create content or assist with writing or editing of the manuscript. All authors have read and agreed to the published version of the manuscript.

Funding

This research received no external funding.

Institutional Review Board Statement

Approval by the Institutional Review Board was waived due to the quality of care nature of the study.

Informed Consent Statement

Not applicable.

Data Availability Statement

Study data are available from the corresponding author upon reasonable request.

Acknowledgments

The authors thank Dr. Marta Pulido for editing the manuscript and her editorial assistance and Belen Macià (Mcia-itConsulting) for her collaboration in VHIO clinical trial data management.

Conflicts of Interest

M.-J.C. served as an invited speaker, participated in advisory boards, or received travel grants from Boehringer Ingelheim, Ipsen Pharma, Lilly, and Roche. E.F. served as an invited speaker for Amgen, Astra Zeneca, Bristol Myers Squibb, Daiichi Sankyo, Eli Lilly, F.Hoffmann-La Roche, Genentech, Janssen, Medical Trends, Medscape, Merck Serono, Merck Sharp&Dohme, Peervoice, Pfizer, Sanofi, Takeda, and Touch Oncology, as a consultant (advisory board) for Abbvie, Amgen, Astra Zeneca, Bayer, Beigene, Boehringer Ingelheim, Bristol Myers Squibb, Eli Lilly, F.Hoffmann-La Roche, Gilead, Glaxo Smith Kline, Janssen, Merck Serono, Merck Sharp&Dohme, Novartis, Peptomyc, Pfizer, Regeneron, Sanofi, Takeda, Turning Point, and Daiichi Sankyo, received support for attending meetings and/or travel from Astra Zeneca, Janssen, Roche, and served as an independent member of the board for Grifols. M.G. served as an invited speaker or received travel grants from Astra Zeneca, Pfizer, Novartis, and Grifols. E.G. served on research projects for Novartis, Roche, Thermo Fisher, AstraZeneca, Taiho, BeiGene, and Janssen, as a consultant/advisor for Roche, Ellipses Pharma, Boehringer Ingelheim, Janssen Global Services, Seattle Genetics, Thermo Fisher, MabDiscovery, Anaveon, F-Star Therapeutics, Hengrui, Sanofi, Incyte, and Medscape, as a member of the speakers bureau for MSD, Roche, Thermo Fisher, Lilly, Novartis, SeaGen, as an employee of NEXT Oncology, received stock for 1TRIALSP, served as an expert in clinical trials (Institutional) for Adaptimmune LLC., Affimed Gmbh, Amgen SA, Anaveon AG, AstraZeneca AB, Bicycletx Ltd., BioInvent International AB, Biontech SE, Biontech Small Molecules Gmbh, Boehringer Ingelhem International Gmbh, Catalym Gmbh, Cyclacel Biopharmaceuticals, Cytovation AS, Cytomx, F.Hoffmann La Roche Ltd., F-Star Beta Limited, Genentech Inc., Genmab B.V., Hifibio Therapeutics, Hutchison Medipharma Limited, Icon, Imcheck Therapeutics, Immunocore Ltd., Incyte Corporation, Incyte Europe Sàrl, Janssen-Cilag International NV, Janssen-Cilag SA, Laboratorios Servier SL, Medimmune LLC., Merck & Co, Inc., Merck Kgga, Novartis Farmacéutica, S.A, Peptomyc, Pfizer Slu, Relay Therapeutics, Replimmune, Ribon Therapeutics, Ryvu Therapeutics SA, Seattle Genetics Inc., Sotio as, Sqz Biotechnologies, Symphogen A/S, Taiho Pharma Usa Inc., and T-Knife GmbH. J.T. reports personal financial interest in the form of scientific consultancy roles for Alentis Therapeutics, AstraZeneca, Boehringer Ingelheim, Cardiff Oncology, CARSgen Therapeutics, Chugai, Daiichi Sankyo, F. Hoffmann-La Roche Ltd., Genentech Inc., hC Bioscience, Ikena Oncology, Immodulon Therapeutics, Inspirna Inc, Lilly, Menarini, Merck Serono, Merus, MSD, Mirati, Neophore, Novartis, Ona Therapeutics, Orion Biotechnology, Peptomyc, Pfizer, Pierre Fabre, Samsung Bioepis, Sanofi, Scandion Oncology, Scorpion Therapeutics, Seattle Genetics, Servier, Sotio Biotech, Taiho, Takeda Oncology, and Tolremo Therapeutics, received stock from Oniria Therapeutics, Alentis Therapeutics, Pangaea Oncology, and 1TRIALSP, and also engaged in educational collaborations with Medscape Education, PeerView Institute for Medical Education, and Physicians Education Resource (PER). C.V. participated in an advisory board for Bayer Hispania SL. The remaining authors declare no conflicts of interest.

References

  1. Workman, P.; Draetta, G.F.; Schellens, J.H.M.; Bernards, R. How much longer will we put up with $100,000 cancer drugs? Cell 2017, 168, 579–583. [Google Scholar] [CrossRef] [PubMed]
  2. Negrouk, A.; Lacombe, D.; Cardoso, F.; Morin, F.; Carrasco, E.; Maurel, J.; Maibach, R.; Aranda, E.; Marais, R.; Stahel, R.A. Safeguarding the future of independent, academic clinical cancer research in Europe for the benefit of patients. ESMO Open 2017, 2, e000187. [Google Scholar] [CrossRef] [PubMed]
  3. European Medicines Agency, 1 September 2022, EudraCT Public Web Report for August 2022. Available online: https://eudract.ema.europa.eu/docs/statistics/EudraCT_Statistics_2022/EudraCT_Public_Web_Report_for_August_2022.pdf (accessed on 13 November 2023).
  4. Wagner, J.L.; Alberts, S.R.; Sloan, J.A.; Cha, S.; Killian, J.; O‘Connell, M.J.; Van Grevenhof, P.; Lindman, J.; Chute, C.G. Incremental costs of enrolling cancer patients in clinical trials: A population-based study. J. Natl. Cancer Inst. 1999, 91, 847–853. [Google Scholar] [CrossRef] [PubMed]
  5. Fireman, B.H.; Fehrenbacher, L.; Gruskin, E.P.; Ray, G.T. Cost of care for patients in cancer clinical trials. J. Natl. Cancer Inst. 2000, 92, 136–142. [Google Scholar] [CrossRef] [PubMed]
  6. Bennett, C.L.; Stinson, T.J.; Vogel, V.; Robertson, L.; Leedy, D.; O‘Brien, P.; Hobbs, J.; Sutton, T.; Ruckdeschel, J.C.; Chirikos, T.N.; et al. Evaluating the financial impact of clinical trials in oncology: Results from a pilot study from the Association of American Cancer Institutes/Northwestern University clinical trials costs and charges project. J. Clin. Oncol. 2000, 18, 2805–2810. [Google Scholar] [CrossRef] [PubMed]
  7. Goldman, D.P.; Berry, S.H.; McCabe, M.S.; Kilgore, M.L.; Potosky, A.L.; Schoenbaum, M.L.; Schonlau, M.; Weeks, J.C.; Kaplan, R.; Escarce, J.J. Incremental treatment costs in national cancer institute-sponsored clinical trials. JAMA 2003, 289, 2970–2977. [Google Scholar] [CrossRef] [PubMed]
  8. Jones, B.; Syme, R.; Eliasziw, M.; Eigl, B.J. Incremental costs of prostate cancer trials: Are clinical trials really a burden on a public payer system? Can. Urol. Assoc. J. 2013, 7, E231–E236. [Google Scholar] [CrossRef] [PubMed]
  9. Jones, B.; Eliasziw, M.; Eigl, B.J.; Syme, R. A comparison of incremental costs of breast cancer clinical trials to standard of care. J. Clin. Trials 2015, 5, 216. [Google Scholar] [CrossRef]
  10. McDonagh, M.S.; Miller, S.A.; Naden, E. Costs and savings of investigational drug services. Am. J. Health Syst. Pharm. 2000, 57, 40–43. [Google Scholar] [CrossRef]
  11. LaFleur, J.; Tyler, L.S.; Sharma, R.R. Economic benefits of investigational drug services at an academic institution. Am. J. Health Syst. Pharm. 2004, 61, 27–32. [Google Scholar] [CrossRef]
  12. Shen, L.J.; Chou, H.; Huang, C.F.; Chou, G.M.; Chan, W.K.; Wu, F.L. Economic benefits of sponsored clinical trials on pharmaceutical expenditures at a medical center in Taiwan. Contemp. Clin. Trials 2011, 32, 485–491. [Google Scholar] [CrossRef]
  13. Uecke, O.; Reszka, R.; Linke, J.; Steul, M.; Posselt, T. Clinical trials: Considerations for researchers and hospital administrators. Health Care Manag. Rev. 2008, 33, 103–112. [Google Scholar] [CrossRef]
  14. Grossi, F.; Genova, C.; Gaitan, N.D.; Dal Bello, M.G.; Rijavec, E.; Barletta, G.; Sini, C.; Donato, C.; Beltramini, S.; Pronzato, P.; et al. Free drugs in clinical trials and their potential cost saving impact on the National Health Service: A retrospective cost analysis in Italy. Lung Cancer 2013, 81, 236–240. [Google Scholar] [CrossRef] [PubMed]
  15. Tang, P.A.; Hay, A.E.; O‘Callaghan, C.J.; Mittmann, N.; Chambers, C.R.; Pater, J.L.; Leighl, N.B. Estimation of drug cost avoidance and pathology cost avoidance through participation in NCIC Clinical Trials Group phase III clinical trials in Canada. Curr. Oncol. 2016, 23 (Suppl. S1), S7–S13. [Google Scholar] [CrossRef]
  16. Liniker, E.; Harrison, M.; Weaver, J.M.; Agrawal, N.; Chhabra, A.; Kingshott, V.; Bailey, S.; Eisen, T.G.; Corrie, P.G. Treatment costs associated with interventional cancer clinical trials conducted at a single UK institution over 2 years (2009–2010). Br. J. Cancer 2013, 109, 2051–2057. [Google Scholar] [CrossRef]
  17. Calvin-Lamas, M.; Portela-Pereira, P.; Rabuñal-Alvarez, M.T.; Martinez-Breijo, S.; Martín-Herranz, M.I.; Gómez-Veiga, F. Drug cost avoidance in prostate cancer clinical trials. Actas Urol. Esp. 2015, 39, 553–557. [Google Scholar] [CrossRef] [PubMed]
  18. Mañes-Sevilla, M.; Romero-Jiménez, R.; Herranz-Alonso, A.; Sánchez-Fresneda, M.; Gonzalez-Haba, E.; Collado-Borrel, R.; Benedi-González, J.; Sanjurjo-Sáez, M. Drug cost avoidance in clinical trials of breast cancer. J. Oncol. Pharm. Pract. 2019, 25, 1099–1104. [Google Scholar] [CrossRef]
  19. Capdevila, F.; Vera, R.; Ochoa, P.; Galbete, A.; Sanchez-Iriso, E. Cancer clinical trials: Treatment costs associated with a Spanish National Health System Institution. Ther. Innov. Regul. Sci. 2019, 53, 641–647. [Google Scholar] [CrossRef] [PubMed]
  20. Carreras, M.J.; Tomás-Guillén, E.; Farriols, A.; Renedo-Miró, B.; Valdivia, C.; Vidal, J.; Saura, C.; Carles, J.; Felip, E.; Gorgas, M.Q.; et al. Use of drugs in clinical practice and the associated cost of cancer treatment in adult patients with solid tumors: A 10-year retrospective cohort study. Curr. Oncol. 2023, 30, 7984–8004. [Google Scholar] [CrossRef]
  21. Hospital Universitari Vall d’Hebron, 2018 Hospital Memory. Available online: https://www.vallhebron.com/sites/default/filesmemoria-hospital-vall-hebron-2018.pdf (accessed on 4 May 2023).
  22. Cancer Types, National Cancer Institute at the National Institutes of Health. Available online: https://www.cancer.gov/types (accessed on 8 May 2023).
  23. CIMA, Centro de Información Online de Medicamentos de la AEMPS, Online Drug Information Center of the AEMPS. Available online: https://cima.aemps.es/cima/publico/home.html (accessed on 8 May 2023).
  24. Registro Español de Estudios Clínicos (REEC). AEMPS. Available online: https://reec.aemps.es/reec/public/list.html (accessed on 8 May 2023).
  25. Llisterri Caro, J.L.; Martín, J.V. Research as a source of sustainability of the health system in primary care. Semergen 2013, 39, 1–2. [Google Scholar] [CrossRef]
  26. Gasperoni, L.; Cafaro, A.; Ferretti, E.; Di Iorio, V.; Nanni, O.; Masini, C. The role of clinical trials in the sustainability of the Italian national health service cancer drug expenditure. Eur. J. Hosp. Pharm. 2023, 30, 96–100. [Google Scholar] [CrossRef] [PubMed]
  27. Walter, E.; Eichhober, G.; Voit, M.; Baumgartner, C.; Celedin, A.; Holzhauser, C.; Mraz, B.; Ornauer, C.; Pleiner-Duxneuner, J.; Ponner, B.; et al. Economic impact of industry-sponsored clinical trials of pharmaceutical products in Austria. J. Med. Econ. 2020, 23, 566–574. [Google Scholar] [CrossRef]
  28. D‘Ambrosio, F.; De Feo, G.; Botti, G.; Capasso, A.; Pignata, S.; Maiolino, P.; Triassi, M.; Nardone, A.; Perrone, F.; Piezzo, M.; et al. Clinical trials and drug cost savings for Italian health service. BMC Health Serv. Res. 2020, 20, 1089. [Google Scholar] [CrossRef]
  29. Bentley, C.; Cressman, S.; van der Hoek, K.; Arts, K.; Dancey, J.; Peacock, S. Conducting clinical trials-costs, impacts, and the value of clinical trials networks: A scoping review. Clin. Trials 2019, 16, 183–193. [Google Scholar] [CrossRef] [PubMed]
  30. Bredin, C.; Eliasziw, M.; Syme, R. Drug cost avoidance resulting from cancer clinical trials. Contemp. Clin. Trials 2010, 31, 524–529. [Google Scholar] [CrossRef]
  31. Seow, H.Y.; Whelan, P.; Levine, M.N.; Cowan, K.; Lysakowski, B.; Kowaleski, B.; Snider, A.; Xu, R.Y.; Arnold, A. Funding oncology clinical trials: Are cooperative group trials sustainable? J. Clin. Oncol. 2012, 30, 1456–1461. [Google Scholar] [CrossRef]
  32. Carreras, M.J. Analysis of Pharmaceutical Expenditure in the Treatment of Solid Tumors at the Vall d‘Hebron University Hospital and Its Contribution to the Sustainability of the Healthcare System. Ph.D. Thesis, Universitat Autònoma de Barcelona, Barcelona, Spain, 2020. Available online: http://hdl.handle.net/10803/670441 (accessed on 3 January 2024).
Figure 1. Distribution of 7488 patients on active treatment by phases of trials (2016–2019).
Cancers 16 01529 g001
Figure 2. The proportion of pharmaceutical expenditure for antineoplastic drugs in the routine healthcare setting and in sponsor-supported clinical trials.
Cancers 16 01529 g002
Figure 3. The proportion of pharmaceutical expenditure for antineoplastic drugs in the routine healthcare setting and potentially avoided due to sponsored financial contribution.
Cancers 16 01529 g003
Table 1. Number of clinical trials conducted at the Medical Oncology Department with active recruitment of patients at any time during the study period.
Study YearClinical Trials
TotalPhase 0
n (%)
Phase I and Basket
n (%)
Phase II
n (%)
Phase III
n (%)
Post-Authorization and Rollovers
n (%)
2010140037 (26.4)54 (38,6)49 (35.0)0
2011161048 (29.8)57 (35.4)56 (34.8)0
2012219066 (30.1)85 (38.8)68 (31.0)0
2013232075 (32.3)96 (41.4)61 (26.3)0
2014251083 (33.1)99 (39,4)64 (25.5)5 (2.0)
20153030106 (35.0)94 (31.0)89 (29.4)14 (4.6)
20163700129 (34.9)117 (31.6)108 (29.2)16 (4.3)
20173740137 (36.6)107 (28.6)111 (29.7)19 (5.1)
20184210161 (38.2)131 (31.1)107 (25.4)22 (5.2)
20194591 (0.2)162 (35.3)141 (30.7)121 (26.4)34 (7.4)
2010–201929301 (0.03)1004 (34.3)981 (33.5)834 (28.5)110 (3.7)
Table 2. Pharmaceutical expenditure by type of antineoplastic drug in the period 2010–2019 in the clinical trial setting.
Study YearsExpenditures of Antineoplastic Drugs
IntravenousOral
2010EUR 2,457,850NR
2011EUR 1,700,250NR
2012EUR 2,203,633NR
2013EUR 3,331,912EUR 1,845,309
2014EUR 4,636,490EUR 2,022,064
2015EUR 4,120,596EUR 2,876,494
2016EUR 6,220,320EUR 3,545,183
2017EUR 12,675,915EUR 6,086,139
2018EUR 17,844,749EUR 8,166,853
2019EUR 17,074,664EUR 10,497,663
TotalEUR 72,266,379EUR 35,039,705
OverallEUR 107,306,084
NR: not registered.
Table 3. Pharmaceutical expenditure by pharmacological classes and study year (2013–2019) in the clinical trial setting.
Cytotoxic DrugsImmunotherapyTargeted
Therapy
Other
Drugs
Total
Antineoplastic drugs
IntravenousEUR 6,322,282EUR 35,623,961EUR 23,958,403 EUR 65,904,646
OralEUR 424,306 EUR 34,609,333EUR 6066EUR 35,039,705
TotalEUR 6,746,588EUR 35,623,961EUR 58,567,736 EUR 100,944,351
Study year
2013EUR 957,915EUR 590,250EUR 3,629,056 EUR 5,177,221
2014EUR 613,360EUR 1,517,637EUR 4,527,558 EUR 6,658,554
2015EUR 796,317EUR 222,342EUR 5,978,431 EUR 6,997,090
2016EUR 891,738EUR 2,536,316EUR 6,337,449 EUR 9,765,502
2017EUR 1,175,345EUR 6,900,964EUR 10,685,745 EUR 18,762,054
2018EUR 1,001,328EUR 12,169,256EUR 12,841,019 EUR 26,011,603
2019EUR 1,310,587EUR 11,687,195EUR 14,568,479EUR 6066EUR 27,572,327
Table 4. Pharmaceutical expenditure by type of intravenous antineoplastic drug in the period 2010–2019 in the clinical trial setting.
Study YearCytotoxic
Drugs
ImmunotherapyTargeted
Therapy
Total
Expenditure
Change vs.
Previous Year, %
2010EUR 506,138-EUR EUR 1,951,712EUR 2,457,850
2011EUR 599,725-EUR EUR 1,100,526EUR 1,700,250−30.8%
2012EUR 860,070-EUR EUR 1,343,563EUR 2,203,63329.6
2013EUR 863,237EUR 590,250EUR 1,848,425EUR 3,331,91251.2
2014EUR 568,777EUR 1,517,637EUR 2,550,076EUR 4,636,49039.1
2015EUR 787,984EUR 222,342EUR 3,110,270EUR 4,120,596−11.1
2016EUR 866,817EUR 2,536,316EUR 2,817,187EUR 6,220,32051.0
2017EUR 1,047,329EUR 6,900,964EUR 4,727,621EUR 12,675,915103.8
2018EUR 940,547EUR 12,169,256EUR 4,734,946EUR 17,844,74940.8
2019EUR 1,217,591EUR 11,687,195EUR 4,169,878EUR 17,074,664−4.3
Table 5. Antineoplastic agents used in patients treated in the clinical trial setting in 2010 and 2019.
20102019
Antineoplastic AgentExpenditure% of Total
Expenditure
Antineoplastic AgentExpenditure% of Total
Expenditure
TrastuzumabEUR 919,48437.4PembrolizumabEUR 3,590,128.1013.0
BevacizumabEUR 449,06318.3NivolumabEUR 2,489,205.429.0
Aflibercept/placeboEUR 301,60012.3CabozantinibEUR 2,392,934.108.7
DocetaxelEUR 191,2877.8AtezolizumabEUR 1,983,242.047.2
PemetrexedEUR 145,9195.9BevacizumabEUR 1,696,849.556.1
CetuximabEUR 145,0795.9PalbociclibEUR 1,449,416.285.3
PanitumumabEUR 129,2875.3OlaparibEUR 1,338,767.044.9
Total 92.8LorlatinibEUR 1,094,262.594.0
IpilumumabEUR 786,563.462.8
PembrolizumabEUR 670,891,672.4
PemetrexedEUR 615,425.912.2
PertuzumabEUR 581,406.002.1
AvelumabEUR 568,416.002.1
AbirateroneEUR 500,524.621.8
Pembrolizumab/placeboEUR 405,841.741.5
CetuximabEUR 393,887.101.4
LenvatinibEUR 386,416.811.4
DinutuximabEUR 348,727.071.3
Atezolizumab/placeboEUR 326,070.631.2
OsimertinibEUR 300,501.601.1
SunitinibEUR 299,647.571.1
BMS-986213/NivolumabEUR 289,906.561.0
AxitinibEUR 280,783.801.0
EnzalutamideEUR 274,394.961.0
Trastuzumab s.c.EUR 271,830.001.0
ApalutamideEUR 259,110.000.9
Ipilimumab/placeboEUR 222,314.530.8
TrastuzumabEUR 217,028.660.8
AlectinibEUR 204,001.910.7
PanitumumabEUR 183,674.660.7
Nivolumab/placeboEUR 183,520.800.7
NiraparibEUR 181,838.250.7
Olaratumab/placeboEUR 181,812.210.7
Total 90.6
Table 6. Percentages of pharmaceutical expenditures and patients treated in the clinical trial setting with intravenous antineoplastic agents by tumor location in 2010 and 2019.
20102019
Tumor Location% of Total
Expenditure
% of Total
Patients
Tumor Location% of Total
Expenditure
% of Total
Patients
Breast46.434.8Lung, non-small cell27.017.5
Colon18.019.1Advanced solid tumor10.120.2
Ovary14.38.7Breast9.59.9
Lung, non-small cell9.613.5Colon8.07.6
Prostate5.83.0Ovary7.05.2
Pancreas endocrine1.90.8Melanoma6.25.4
Rectum1.53.2Kidney5.23.7
Advanced solid tumors1.38.4Pancreas exocrine2.94.3
Oral cavity and oropharynx0.41.6Uterine cervix2.73.4
Stomach0.31.6Lung, small cell2.62.7
Pancreas exocrine0.22.4Endometrium2.33.2
Lung, small cell0.20.5Urinary bladder2.22.7
Urinary bladder0.042.2Stomach2.23.1
Kidney0.020.5Oral cavity and oropharynx2.12.2
Soft tissue sarcoma0.010.3Mesothelioma1.71.5
Endometrium0.010.8Esophagus1.51.1
Extrahepatic bile duct0.00.3Soft tissue sarcoma1.41.0
Rhinopharynx/cavum1.20.4
Neuroendocrine0.71.4
Hepatic carcinoma0.70.5
Thymoma0.70.5
Brain0.50.7
Prostate0.51.0
Squamous cell skin cancer0.40.3
Larynx/hypopharynx0.30.09
Rectum0.20.6
Basal cell carcinoma0.20.2
Merkel carcinoma0.070.2
Extrahepatic bile duct0.021.1
Urothelial cancer0.00.09
Adrenal 0.09
Anus 0.4
Pancreas endocrine 0.5
Thyroid 0.3
Gallbladder 0.09
Table 7. Estimated antineoplastic drug cost avoidance associated with patients included in clinical trials conducted between 2010 and 2019.
Study YearsExpenditures on Antineoplastic Drugs
IntravenousOralTotal
2010EUR 1,650,750EUR 4,541,111EUR 6,191,865
2011EUR 1,205,680EUR 6,829,844EUR 8,035,524
2012EUR 1,322,395EUR 4,141,530EUR 5,463,925
2013EUR 2,349,744EUR 3,994,676EUR 6,344,420
2014EUR 2,157,533EUR 4,933,760EUR 7,091,293
2015EUR 3,034,919EUR 6,474,355EUR 9,509,274
2016EUR 4,087,619EUR 6,370,112EUR 10,457,731
2017EUR 4,722,001EUR 5,911,956EUR 10,633,957
2018EUR 7,266,822EUR 7,196,238EUR 14,463,060
2019EUR 6,666,428EUR 7,805,132EUR 14,471,560
TotalEUR 34,463,891EUR 58,198,718EUR 92,662,609
Table 8. Pharmaceutical expenditure for the treatment of patients with solid tumors during the study period (2010–2019).
Study YearsPharmaceutical Expenditure of Antineoplastic Agents
Healthcare SettingClinical Trial SettingPotential Drug Cost
Avoidance
IntravenousOralIntravenousOralIntravenousOral
2010EUR 6,565,263EUR 2,579,163EUR 2,457,850NREUR 1,650,750EUR 4,541,115
2011EUR 4,464,740EUR 3,271,684EUR 1,700,250NREUR 1,205,680EUR 6,829,844
2012EUR 4,695,722EUR 2,853,205EUR 2,203,633NREUR 1,322,395EUR 4,141,530
2013EUR 4,436,132EUR 2,437,685EUR 3,331,912EUR 1,845,309EUR 2,349,744EUR 3,994,676
2014EUR 5,770,959EUR 3,302,873EUR 4,636,490EUR 2,022,064EUR 2,157,533EUR 4,933,760
2015EUR 7,596,964EUR 4,346,928EUR 4,120,596EUR 2,876,494EUR 3,034,919EUR 6,474.355
2016EUR 9,769,375EUR 4,581,945EUR 6,220,320EUR 3,545,183EUR 4,087,619EUR 6,370,112
2017EUR 9,475,022EUR 4,990,955EUR 12,675,915EUR 6,086,139EUR 4,722,001EUR 5,911,956
2018EUR 11,252,776EUR 6,723,301EUR 17,844,749EUR 8,166,853EUR 7,266,822EUR 7,196,238
2019EUR 12,666,317EUR 8,615,087EUR 17,074,664EUR 10,497,663EUR 6,666,428EUR 7,805,132
TotalEUR 76,693,270EUR 43,702,826EUR 72,266,379EUR 35,039,705EUR 34,463,891EUR 58,198,718
OverallEUR 120,396,096EUR 107,306,084EUR 92,662,609
NR: not registered.
Disclaimer/Publisher’s Note: The statements, opinions and data contained in all publications are solely those of the individual author(s) and contributor(s) and not of MDPI and/or the editor(s). MDPI and/or the editor(s) disclaim responsibility for any injury to people or property resulting from any ideas, methods, instructions or products referred to in the content.

