Article

Multiparametric Characterization of the DSL-6A/C1 Pancreatic Cancer Model in Rats

1
Faculty of Medicine and University Hospital of Cologne, Institute of Diagnostic and Interventional Radiology, University of Cologne, 50937 Cologne, Germany
2
Faculty of Mathematics and Natural Sciences, Department of Chemistry, University of Cologne, 50937 Cologne, Germany
3
Faculty of Medicine and University Hospital of Cologne, Institute of Radiochemistry and Experimental Molecular Imaging, University of Cologne, 50937 Cologne, Germany
4
Faculty of Medicine and University Hospital of Cologne, Department of Nuclear Medicine, University of Cologne, 50937 Cologne, Germany
5
Nuclear Chemistry, Institute of Neuroscience and Medicine (INM-5), Forschungszentrum Jülich GmbH, 52425 Jülich, Germany
6
Faculty of Medicine and University Hospital of Cologne, Institute of Pathology, University of Cologne, 50937 Cologne, Germany
7
Center for Molecular Medicine Cologne, Faculty of Medicine and University Hospital Cologne, University of Cologne, 50937 Cologne, Germany
8
Department of General, Visceral, Cancer and Transplantation Surgery, Faculty of Medicine and University Hospital Cologne, University of Cologne, 50937 Cologne, Germany
*
Author to whom correspondence should be addressed.
Cancers 2024, 16(8), 1535; https://doi.org/10.3390/cancers16081535
Submission received: 5 March 2024 / Revised: 4 April 2024 / Accepted: 12 April 2024 / Published: 17 April 2024
(This article belongs to the Section Cancer Pathophysiology)

Abstract

:

Simple Summary

In this study, a rat model of pancreatic ductal adenocarcinoma (PDAC) was established and extensively analyzed. The histological examination confirmed that the model displayed features of PDAC, such as malformed malignant ductal cells and cancer-associated fibroblasts (CAFs). The study delved into the tumor microenvironment, revealing a unique immune profile with increased CD8+ cytotoxic T cells, suggesting a stronger anti-tumor immune response. Different imaging techniques were employed, showing contrast enhancement on MRI and a strong uptake of 68Ga-FAPI (fibroblast activation protein inhibitor) tracers in tumor tissues. This model’s suitability for further research in 68Ga-FAPI imaging and therapeutic approaches was highlighted. While some limitations exist, such as late-stage edema and heterogeneous growth patterns, this model provides valuable insights for PDAC studies and potential therapeutic strategies.

Abstract

The DSL-6A/C1 murine pancreatic ductal adenocarcinoma (PDAC) tumor model was established in Lewis rats and characterized through a comprehensive multiparametric analysis to compare it to other preclinical tumor models and explore potential diagnostic and therapeutical targets. DSL-6A/C1 tumors were histologically analyzed to elucidate PDAC features. The tumor microenvironment was studied for immune cell prevalence. Multiparametric MRI and PET imaging were utilized to characterize tumors, and 68Ga-FAPI-46-targeting cancer-associated fibroblasts (CAFs), were used to validate the histological findings. The histology confirmed typical PDAC characteristics, such as malformed pancreatic ductal malignant cells and CAFs. Distinct immune landscapes were identified, revealing an increased presence of CD8+ T cells and a decreased CD4+ T cell fraction within the tumor microenvironment. PET imaging with 68Ga-FAPI tracers exhibited strong tracer uptake in tumor tissues. The MRI parameters indicated increasing intralesional necrosis over time and elevated contrast media uptake in vital tumor areas. We have demonstrated that the DSL-6A/C1 tumor model, particularly due to its high tumorigenicity, tumor size, and 68Ga-FAPI-46 sensitivity, is a suitable alternative to established small animal models for many forms of preclinical analyses and therapeutic studies of PDAC.

Graphical Abstract

1. Introduction

Pancreatic ductal adenocarcinoma (PDAC) is one of the most aggressive cancer entities, causing about 130,000 deaths in Europe per year and 4.2% of cancer-related deaths worldwide [1,2]. While the mean time of survival for other types of cancer has improved over the past years thanks to new therapeutic options, the 5-year survival rate for PDAC has remained low at 6% [3,4]. Due to a lack of symptoms and the early onset of metastases, PDAC is commonly diagnosed in a vast majority of patients at a late stage. The tumor tissue of PDAC is poorly perfused and characterized by a dense stroma with a high density of cancer-associated fibroblasts (CAFs). Poor drug penetration is therefore one of the reasons for the therapy resistance and poor response of PDAC [5,6,7].
Clinical diagnoses and staging are currently performed with Computed Tomography (CT) and Magnetic Resonance Imaging (MRI) [8]. CT is currently the primary imaging modality for initial diagnosis with an evaluation of the contrast agent uptake in the arterial and portal venous phase. Due to low perfusion and dense stroma, PDAC nodules appear to be hypointense in the arterial phase after contrast injection compared to the surrounding pancreatic tissue. The proper detection of small lesions or lesions that appear to be iso-dense to the surrounding tissue is challenging [9,10,11]. In this context, we recently showed that new energy-resolving CT systems, which provide for example iodine concentration maps, offer improved diagnostics of PDAC [12]. Magnetic Resonance Imaging (MRI) offers high-contrast soft tissue images based on different contrast mechanisms, such as T1 and T2, T2* weighted images, quantitative T1 and T2 maps, [13,14,15], diffusion-weighted images (DWIs) [16], perfusion, or dynamic contrast-enhanced images, allowing us to assess pharmacokinetic parameters [17,18]. Hence, MRI is an essential tool to gain in-depth knowledge about tissue properties and the tumor microenvironment and is suitable for monitoring therapy responses [19].
Due to the typically dense stroma in PDAC resulting from a high number of CAFs in the tumor tissue, imaging using Positron Emission Tomography (PET) tracers based on a 68Gallium (68Ga)-labelled fibroblast activation protein inhibitor (FAPI) has gained increasing importance in recent years [20]. Besides presenting a biomarker for tumor detection, CAFs are gaining increasing importance as targets of potential therapeutic options for PDAC due to their function as promoters of tumor growth, as well as immune suppression [21]. CAF imaging with 68Ga-FAPI PET/CT allows for improved detection of smaller lesions and an improved differentiation of PDAC from inflammatory processes compared to 18F-FDG-PET [22,23].
Research on new therapeutic options, as well as new imaging methods, for PDAC rely on a representative animal model mimicking the pathology that is observed in patients. For research purposes, a variety of animal pancreatic cancer models are known, mainly in mice. One of the most widely used models for PDAC is the genetically engineered KPC mouse, developed in 2005 [24]. The KPC model shows mutations in the KRAS and p53 genes that are typical for human PDAC, as well as a comparable dense stroma but lacks the typically high T cell density of human PDAC, limiting the use of the tumor model for immunological studies [25]. Another widely used PDAC tumor model is the murine syngeneic Panc02 cell line which is used for a wide range of immunobiological and immunotherapeutic analyses and therapeutic studies using chemotherapeutics and checkpoint inhibitors [26]. Although this tumor model shows a PDAC phenotype, it lacks a desmoplastic reaction, which is one of the main reasons for the weak sensitivity to chemotherapeutic agents in human patients [27]. In addition, xenograft tumor models from human PDAC represent the histological phenotype better than homograft animal models, but they also have various limitations, as immunosuppressed animals are used. Consequently, immune therapies, as well as the response of the immune system to therapies, are difficult to study. With respect to CAFs, xenograft models may form a different microenvironment in the tumor tissue, as murine fibroblasts are recruited from the surrounding host tissue and migrate into a human-derived tumor [28,29]. Furthermore, donor tissue can only be obtained from resectable human PDAC, for which only a minority of patients are eligible [30]. Moreover, as most of the established tumor models are grown in mice, their small tumor volume presents a challenge for performing therapeutic studies employing device-based physical therapies using radiofrequency, microwave, or high-intensity focused ultrasound [24,26,31]. Potential alternatives in larger animals for studies involving local therapies include neoplasms produced by carcinogenic agents in hamsters, some of which have high tumorigenicity, but show a very heterogeneous phenotype and are difficult to control, resulting in animals developing tumor entities in several organs besides the pancreas [32].
As a result of the above limitations, PDAC models in rats appear promising for studying certain therapeutic approaches which require larger tumor volumes or certain tissue and growth properties. In this study, we characterize the DSL-6A/C1 tumor model in detail, a pancreatic ductal cell line in the rat arising from a DSL-6 acinar cell carcinoma that was first described by Pettengill et al. in 1993 [33]. In particular, we use multiparametric MRI, FAPI-PET/CT, as well as histology and immunological and growth analysis of the DSL 6A/C1 PDAC tumor model to highlight its advantages and disadvantages compared to other tumor models.

2. Materials and Methods

2.1. Animals

Male Lewis rats were obtained from Charles River (Sulzfeld, Germany) and maintained in standard housing at 20–24 °C and 12 h light/12 h dark cycles. All animals were provided with water and food ad libitum. All animal experiments were conducted in accordance with local institutional guidelines and approved by the LANUV (Landesamt für Natur, Umwelt und Verbraucherschutz, Northrine-Westphalia, Germany).

2.2. Cell Line and Culture

The rat pancreatic ductal adenocarcinoma DSL 6A/C1 cell line derived from the DSL-6 acinar cell carcinoma was purchased from CLS (Cell Lines Service GmbH, Eppelheim, Germany) and cultured in Waymouth’s medium (Thermo Fisher Scientific, Schwerte (Northrine-Westphalia), Germany). The cell culture medium was supplemented with 10% heat-inactivated fetal bovine serum (FBS; Thermo Fisher Scientific), penicillin G (100 U/mL), and streptomycin (100 µg/mL). The cells were incubated at 37 °C in humidified air with 5% CO2. The medium was replaced twice weekly, and cells were maintained by serial passaging after trypsinization with Trypsin 0.5%/EDTA 0.2% in PBS.

2.3. Tumor Induction and Growth Measurement

For the creation of the tumors, male Lewis rats, 6–8 weeks of age, were anesthetized using a mixture of 3–5% isoflurane and oxygen. Meloxicam (0.5 mg/kg, s.c.) and metamizole (100 mg/kg, s.c.) were used as a pain medication. Then, 107 DSL-6A/C1 cells were suspended in Matrigel and Waymouth medium (1:1, final volume 100 µL) and injected s.c. into each hindleg. Tumor dimensions were determined every second day by measuring the length (l), width (w), and depth (d) using a caliper, and the tumor volume was calculated using the formula V = 0.5 × l × w × d. In addition, tumor volumes were determined every second week using MRI with segmentations of T2-weighted images performed with ITK-SNAP [34]. In another group of 10 female Lewis rats, we did not observe any tumor growth over the time span of 5 months.

2.4. Euthanasia, Tissue Collection, and Histology

Euthanasia was performed in adherence to ethical standards and animal welfare considerations. The endpoint for each animal was determined by one or more of the following criteria: tumor size in one dimension exceeding 3 cm or manifestation of wasting syndrome. Some animals, especially in the slow-growing tumor group, had to be euthanized according to local COVID-19 restrictions. After euthanasia, tumors were extracted and fixed in 4% buffered formalin for 48 h prior to paraffin embedding. Sections were cut at 3 μm thickness. Representative sections were stained with Hematoxylin and Eosin (H&E) and analyzed for cancer-associated fibroblasts using a transmitted-light phase-contrast microscope (Zeiss Axioskop 2, Carl Zeiss, Jena (Thuringia), Germany).

2.5. Magnetic Resonance Imaging

After tumor cell injection, the animals underwent MRI monitoring every second week until euthanasia. The scans were acquired using a clinical 3.0 T MRI (Achieva®, Philips Healthcare, Best (North Brabant), The Netherlands) with a dedicated animal bed and ventilation setup embedded in an eight-channel receive-only rat body coil (RAPID Biomedical, Rimpar (Bavaria), Germany). The animals were anaesthetized with a mixture of isoflurane and oxygen before and during image acquisition, with the dose of isoflurane being adjusted to establish a therapeutically adequate anesthetic depth, while maintaining stable respiratory cycles. The hind legs of the animals were naturally cocked to the sides, resting between the lower abdomen and the side of the animal bed, close to the coil center and the magnet isocenter.
Tumors were localized with a transverse T2-weighted 2D turbo-spin echo (acronym T2TSE) sequence covering the animal roughly from the lower abdomen to the lower leg. Quantitative and contrast-enhanced acquisitions were recorded at selected time points (three time points are illustrated below). The following scans were obtained in the same reduced FOV of 60 × 60 × 21 mm3. For quantification of T2, a multi-slice turbo-spin echo sequence (acronym T2MAP) was acquired. Based on a Look–Locker-related acquisition (Ref Look–Locker), data for T1 relaxation mapping was obtained (acronym T1MAP) [35]. Dynamic contrast-enhanced (DCE) imaging was recorded based on a 3D FFE sequence. All relevant sequence parameters are listed in Table 1. Contrast agent (ClariscanTM, GE Healthcare, Chicago, IL, USA) was injected during the 15th dynamic acquisition using an automatic pump and an infusion line via the tail vein (0.2 mmol/kg bodyweight).

2.6. MRI Data Image Processing and Analysis

Based on the TSE2D data, the tumor volume was segmented for all subjects with ITK-Snap [34]. The T2 relaxivity was determined by fitting an exponential curve to the echo–time curve with non-linear least squares. For T1, the acquired data were flipped left of the zero-crossing and fitted to a simplified Look–Locker model, correcting for saturation effects as described in Deichmann et al. [36]. T1 and T2 maps, as well as the segmentation, were resampled to the through-slice resolution of the DCE data by nearest neighbor interpolation. In acquisitions where a hyperintense part within the tumor existed, it was segmented based on the resampled T1 maps. Image analysis for DCE data was performed with a dedicated open-source software, Rocketship [37], using a manually segmented vessel for AIF estimation and the provided nested model to derive the pharmacokinetic parameters. AIF smoothing and automated time point detection were employed.

2.7. Synthesis and Quality Control of 68Ga-FAPI

A total of 50 µg FAPI-46 (ABX, Radeberg, Germany) in 1.5 M HEPES buffer was labeled with 500 to 800 MBq [68Ga]-gallium chloride (68Ga-FAPI-46) in 0.1 M HCl using a 68Ge/68Ga generator (Eckert& Ziegler, Berlin, Germany) and the GRP synthesis module from Scintomics (Gräfelfing, Germany). The reaction was carried out at 125 °C for 10 min. Afterwards, the reaction mixture was purified via C18 column chromatography (Waters C18 cartridge) and consequently diluted with isotonic saline.
Radiochemical purity was determined by HPLC (Eluent A: water (HPLC Grade) + 0.1% trifluoro acetate (TFA), eluent B: acetonitrile (HPLC Grade) + 0.1% TFA, gradient: 95% A for 2 min, then to 5% A within 15 min, flow: 1.2 mL/min, UV detection: 254 nm, injection volume: 20 µL; free 68Ga was eluted after 2–3 min, product after 8 min) and TLC (ITLC-SG strips, 1.5 × 10 cm, 1 M Ammoniumacetat/Methanol 1:1, TLC Scanner from Raytest, Straubenhardt, Germany; 68Ga-colloid remained at the origin).

2.8. Positron Emission Tomography

Small animal PET imaging was performed when the tumor was visible on 3 consecutive MRI scans on a FOCUS 220 micro-PET scanner (CTI-Siemens, Germany). The rats were anesthetized with isoflurane in O2/air 3:7 (induction 5%, maintenance 2%), and a catheter for tracer injection was inserted into the lateral tail vein. After fixation in the animal holder, the emission scan started with intravenous injection of 10 to 64 MBq 68Ga-FAPI-46 in 500 µL 0.9% NaCl. The acquisition time was 60 min to 120 min. Emission scans were followed by an 8 min transmission scan with a rotating 57Co-point source.
Breathing rate and body temperature were monitored and held at approx. 60 breaths/min and 37 °C, respectively. The emission scans were histogrammed into time frames (2 × 1 min, 2 × 2 min, 6 × 4 min, 18 × 5 min for time–activity curves, and 4 × 30 min/4 × 15 min for display) and fully 3D rebinned (span 3, ring difference 47), followed by OSEM3D/MAP reconstruction. The resulting voxel sizes were 0.38 × 0.38 × 0.80 mm3. For all further processing of the images, including statistics, the software VINCI 5.21 for MacOS X (Max Planck Institute for Metabolism Research, Cologne, Germany) was used. Images were intensity-normalized to injected dose and corrected for body weight (SUVbw). To this end, every frame was divided by injected dose and multiplied by body weight times 100.

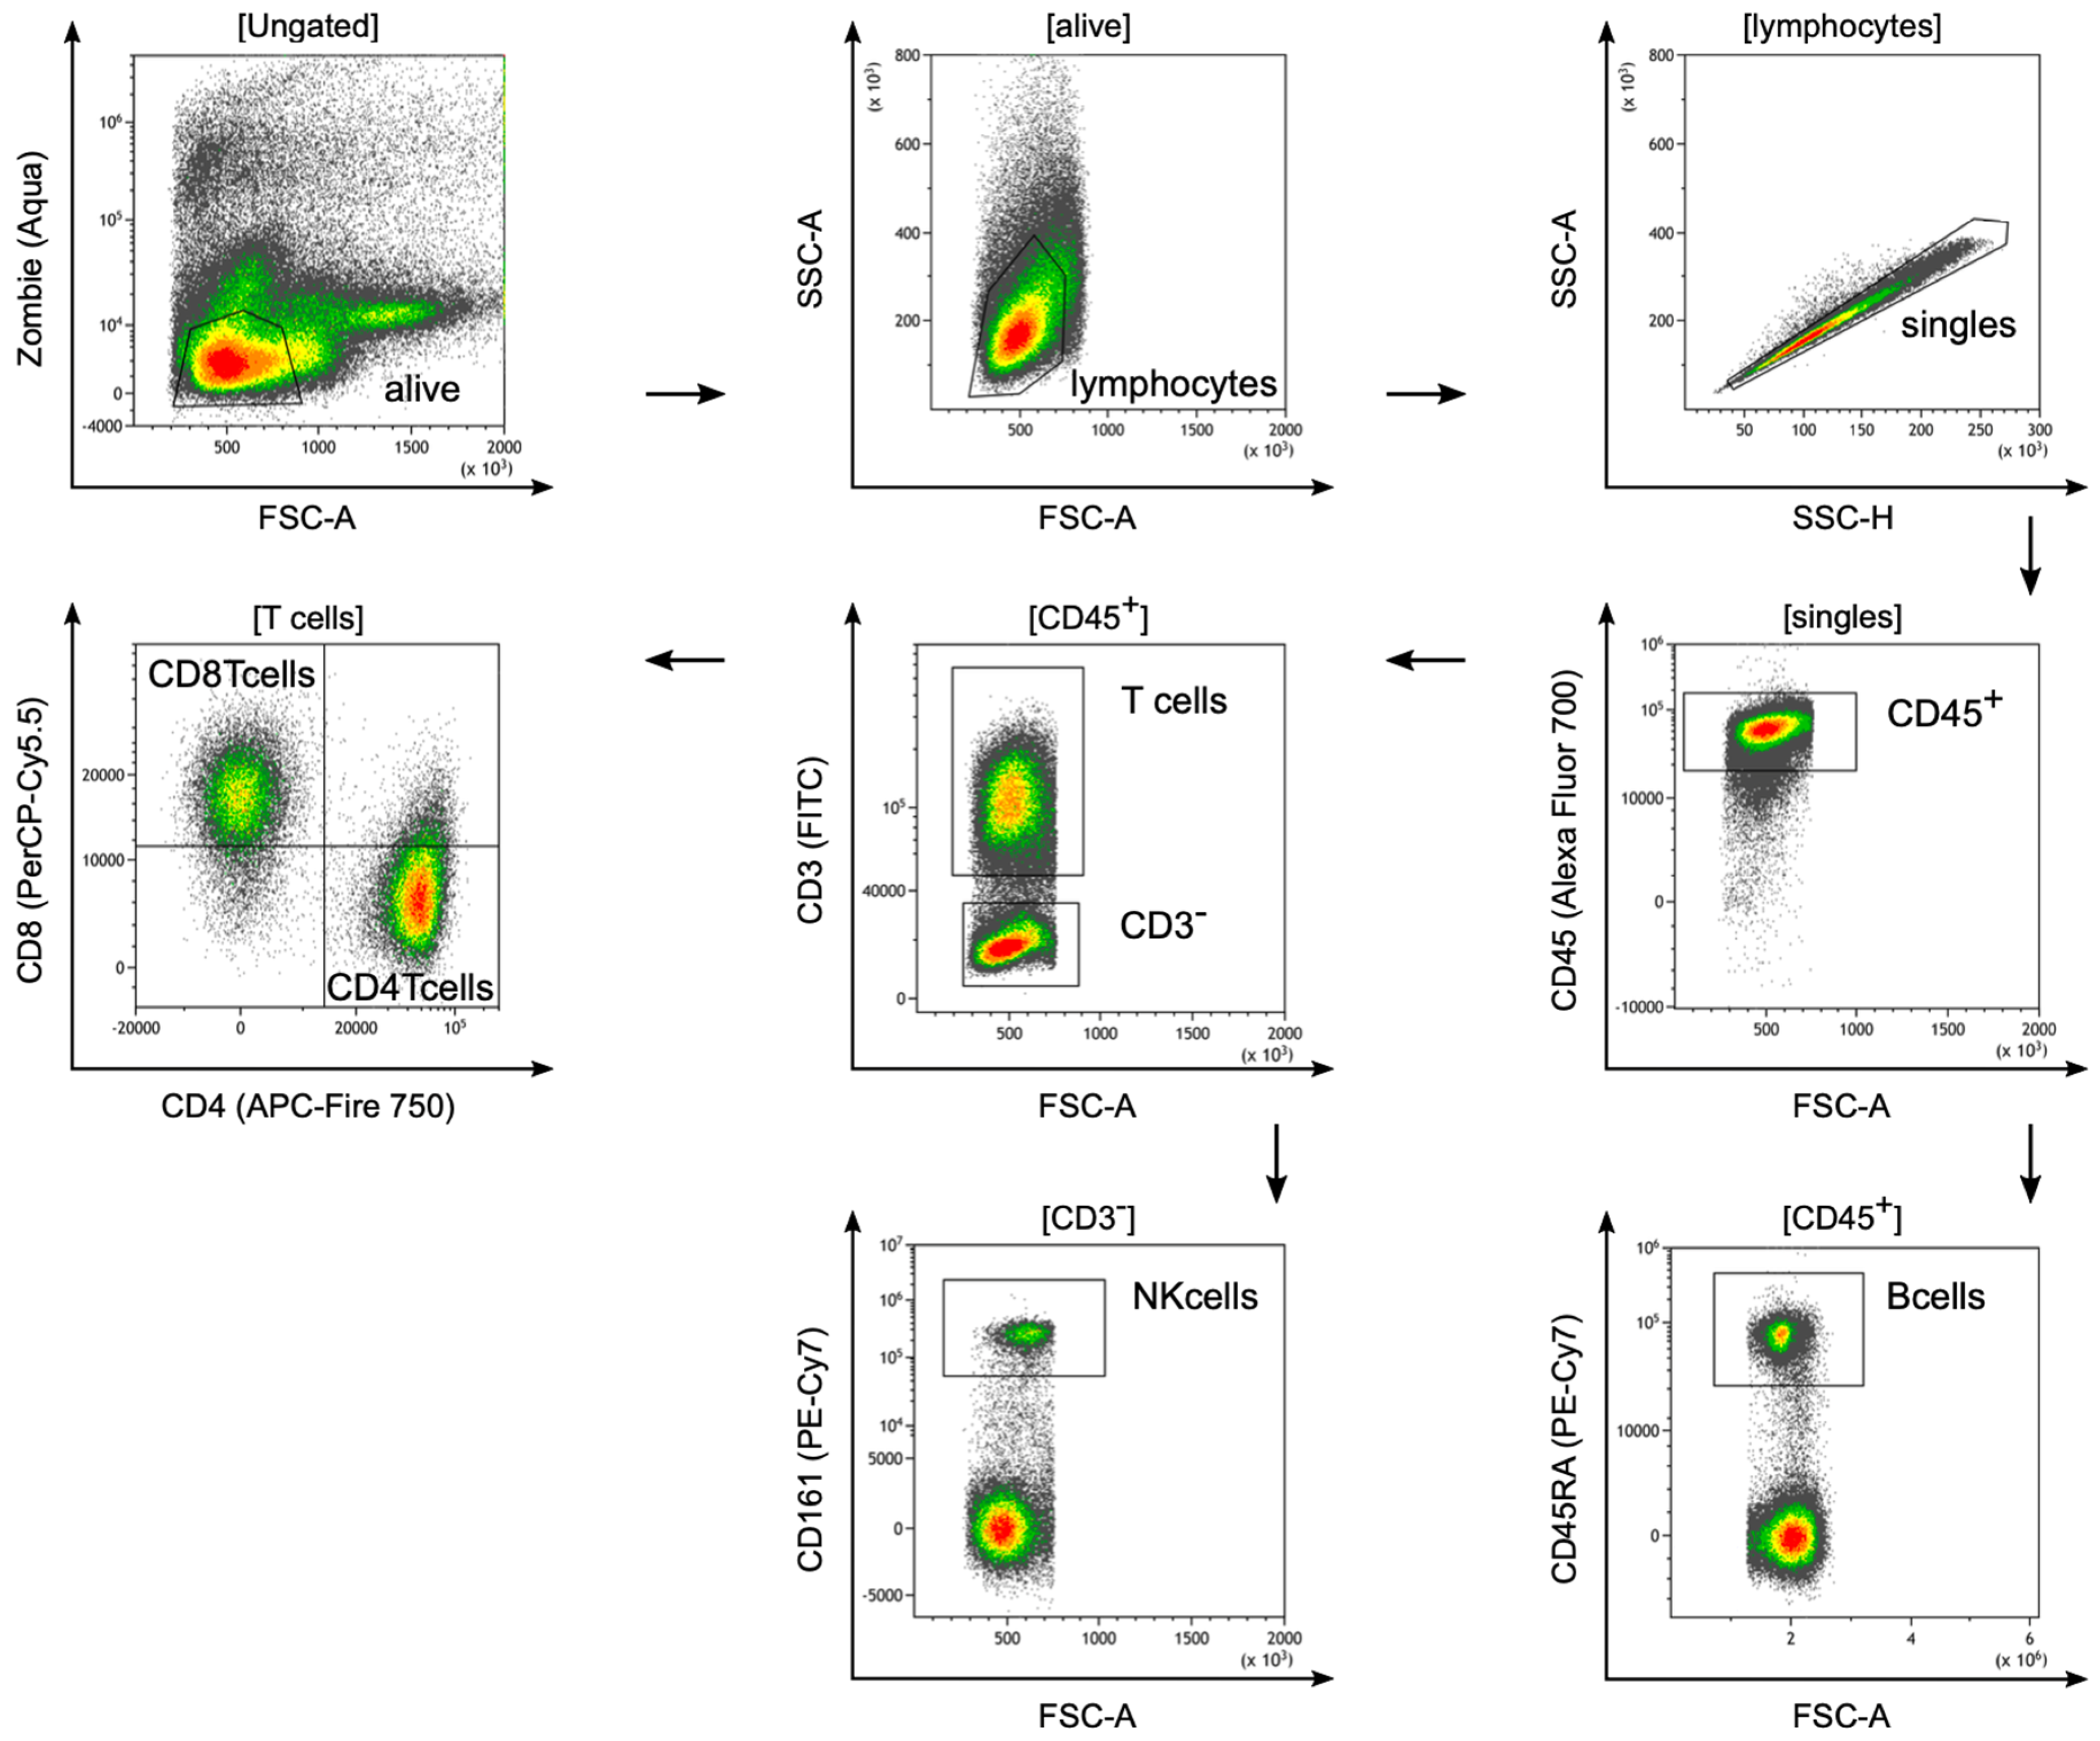
2.9. Isolation of Tumor-Infiltrating Lymphocytes from Rat Tissue and Flow Cytometry

Tumors used for immunological analysis had to be detectable on at least 3 consecutive MRI scans before removal. The scans took place every second week. During extraction, surrounding muscular tissue was removed. Tumor specimens were processed mechanically (gentleMACSDissociator, Miltenyi Biotech, Bergisch Gladbach (Northrine-Westphalia), Germany) and enzymatically (320 U/mL collagenase-IV, Worthington OH, USA and 100 U/mL DNAse-I, Applichem, Darmstadt (Hesse), Germany) at 37 °C for 1 h to obtain a single-cell suspension containing the tumor-infiltrating lymphocytes (TILs). The suspension was filtered using a 100 µm and a 70 µm cell strainer (Corning, New York, NY, USA). Spleens of tumor-bearing rats were mashed through a 100 µm cell strainer, followed by a subsequent filter step with a 70 µm cell strainer. Splenocytes and TILs were stained for multi-color flow cytometry (detailed antibody list, Appendix A Table A1). Intracellular FoxP3 staining was performed using the Foxp3/Transcription Factor Staining Buffer Set according to the manufacturer’s protocol (eBioscience, San Diego, CA, USA). Samples were acquired on a Cytoflex LX flow cytometer (Beckman Coulter, Brea, CA, USA).
To evaluate the potential of the pancreatic ductal adenocarcinoma cell line DSL-6A/C1 as a preclinical tumor model, TILs in DSL-6A/C1 tumors were analyzed. First, a single-cell suspension of fresh tumor tissue was generated after resection. Subsequently, lymphocyte subsets were analyzed by flow cytometry. Dead cells were excluded, and single lymphocytes were identified by forward–sideward scatter and CD45 expression. Subsequently, CD3+ T cells, CD3+CD4+ T cells and CD3+CD8+ T cells, CD19+ B cells, and CD3-CD56+ NK cells were identified, as depicted in Figure 1.

3. Results

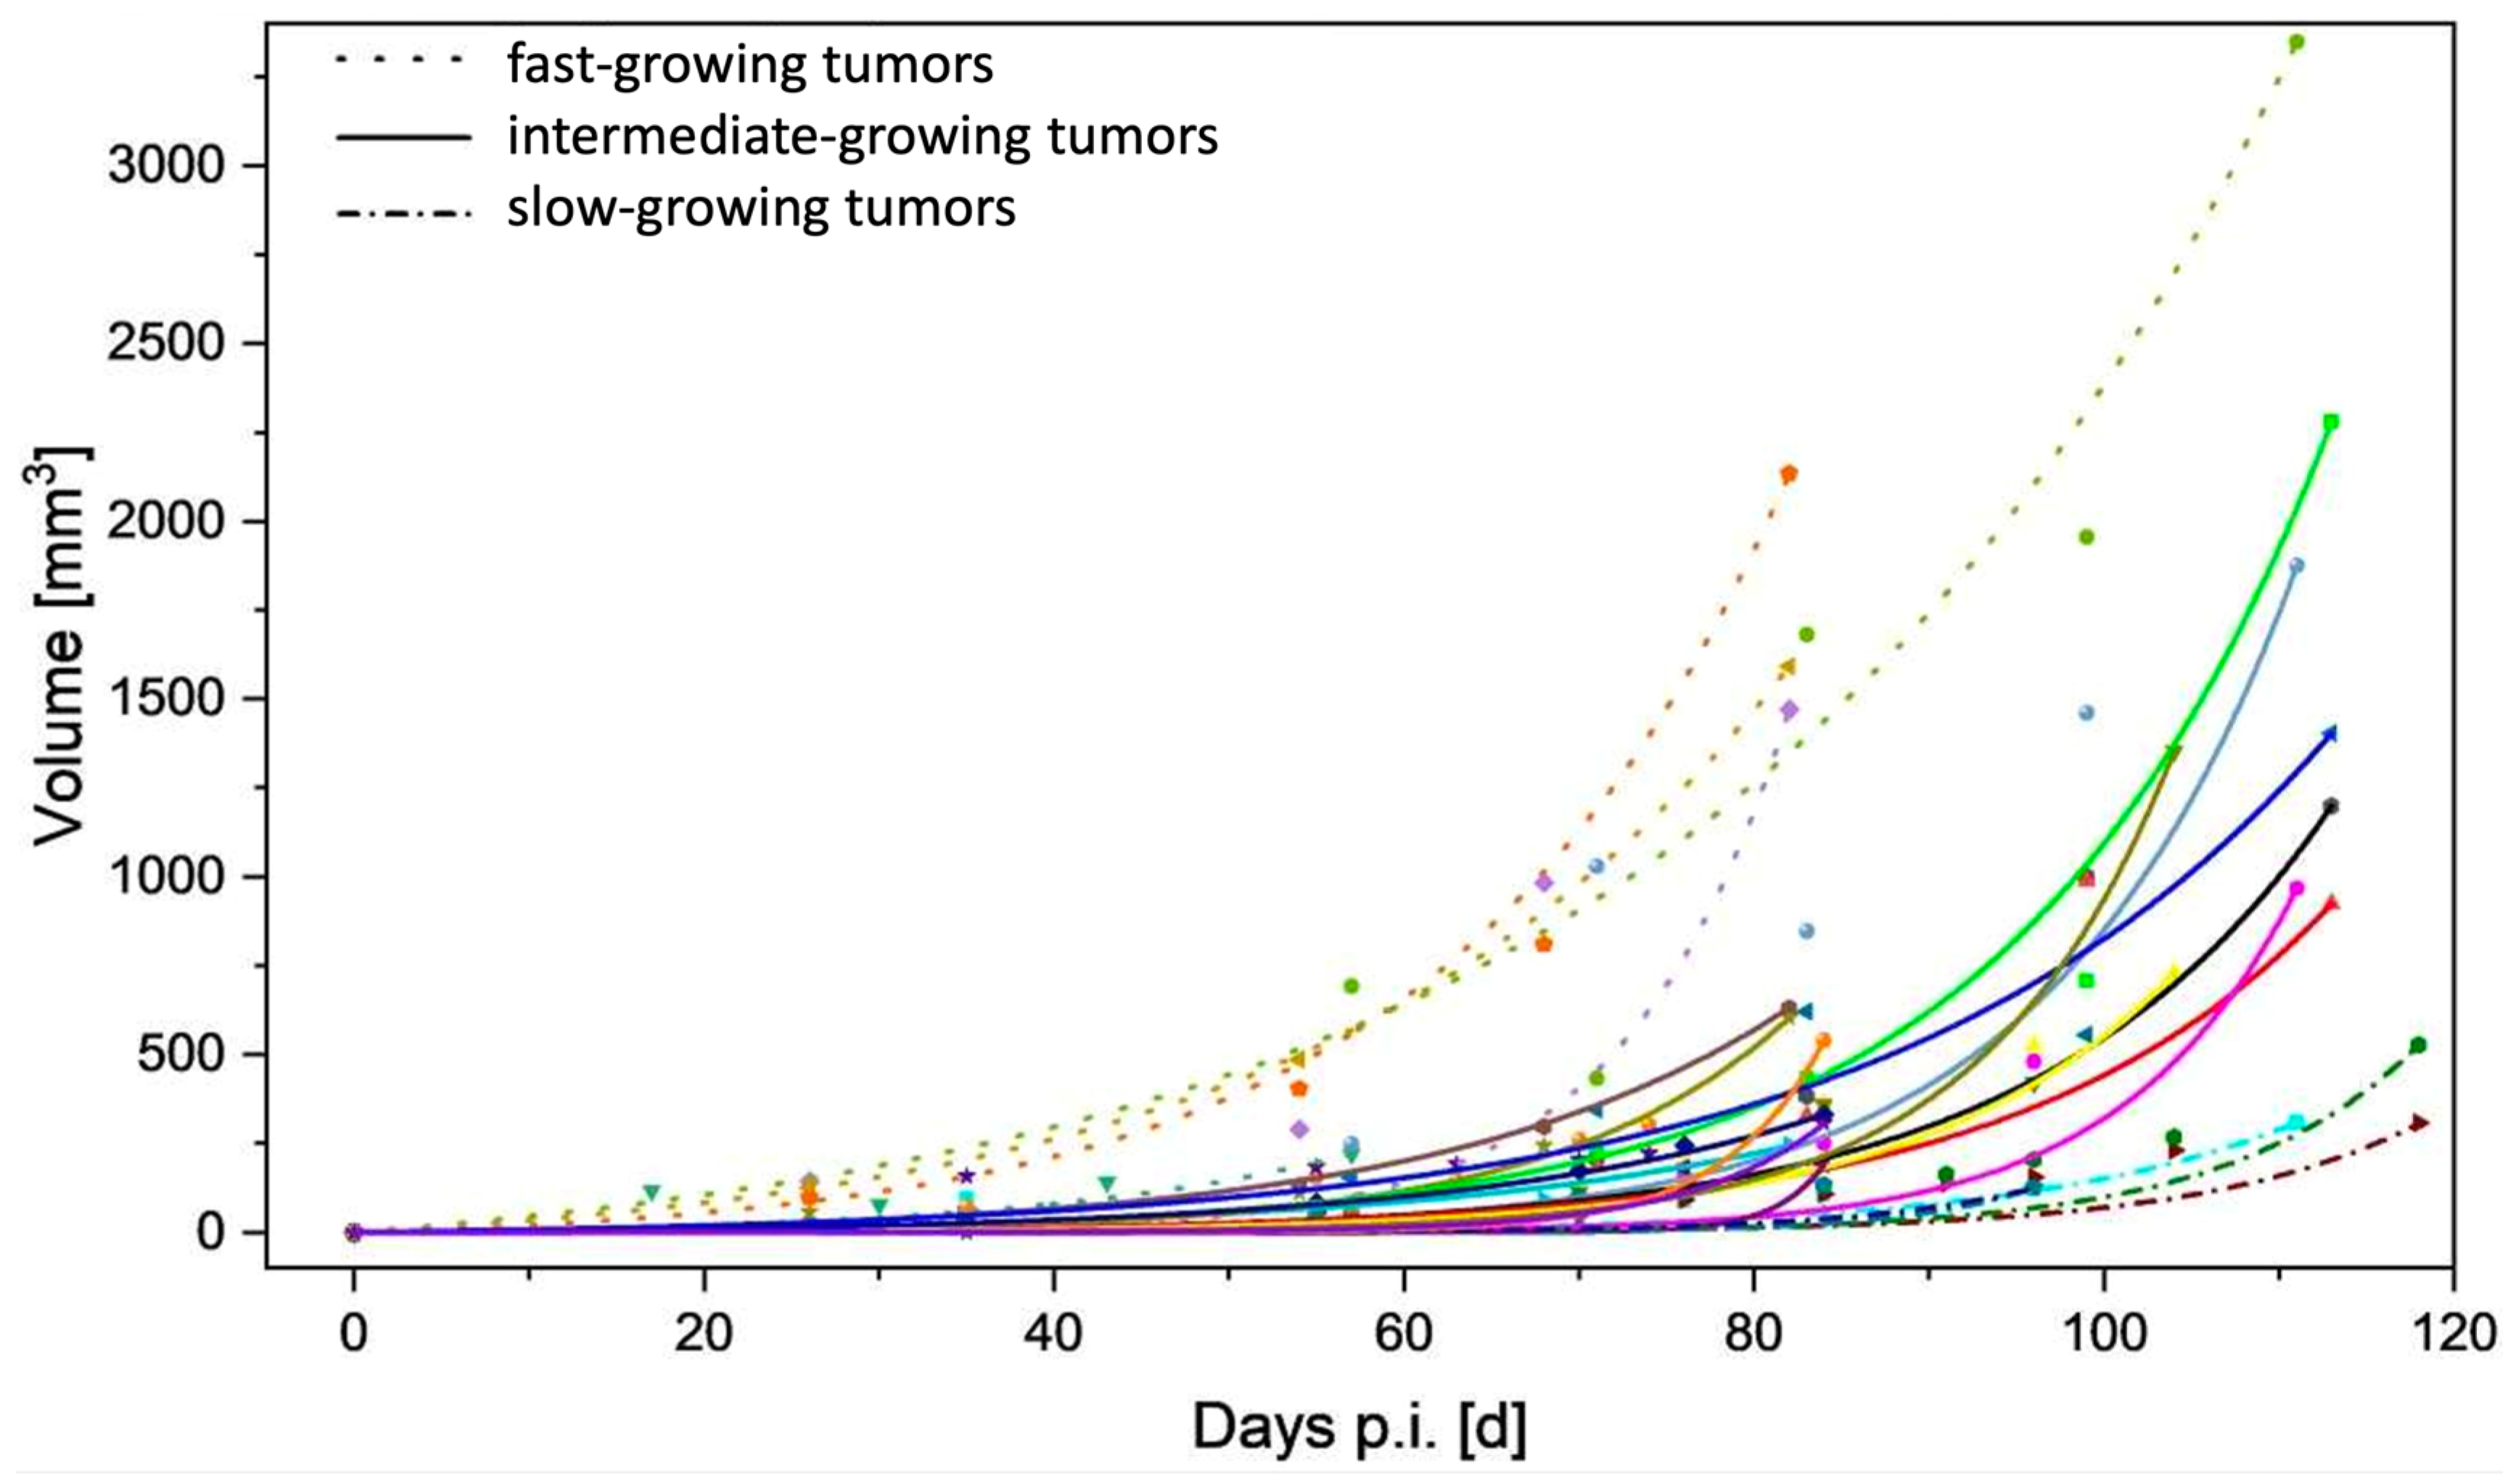
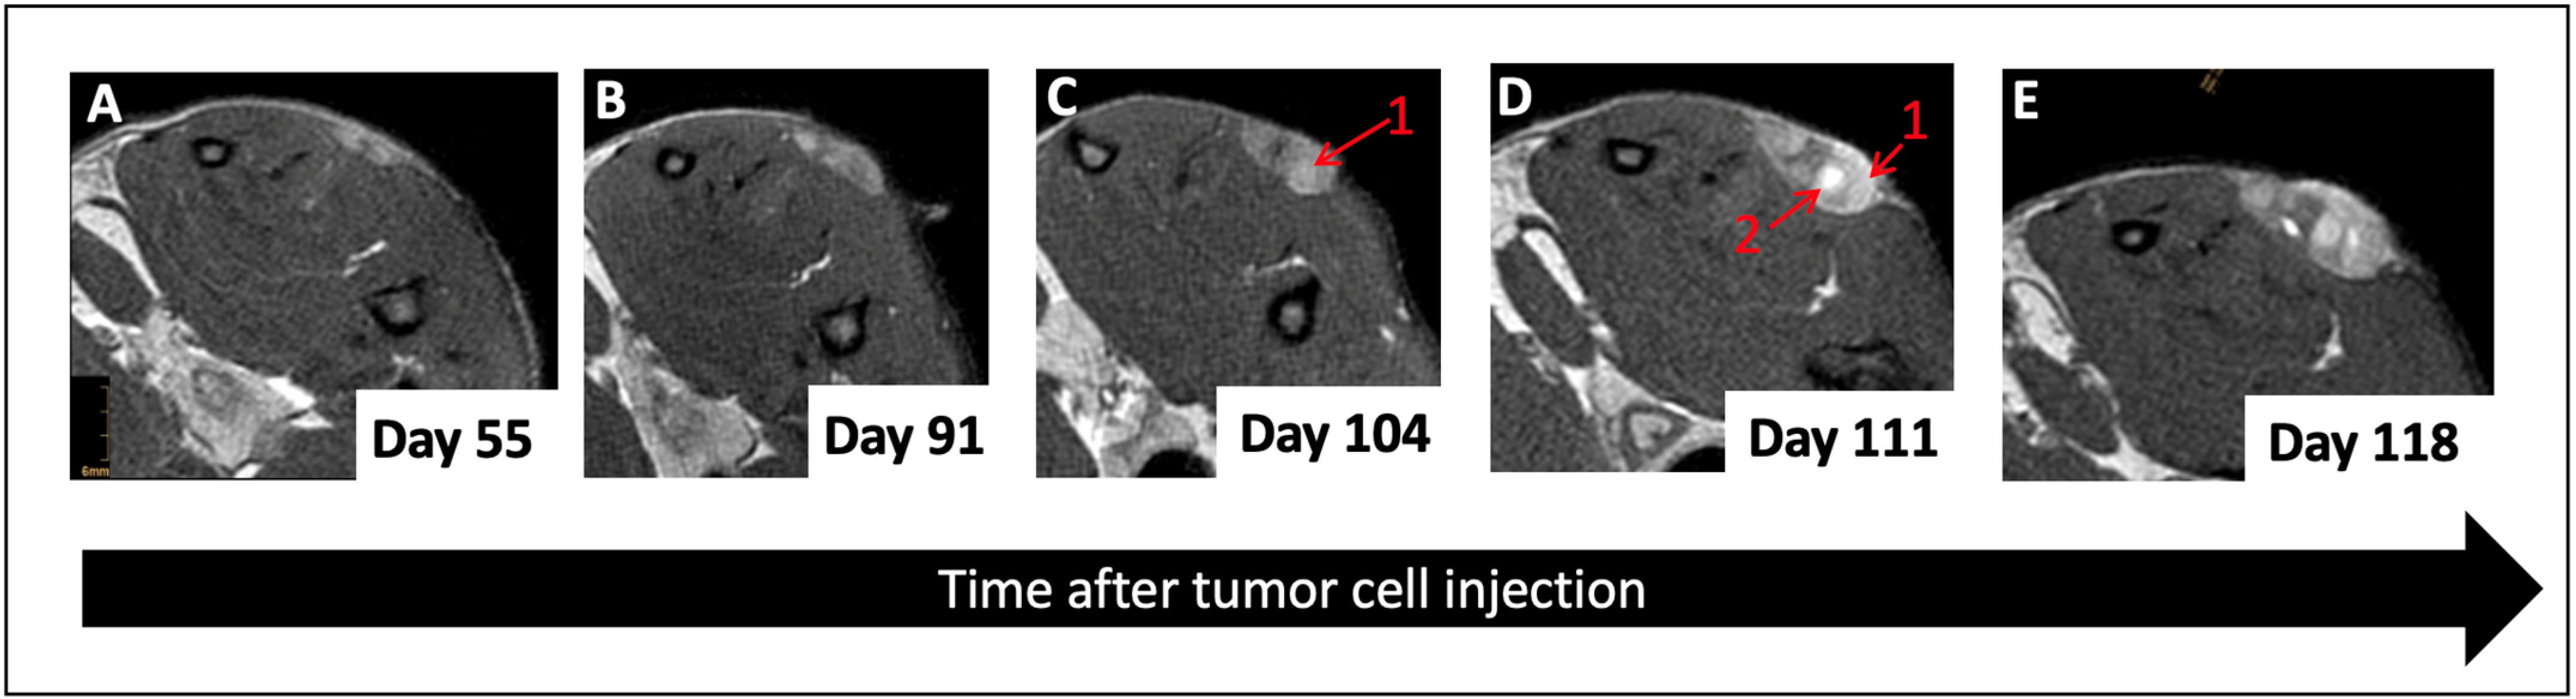
3.1. Tumor Take-up Rate and Growth

Subcutaneous tumor cell injections were successful in 16 out of 20 rats, resulting in a tumor formation rate of 80%, which is slightly lower than what is described in previous research [38]. In a group of 10 female rats, no tumor growth was seen over the time span of 5 months. Tumors were first identifiable (or visible) on MRI after 38 days (±12 days) and showed a very heterogeneous growth reaching an average tumor size of 815 mm3 (±628 mm3) after 100 days. Generally, all tumors demonstrated exponential growth after a variable time lag, varying from 40 days to 100 days after tumor implantation (Figure 2). In larger tumors, increasing intralesional edema and necrosis were seen over time and were clearly observable for 81% of all tumors on the last MRI scan (Figure 3), whereas distant metastases in the abdominal or thoracal cavity were not found either in PET-CT scans nor in autopsies. Cutaneous ulcerations were found in one out of twenty animals.

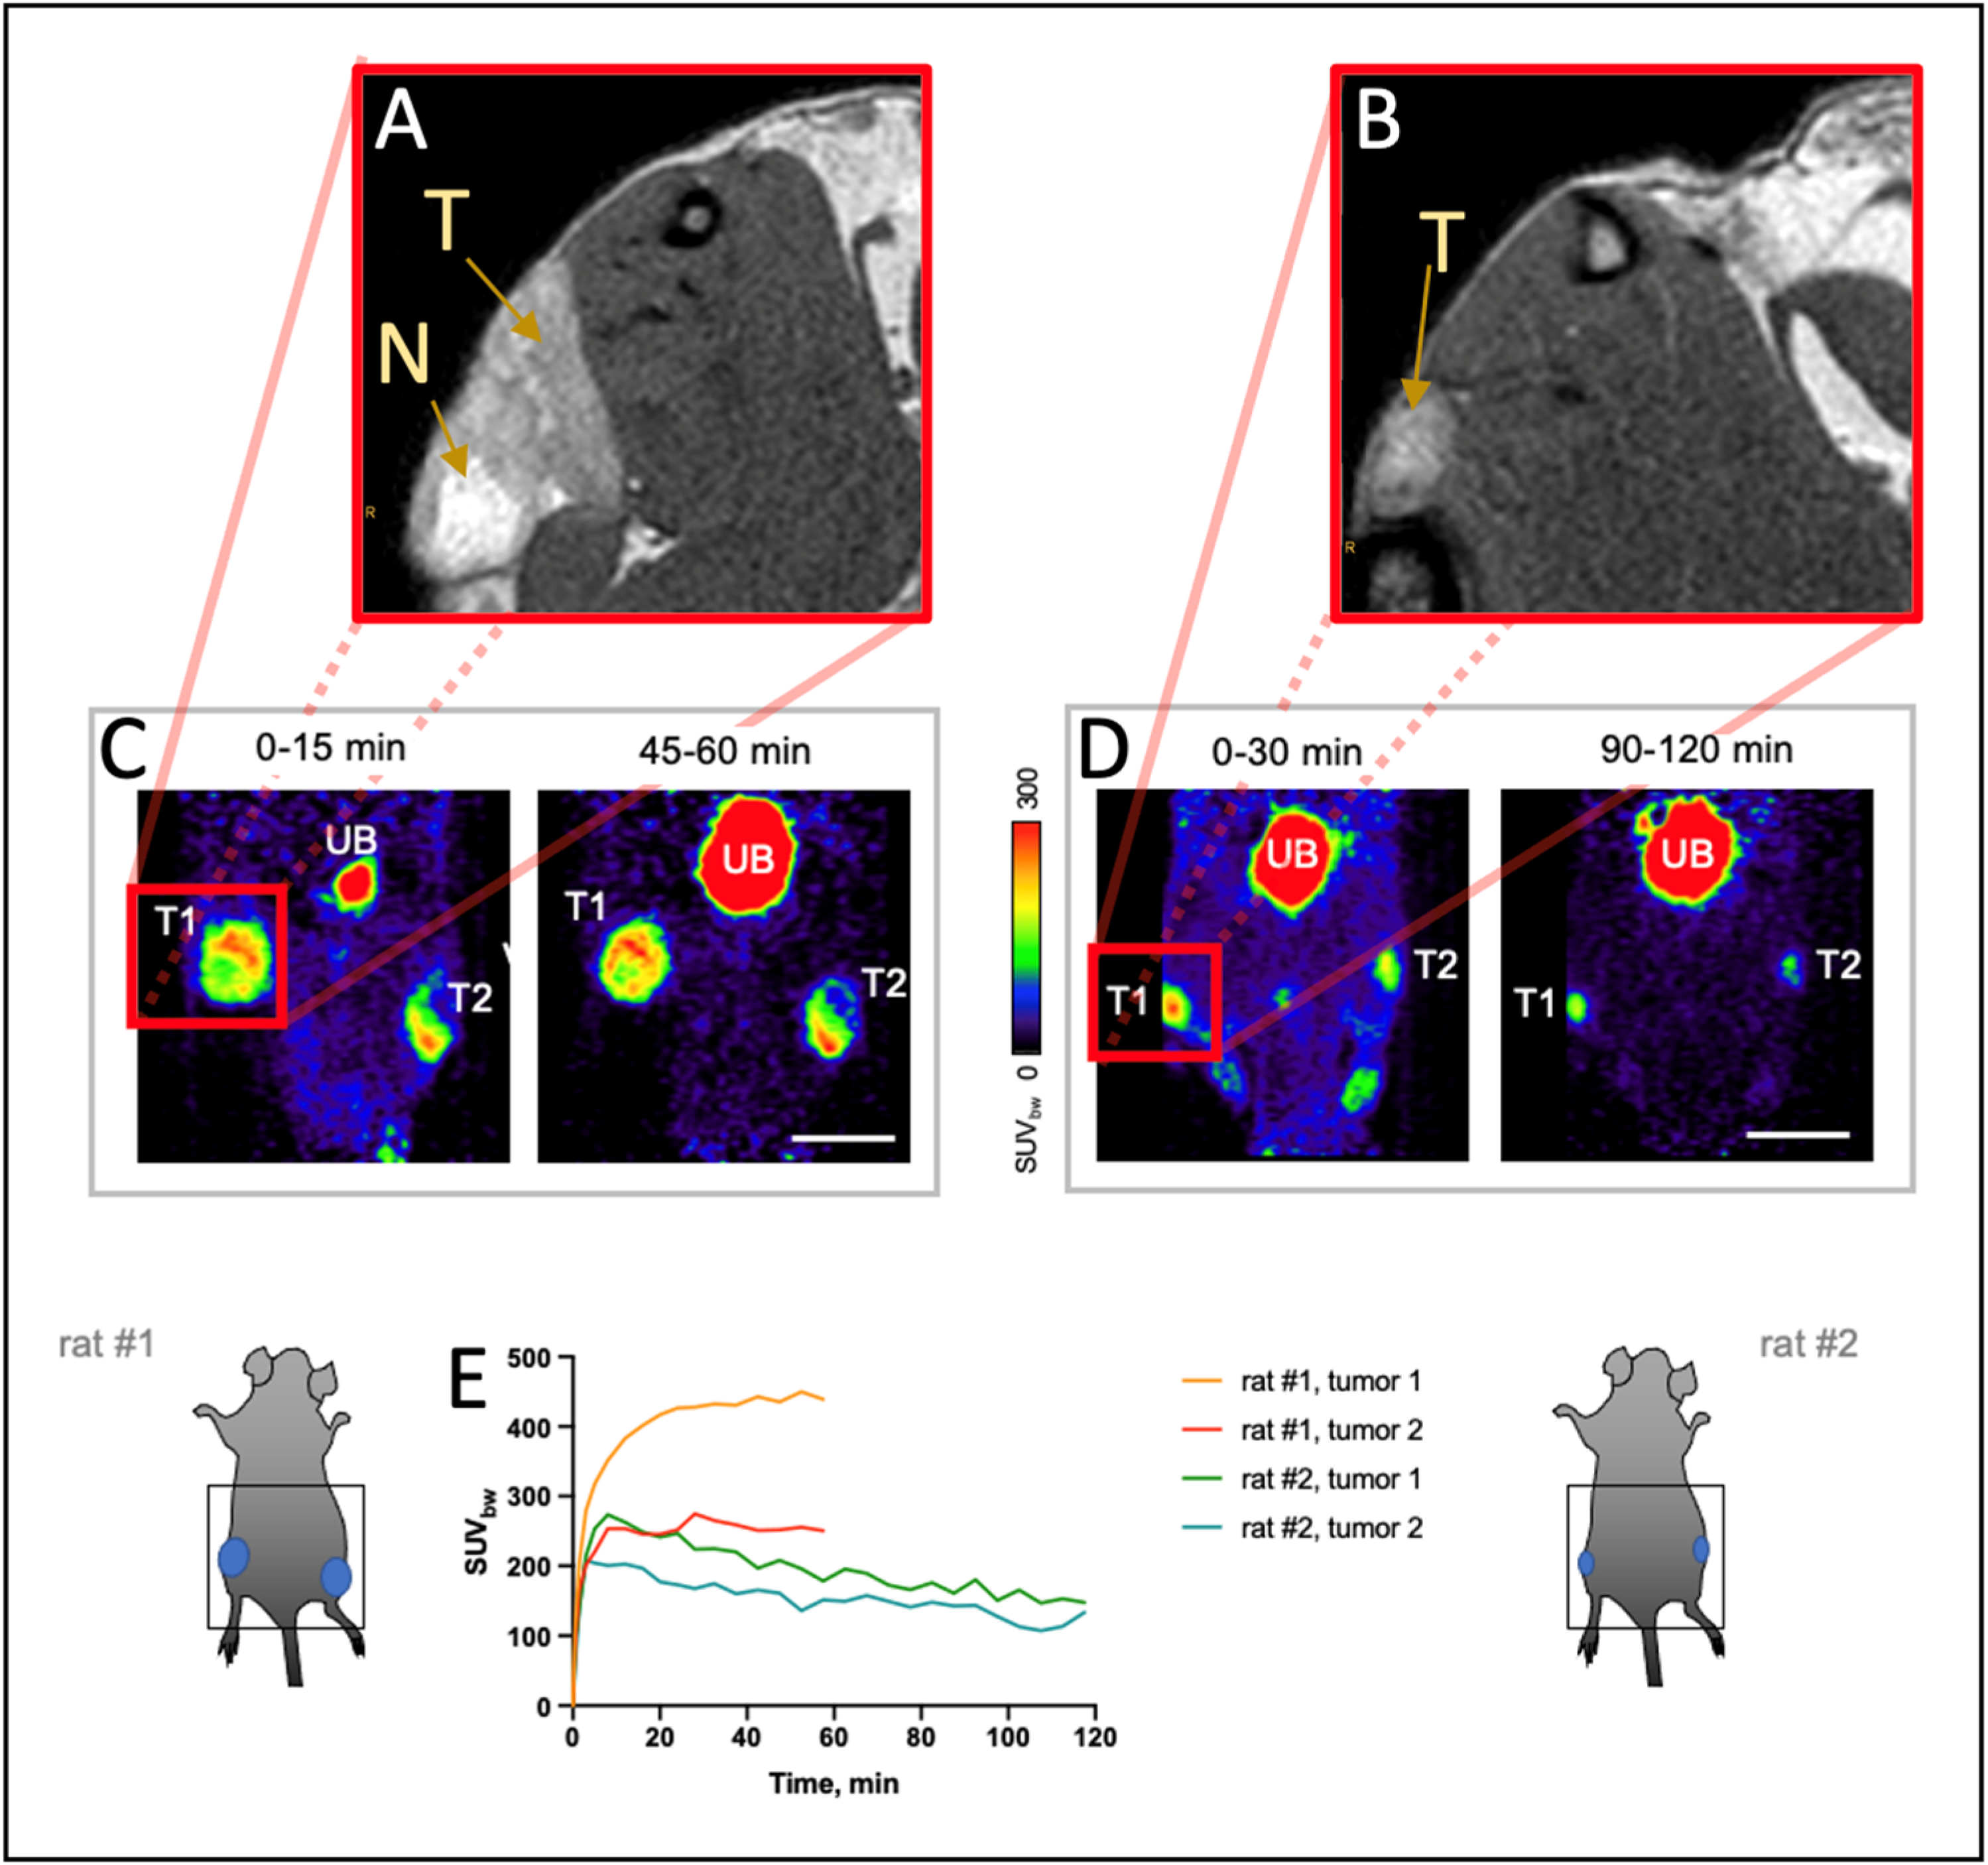
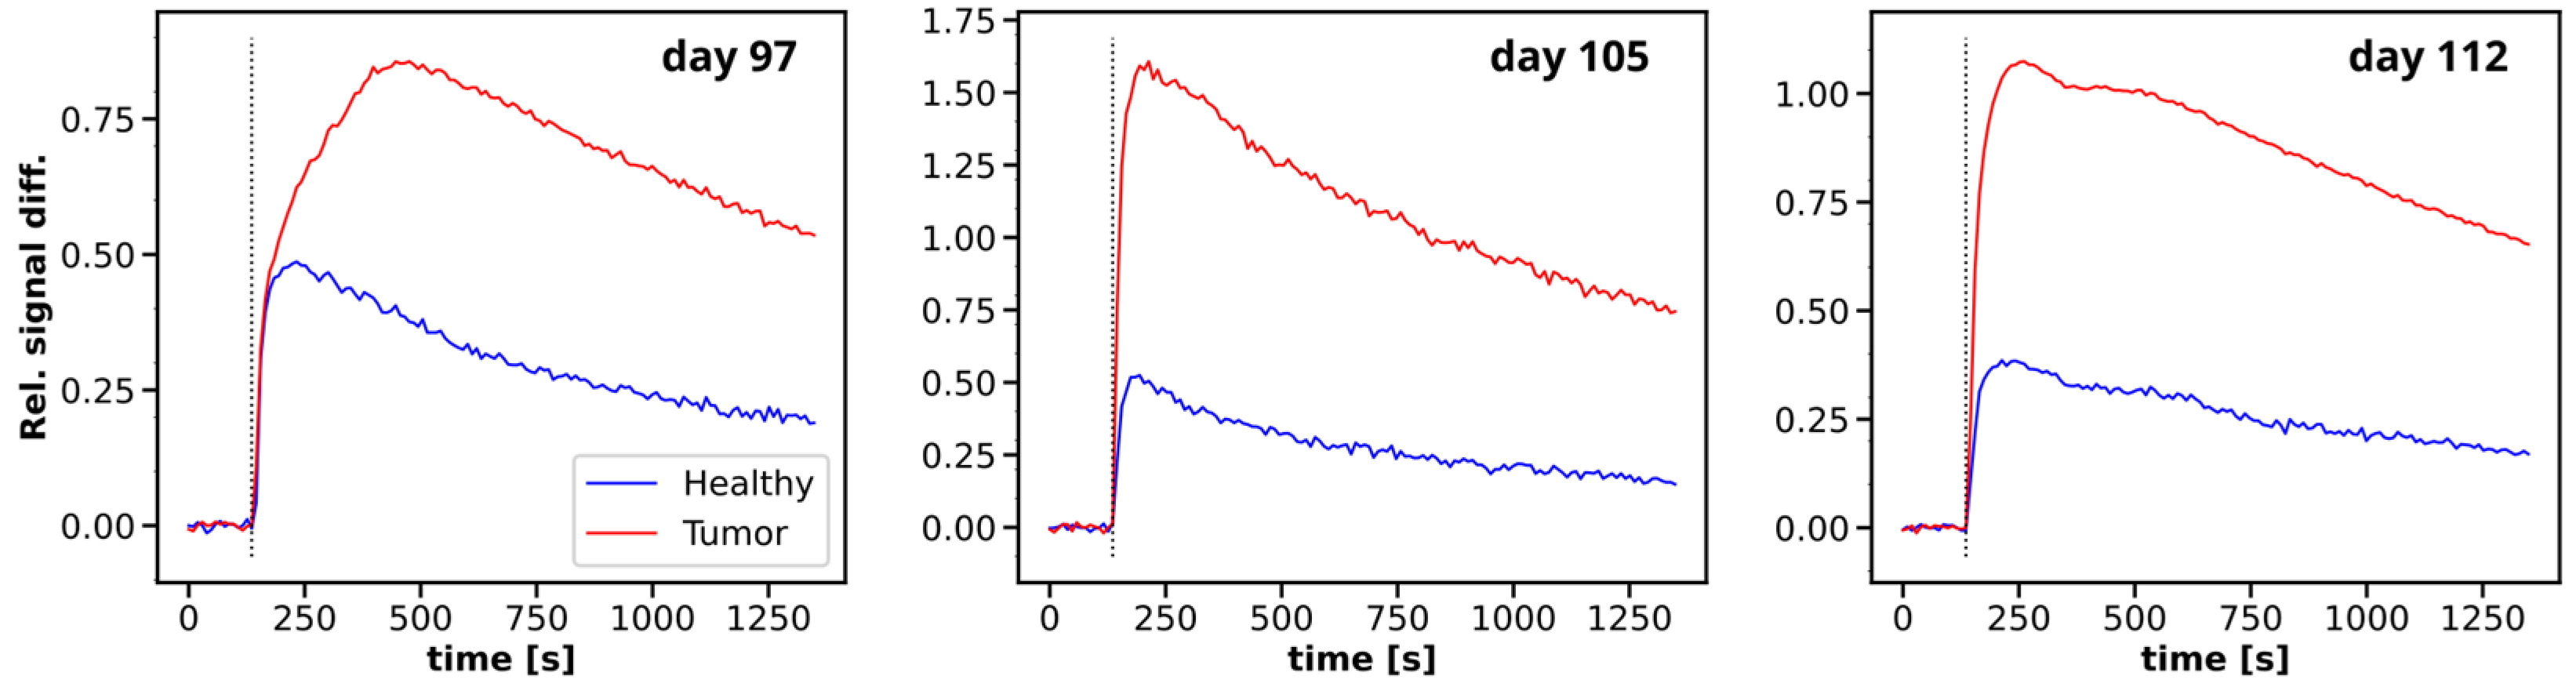
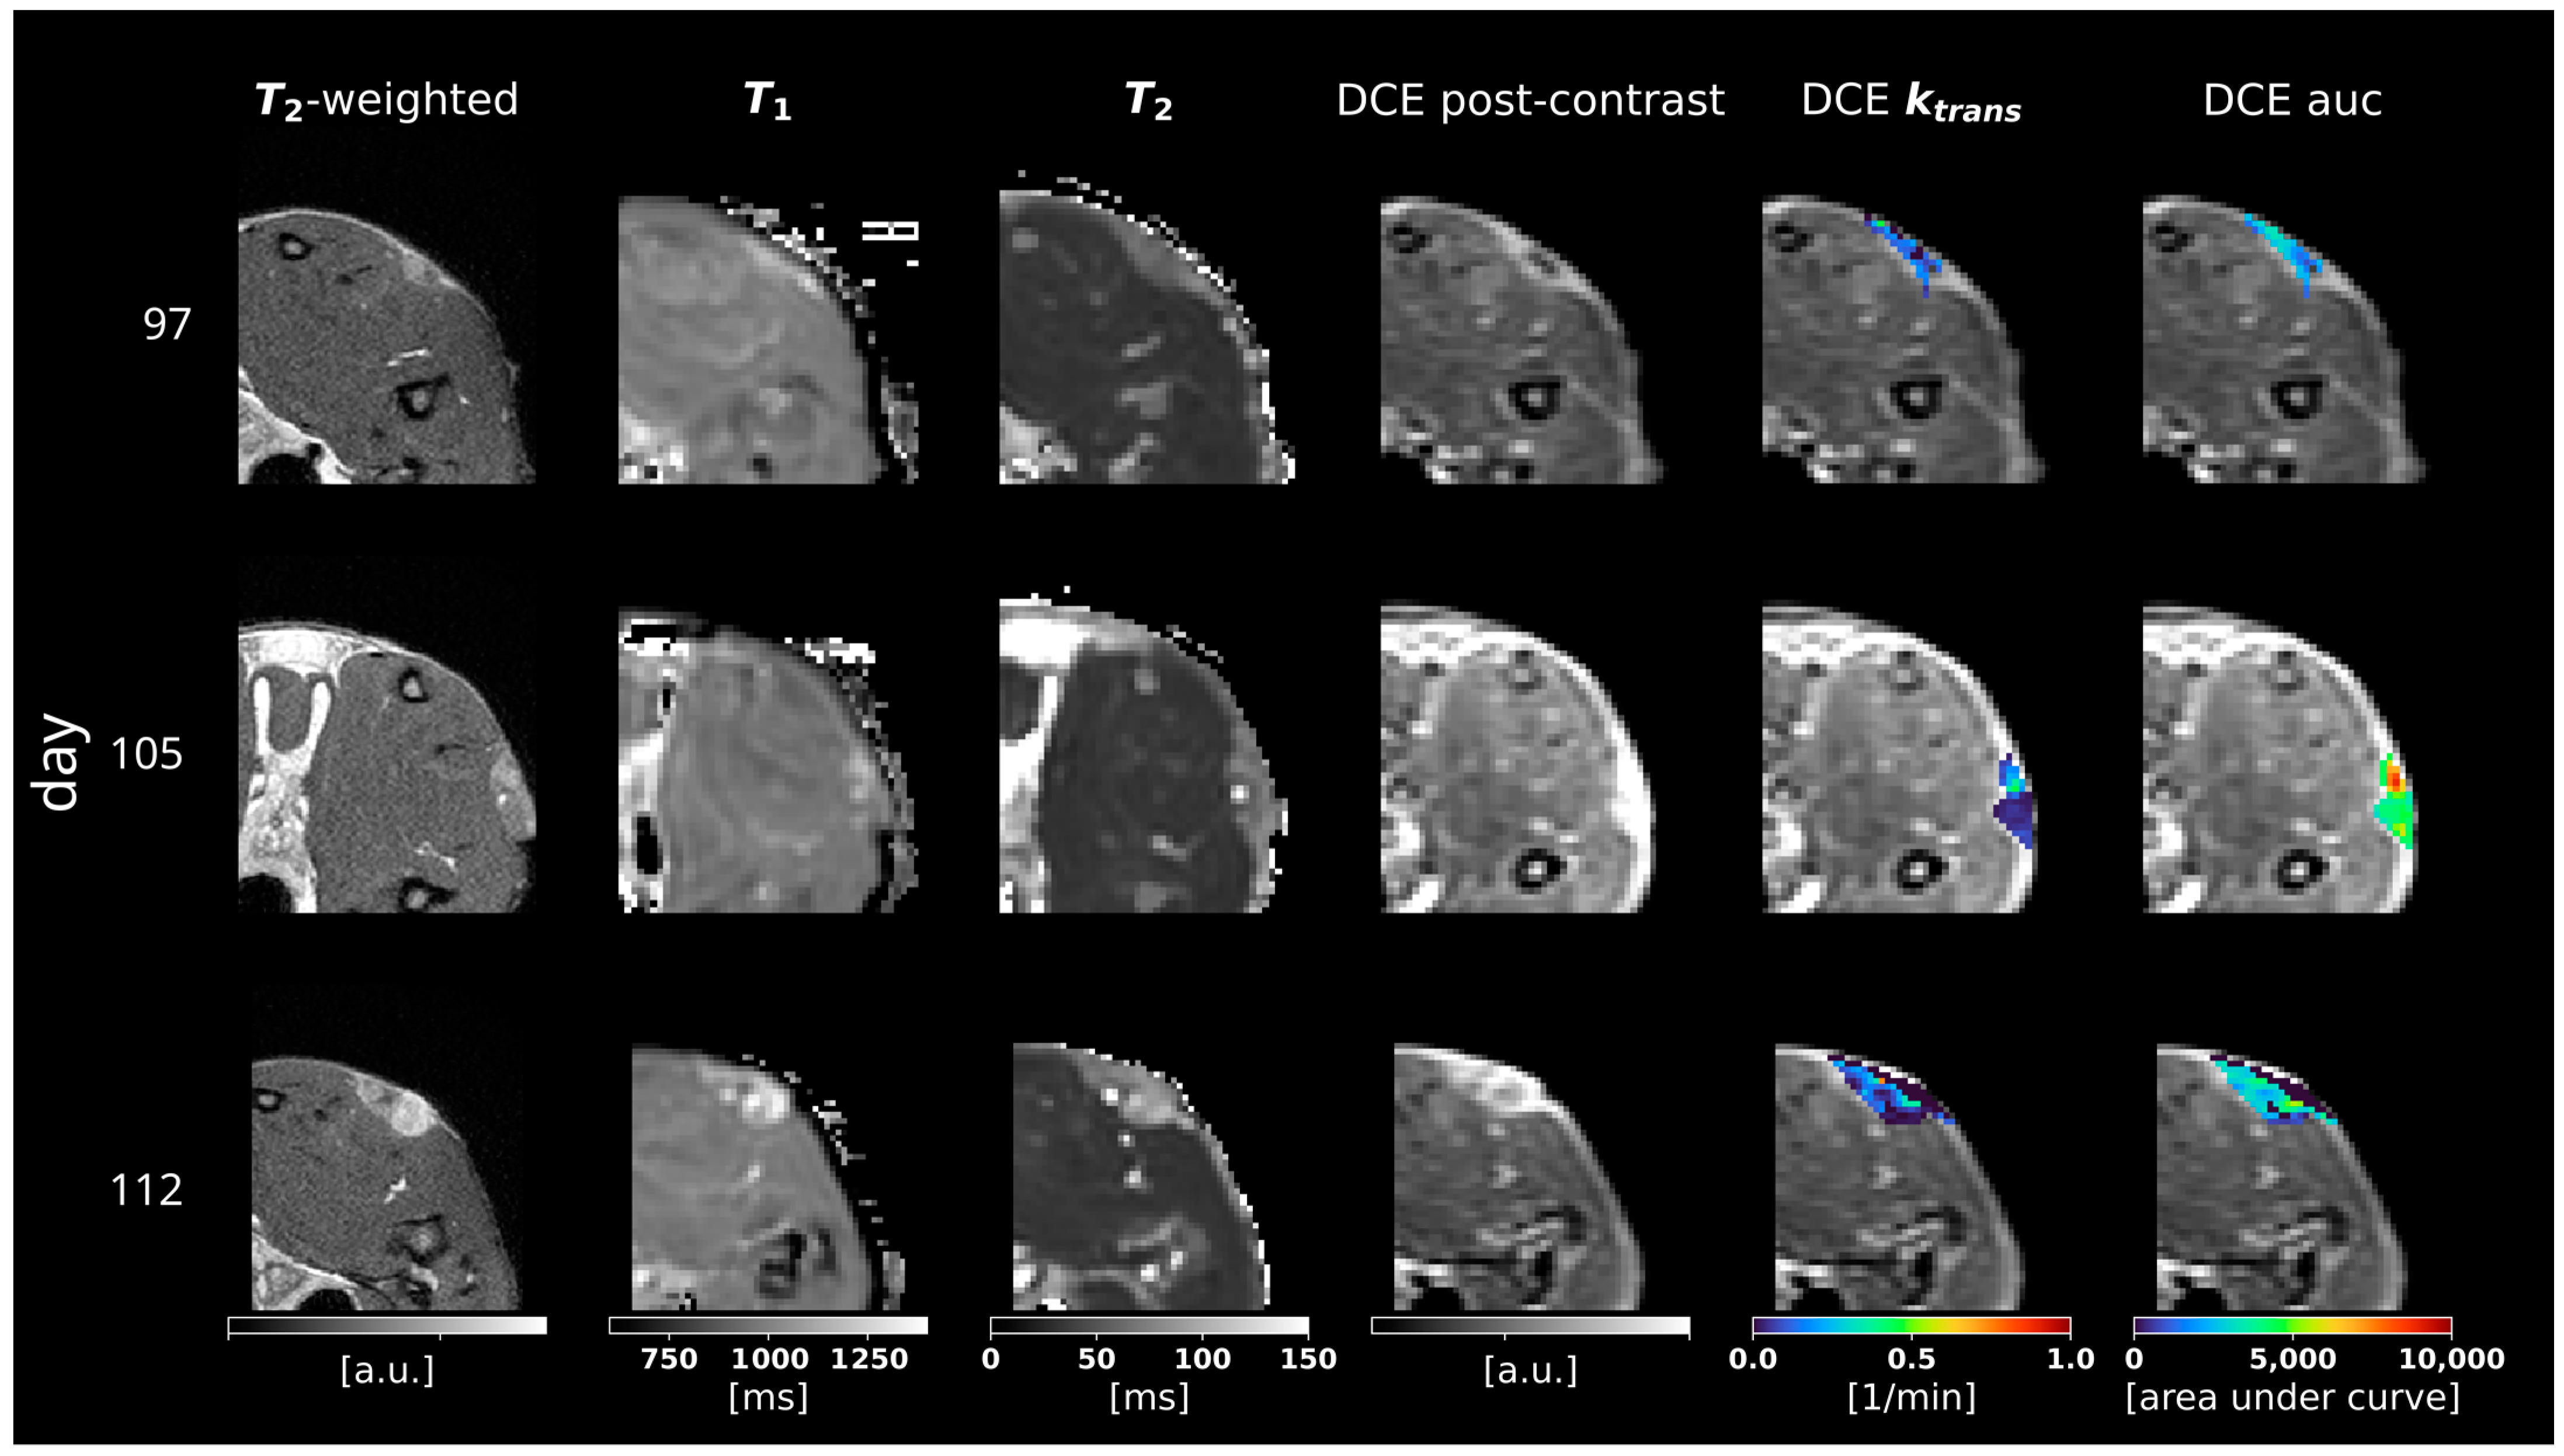
3.2. Multiparametric MRI

Examples for the acquired DCE signal magnitude curves are illustrated for three time points in Figure 4, while the calculated relaxation parameters can be found in Figure 5. The non-contrast T1 relaxation time in the tumor tissue showed moderately higher values compared to healthy muscle and remained at a constantly high level over the acquisition period. The tumors exhibited clear hyperintense contrast in the T1 maps, with an average difference of 80 to 250 ms (up to 1240 ms in tumors compared to 930 ms to 990 ms in tissue), which is comparable to other murine PDAC tumor models found in the literature [39,40].
The initial T2 values in the tumor tissue showed higher relaxation values compared to muscle (mean values of 60 to 90 ms in tumors compared to about 35 ms in muscles), which are slightly higher than those described in other small animal PDAC models [39]. Over time, the T2 relaxation times increased significantly in the central locations of the tumor and reached up to 110 ms, indicating the presence of cystic liquid formations within the lesion.
Due to the high perfusion and presence of malformed vascular structures within the PDAC tissue, the tumor showed significantly increased signal intensity after contrast agent injection in DCE images compared to healthy tissue, as displayed in Figure 5. As a measure of capillary permeability, the average tumor ktrans values ranged from 0.05 to 0.12 min−1, which is similar to other preclinical pancreatic cancer tumor models [41,42,43].

3.3. 68Ga-FAPI-46 PET Imaging

All tumors showed an immediate uptake of 68Ga-FAPI-46, which was higher in the bigger tumors of rat #1 compared to the small tumors of rat #2 (Figure 6). Other than the tumor tissue and the urinary bladder, through which the tracer is excreted, no other organ of the lower abdomen showed any notable uptake. The bigger tumors were heterogeneous, with a higher tracer uptake at the outer rim, while the center seemed to be necrotic. In the smaller tumors, the highest uptake was seen in the center.

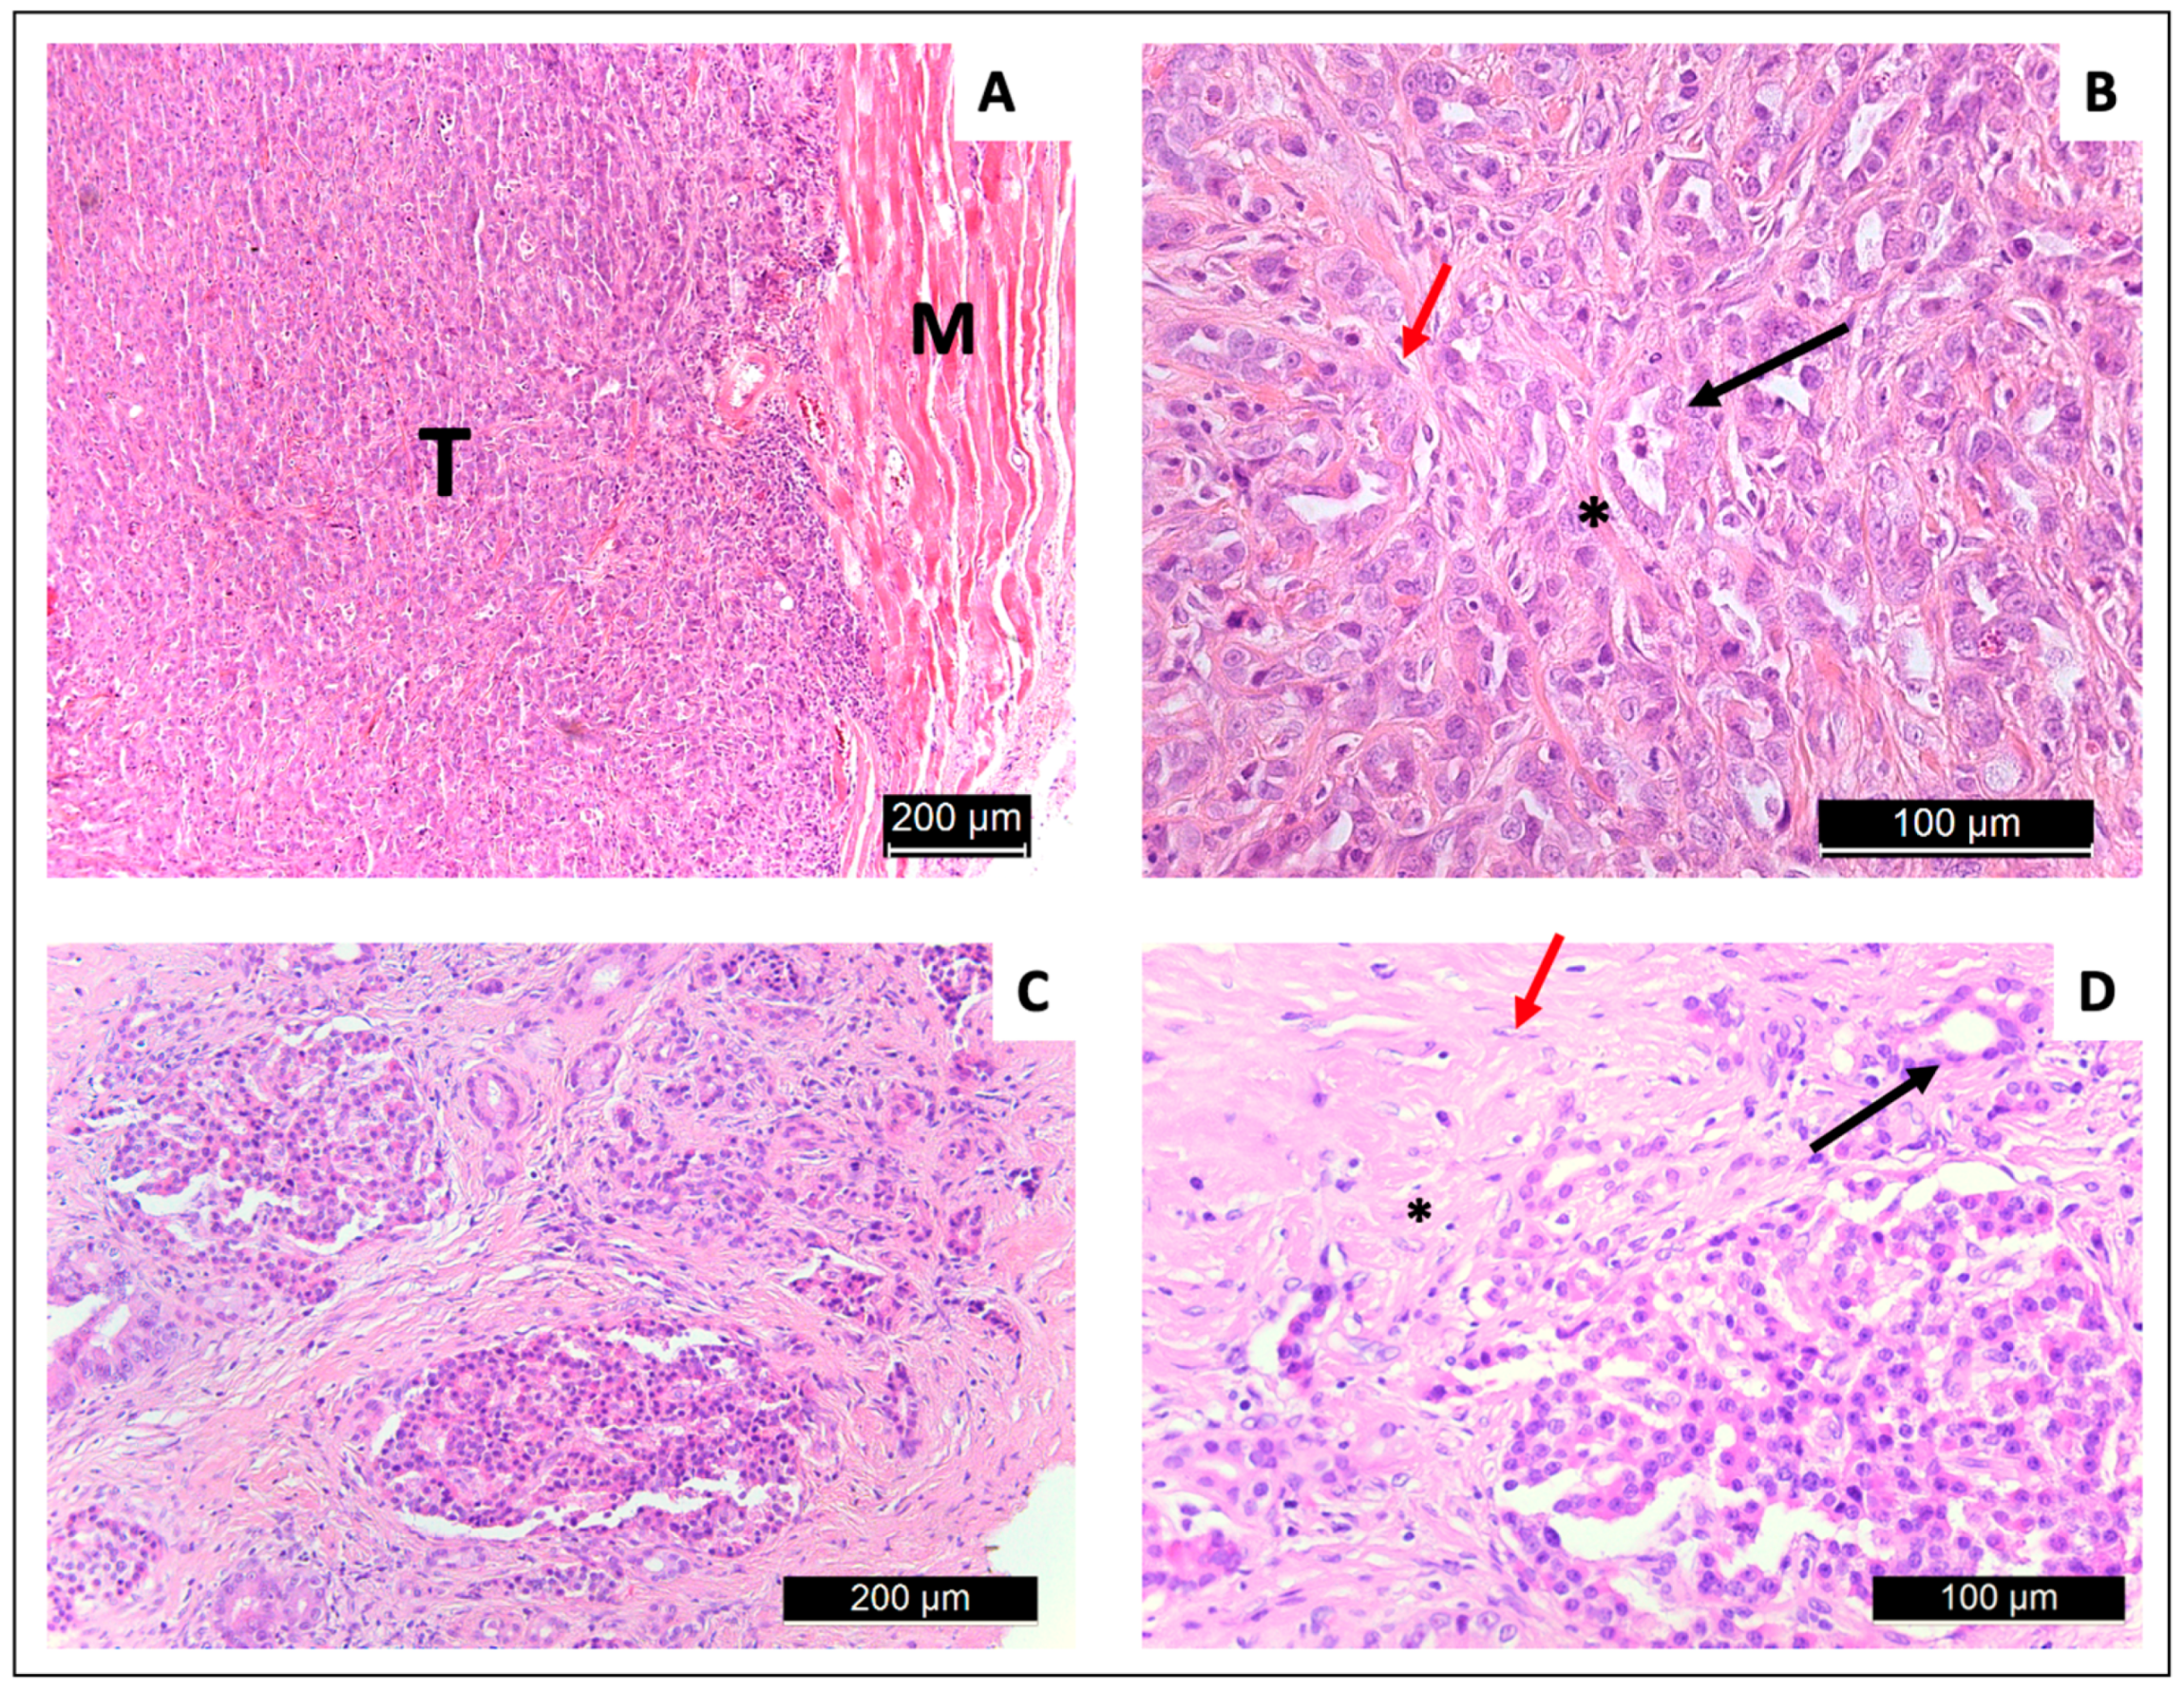
3.4. Tissue Extraction and Histology

Macroscopically, solid and well-defined tumor tissue was present. This is histologically composed of abundant tumor cells that repeatedly form primitive ductular structures. In the peritumoral stroma, located interstitially among the tumor cells, CAFs were identified. All tumors showed a phenotype corresponding to ductal-type adenocarcinomas in HE-stained sections (Figure 7).

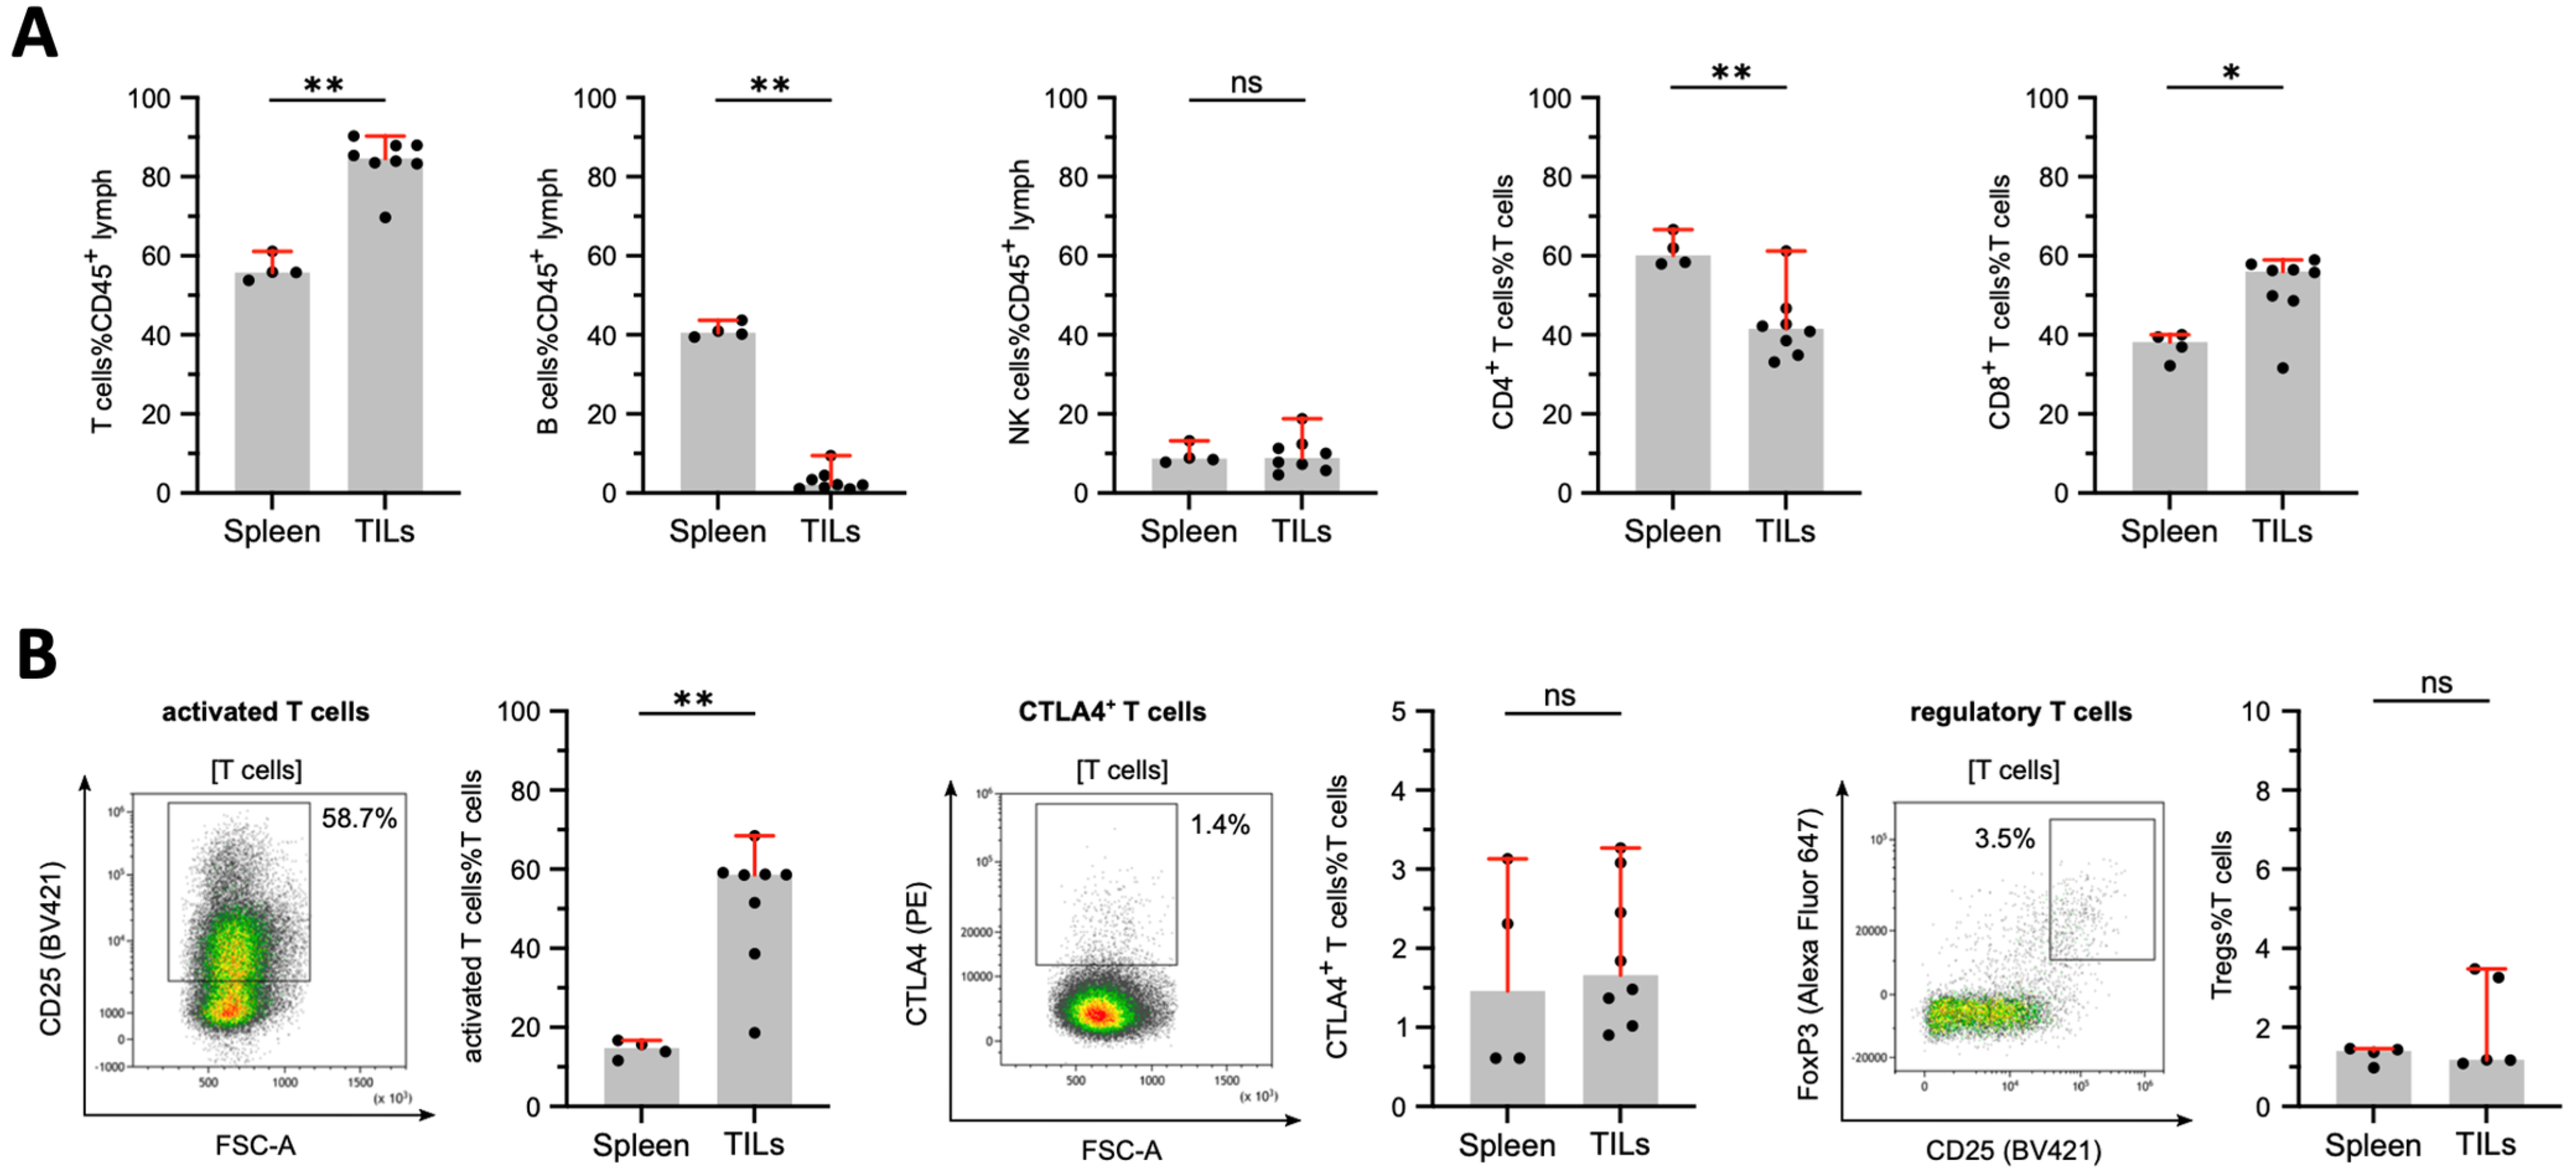
3.5. Tumor-Infiltrating Lymphocytes in DSL-6A/C1 Pancreatic Ductal Adenocarcinoma Tumors

TILs from DSL-6A/C1 tumors (left and right flank) with splenocytes of these rats (n = 4) were compared and showed an increase in CD3+ T cells in terms of percent of all CD45+ lymphocytes in TILs compared to splenocytes (Figure 8B). In the T cell fraction of TILs, an increased percentage of CD8+ cytotoxic T cells was found, whereas the percentage of the CD4+ T cell compartment was reduced in TILs compared to splenocytes. In addition, the flow cytometric analysis revealed that TILs contained fewer B cells, but similar percentages of NK cells compared with splenocytes (Figure 8B).
Next, functionally distinct subsets of these lymphocyte lineages based on specific phenotypes were analyzed and showed increased percentages of activated T cells in TILs, but similar percentages of regulatory T cells and similar expression levels of the co-inhibitory molecule CTLA-4 compared with splenocytes of tumor-bearing rats (Figure 1).

4. Discussion

The DSL-6A/C1 tumor cells were initially derived from an acinar cell carcinoma and displayed genetical characteristics of both acinar cell carcinoma and PDAC [44]. Our histological results, obtained from established tumors, showed features of PDAC, such as malformed pancreatic ductal malignant cells and CAFs in the tumor stroma [33,44]. Nevertheless, compared to human PDAC and tumor models in mice, the DSL-6A/C1 tumors showed a less pronounced deposition of collagen and desmoplastic stroma reaction [25,45]. The histology shows a more displacing growth pattern rather than infiltration of the surrounding tissue, which might be a result of the s.c. growth. A more infiltrative growth is described for this tumor model after orthotopic implantation in reference [38].
The tumor microenvironment plays a crucial role in cancer’s progression, metastasis, and response to therapies. Our findings highlight distinct immune landscapes in TILs compared to splenocytes. The increased presence of CD8+ cytotoxic T cells within the tumor microenvironment suggests an augmented anti-tumor immune response which, in human subjects, seems to be an indicator for longer survival [46]. In contrast, the observed decreased CD4+ T cell fraction raises questions about tumor-mediated immune alterations [47].
Interestingly, the reduced B cell prevalence in TILs might indicate a diminished role for humoral immunity in the tumor microenvironment, while the consistent NK cell percentages suggest unchanged innate immune surveillance. The elevated activated T cell percentages within TILs demonstrate the heightened immune reactions against tumor antigens. However, the parallel expression of regulatory T cells and the co-inhibitory molecule CTLA-4 between TILs and splenocytes hint at potential immune modulation within the tumor [48,49]. Comparatively, the immune profile of the DSL6-A/C1 tumor model exhibits a unique signature that is not commonly observed in other preclinical models, particularly in the context of CD8+ T cell infiltration [50]. Especially the relatively high inflammatory effector cells, such as NK cells and CD8+ T cells are, in humans, generally associated with longer survival and less aggressive tumor growth [51], which needs to be considered when using this tumor model for immunological studies on PDAC progression. Nevertheless, the balance between effector and regulatory elements within the DSL6-A/C1 model could offer valuable insights into the mechanisms of immune evasion, which are pivotal in the design of immunotherapies [52]. As flow cytometry was used as a method for in-depth characterization of TILs but with a lack of spatial resolution, a pronounced tumor rim location of the immune cells is possible and needs further investigation. Furthermore, the unique genetical characteristics, with a lack of the typical Tp53 and KRAS mutations and properties of both ductal and acinar pancreatic carcinoma, that is described in the literature need to be taken into account when further analyzing the immune signaling of the DSl-6A/C1 PDAC tumor model [44].
Tumors were further characterized with multimodal, multiparametric MRI and PET imaging. On MR scans, tumorous tissue produced clear contrast in multiple MRI parameters, such as an increased contrast on T1- and T2-weighted images. The T1 and T2 relaxation values are significantly higher compared to the surrounding tissue and in the range reported from other groups analyzing the DSL-6A/C1 tumor model and for other tumors induced in the pancreatic head [53,54]. The T2-weighted scans also revealed increasing intralesional edema, observable in almost all tumors at later time points, which is a consequence of a central necrosis. The latter is typically observed at the late stages in poorly perfused malignant tumors. In contrast to the typical hypointense human PDAC, DCE MR acquisitions of s.c. DSl-6A/C1 tumors show an increase in contrast agent enhancement at the tumor rim and, in the early stages, within the tumor compared to healthy tissue. A possible explanation is the subcutaneous localization that might contribute to an atypical vascularization pattern, which is divergent from orthotopic tumors. Moreover, a maintained localized inflammatory response could also account for the observed peripheral enhancement in the later stages of tumor progression. These findings need further investigation in future studies but might underscore the importance of tumors’ microenvironment and location in mediating vascular dynamics and may have implications for the interpretation of imaging results and the design of therapeutic strategies. However, poorly perfused intralesional areas associated with central necrosis are found in later stages of tumor progression. The relatively dense tumor stroma is also reflected by low ktrans values derived from DCE-MR measurements. The ktrans values are considerably lower compared to human PDAC [55], but similar compared to other fast-growing murine subcutaneous tumor models [41,43].
PET imaging using 68Ga-FAPI tracers demonstrated strong uptake in all tumor tissues, with low off-target uptake of the tracer and urinary excretion. The tracer binds specifically to the FAP protein, which is overexpressed on CAFs. Our histological findings confirm the presence of CAFs in the tumor microenvironment, which may explain the significant uptake of tracers within the tumor, along with the high sensitivity of PET imaging. However, recent studies also showed that FAP can be overexpressed on cancer cells themselves, among others also in human-derived pancreatic cancer cell lines [56,57,58]. So far, the FAP expression of DSL-6A/C1 has not been investigated, but it will be the topic of a future study. Furthermore, 68Ga-FAPI uptake can not only be seen in CAF, but also in non-malignant conditions, such as inflammatory lymph nodes, artherosclerosis, or surgical scars [59]. Nevertheless, the high tracer uptake is described in 68Ga-FAPI PET images obtained from human PDAC patients [22,60]. CAFs have been identified as a target in tumor diagnosis and therapy, as they seem to play a key role in various parts of tumor development, such as tumor growth, metastasis formation, and the immune response [61,62]. Clinically, 68Ga-FAPI-PET imaging can be used to screen for distant metastases, but also to evaluate therapy efficacy and to optimize staging in the context of therapy planning [22,23].
No local or distant metastases were detected by post-mortem workup of the organs and on 68Ga-FAPI-PET. Notably, also no local lymph node metastases were found in the iliac and inguinal stromal areas. However, distant metastases to lymph nodes and the liver have been described in the literature for this tumor model [54], but since these occurred in tumors that grew orthotopically in the pancreas, the reason may be a consequence of our protocol, where tumors were implanted subcutaneously in the hind legs.
Generally, subcutaneous DSL-6A/C1 tumors show a heterogenous growth pattern, with exponential growth after a variable and sometimes relatively long time lag ranging from 40 to 100 days after implantation. Nevertheless, the average tumor volume of 815 mm3 after 100 days is significantly larger compared to the tumor volumes which can be achieved in in mice. This model is therefore particularly advantageous for studying certain physical therapeutic interventions using devices such as radiofrequency applicators or magnetic resonance-guided high-intensity focused ultrasound (MR-HIFU) [63]. Furthermore, the slow-growing tumors together with the high uptake of FAP-specific tracers offer the possibility to study different PET tracers in consecutive imaging studies within the same animal. Therefore, less animals are needed for tracer development, and the results are less affected by inter-animal variations or rapid tumor growth, which is often associated with large changes in the uptake pattern.
Limiting factors in terms of the usability of the DSL-6A/C1 model are the frequent formation of intralesional edema in the late stages of tumor growth and the heterogeneous growth pattern, resulting in a relatively unpredictable treatment window for interventional therapies. Also, the subcutaneous models may show differences in their microenvironment and metastasis formation compared to an orthotopic tumor implantation, which has not yet been investigated. In female rats, no tumor growth was observed due to unknown reasons.

5. Conclusions

In summary, we have demonstrated in initial experiments that the DSL-6A/C1 tumor model, particularly due to its high tumorigenicity, 68Ga-FAPI sensitivity, and tumor size, is a suitable alternative to established small animal models for many forms of preclinical analysis and therapeutic studies of PDAC.

Author Contributions

Conceptualization, H.G.; methodology, H.G.; software, P.R. and J.L.; validation, P.S., J.L. and P.R.; formal analysis, P.S., P.R., J.L., M.T., H.E. and A.Q.; investigation, P.S., M.S., P.R., J.L., M.T., S.S. and J.J.; resources, P.S., M.S., J.J., S.S., A.Q., M.T., H.A.S., H.E. and T.F.; data curation, P.R. and J.L.; writing—original draft preparation, P.S.; writing—review and editing, all authors; visualization, P.S., J.L., M.T., S.S., H.E., A.Q. and H.A.S.; supervision, H.G. and J.L.; project administration, H.G.; funding acquisition, H.G. All authors have read and agreed to the published version of the manuscript.

Funding

This research was supported by the German Federal Ministry of Education and Research (BMBF), grant number 13GW0364D (“MR-HIFU Pancreas”).

Institutional Review Board Statement

All animal experiments were conducted in accordance with local institutional guidelines and approved by the LANUV (Landesamt für Natur, Umwelt und Verbraucherschutz, Northrine-Westphalia, Germany; protocol code: AZ 81-02.04.2018.A299 and date for the approval: 1 December 2018).

Data Availability Statement

The data presented in this study are available in the article.

Acknowledgments

We thank SOFIE for providing the [68Ga] Ga-FAPI-46 precursor free of charge.

Conflicts of Interest

The authors declare no conflicts of interest.

Appendix A

Table A1. List of antibodies used for the immunological analysis of the DSL-6A/C1 tumors.
AntibodyFluorochromeCloneHostCompanyCatalogue
Zombie Aqua Biolegend423102
CD38FITCREA683Human cell lineMiltenyi130-110-277
CD3FITCREA223Human cell lineMiltenyi130-102-678
IgGPerCp Cy5.5Poly4054GoatBiolegend405424
CD8aPerCP-Vio 700REA437Human cell lineMiltenyi130-132-092
CD54PE1A29MouseBiolegend202405
CD11aPEREA596Human cell lineMiltenyi130-109-171
CD152 (CTLA4)PEWKH203MouseBiolegend203007
CD27PE Dazzle 594LG.3A10Armenian HamsterBiolegend124228
CD45RAPE-Cy7OX-33MouseBiolegend202316
CD161PE-Vio 770REA227Human cell lineMiltenyi130-102-714
CD86APC24FMouseMiltenyi130-109-130
CD314 (NKG2D)APCREA471Human cell lineMiltenyi130-106-992
FoxP3Alexa Fluor 647150DMouseBiolegend320014
CD45Alexa Fluor 700OX-1MouseBiolegend202218
CD4APC Cy7W3/25MouseBiolegend201518
CD80BV4213H5MouseBD743863
CD25BV421OX-39MouseBD565608
CD134 (OX40)BV421OX-40MouseBD744815

References

  1. Ferlay, J.; Colombet, M.; Soerjomataram, I.; Mathers, C.; Parkin, D.M.; Piñeros, M.; Znaor, A.; Bray, F. Estimating the Global Cancer Incidence and Mortality in 2018: GLOBOCAN Sources and Methods. Int. J. Cancer 2019, 144, 1941–1953. [Google Scholar] [CrossRef]
  2. Dyba, T.; Randi, G.; Bray, F.; Martos, C.; Giusti, F.; Nicholson, N.; Gavin, A.; Flego, M.; Neamtiu, L.; Dimitrova, N.; et al. The European Cancer Burden in 2020: Incidence and Mortality Estimates for 40 Countries and 25 Major Cancers. Eur. J. Cancer 2021, 157, 308–347. [Google Scholar] [CrossRef]
  3. Coleman, M.; Forman, D.; Bryant, H.; Butler, J.; Rachet, B.; Maringe, C.; Nur, U.; Tracey, E.; Coory, M.; Hatcher, J.; et al. Cancer Survival in Australia, Canada, Denmark, Norway, Sweden, and the UK, 1995–2007 (the International Cancer Benchmarking Partnership): An Analysis of Population-Based Cancer Registry Data. Lancet 2011, 377, 127–138. [Google Scholar] [CrossRef]
  4. Wood, L.D.; Canto, M.I.; Jaffee, E.M.; Simeone, D.M. Pancreatic Cancer: Pathogenesis, Screening, Diagnosis, and Treatment. Gastroenterology 2022, 163, 386–402.e1. [Google Scholar] [CrossRef]
  5. Zhang, L.; Sanagapalli, S.; Stoita, A. Challenges in Diagnosis of Pancreatic Cancer. World J. Gastroenterol. 2018, 24, 2047–2060. [Google Scholar] [CrossRef]
  6. Conroy, T.; Desseigne, F.; Ychou, M.; Bouché, O.; Guimbaud, R.; Bécouarn, Y.; Adenis, A.; Raoul, J.-L.; Gourgou-Bourgade, S.; de la Fouchardière, C.; et al. FOLFIRINOX versus Gemcitabine for Metastatic Pancreatic Cancer. N. Engl. J. Med. 2011, 364, 1817–1825. [Google Scholar] [CrossRef]
  7. Hosein, A.N.; Brekken, R.A.; Maitra, A. Pancreatic Cancer Stroma: An Update on Therapeutic Targeting Strategies. Nat. Rev. Gastroenterol. Hepatol. 2020, 17, 487–505. [Google Scholar] [CrossRef]
  8. Schima, W.; Böhm, G.; Rösch, C.S.; Klaus, A.; Függer, R.; Kopf, H. Mass-Forming Pancreatitis versus Pancreatic Ductal Adenocarcinoma: CT and MR Imaging for Differentiation. Cancer Imaging 2020, 20, 52. [Google Scholar] [CrossRef]
  9. Klapman, J.; Malafa, M.P. Early Detection of Pancreatic Cancer: Why, Who, and How to Screen. Cancer Control 2008, 15, 280–287. [Google Scholar] [CrossRef]
  10. Bronstein, Y.L.; Loyer, E.M.; Kaur, H.; Choi, H.; David, C.; DuBrow, R.A.; Broemeling, L.D.; Cleary, K.R.; Charnsangavej, C. Detection of Small Pancreatic Tumors with Multiphasic Helical CT. Am. J. Roentgenol. 2004, 182, 619–623. [Google Scholar] [CrossRef]
  11. Prokesch, R.W.; Chow, L.C.; Beaulieu, C.F.; Bammer, R.; Jr, R.B.J. Isoattenuating Pancreatic Adenocarcinoma at Multi–Detector Row CT: Secondary Signs. Radiology 2002, 224, 764–768. [Google Scholar] [CrossRef]
  12. Kayal, N.E.; Lennartz, S.; Ekdawi, S.; Holz, J.; Slebocki, K.; Haneder, S.; Wybranski, C.; Mohallel, A.; Eid, M.; Grüll, H.; et al. Value of Spectral Detector Computed Tomography for Assessment of Pancreatic Lesions. Eur. J. Radiol. 2019, 118, 215–222. [Google Scholar] [CrossRef]
  13. Beall, P.T.; Asch, B.B.; Chang, D.C.; Medina, D.; Hazlewood, C.F. Distinction of Normal, Preneoplastic, and Neoplastic Mouse Mammary Primary Cell Cultures by Water Nuclear Magnetic Resonance Relaxation Times. J. Natl. Cancer Inst. 1980, 64, 335–338. [Google Scholar] [CrossRef]
  14. Gambarota, G.; Veltien, A.; van Laarhoven, H.; Philippens, M.; Jonker, A.; Mook, O.R.; Frederiks, W.M.; Heerschap, A. Measurements of T1 and T2 Relaxation Times of Colon Cancer Metastases in Rat Liver at 7 T. Magn. Reson. Mater. Phys. Biol. Med. 2004, 17, 281–287. [Google Scholar] [CrossRef]
  15. Ravoori, M.K.; Nishimura, M.; Singh, S.P.; Lu, C.; Han, L.; Hobbs, B.P.; Pradeep, S.; Choi, H.J.; Bankson, J.A.; Sood, A.K.; et al. Tumor T1 Relaxation Time for Assessing Response to Bevacizumab Anti-Angiogenic Therapy in a Mouse Ovarian Cancer Model. PLoS ONE 2015, 10, e0131095. [Google Scholar] [CrossRef]
  16. Muraoka, N.; Uematsu, H.; Kimura, H.; Imamura, Y.; Fujiwara, Y.; Murakami, M.; Yamaguchi, A.; Itoh, H. Apparent Diffusion Coefficient in Pancreatic Cancer: Characterization and Histopathological Correlations. J. Magn. Reson. Imaging 2008, 27, 1302–1308. [Google Scholar] [CrossRef]
  17. Karaosmanoglu, A.D.; Onur, M.R.; Ozmen, M.N.; Akata, D.; Karcaaltincaba, M. Magnetic Resonance Imaging of Liver Metastasis. Semin. Ultrasound Ct Mri 2016, 37, 533–548. [Google Scholar] [CrossRef]
  18. Nguyen, H.T.; Jia, G.; Shah, Z.K.; Pohar, K.; Mortazavi, A.; Zynger, D.L.; Wei, L.; Yang, X.; Clark, D.; Knopp, M.V. Prediction of Chemotherapeutic Response in Bladder Cancer Using K-means Clustering of Dynamic Contrast-enhanced (DCE)-MRI Pharmacokinetic Parameters. J. Magn. Reson. Imaging 2015, 41, 1374–1382. [Google Scholar] [CrossRef]
  19. Hectors, S.J.C.G.; Jacobs, I.; Moonen, C.T.W.; Strijkers, G.J.; Nicolay, K. MRI Methods for the Evaluation of High Intensity Focused Ultrasound Tumor Treatment: Current Status and Future Needs. Magn. Reson. Med. 2016, 75, 302–317. [Google Scholar] [CrossRef]
  20. Chen, Y.; McAndrews, K.M.; Kalluri, R. Clinical and Therapeutic Relevance of Cancer-Associated Fibroblasts. Nat. Rev. Clin. Oncol. 2021, 18, 792–804. [Google Scholar] [CrossRef]
  21. Orimo, A.; Gupta, P.B.; Sgroi, D.C.; Arenzana-Seisdedos, F.; Delaunay, T.; Naeem, R.; Carey, V.J.; Richardson, A.L.; Weinberg, R.A. Stromal Fibroblasts Present in Invasive Human Breast Carcinomas Promote Tumor Growth and Angiogenesis through Elevated SDF-1/CXCL12 Secretion. Cell 2005, 121, 335–348. [Google Scholar] [CrossRef]
  22. Röhrich, M.; Naumann, P.; Giesel, F.L.; Choyke, P.L.; Staudinger, F.; Wefers, A.; Liew, D.P.; Kratochwil, C.; Rathke, H.; Liermann, J.; et al. Impact of 68Ga-FAPI PET/CT Imaging on the Therapeutic Management of Primary and Recurrent Pancreatic Ductal Adenocarcinomas. J. Nucl. Med. 2021, 62, 779–786. [Google Scholar] [CrossRef]
  23. Zhang, Z.; Jia, G.; Pan, G.; Cao, K.; Yang, Q.; Meng, H.; Yang, J.; Zhang, L.; Wang, T.; Cheng, C.; et al. Comparison of the Diagnostic Efficacy of 68 Ga-FAPI-04 PET/MR and 18F-FDG PET/CT in Patients with Pancreatic Cancer. Eur. J. Nucl. Med. Mol. Iamging 2022, 49, 2877–2888. [Google Scholar] [CrossRef]
  24. Hingorani, S.R.; Wang, L.; Multani, A.S.; Combs, C.; Deramaudt, T.B.; Hruban, R.H.; Rustgi, A.K.; Chang, S.; Tuveson, D.A. Trp53R172H and KrasG12D Cooperate to Promote Chromosomal Instability and Widely Metastatic Pancreatic Ductal Adenocarcinoma in Mice. Cancer Cell 2005, 7, 469–483. [Google Scholar] [CrossRef]
  25. Pham, T.N.D.; Shields, M.A.; Spaulding, C.; Principe, D.R.; Li, B.; Underwood, P.W.; Trevino, J.G.; Bentrem, D.J.; Munshi, H.G. Preclinical Models of Pancreatic Ductal Adenocarcinoma and Their Utility in Immunotherapy Studies. Cancers 2021, 13, 440. [Google Scholar] [CrossRef]
  26. Lee, J.W.; Komar, C.A.; Bengsch, F.; Graham, K.; Beatty, G.L. Genetically Engineered Mouse Models of Pancreatic Cancer: The KPC Model (LSL-KrasG12D/+;LSL-Trp53R172H/+;Pdx-1-Cre), Its Variants, and Their Application in Immuno-oncology Drug Discovery. Curr. Protoc. Pharmacol. 2016, 73, 14.39.1–14.39.20. [Google Scholar] [CrossRef]
  27. Suklabaidya, S.; Dash, P.; Das, B.; Suresh, V.; Sasmal, P.K.; Senapati, S. Experimental Models of Pancreatic Cancer Desmoplasia. Lab. Investig. 2018, 98, 27–40. [Google Scholar] [CrossRef]
  28. Rubio-Viqueira, B.; Jimeno, A.; Cusatis, G.; Zhang, X.; Iacobuzio-Donahue, C.; Karikari, C.; Shi, C.; Danenberg, K.; Danenberg, P.V.; Kuramochi, H.; et al. An In Vivo Platform for Translational Drug Development in Pancreatic Cancer. Clin. Cancer Res. 2006, 12, 4652–4661. [Google Scholar] [CrossRef]
  29. Garrido-Laguna, I.; Uson, M.; Rajeshkumar, N.V.; Tan, A.C.; de Oliveira, E.; Karikari, C.; Villaroel, M.C.; Salomon, A.; Taylor, G.; Sharma, R.; et al. Tumor Engraftment in Nude Mice and Enrichment in Stroma- Related Gene Pathways Predict Poor Survival and Resistance to Gemcitabine in Patients with Pancreatic Cancer. Clin. Cancer Res. 2011, 17, 5793–5800. [Google Scholar] [CrossRef]
  30. Hidalgo, M.; Amant, F.; Biankin, A.V.; Budinská, E.; Byrne, A.T.; Caldas, C.; Clarke, R.B.; de Jong, S.; Jonkers, J.; Mælandsmo, G.M.; et al. Patient-Derived Xenograft Models: An Emerging Platform for Translational Cancer Research. Cancer Discov. 2014, 4, 998–1013. [Google Scholar] [CrossRef]
  31. Partecke, L.I.; Sendler, M.; Kaeding, A.; Weiss, F.U.; Mayerle, J.; Dummer, A.; Nguyen, T.D.; Albers, N.; Speerforck, S.; Lerch, M.M.; et al. A Syngeneic Orthotopic Murine Model of Pancreatic Adenocarcinoma in the C57/BL6 Mouse Using the Panc02 and 6606PDA Cell Lines. Eur. Surg. Res. 2011, 47, 98–107. [Google Scholar] [CrossRef]
  32. Pour, P.; Wallcave, L.; Gingell, R.; Nagel, D.; Lawson, T.; Salmasi, S.; Tines, S. Carcinogenic Effect of N-Nitroso(2-Hydroxypropyl)(2-Oxopropyl)Amine, a Postulated Proximate Pancreatic Carcinogen in Syrian Hamsters. Cancer Res. 1979, 39, 3828–3833. [Google Scholar]
  33. Pettengill, O.S.; Faris, R.A.; Bell, R.H.; Kuhlmann, E.T.; Longnecker, D.S. Derivation of Ductlike Cell Lines from a Transplantable Acinar Cell Carcinoma of the Rat Pancreas. Am. J. Pathol. 1993, 143, 292–303. [Google Scholar]
  34. Yushkevich, P.A.; Piven, J.; Hazlett, H.C.; Smith, R.G.; Ho, S.; Gee, J.C.; Gerig, G. User-Guided 3D Active Contour Segmentation of Anatomical Structures: Significantly Improved Efficiency and Reliability. Neuroimage 2006, 31, 1116–1128. [Google Scholar] [CrossRef]
  35. Look, D.C.; Locker, D.R. Time Saving in Measurement of NMR and EPR Relaxation Times. Rev. Sci. Instrum. 1970, 41, 250–251. [Google Scholar] [CrossRef]
  36. Deichmann, R.; Haase, A. Quantification of T1 Values by SNAPSHOT-FLASH NMR Imaging. J. Magnetic Reson. (1969) 1992, 96, 608–612. [Google Scholar] [CrossRef]
  37. Barnes, S.R.; Ng, T.S.C.; Santa-Maria, N.; Montagne, A.; Zlokovic, B.V.; Jacobs, R.E. ROCKETSHIP: A Flexible and Modular Software Tool for the Planning, Processing and Analysis of Dynamic MRI Studies. BMC Med. Imaging 2015, 15, 19. [Google Scholar] [CrossRef]
  38. Mäkinen, K.; Loimas, S.; Kosma, V.-M.; Wahlfors, J.; Pettengill, O.S.; Longnecker, D.S.; Johansson, R.; Alhava, E. Azaserine-Induced Rat Pancreas Tumor Model with Transplantable Cultured Cells. Pancreas 1998, 16, 160–164. [Google Scholar] [CrossRef]
  39. Vohra, R.; Park, J.; Wang, Y.-N.; Gravelle, K.; Whang, S.; Hwang, J.-H.; Lee, D. Evaluation of Pancreatic Tumor Development in KPC Mice Using Multi-Parametric MRI. Cancer Imaging 2018, 18, 41. [Google Scholar] [CrossRef]
  40. Maloney, E.; Wang, Y.-N.; Vohra, R.; Son, H.; Whang, S.; Khokhlova, T.; Park, J.; Gravelle, K.; Totten, S.; Hwang, J.H.; et al. Magnetic Resonance Imaging Biomarkers for Pulsed Focused Ultrasound Treatment of Pancreatic Ductal Adenocarcinoma. World J. Gastroenterol. 2020, 26, 904–917. [Google Scholar] [CrossRef]
  41. Wegner, C.S.; Hauge, A.; Gaustad, J.-V.; Andersen, L.M.K.; Simonsen, T.G.; Galappathi, K.; Rofstad, E.K. Dynamic Contrast-Enhanced MRI of the Microenvironment of Pancreatic Adenocarcinoma Xenografts. Acta Oncol. 2017, 56, 1754–1762. [Google Scholar] [CrossRef]
  42. Cao, J.; Pickup, S.; Clendenin, C.; Blouw, B.; Choi, H.; Kang, D.; Rosen, M.; O’Dwyer, P.J.; Zhou, R. Dynamic Contrast-Enhanced MRI Detects Responses to Stroma-Directed Therapy in Mouse Models of Pancreatic Ductal Adenocarcinoma. Clin. Cancer Res. 2019, 25, 2314–2322. [Google Scholar] [CrossRef]
  43. Kim, H.; Samuel, S.; Totenhagen, J.W.; Warren, M.; Sellers, J.C.; Buchsbaum, D.J. Dynamic Contrast Enhanced Magnetic Resonance Imaging of an Orthotopic Pancreatic Cancer Mouse Model. J. Vis. Exp. 2015, 98, e52641. [Google Scholar] [CrossRef]
  44. Foley, J.F.; Phadke, D.P.; Hardy, O.; Hardy, S.; Miller, V.; Madan, A.; Howard, K.; Kruse, K.; Lord, C.; Ramaiahgari, S.; et al. Whole Exome Sequencing in the Rat. BMC Genom. 2018, 19, 487. [Google Scholar] [CrossRef]
  45. Majumder, K.; Arora, N.; Modi, S.; Chugh, R.; Nomura, A.; Giri, B.; Dawra, R.; Ramakrishnan, S.; Banerjee, S.; Saluja, A.; et al. A Novel Immunocompetent Mouse Model of Pancreatic Cancer with Robust Stroma: A Valuable Tool for Preclinical Evaluation of New Therapies. J. Gastrointest. Surg. 2016, 20, 53–65. [Google Scholar] [CrossRef]
  46. Ino, Y.; Yamazaki-Itoh, R.; Shimada, K.; Iwasaki, M.; Kosuge, T.; Kanai, Y.; Hiraoka, N. Immune Cell Infiltration as an Indicator of the Immune Microenvironment of Pancreatic Cancer. Br. J. Cancer 2013, 108, 914–923. [Google Scholar] [CrossRef]
  47. Goulart, M.R.; Stasinos, K.; Fincham, R.E.A.; Delvecchio, F.R.; Kocher, H.M. T Cells in Pancreatic Cancer Stroma. World J. Gastroenterol. 2021, 27, 7956–7968. [Google Scholar] [CrossRef]
  48. Foucher, E.D.; Ghigo, C.; Chouaib, S.; Galon, J.; Iovanna, J.; Olive, D. Pancreatic Ductal Adenocarcinoma: A Strong Imbalance of Good and Bad Immunological Cops in the Tumor Microenvironment. Front. Immunol. 2018, 9, 1044. [Google Scholar] [CrossRef]
  49. Anandappa, A.J.; Wu, C.J.; Ott, P.A. Directing Traffic: How to Effectively Drive T Cells into Tumors. Cancer Discov. 2020, 10, 185–197. [Google Scholar] [CrossRef]
  50. Picard, F.S.R.; Lutz, V.; Brichkina, A.; Neuhaus, F.; Ruckenbrod, T.; Hupfer, A.; Raifer, H.; Klein, M.; Bopp, T.; Pfefferle, P.I.; et al. IL-17A-Producing CD8+ T Cells Promote PDAC via Induction of Inflammatory Cancer-Associated Fibroblasts. Gut 2023, 72, 1510–1522. [Google Scholar] [CrossRef]
  51. Muller, M.; Haghnejad, V.; Schaefer, M.; Gauchotte, G.; Caron, B.; Peyrin-Biroulet, L.; Bronowicki, J.-P.; Neuzillet, C.; Lopez, A. The Immune Landscape of Human Pancreatic Ductal Carcinoma: Key Players, Clinical Implications, and Challenges. Cancers 2022, 14, 995. [Google Scholar] [CrossRef]
  52. Hu, Z.I.; O’Reilly, E.M. Therapeutic Developments in Pancreatic Cancer. Nat. Rev. Gastroenterol. Hepatol. 2024, 21, 7–24. [Google Scholar] [CrossRef]
  53. Yin, T.; Peeters, R.; Feng, Y.; Liu, Y.; Yu, J.; Dymarkowski, S.; Himmelreich, U.; Oyen, R.; Ni, Y. Characterization of a Rat Orthotopic Pancreatic Head Tumor Model Using Three-dimensional and Quantitative Multi-parametric MRI. NMR Biomed. 2017, 30, e3676. [Google Scholar] [CrossRef]
  54. Zhang, Z.; Zheng, L.; Li, W.; Gordon, A.C.; Huan, Y.; Shangguan, J.; Procissi, D.; Bentrem, D.J.; Larson, A.C. Quantitative Functional MRI in a Clinical Orthotopic Model of Pancreatic Cancer in Immunocompetent Lewis Rats. Am. J. Transl. Res. 2015, 7, 1475–1486. [Google Scholar]
  55. Klaassen, R.; Steins, A.; Gurney-Champion, O.J.; Bijlsma, M.F.; Tienhoven, G.; Engelbrecht, M.R.W.; Eijck, C.H.J.; Suker, M.; Wilmink, J.W.; Besselink, M.G.; et al. Pathological Validation and Prognostic Potential of Quantitative MRI in the Characterization of Pancreas Cancer: Preliminary Experience. Mol. Oncol. 2020, 14, 2176–2189. [Google Scholar] [CrossRef]
  56. Antonova, D.V.; Gnatenko, D.A.; Kotova, E.S.; Pleshkan, V.V.; Kuzmich, A.I.; Didych, D.A.; Sverdlov, E.D.; Alekseenko, I.V. Cell-Specific Expression of the FAP Gene Is Regulated by Enhancer Elements. Front. Mol. Biosci. 2023, 10, 1111511. [Google Scholar] [CrossRef]
  57. Xin, L.; Gao, J.; Zheng, Z.; Chen, Y.; Lv, S.; Zhao, Z.; Yu, C.; Yang, X.; Zhang, R. Fibroblast Activation Protein-α as a Target in the Bench-to-Bedside Diagnosis and Treatment of Tumors: A Narrative Review. Front. Oncol. 2021, 11, 648187. [Google Scholar] [CrossRef]
  58. Shi, M.; Yu, D.-H.; Chen, Y.; Zhao, C.-Y.; Zhang, J.; Liu, Q.-H.; Ni, C.-R.; Zhu, M.-H. Expression of Fibroblast Activation Protein in Human Pancreatic Adenocarcinoma and Its Clinicopathological Significance. World J. Gastroenterol. 2012, 18, 840–846. [Google Scholar] [CrossRef]
  59. Qi, N.; Wang, H.; Wang, H.; Ren, S.; You, Z.; Chen, X.; Guan, Y.; Xie, F.; Hua, F.; Zhao, J. Non-Tumoral Uptake of 68Ga-FAPI-04 PET: A Retrospective Study. Front. Oncol. 2022, 12, 989595. [Google Scholar] [CrossRef]
  60. Guberina, N.; Kessler, L.; Pöttgen, C.; Guberina, M.; Metzenmacher, M.; Herrmann, K.; Mucha, M.; Rischpler, C.; Indenkämpen, F.; Siveke, J.T.; et al. [68Ga]FAPI-PET/CT for Radiation Therapy Planning in Biliary Tract, Pancreatic Ductal Adeno-, and Adenoidcystic Carcinomas. Sci. Rep. 2022, 12, 16261. [Google Scholar] [CrossRef]
  61. Mao, X.; Xu, J.; Wang, W.; Liang, C.; Hua, J.; Liu, J.; Zhang, B.; Meng, Q.; Yu, X.; Shi, S. Crosstalk between Cancer-Associated Fibroblasts and Immune Cells in the Tumor Microenvironment: New Findings and Future Perspectives. Mol. Cancer 2021, 20, 131. [Google Scholar] [CrossRef]
  62. von Ahrens, D.; Bhagat, T.D.; Nagrath, D.; Maitra, A.; Verma, A. The Role of Stromal Cancer-Associated Fibroblasts in Pancreatic Cancer. J. Hematol. Oncol. 2017, 10, 76. [Google Scholar] [CrossRef]
  63. Hendricks-Wenger, A.; Sereno, J.; Gannon, J.; Zeher, A.; Brock, R.M.; Beitel-White, N.; Simon, A.; Davalos, R.V.; Coutermarsh-Ott, S.; Vlaisavljevich, E.; et al. Histotripsy Ablation Alters the Tumor Microenvironment and Promotes Immune System Activation in a Subcutaneous Model of Pancreatic Cancer. IEEE Trans. Ultrason. Ferroelectr. Freq. Control 2021, 68, 2987–3000. [Google Scholar] [CrossRef]
Figure 1. Representative flow cytometry plots and detailed gating strategy of tumor-infiltrating lymphocytes in DSL-6A/C1 tumors. Dead cells were excluded using a zombie dye (alive). Lymphocytes were selected by gating for size and granularity (Forward Scatter Area (FSC-A) versus Side Scatter Area (SSC-A)). Living lymphocytes were further plotted by SSC-H versus SSC-A to gate single cells. From the single cells (singles), lymphocytes (CD45+) were gated based on their CD45 expression. B cells were defined as CD45+ lymphocytes and the expression of CD45RA (B cells). T cells were defined by gating on CD45+ lymphocytes and the expression of CD3 (T cells), whereas CD3 cells expressing CD161 were considered NK cells (NK cells). T cells were further divided into CD8 T cells (CD8 T cells) or CD4 T cells (CD4 T cells).
Cancers 16 01535 g001
Figure 2. Tumor growth as a function of time. For a better overview, tumors were visually divided into fast-growing (dots only), intermediate-growing (solid lines), and slow-growing (dashed lines) tumors (p.i.—post injection). Missing time points reflect early euthanasia related to local COVID-19 restrictions.
Cancers 16 01535 g002
Figure 3. Representative T2 MRI images at various time points after inoculation. Unlike the earlier time points (A,B), the latest time points (CE) show increasing edema (1) and cyst formation (2) within the tumor.
Cancers 16 01535 g003
Figure 4. Average uptake curves of DCE acquisitions for tumor and healthy reference tissue on three different measurement days, illustrated by normalized difference to average baseline signal. Injection time is indicated by vertical black dashed line.
Cancers 16 01535 g004
Figure 5. Representative slices of the acquired overview and quantitative MRI relaxation parameters, as well as the quantitative DCE MRI parameters (columns) at three different measurement days after inoculation (rows). The last three columns show the contrast-enhanced DCE magnitude as an underlay.
Cancers 16 01535 g005
Figure 6. 68Ga-FAPI-46 PET imaging of the DSL-6A/C1 tumors. (A,B) T2 MR images of the the s.c. tumors (T) at the time of PET acquisition showing central necrosis (N) in the larger tumors. (CE) PET measurements with 68Ga-FAPI-46 in the same rats, each bearing two tumors; T1/T2—tumor 1/2; UB—urinary bladder; scale bar: 20 mm.
Cancers 16 01535 g006
Figure 7. HE-stained histology slices of an s.c. DSL-6A/C1 neoplasm (A,B) in comparison to a human PDAC tumor (C,D), showing tumor (T) and muscle tissue (M), in the tumor stroma cancer-associated fibroblasts (red arrows) are present. Tumor cells forming tubulo-ductular structures (black arrows) and collagenous fibers (*) are found. Both carcinomas (rat and human) are formed by ductularly arranged tumor cells.
Cancers 16 01535 g007
Figure 8. Tumor-infiltrating lymphocytes in DSL-6A/C1 tumors. (A) Lymphocyte subset in percent of all living lymphocytes. (B) Activated T cells (CD25+ T cells), regulatory T cells (CD4+CD25highFoxP3+ T cells), and CTLA4+ T cells in percent of all T cells. Significant differences, determined by the nonparametric, unpaired, two-tailed Mann-Whitney test, are denoted by asterisks (* p ≤ 0.05, ** p ≤ 0.01, ns: not significant). Mean ± 95% confidence interval is indicated in red where applicable.
Cancers 16 01535 g008
Table 1. Summary of MRI scanning parameters.
ProtocolTSE2DFFE2DT2MAPT1MAPDCE
Sequence Type2D TSE2D FFE2D TSEIR Look–Locker3D FFE
TE (ms)304.86.25 + n × 253.72.8
TR (ms)121172301197080006
Field of View (mm3)~90 × 60 × 50~90 × 60 × 6660 × 60 × 2160 × 60 × 2160 × 60 × 20
Reconstruction voxel size (mm3)0.2 × 0.2 × 1.00.28 × 0.28 × 1.000.63 × 0.63 × 2.10.63 × 0.63 × 2.10.62 × 0.62 × 0.7
Acquisition voxel size (mm3)0.3 × 0.3 × 10.3 × 0.3 × 10.94 × 0.94 × 2.10.94 × 1.00 × 2.10.7 × 0.7 × 0.7
NSA12
Flip Angle (°)906090515
No. of frames (Slices)4060101029
Fat saturationnonoSPIRSPIRno
Other parameters TI = 22 + n × 100 msRF-spoiled, dyn. scan time = 9.7 s
Abbreviations: TSE: Turbo Spin Echo; FFE: Fast Field Echo; IR: Inversion Recovery; n: echo number [0, …, 15] for T2MAP and [0, …, 64] for T1MAP, respectively; SPIR: Spectral Presaturation with Inversion Recovery; RF: Radiofrequency.
Disclaimer/Publisher’s Note: The statements, opinions and data contained in all publications are solely those of the individual author(s) and contributor(s) and not of MDPI and/or the editor(s). MDPI and/or the editor(s) disclaim responsibility for any injury to people or property resulting from any ideas, methods, instructions or products referred to in the content.

