Article

Ni-Ag Catalysts for Hydrogen Production through Dry Reforming of Methane: Characterization and Performance Evaluation

1
Institut Algérien du Pétrole/Sonatrach, Avenue 1er Novembre, Boumerdes 35000, Algeria
2
Département de Génie des Procédés, Faculté de Technologie, Université 20 août 1955, Route d’El Hadaiek, Skikda 21000, Algeria
3
Laboratoire de Physico-Chimie des Matériaux, Faculté des Sciences et de la Technologie, Université Chadli Bendjedid, El-Tarf 36000, Algeria
4
Laboratoire de Chimie des Matériaux, Catalyse et Environnement, Faculté de Chimie, Université des Sciences et de la Technologie Houari Boumediene (USTHB), El-Alia, Bab Ezzouar 16111, Algeria
5
Univ. Lille, CNRS, Centrale Lille, Univ. Artois, UMR 8181—UCCS—Unité de Catalyse et Chimie du Solide, F-59000 Lille, France
*
Author to whom correspondence should be addressed.
Catalysts 2024, 14(7), 400; https://doi.org/10.3390/catal14070400
Submission received: 5 April 2024 / Revised: 15 June 2024 / Accepted: 19 June 2024 / Published: 25 June 2024

Abstract

:
To investigate the influence of Ag and the loading of Ni species, Ni-Ag type catalysts were synthesized with varying Ni/Ag ratios (1, 1.5 and 2) using the coprecipitation method. The catalysts were extensively characterized using various techniques such as TG-DSC-SM, XRD, ICP, BET, SEM-EDX and TPR and subsequently tested in the CH4/CO2 reaction without any pretreatment. Regardless of the ratio employed, a phase mixture containing NiO and Ag was observed after calcination under air between 600 °C and 1200 °C. SEM analysis confirmed the presence of a close interface between Ag and NiO. The specific surface area was found to be significantly higher for the catalyst with lower Ni content (R = 1). TPR analysis demonstrated that the inclusion of Ag facilitated the reduction of Ni at lower temperatures. XRD analyses of the spent catalyst confirmed catalyst reduction during the reaction. Among the samples, a catalyst with Ni/Ag = 1 exhibited superior catalytic activity without any pretreatment under a reduction atmosphere, in which case the conversions of methane and CO2 at 650 °C amounted to 38 and 45 mol%, respectively, with H2/CO = 0.7 and 71 mol% of H2. The presence of Ag species enhances the stability of the Ni catalyst and improves catalytic performance in the dry reforming of methane.

1. Introduction

Recently, there has been significant attention given to the issue of global warming caused by the greenhouse effect. This has led to increased attention on reducing and utilizing greenhouse gases like carbon dioxide and methane. One promising approach is the catalytic reforming of methane with carbon dioxide, called DRM (dry reforming of methane), to produce synthesis gas which is traditionally obtained through the steam reforming of methane [1]. DRM, a reaction first proposed by Fischer and Tropsch in 1928, is a suggested alternative to steam reforming [2] and its relevance will only grow over time [3]. The reforming of CH4 with CO2 offers several advantages, including the production of synthesis gas [4,5,6,7] with a lower hydrogen-to-carbon monoxide ratio and higher energy efficiency for hydrocarbon conversion [8,9,10]. Indeed, compared with commercial methane steam reforming (MSR) process that produces syngas with H2/CO ratio of 3 [11]. In practice, for MSR processes, it is common to use an O/C (oxygen/carbon) ratio higher than 3 to prevent coke deposition. However, this approach comes with an energy penalty due to the need to heat an excessive amount of steam to approximately 800 °C. Additionally, the process of MSR encounters challenges related to corrosion and necessitates the inclusion of a desulfurization unit, as highlighted by Djinović et al. [12]. Furthermore, the DRM process offers cost advantages compared to other methods due to its ability to bypass the complex gas separation of products [13]. Despite the attractive incentives of carbon dioxide reforming of methane, there is currently no established industrial technology for this process. The formation of carbon deposits quickly deactivates conventional reforming catalysts, due to its endothermic nature [8,14]. Effectively, in comparison to steam reforming, the dry reforming of methane is recognized as the most highly endothermic reaction. This can be attributed to the fundamental difference in the oxidizing agents employed: CO2, used in DRM, is inherently more stable compared to steam, which is utilized in SRM [15,16,17,18,19].
It is well known that the C-H bond in CH4 is difficult to activate [20,21], while CO2 is the utmost oxidized state of carbon, which is also very stable [22,23]. The co-activation of both the C-H bond in CH4 and the C-O bond in CO2 faced challenging difficulties. Furthermore, because of the thermodynamics limitation, DRM reaction was usually performed at high temperatures [24,25,26,27,28].
The reactions involved in DRM are listed in Table 1. Reaction (1) represents the DRM reactions involved in the formation of syngas with an H2/CO ratio of 1:1. The main DRM reaction is favored at temperatures above 727 °C. However, if the reverse water–gas shift (RWGS) (reaction (2)) occurs simultaneously with the DRM reaction, it can lead to a decrease in the H2/CO ratio. Instead of the RWGS reaction, other side reactions can occur in DRM, depending on the reaction conditions and feed ratio used. These side reactions include oxidative coupling of methane, dehydrogenation of ethane, hydrogenation of CO and CO2 to ethanol, CO and CO2 methanation and more. Carbon formation can occur through reactions 3, 4, 5 and 6. In summary, reaction 3 is dominant at higher temperatures (>600 °C), while the other three reactions (4, 5 and 6) tend to be more dominant at lower temperatures (<600 °C) as they are exothermic reactions [8,29,30]. The high temperatures typically result in rapid catalyst deactivation. The main factors contributing to this deactivation are the sintering of the active metal and the accumulation of stable carbon deposits [31]. The different pathways of coke formation mentioned can be understood through CHO ternary diagrams, showing that graphitic carbon formation is thermodynamically favored under complete dry reforming conditions. However, alternative carbons such as amorphous and filamentous carbon may also form, although they are less thermodynamically preferred [32].
Considering the unavoidable thermodynamic carbon formation at high temperatures, the most promising approach to enhance catalyst stability might involve implementing a kinetic control strategy, such as designing a catalyst that minimizes carbon formation [8]. Catalysts based on noble metals such as Ru and Rh have demonstrated the highest catalytic activity and resistance to carbon deposition [8,33,34]. Nickel catalysts offer a promising alternative to noble metals, serving as effective catalysts for carbon dioxide reforming [35]. They exhibit a favorable combination of performance and cost, making them a focus of extensive research for the development of new and enhanced catalytic systems at a relatively lower cost. Coke formation and sintering of catalyst are the primary causes of catalyst deactivation that could lead to the low conversion of reactant [36]. Various strategies have been employed to inhibit sintering and coke formation. These include the deposition of nickel on a support (SiO2 [37], Al2O3 [38] or MgO [39]), incorporating the active phase into well-defined structures, such as spinel [40,41,42], perovskite [43,44], pyrochlore [45] or hydrotalcite [46], and using a second metal as a promoter [47,48] to enhance the dispersion of metal particles on the catalyst surface. The incorporation of promoters enhances the system’s robustness [3]. Among these metal promoters, silver has been found to exhibit desirable properties for resisting coke formation in alkane reforming reactions, as reported in references [49,50].
The utilization of Ag as a promoter has been proposed by Van et al. [49], demonstrating its ability to enhance long-term stability by forming surface alloys. Ag tends to nucleate on the step sites of the Ni surface, leading to the formation of Ag islands [51]. However, when heated above 800 K, the mobility of Ag can be increased, resulting in the complete blockage of steps [49,51]. In addition to its role in inhibiting coke deposition, Ag also accelerates the combustion of deposited coke. The promoting effect on coke gasification can be attributed to the fact that Ag destabilizes the formed coke by inhibiting its nucleation and growth, resulting in a reduced formation of graphitic or whisker carbons on Ag-promoted Ni surfaces.
Experimental observations conducted by Vang et al. [49] indicate that Ag preferentially occupies step sites on the Ni surface, leading to a reduced rate of C–C bond cleavage in ethylene hydrogenesis. Subsequently, Parizotto et al. [50] demonstrated that Ag, similar to gold (Au), effectively regulates coke formation on Ni/Al2O3 catalysts for methane steam reforming. Similar findings have been reported for Ag-promoted Ni/YSZ catalysts used in internal reforming for fuel cells, although gradual deactivation over time-on-stream has been observed [52]. The promoting effect of Ag in Ni/MgAl2O4 catalysts has also been explored by Jeong and Kang [53] for butane steam reforming and by Rovik et al. [54] for ethane steam reforming. Zhu et al. [55,56] conducted Density Functional Theory (DFT) calculations to gain insights into Ag’s role in dry reforming of methane, suggesting that Ag can act as a promoter by inhibiting coke deposition.
According to Yu et al. [11], silver exhibited excellent stability of the catalyst, as it hindered the formation and growth of coke in a whisker or graphitic form, while promoting coke gasification on the catalyst surface. Indeed, nickel and silver are extensively employed in heterogeneous catalysis due to their favorable catalytic properties. Combining nickel and silver in a bimetallic catalyst, such as Ni-Ag, can offer advantages over monometallic catalysts. In fact, the literature reports that combining two metals to form bimetallic systems enhances catalytic performance, particularly in inhibiting carbon deposition during hydrogen production by reforming [40]. Several effects are attributed to bimetallic systems: (1) increased concentration of active sites; (2) electronic effects resulting from metal–metal contact, leading to better tolerance to carbon formation; (3) a sacrificial role played by one of the elements within the bimetallic system, allowing the second metal to remain available and not poisoned [57,58,59,60,61].
Therefore, it is important to investigate the catalytic performance of Ni-Ag catalysts to understand their impact on reaction kinetics.
The objective of this study was to develop an efficient catalyst for the dry reforming of methane. To achieve this, Ni-Ag catalysts were synthesized using the coprecipitation method, with the Ni/Ag ratio being systematically varied. The obtained compounds were subjected to comprehensive analysis to evaluate their textural, structural and surface properties through various techniques. The reactivity of the catalysts during the reduction process was assessed using hydrogen temperature-programmed reduction for the fresh catalysts, while X-ray diffraction was employed to analyze the reduced catalysts. Furthermore, the catalytic performance of the catalysts in the dry reforming of methane was thoroughly investigated.

2. Results

2.1. Characterization of Fresh Catalysts

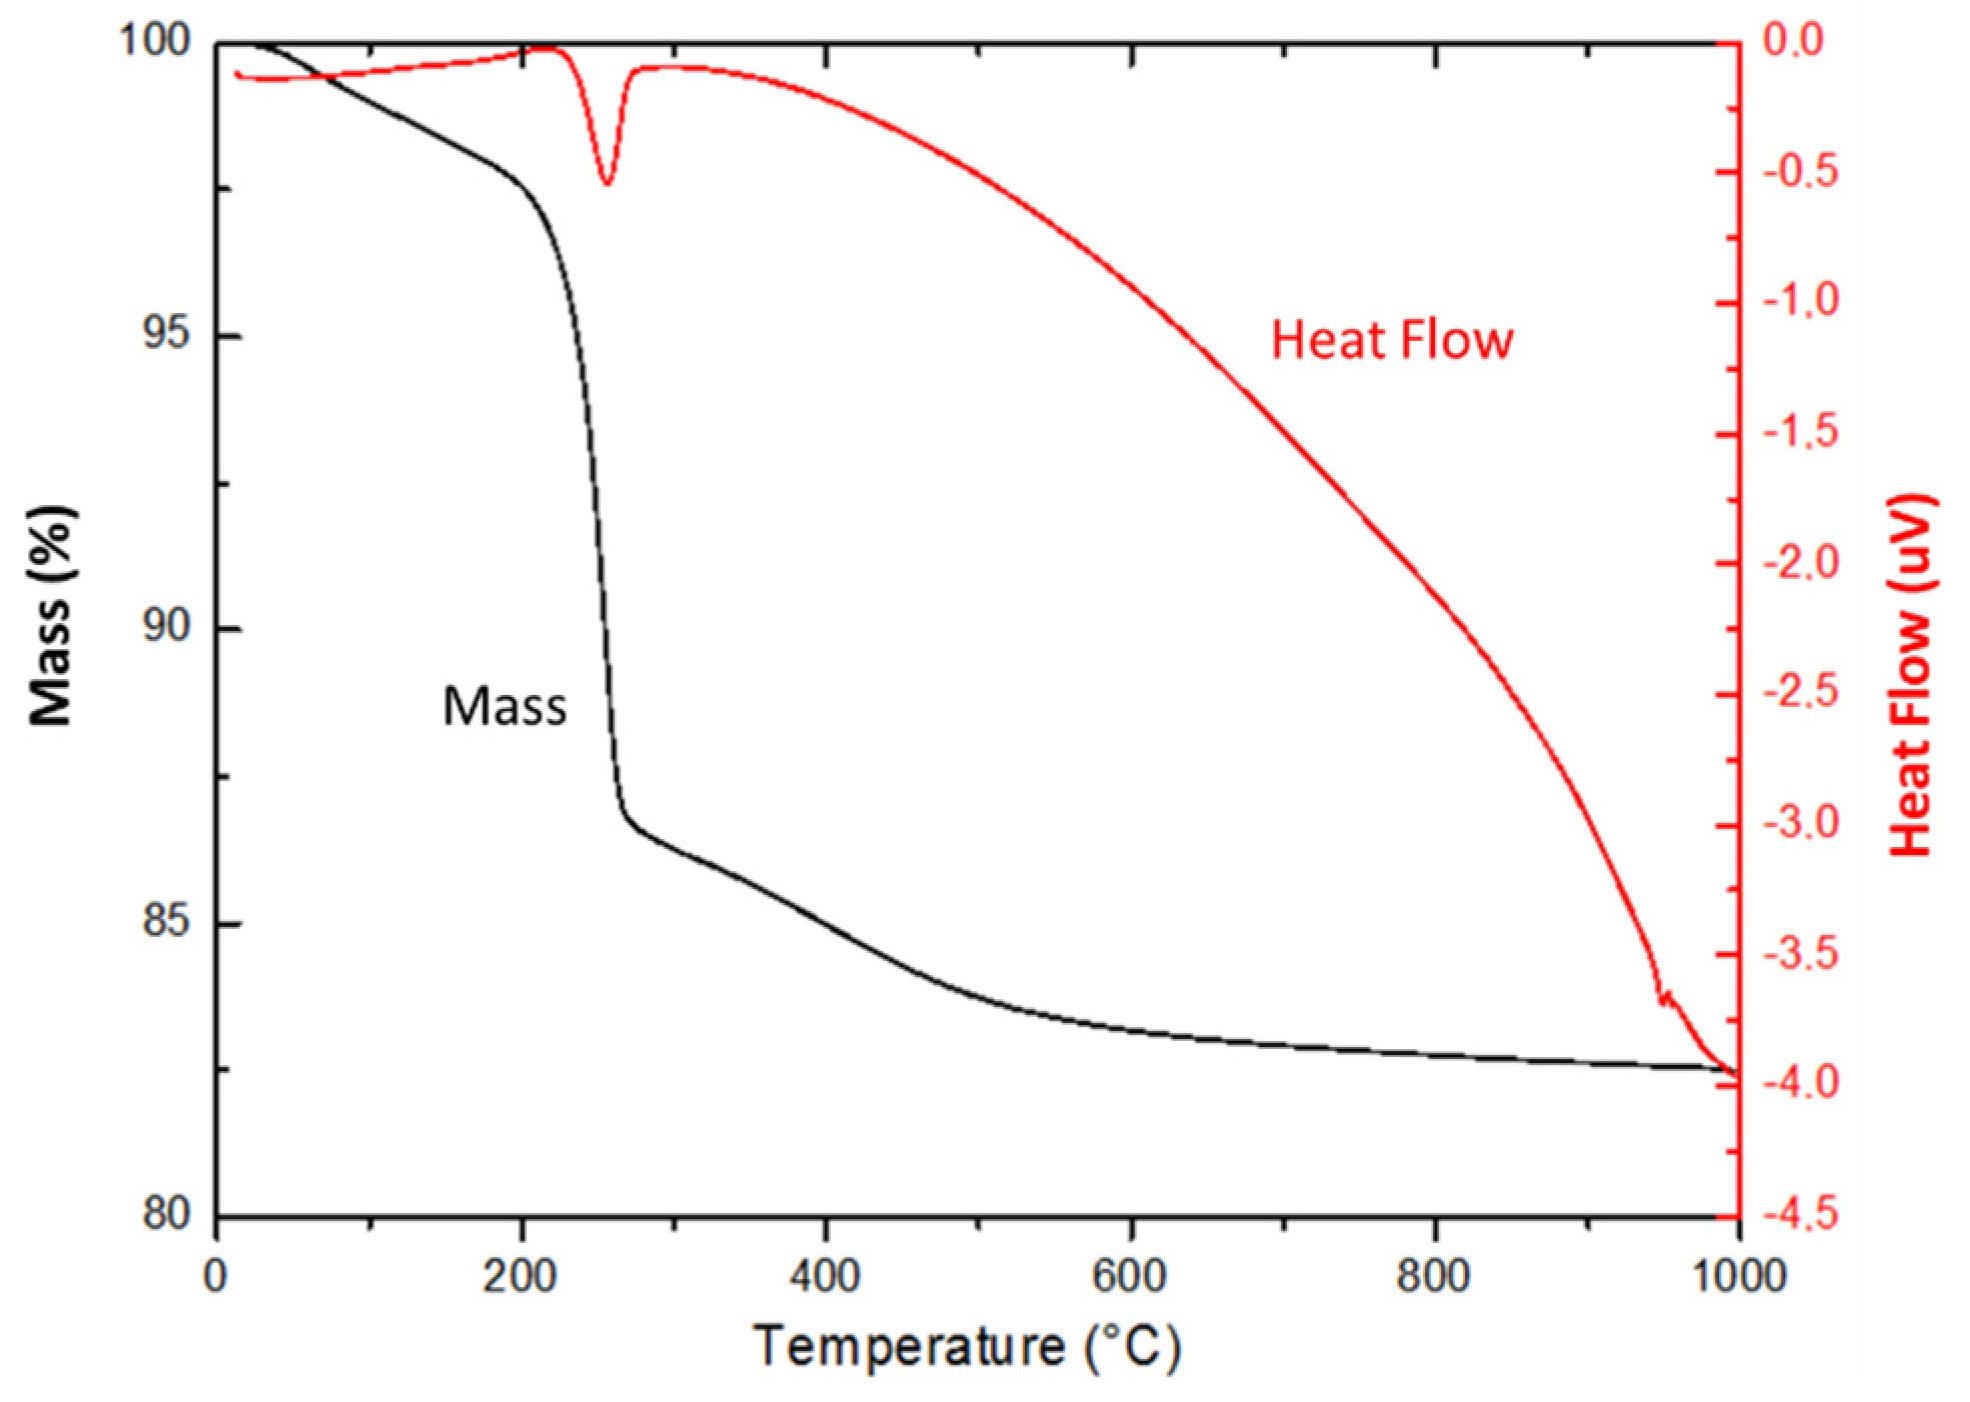
2.1.1. Thermal Study (TG-DSC-MS and XRD) of Precursors

The thermal stability of the various precursors was assessed using a combination of techniques including thermogravimetry differential thermal analysis (TG-DSC) coupled with mass spectrometry (MS) and X-ray diffraction (XRD) on compounds annealed at various temperatures (600, 700, 1000 and 1200 °C). TG-DSC was carried out on fresh catalysts in the temperature range from ambient to 1000 °C. The TG-DSC curves (Figure 1) mainly exhibit three weight loss steps up to 600 °C. Peaks in heat flow were observed at 256 °C (endothermic phenomenon) and at 950 °C (unattributed heat flow peak) for the 2AN100 sample. Water and carbon dioxide are identified as the species responsible for weight loss. Mass spectrometry analysis confirms the presence of water (m/z = 18) and CO2 (m/z = 44). The first step corresponds to the removal of physisorbed water on the material’s surface, while the second step involves the release of interlayer water and carbon dioxide from the precursor’s structure. No additional weight loss or significant changes are observed as the temperature continues to increase, suggesting that the material structure has reached a state of relative stability.
To analyze the structural changes in the materials with the temperature, various heat treatments were performed. This approach enabled the assessment of the impact of calcination temperature on the phase composition. The samples were calcined at temperatures of 600, 700, 1000 and 1200 °C (with a rate of 5 °C/min) under a constant airflow for 4 h and then analyzed by XRD. The XRD patterns (Figure 2) obtained for these samples reveal that whatever the annealing temperature, the main phases obtained after calcination are metallic silver (PDF file number 89-3722) and nickel oxide (PDF file number 47-1049). The catalyst’s composition remains stable after calcination at different high temperatures.
From TG-TDA-MS, no weight loss is observed above 600 °C. Apart from the peaks corresponding to silver and nickel oxide, XRD analysis reveals that no other diffraction peaks are observed even up to 1200 °C. These findings suggest that the catalyst’s composition remains stable at high temperatures. Considering that the DRM reaction occurs within a temperature range of 600 to 850 °C, a calcination temperature of 600 °C has been selected to preserve the structure and texture of the catalyst.

2.1.2. Study of Stoichiometry of Fresh Catalysts (ICP-OES and EDX)

A study of the stoichiometry of fresh catalysts was conducted using ICP-OES and EDX spectroscopies. The results obtained are summarized in Table 2. As expected, the EDX analysis confirms the presence of silver (Ag) and nickel (Ni) elements. ICP-OES spectroscopy showed that the measured amounts of all analyzed species are slightly lower than the nominal ones used in the preparations (Table 2). The low amount of Ni species in all cases can be interpreted by the low temperature of calcination (600 °C/4 h) or by incomplete precipitation of Ni(OH)2 during preparation synthesis. In contrast, for all three catalysts, the overall EDX analysis reveals a Ni/Ag mass ratio higher than the theoretical value, indicating a relatively higher concentration of nickel in the upper layers of the catalyst. Traces of sodium (Na) and silicon (Si) are detected by EDX in the 1NA600 and 1.5NA600 samples. Additionally, traces of aluminum (Al) and potassium (K) are only observed in the 1.5NA600 sample. The presence of aluminum is attributed to the aluminum sample holder used during the analysis. These impurities are typically present in small amounts and may not be detectable by X-ray diffraction (XRD). In the case of the 2NA600 sample, no signal corresponding to Na-Si-K is observed in the EDX spectra, suggesting that the analyzed regions are not contaminated by Na-Si-K.

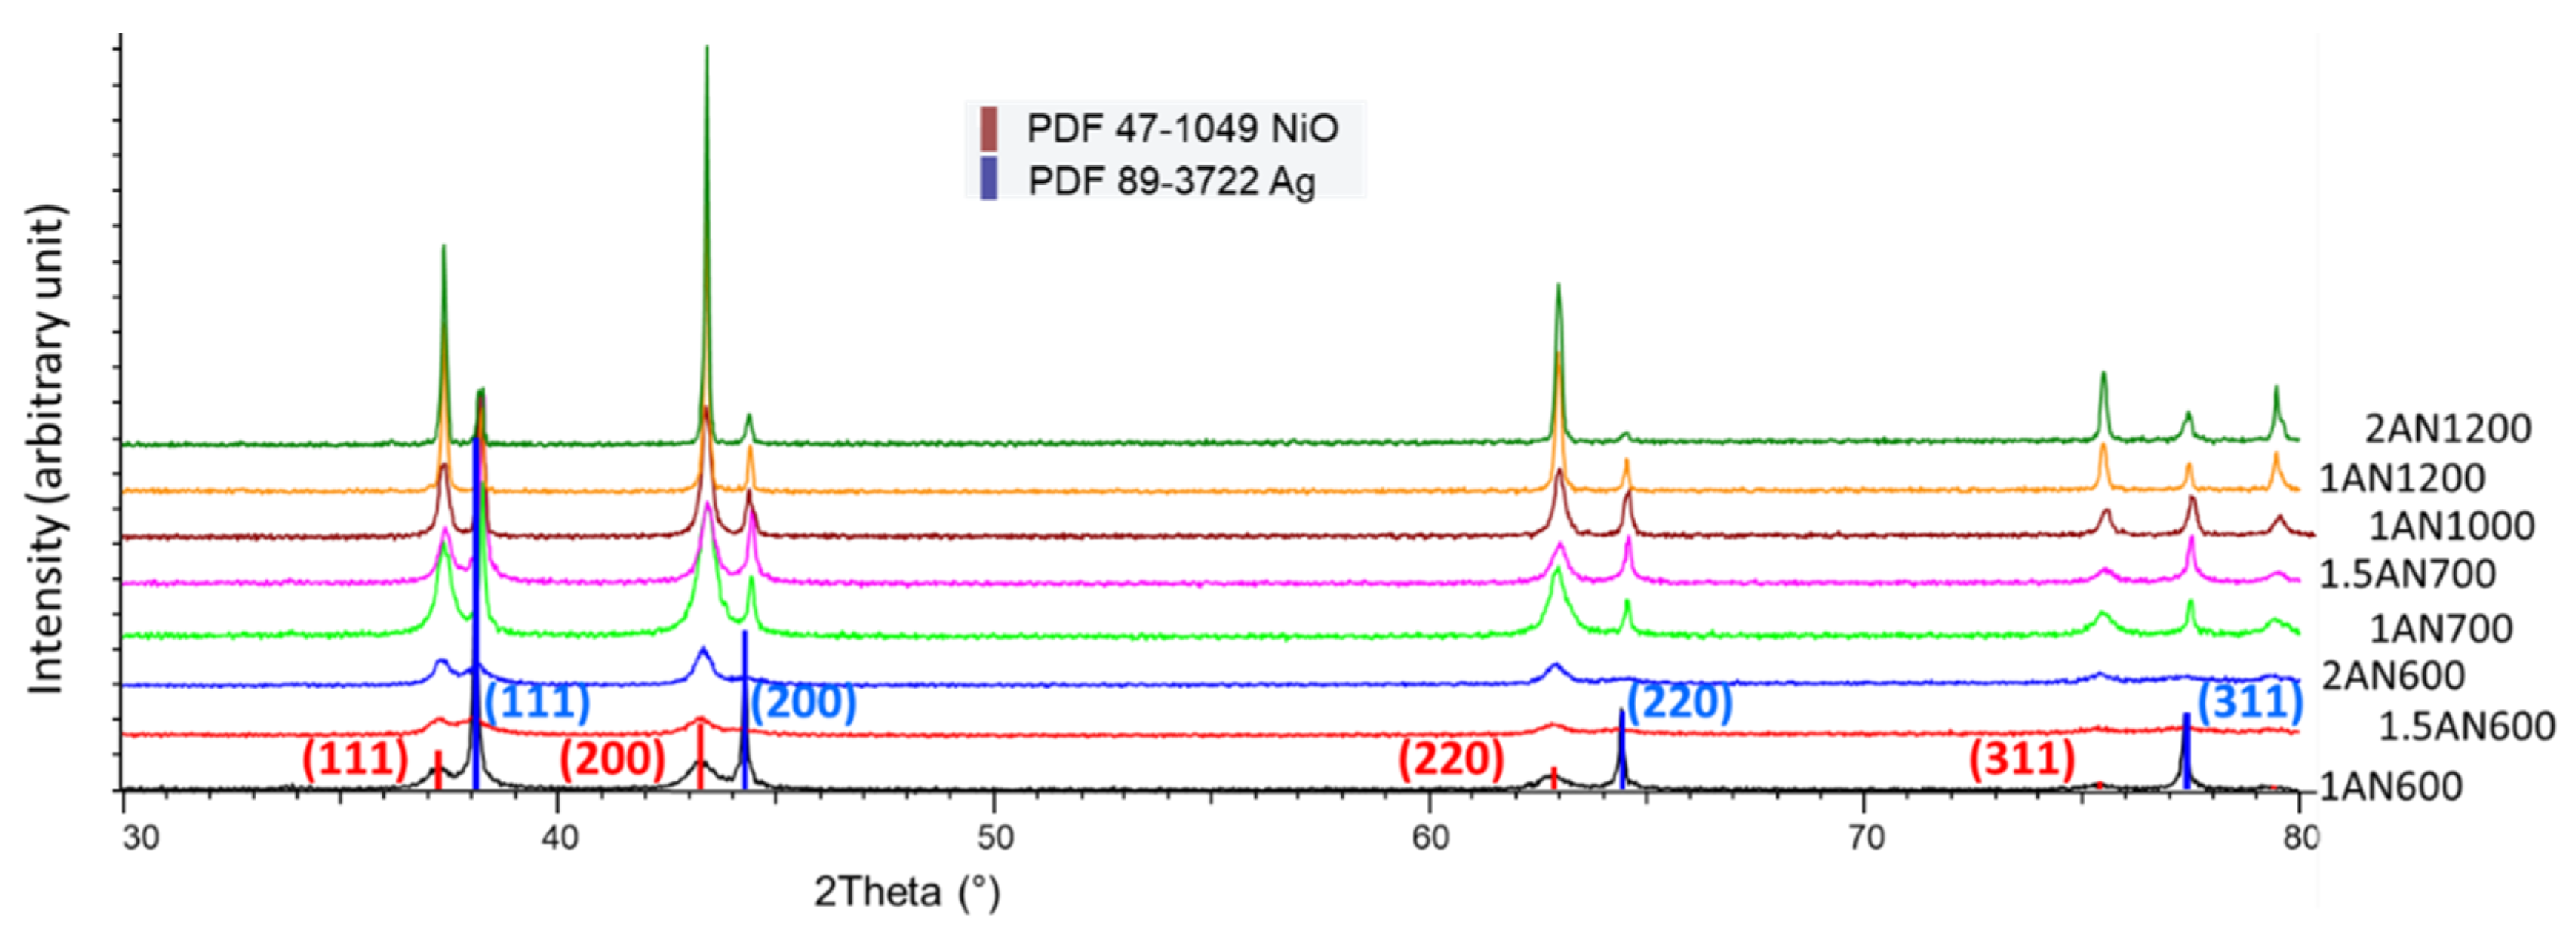
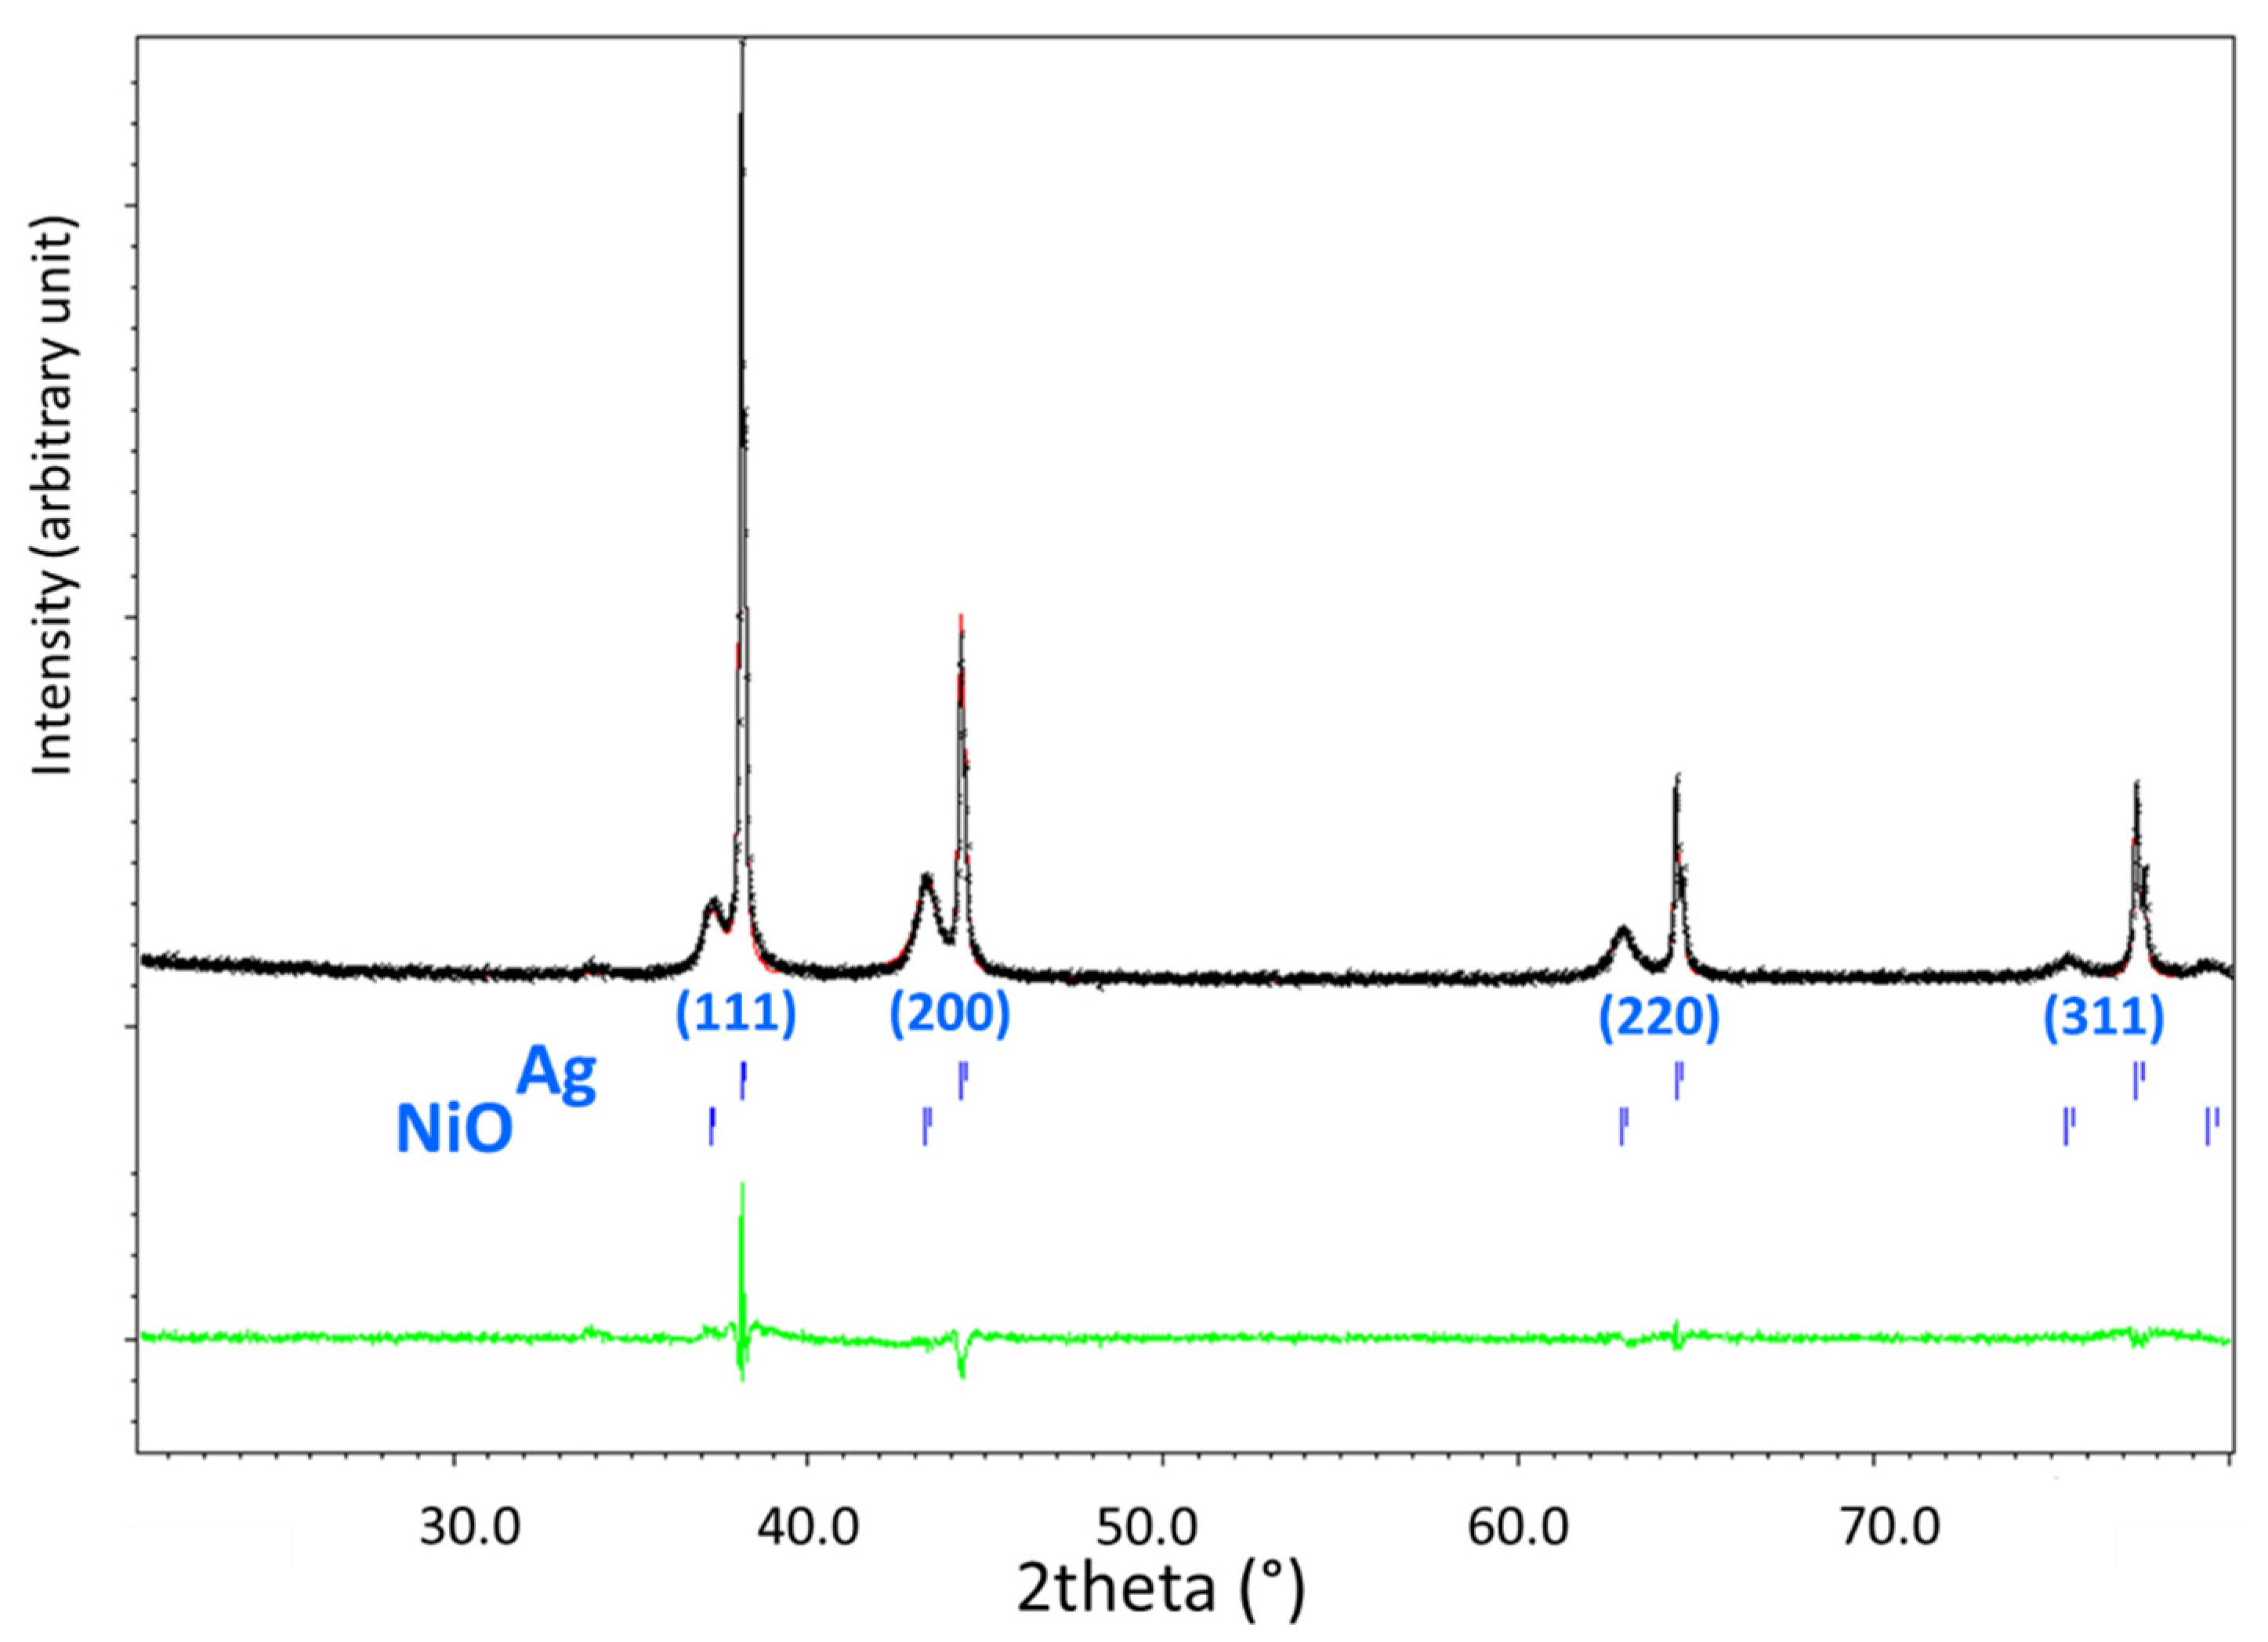
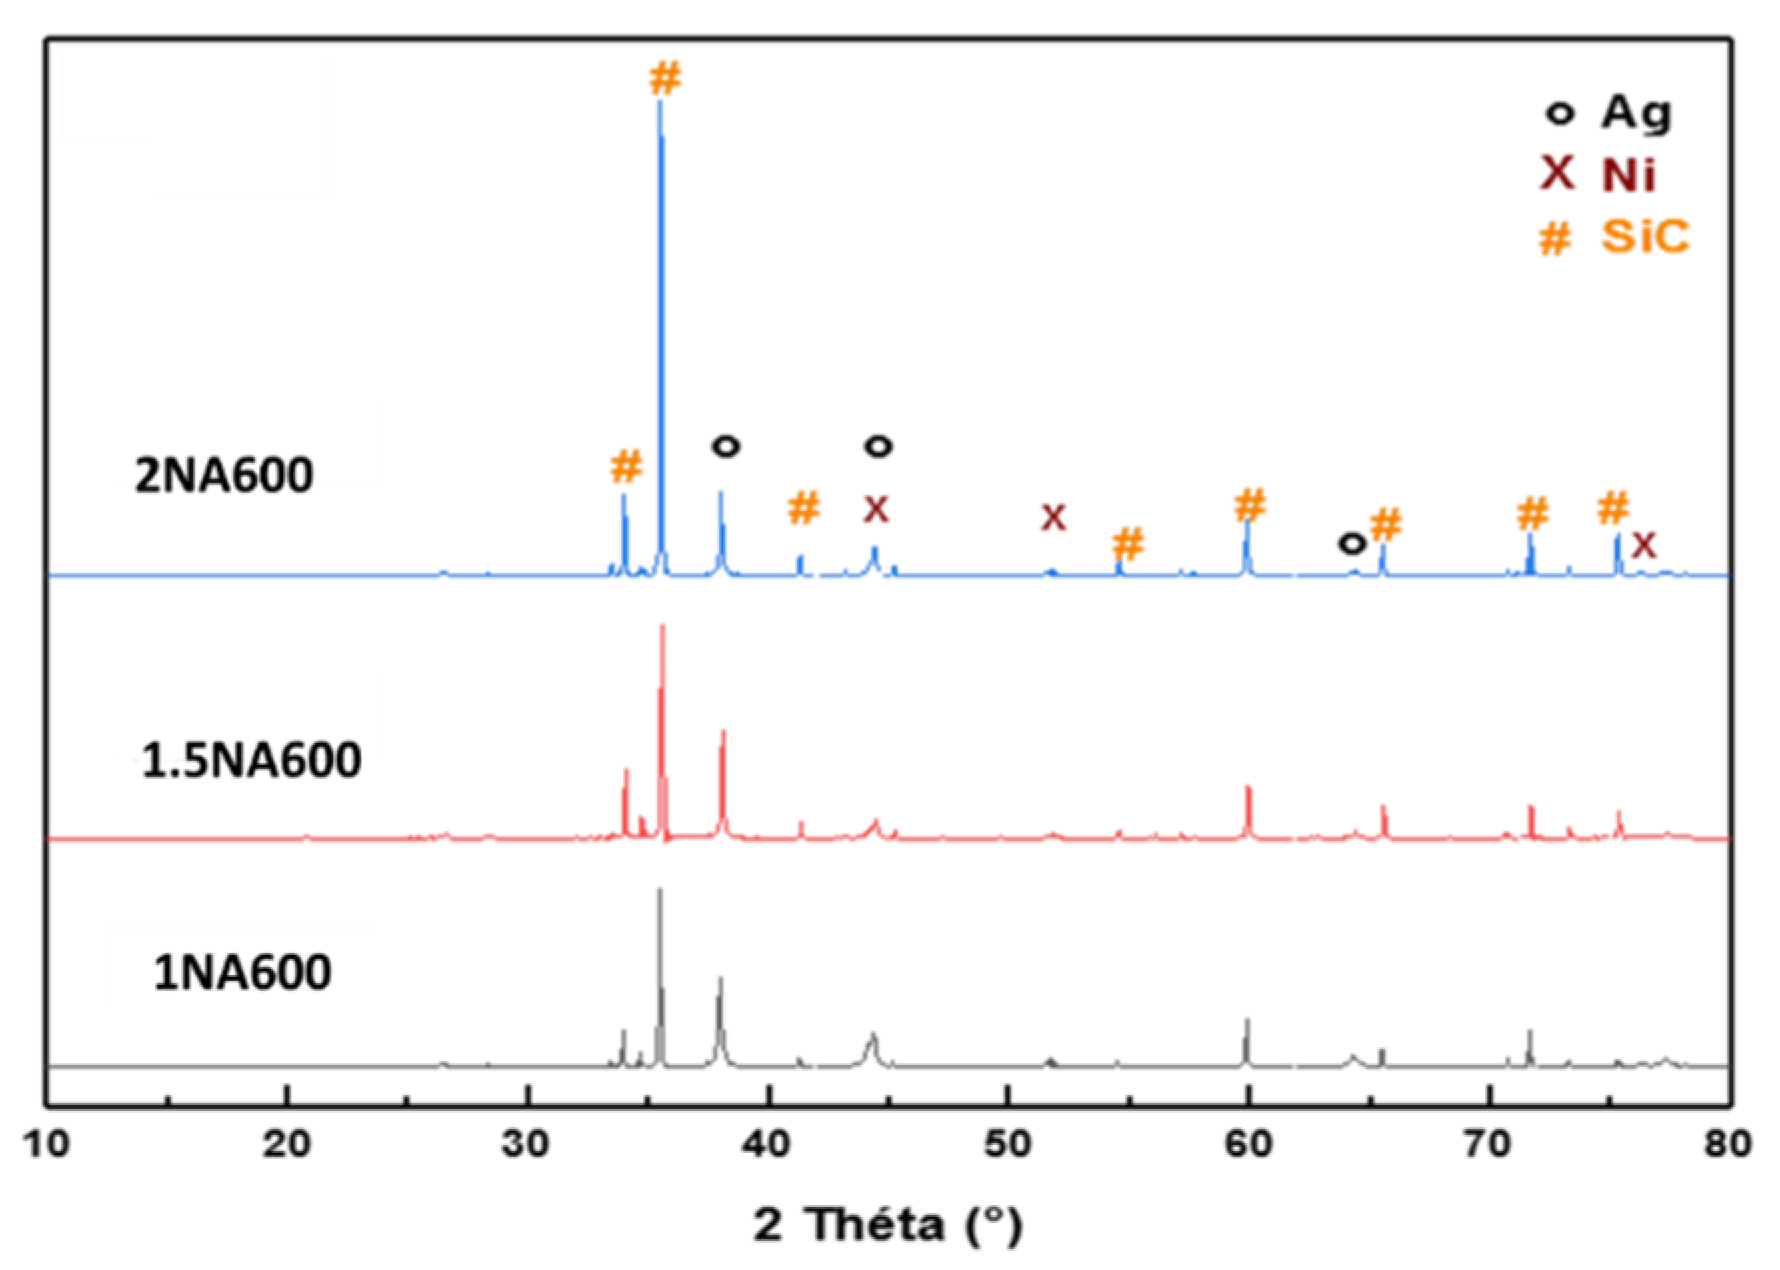
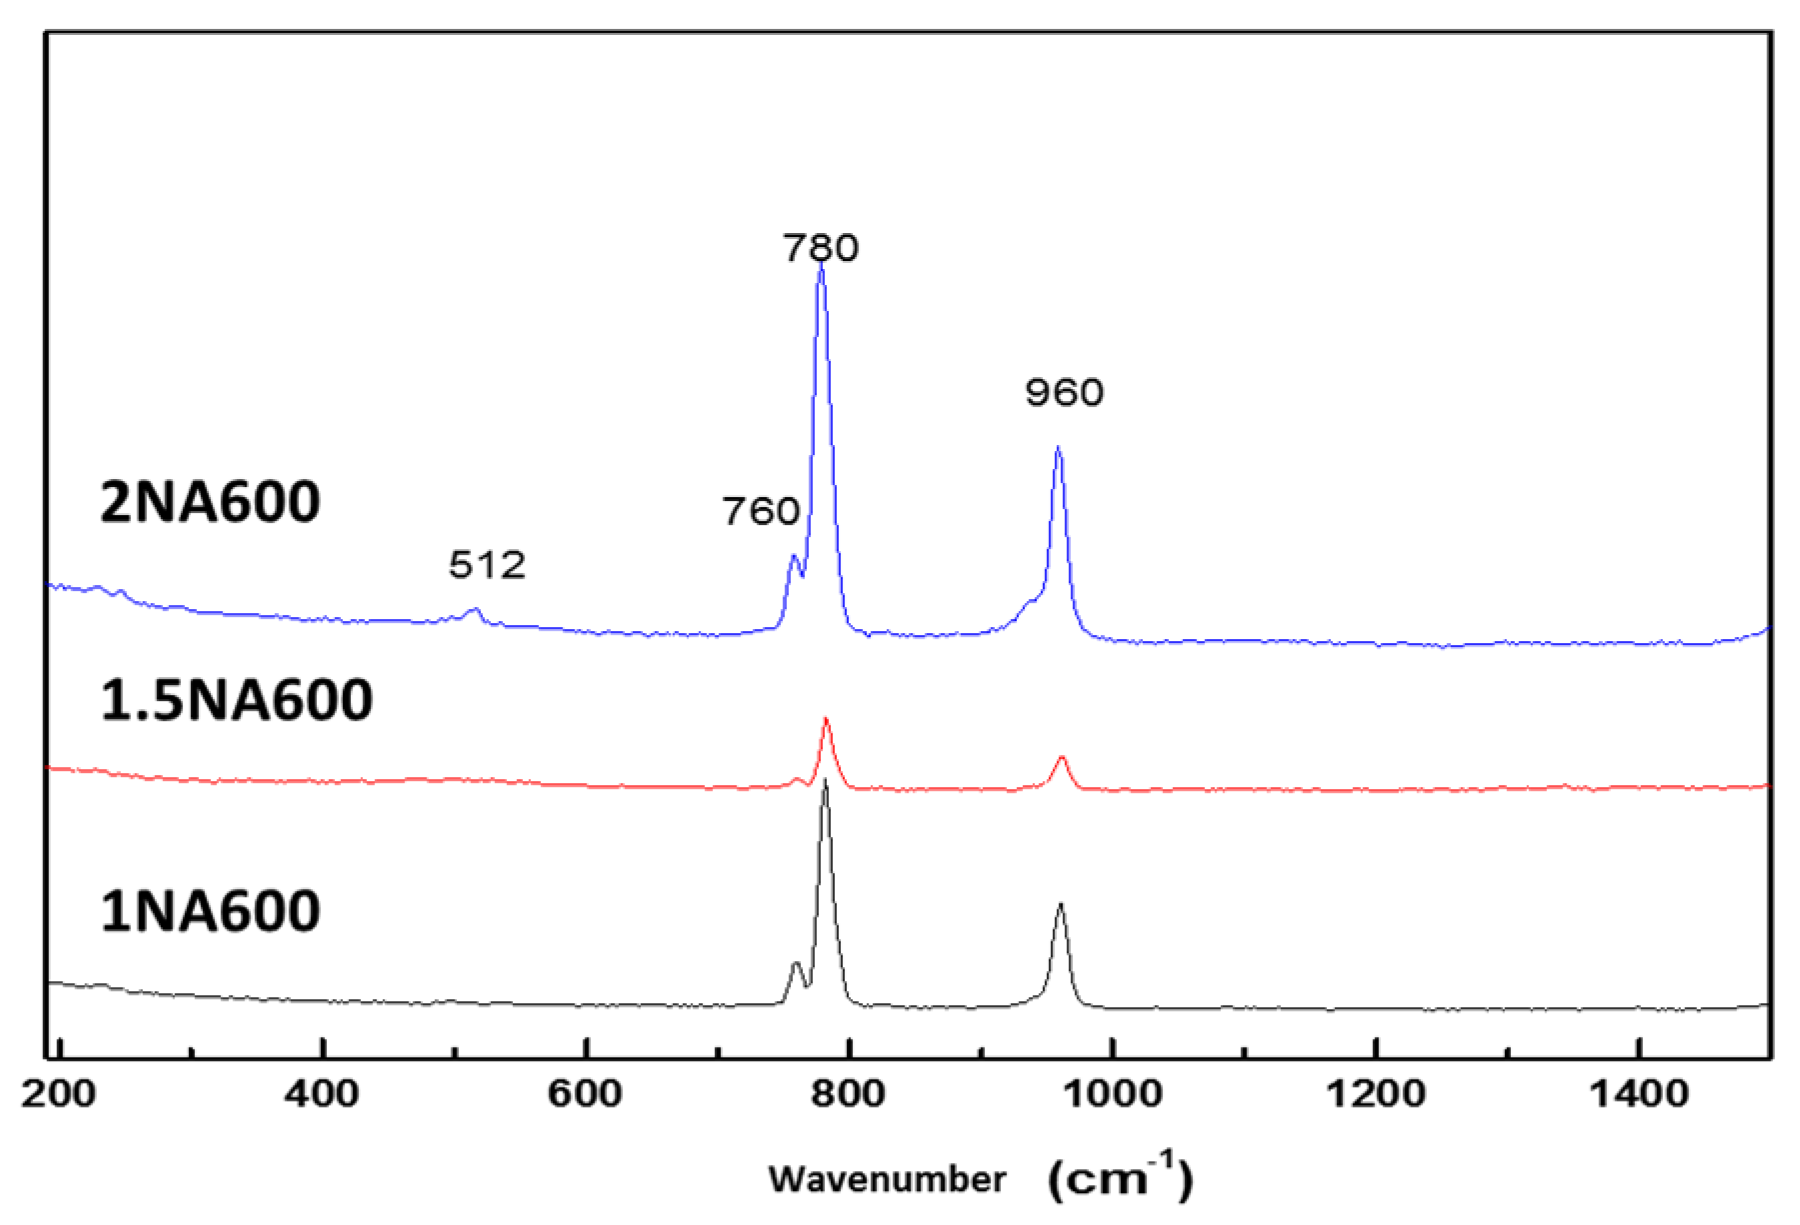
2.1.3. Structural Characterization of Fresh Catalysts (XRD)

As already pointed out, the diffractograms of the three compositions of the fresh catalysts (after heating at 600 °C) (Figure 2) show the presence of both NiO and Ag materials, with peaks at 2θ = 37.24°, 43.27°, 62.87°, 75.41° and 79.40° corresponding to the (111), (200), (220), (311) and (222) planes of the cubic NiO phase (PDF 47-1049) [62], while peaks at 38.12°, 44.307°, 64.45° and 77.41° belong to the (111), (200), (220) and (311) planes of metallic, cubic, Ag (PDF 89-3722). These results are in good agreement with the studies conducted by [63,64,65,66]. As shown in Figure 2, XRD patterns of the prepared catalysts exhibit similar diffractograms with slight differences. In order to obtain more information on the relative proportions of the phases present in the catalyst, a refinement using the Rietveld method was carried out on the three preparations annealed at 600 °C.
The Rietveld refinement was conducted using the JANA 2020 program to determine the lattice parameters, the crystallite size (using the fundamental parameter approach) and the relative amount of each crystalline phase. These parameters are given in Table 1, and the results on the Ni/Ag = 1 are illustrated in Figure 3. The crystallite size of NiO varies between 8.7 and 16.8 nm, indicating a difference among the samples. The results also indicate that as the Ni/Ag ratio increases, the crystallite size of NiO also increases. For all the catalysts, NiO is identified as the dominant phase, which aligns with the findings from the EDX analysis. The lattice parameters (a) of detected phases NiO and Ag are similar for all three catalysts. The relatively small crystallite size of NiO observed in the 1NA600 sample corresponds to its large surface area (20 m2/g, Table 2).

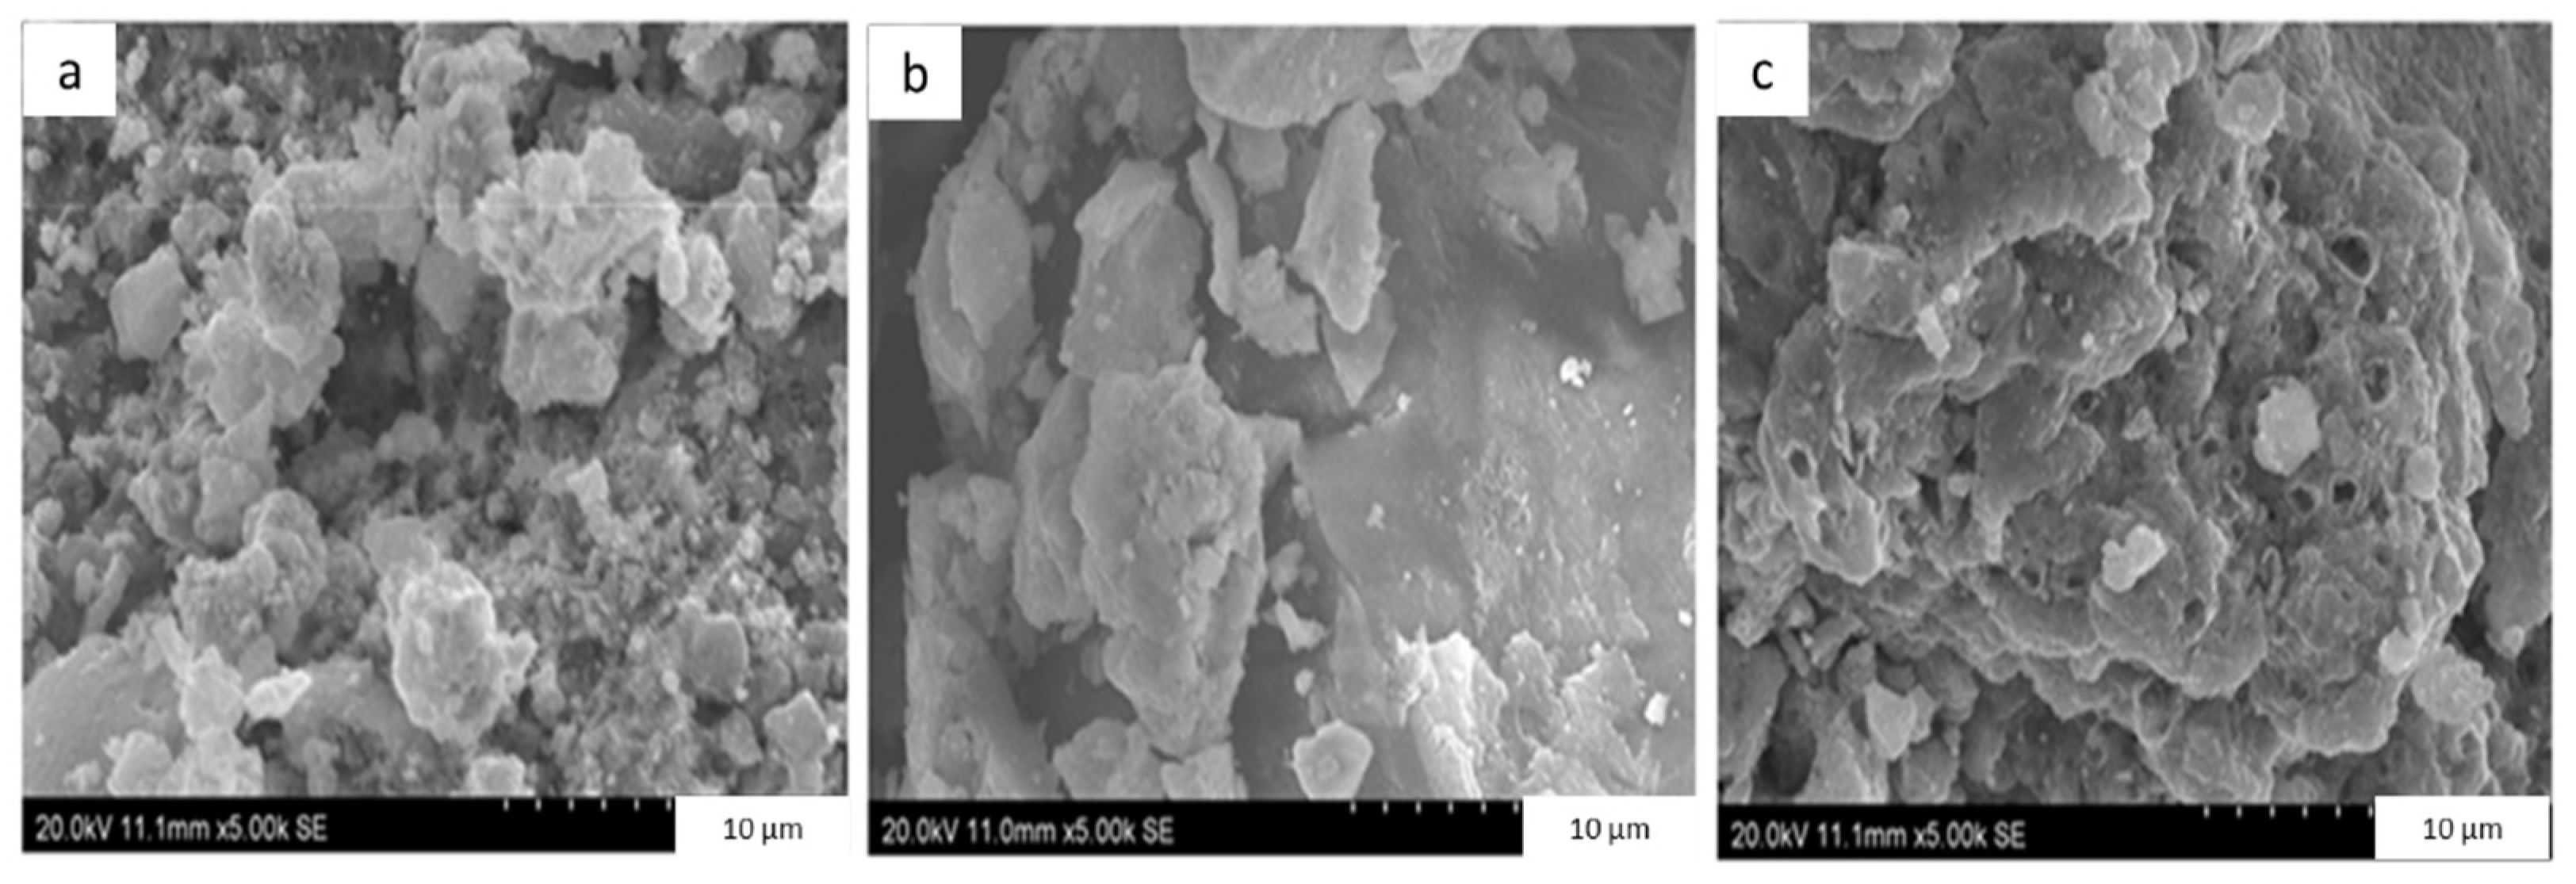
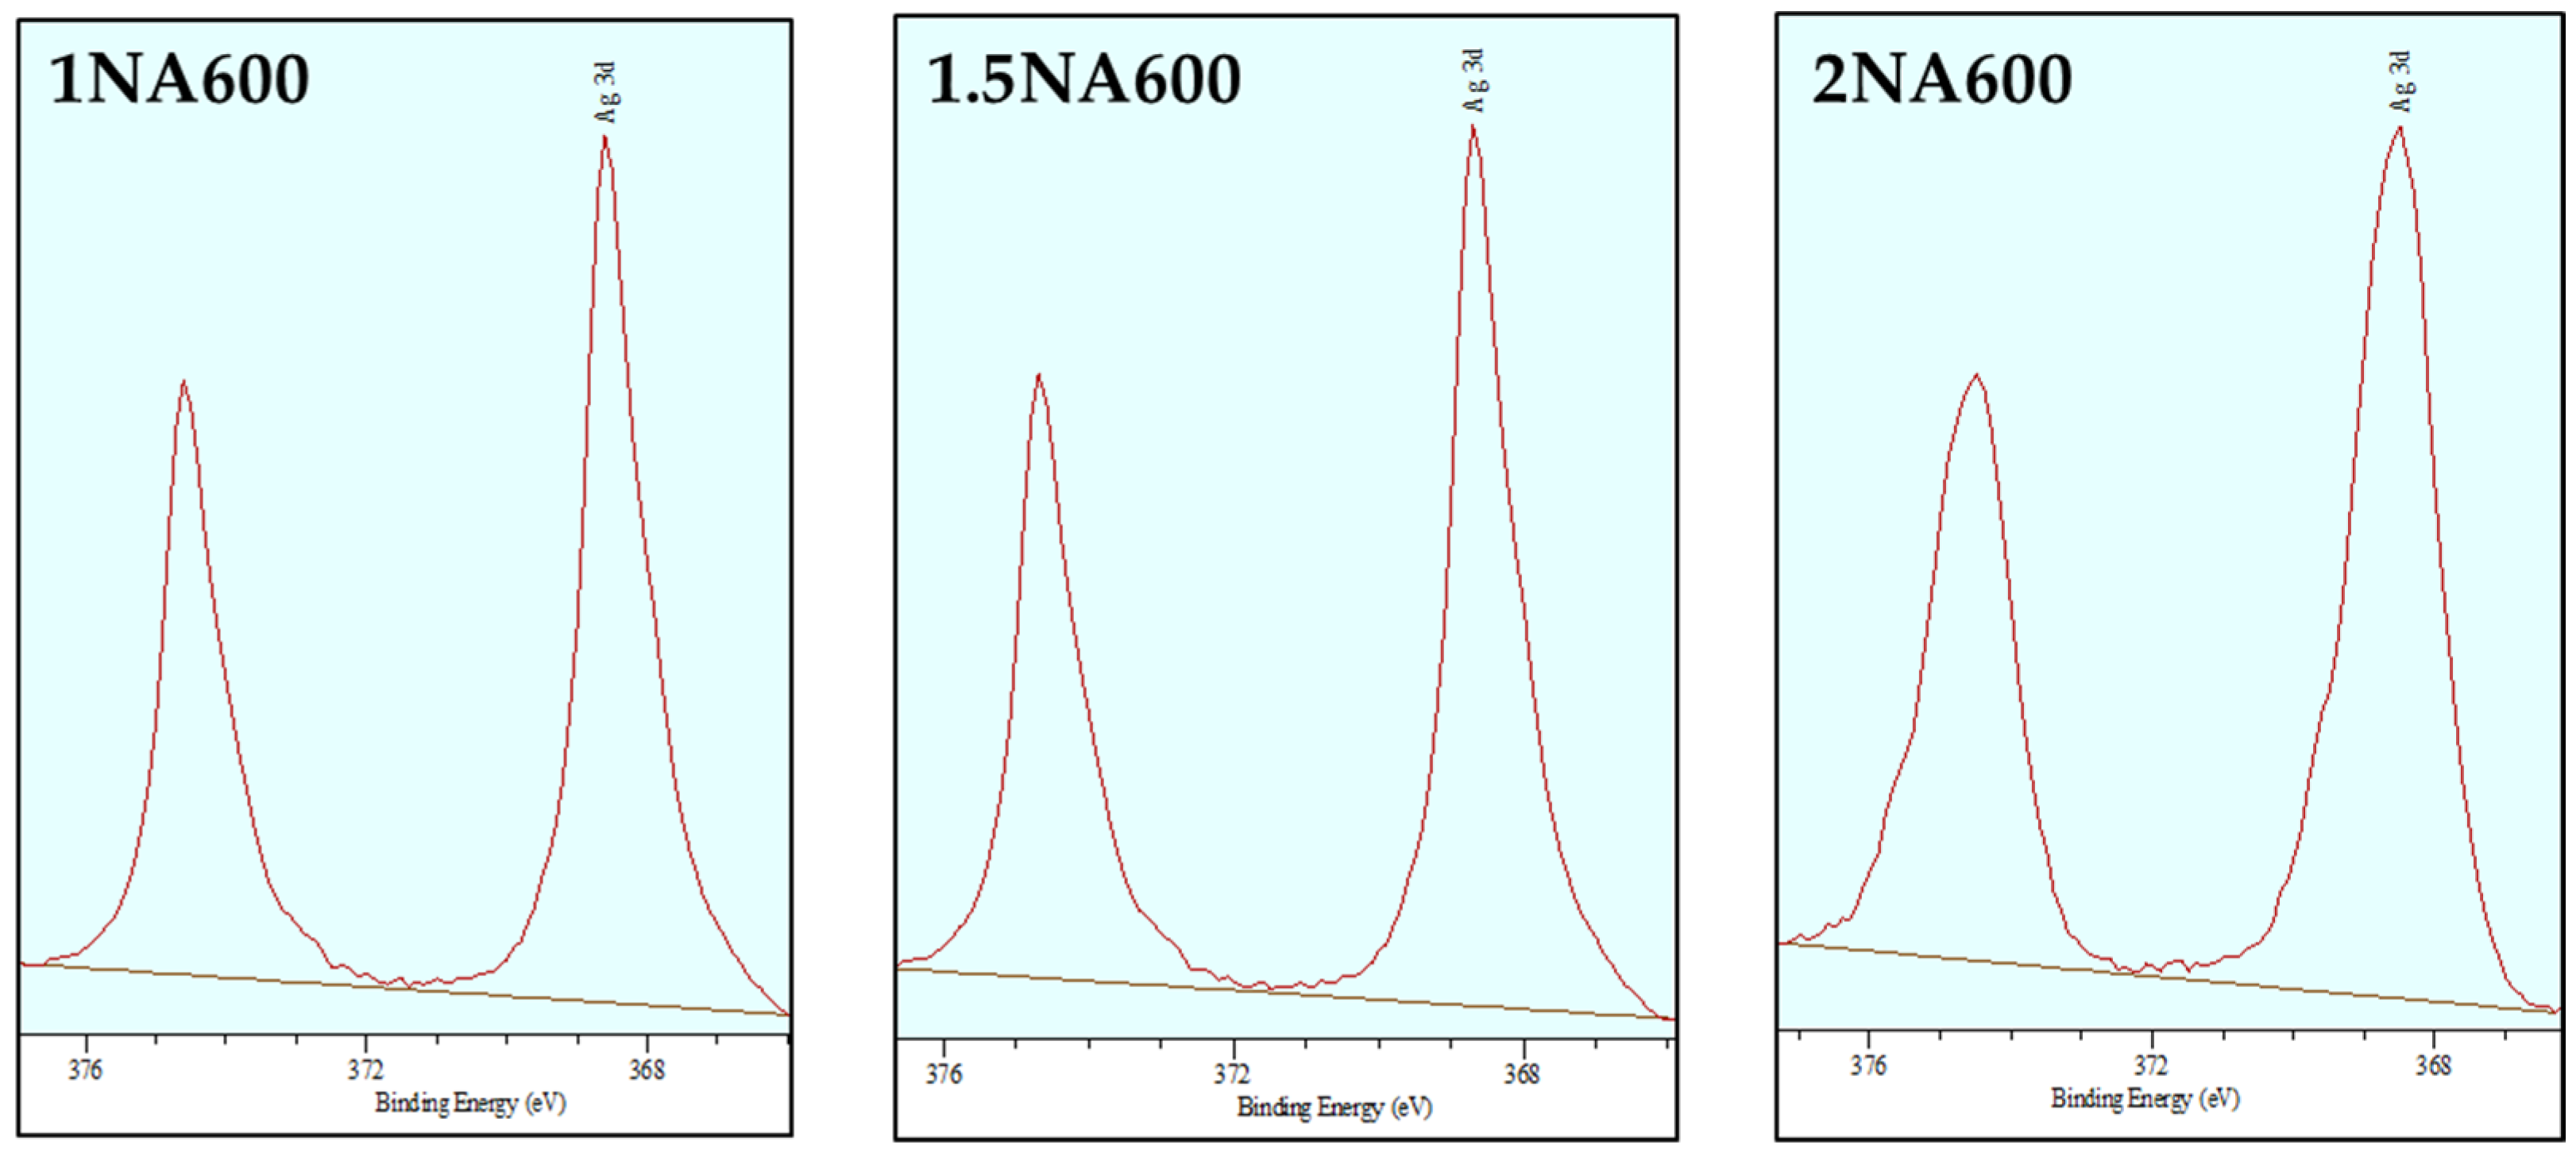
2.1.4. Textural Characterization of Fresh Catalysts (BET, SEM and XPS)

The specific surface area of the catalyst powder was determined through the application of the Brunauer–Emmett–Teller (B.E.T) method, which involves N2 adsorption–desorption analysis, and the results are presented in Table 1. The morphology of the synthesized materials was assessed using scanning electron microscopy. The data SBET indicate a decrease in the specific surface area from 20 m2/g for the 1NA600 sample to 3 and 5 m2/g for the 2NA600 and 1.5NA600 samples, respectively. The results agree with the results of the Rietveld refinement analysis. As the surface area increases, the dimensions of the NiO crystallites decrease proportionally. This reduction in the BET surface area corresponds to an increase in the Ni/Ag ratio. This observation is consistent with the findings from the scanning electron microscopy (SEM) analysis and is supported by reference [67].
SEM images of the catalysts are presented in Figure 4, revealing noticeable variations in particle shapes. The contrast in the SEM image is due to the presence of both NiO and Ag phases. For the 1NA600 sample, the micrograph in Figure 4a displays the surface composed of Ag and NiO nanoparticles aggregated to form clusters of different sizes dispersed randomly. The formation of relatively larger spheres can be attributed to the tendency of NiO nanoparticles, which are antiferromagnetic in nature, to aggregate [68]. Regarding the 1.5NA600 sample, SEM micrographs in Figure 4b demonstrate that the powder consists of aggregates of nanoscale particles coexisting with larger-grain aggregates. Pronounced differences in particle shapes can be observed, and agglomeration is more prominent compared to the 1NA600 sample. For the 2NA600 sample, the surface morphology of NiO exhibits the random growth of nanocubes with varying dimensions, as shown in Figure 4c. Small and larger nanocubes are formed, consistent with Ajeet Singh’s findings [69]. Figure 4c displays more agglomeration than the 1NA600 sample but less than the 1.5NA600 sample. In summary, it is evident that the Ni loading significantly influences the morphology of the catalysts.
The surface chemical properties of the 1NA600, 1.5NA600 and 2NA600 catalysts after calcination at 600 °C for 4 h under airflow were examined by XPS measurements. The binding energy for both species (Ag and Ni) does not vary practically (Figure 5 and Figure 6), whatever the content used during the synthesis. The decomposition of XPS spectra (Figure 5 and Figure 6) does not show any components, and the recorded binding energy values show clearly that Ag and Ni are in a unique oxidation state (only 1 oxidation state for each species), thus explaining the formation of the unique phases corresponding to each species (formation of a single phase for each species) as observed by XRD analysis. The binding energies of Ag 3d photopeaks are at 368.8 eV (1NA600), 368.7 eV (1.5NA600) and 368.5 eV(2NA600) and those of Ni 2p3/2 are at 854 eV (1NA600), 854.1 eV (1.5NA600) and 853.7 eV (2NA600). In the literature, the Ag 3d5/2 and Ag 3d3/2 core level binding energies appear at 368.1 and 374.1 eV, respectively, in good agreement with bulk silver metallic values [70]. In our case, the metallic bulk binding energy values for the Ag 3d core levels were obtained as expected. These results are in good agreement with the presence of fcc metallic silver structure obtained by XRD. For nickel species, the binding energy of Ni(II) was found at close values of 854.9 eV for NiO accompanied with a shoulder at ~1.2 eV [71,72]. This perfectly confirms that Ni(II+) is from the NiO phase and not from another phase that can form during the synthesis containing Ni species (in accordance with XRD data). As observed by EDX analysis, the Ni/Ag ratios (Table 2) were also higher for the three samples suggesting that the surface of 1NA600, 1.5NA600 and 2NA600 samples was enriched by Ni(II) species. This surface behavior is in good accordance with the large amounts of NiO phase estimated by Rietveld Refinement (Table 2).

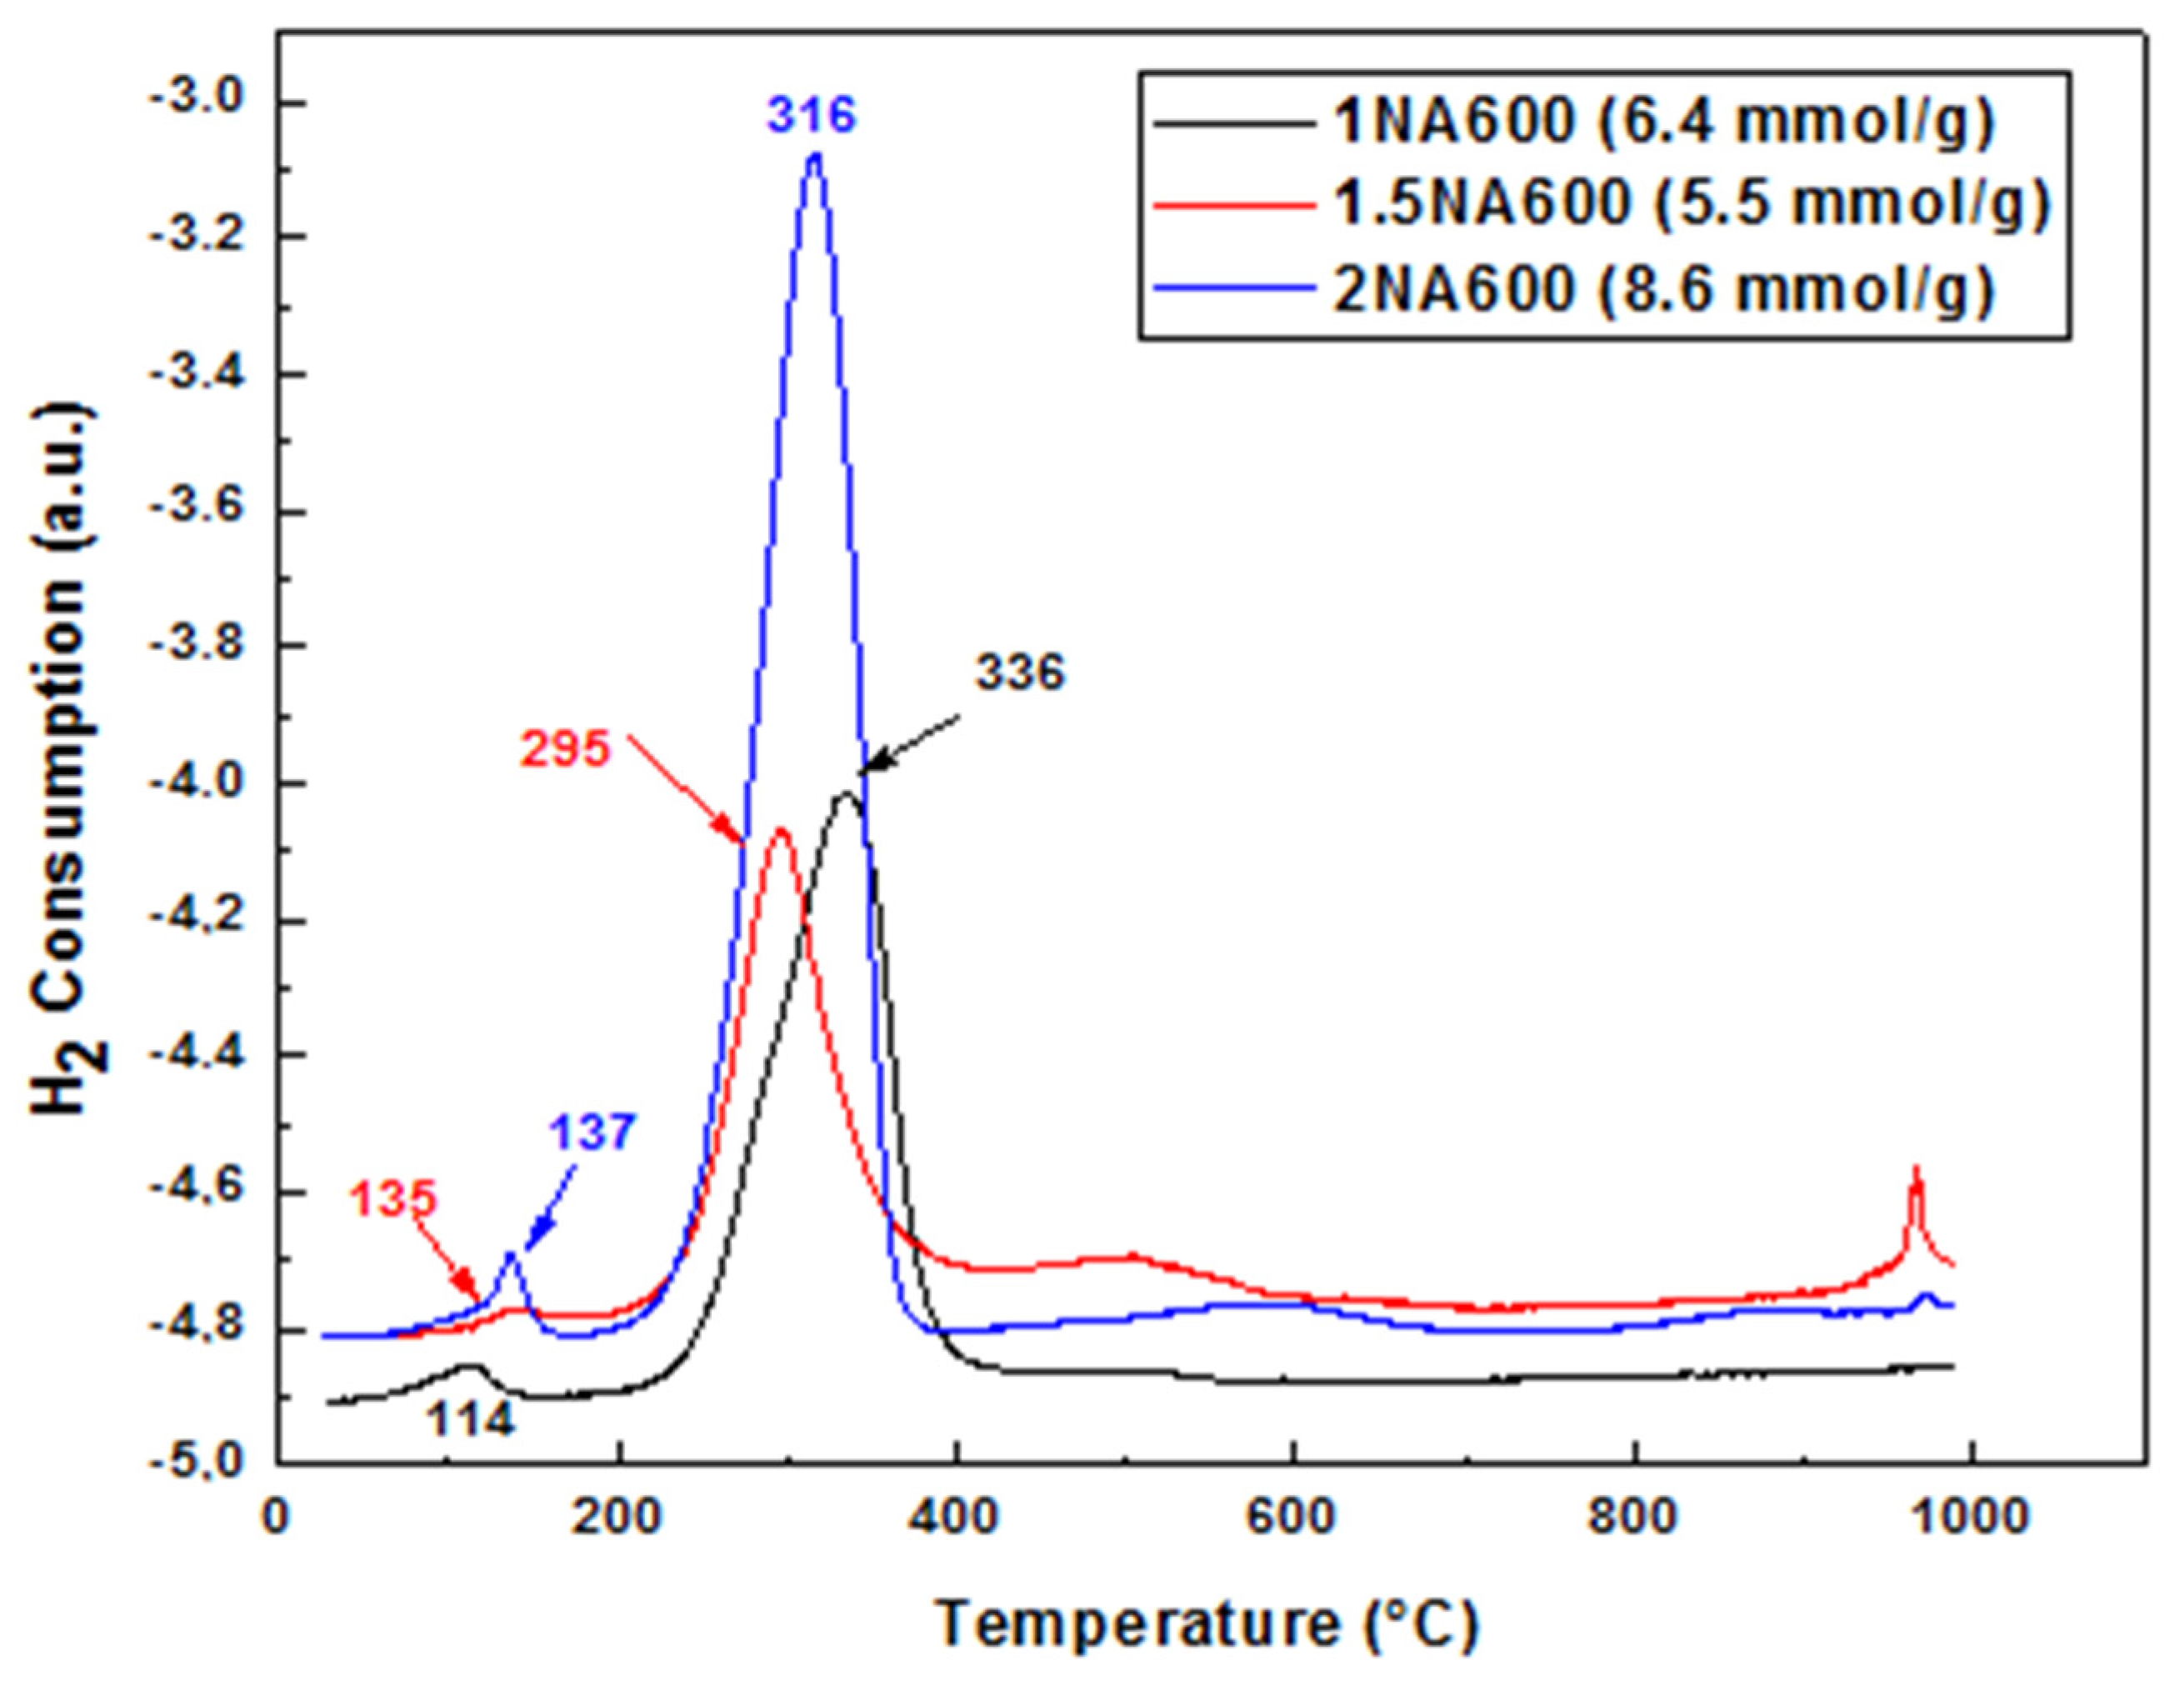
2.1.5. Reducibility Studies of Fresh Catalysts (TPR and XRD after Reduction)

Reducibility studies were conducted using H2 temperature-programmed reduction (TPR) of the fresh catalysts followed by X-ray diffraction (XRD) analysis for reduced catalysts. These experiments aimed to investigate the influence of Ag on the reducibility of Ni2+ ions in the catalysts. Figure 7 illustrates the hydrogen consumption as a function of temperature for the different systems studied. For all three samples, a slight difference in H2 consumption was observed (~5–9 mmol/g). The TPR curves of the three catalysts exhibit also a similar pattern, showing two main peaks of hydrogen consumption between 100 and 400 °C. The first peak can be attributed to the reduction of nickel species located on the surface, as species on the surface tend to be reduced at lower temperatures compared to those in the volume. The second peak is related to the reduction of surface and/or surface-bulk NiO, representing Ni-reduction mechanisms [73,74,75,76]. Previous literature suggests that large NiO particles with lower interaction with other phases can be reduced at low temperatures [77,78,79]. The peak at 350–500 °C can be attributed to the reduction of NiO [80]. For the 1.5NA600 sample, a small peak observed at very high temperatures (~1000 °C) may be associated with residual species that were not completely eliminated during calcination [81,82]. This different behavior of 1.5NA by the appearance of a peak at high temperature compared to the other two solids, in particular to 1NA600, could be assigned to the reduction of sodium carbonates detected by EDX analysis as mentioned above; this phenomenon is also observed in our previous works [83]. The TPR curves indicate a two-step reduction of nickel, with the second peak showing higher intensity compared to the first peak. As Ni/Ag content increases, especially for the 1NA600 and 2NA600 samples, there is a slight shift towards higher temperatures in TPR peak positions, as well as an increase in peak area. This suggests that the presence of silver lowers the reduction temperature of nickel.
The catalysts were subjected to an in situ reduction at 400 °C for 1 h after being mounted into the tubular reactor. XRD analyses were then performed on the reduced catalysts. XRD patterns (Figure 8) displayed two or three distinct phases, depending on the concentration. The different peaks were identified as metallic Ag (PDF 89-3722) with peaks at 2θ = 38.12° (111), 44.307° (200), 64.45° (220) and 77.41° (311); metallic Ni (PDF 04-0850) with peaks at 2θ = 44.5° (111), 51.8° (200) and 76.4° (220) and NiO (PDF 47-1049) with peaks at 2θ = 37.24° (111), 43.27°(200), 62.87°(220) and 75.41° (311) for both 1.5NA600 and 2NA600 samples. In the case of the 1NA600 sample, no NiO peaks were observed, indicating that NiO had been completely reduced to metallic Ni during the reduction process. Conversely, the presence of NiO peaks in the diffractogram of the 1.5NA600 and 2NA600 samples suggests that NiO was not fully reduced to Ni during the H2 treatment probably due to the high concentration of nickel oxide present in the sample as observed by EDX analysis (Table 2). The crystallite size of metallic species increases after reduction (Table 2); this increase is very remarkable for the low ratio formulation (Ni/Ag = 1).

2.2. Catalytic Performance in CO2 Reforming of Methane

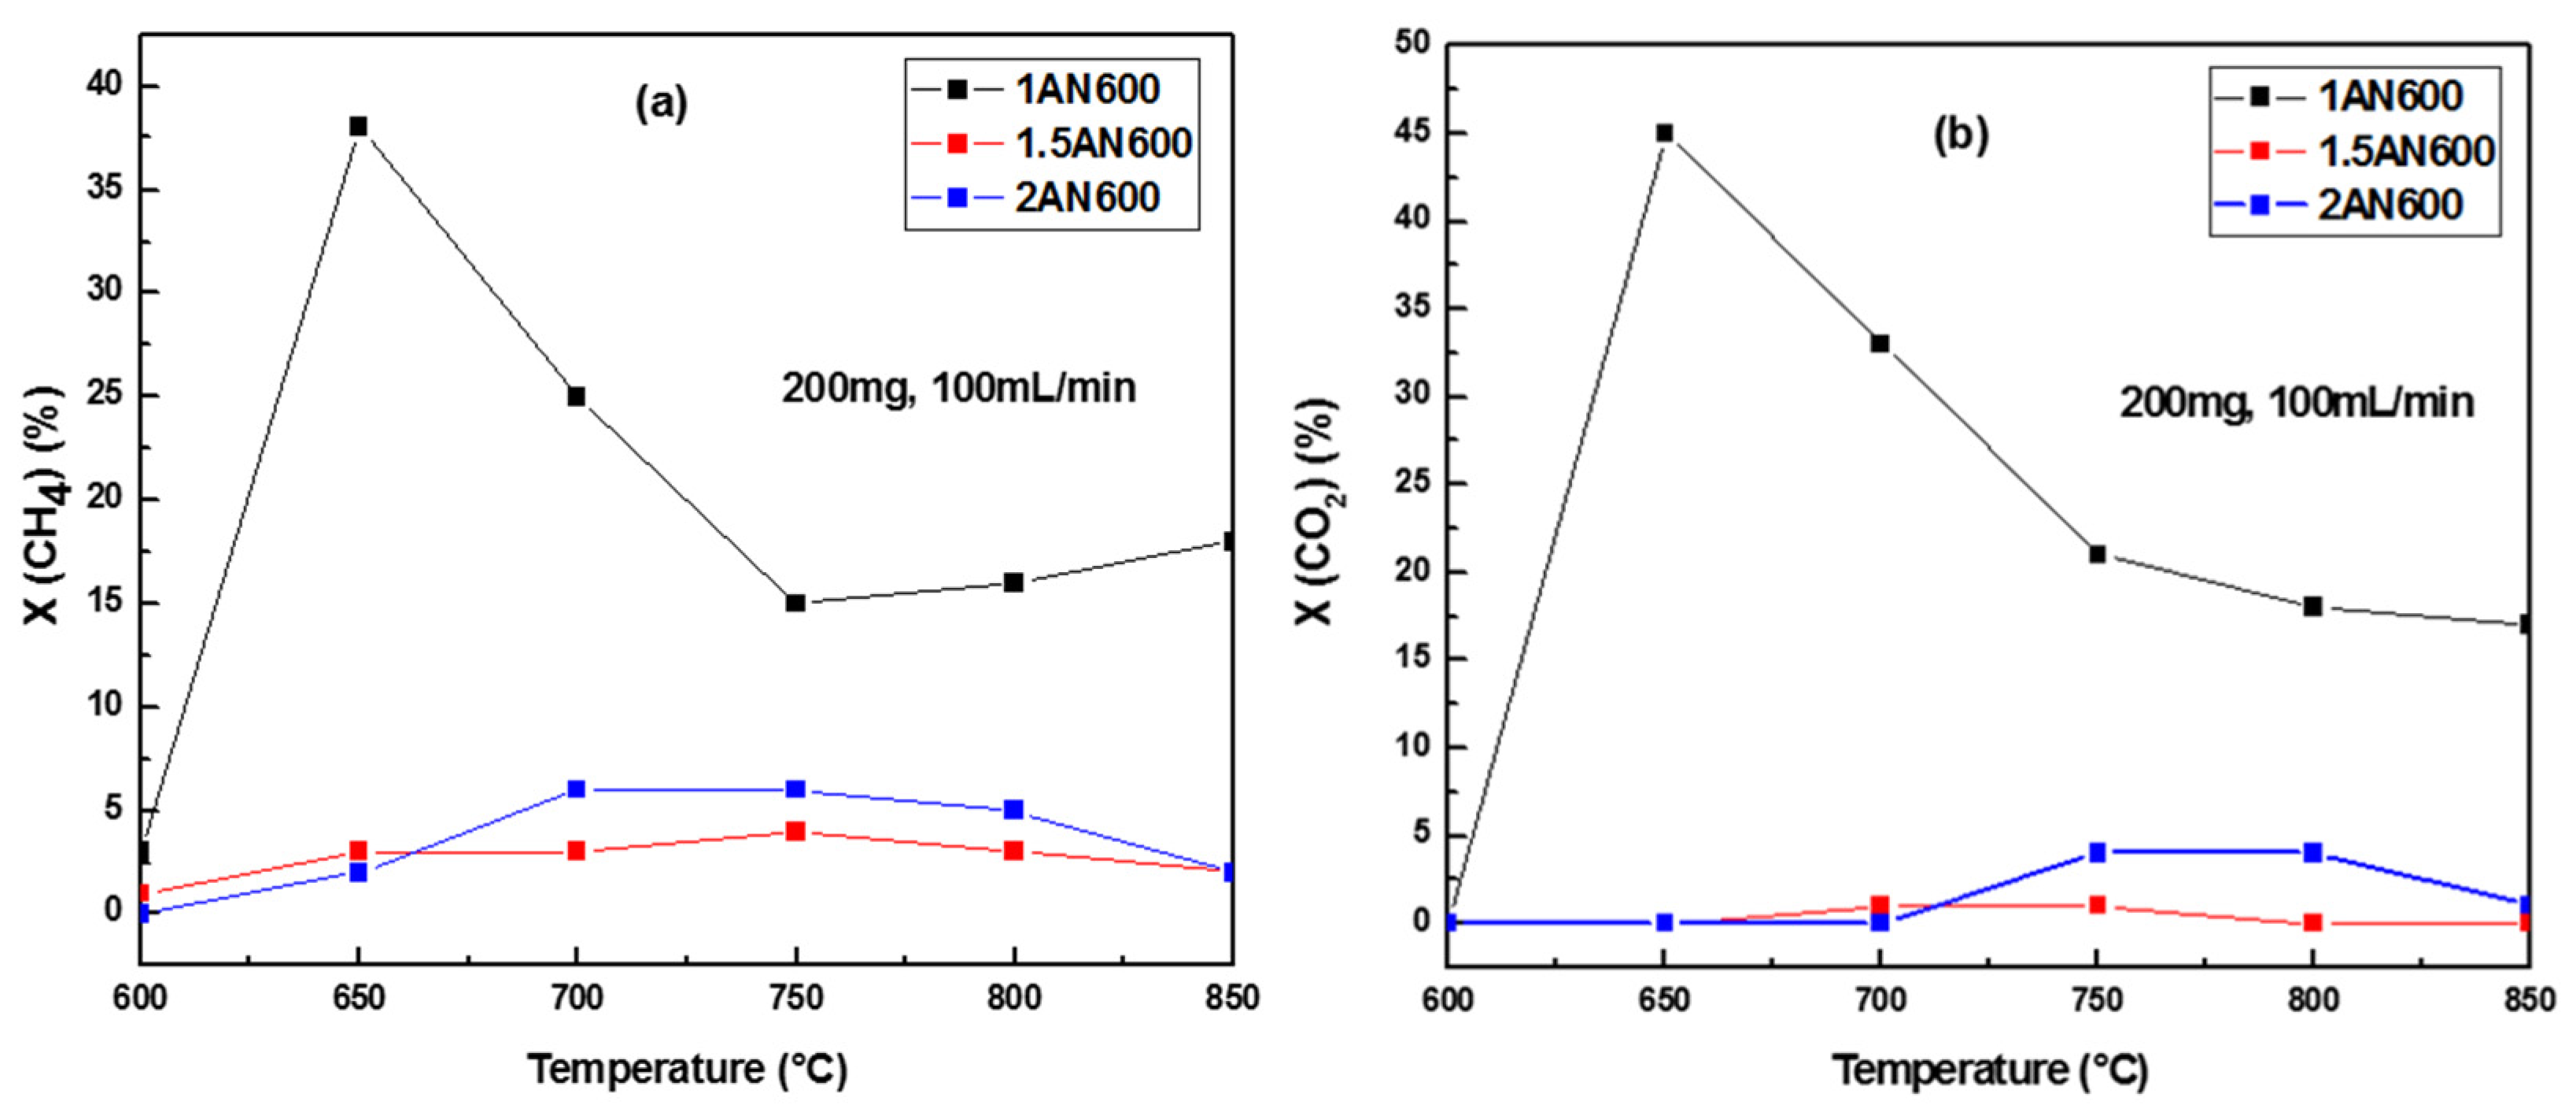
2.2.1. The Catalytic Activity versus Temperature Test

The catalysts obtained after calcination at 600 °C were tested for DRM. We initially established a standard reaction condition to evaluate the performance of the catalysts. In the first series of experiments, the activities of the catalysts were tested at temperatures ranging from 600 to 850 °C. Figure 9 and Figure 10 illustrate the plots of activity, including CH4 and CO2 conversions, H2 selectivity and H2/CO ratio, as a function of temperature. The CH4 and CO2 conversions exhibit similar trends for the three catalysts. The highest CH4 and CO2 conversions are achieved at 650 °C for 1NA600. Catalysts 1.5NA600 and 2NA600 exhibit comparable conversion behaviors. CO2 activation initiates at 650 °C for catalyst 1NA600, 700 °C for 1.5NA600 and 750 °C for 2NA600. There is a variation in the H2/CO ratio among the three catalysts. At 650 °C, the H2/CO ratio reaches its maximum value of 0.7 for 1NA600. In contrast, 1.5NA600 and 2NA600 yield values of 0.1 and 0.4, respectively. Regarding selectivity, 2NA600 demonstrates the highest selectivity. The maximum selectivity of 85% is achieved at 600 °C for 2NA600. At 650 °C and 850 °C, the H2 selectivity reaches its highest values of 71% and 73%, respectively, for 1NA600. The contribution of side reactions, such as (i) CO + 3H2 → CH4 + H2O, (ii) CO2 + 4H2 → CH4 + 2H2O and/or (iii) RWGS (CO2 + H2 ↔ CO + H2O), is probable and conducted mainly to lose the activity. The participation of CO + 3H2 → CH4 + H2O and CO2 + 4H2 → CH4 + 2H2O reactions can be excluded for thermodynamic reasons (ΔG < 0 if T < 500 °C for both reactions, at 800 °C, ΔG(i)~+55.41Kj/mol and ΔG(ii)~+55.98Kj/mol). The contribution of RWGS reaction which tends to reduce H2 production seems thus the most likely (ΔG~0.5 Kj/mol), leading to a reoxidation of the active sites (Ni°) by H2O vapor formed during the catalytic test.
The textural and structural properties of 1NA600 may explain its higher activity compared to 1.5NA600 and 2NA600 catalysts. The higher surface area (20 m2/g vs. 3–5 m2/g) and smaller crystallite size of NiO (Cs = 8.7 Å vs. 12.6–16.8 Å) in 1NA600 likely contribute to the increased conversion of reactants. The reducibility patterns (Figure 7) observed for 2NA600 differ from those of 1NA600 and 1.5NA600, which could explain its higher selectivity. The unexpectedly low activity of 1.5NA600 and 2NA600 is quite surprising considering the significant amount of Ni species used (Ni/Ag = 1.5 and 2), which plays a crucial role in the DRM reaction. Above 750 °C, the curves of CH4 and CO2 conversion no longer exhibit significant changes, indicating progressive deactivation of the catalysts, possibly due to sintering [84]. According to previous literature [84,85,86], coke deposition is attributed to metallic nickel particles. Effectively, catalysts may undergo significant modifications during the reaction. Most probably, the NiO species are reduced to form metallic nickel, which is then could be responsible for the high carbon deposition [84]. It is worth noting that 1NA600 and 2NA600 exhibit low carbon loss, while 1.5NA600 shows no loss. Despite the reduction of NiO, the low carbon deposit observed may be attributed to the introduction of Ag, which minimizes carbon deposition in DRM [11]. Additionally, the disappearance of the active Ni-metallic phase is probably due to the formation of Ni-Ag alloy. Ni-Ag alloy was not detected by XRD analysis (after the isothermal tests). Indeed, we cannot totally exclude the possibility of Ni-Ag alloy formation for many reasons. Ni-Ag alloy could be present in extremely low amounts or maybe well-dispersed, which makes it difficult to detect by the XRD technique. Also, as suggested, Ni-Ag alloy cannot be detected probably due to its amorphous phase.
Based on the research findings presented in references [49,51], it is evident that both Ag and Ni exhibit a significant energetic driving force that favors the formation of a surface alloy instead of a bulk alloy. Specifically, Ag tends to concentrate on the step sites, which are specific crystal defects found on the material’s surface. Benrabaa et al. [85] suggest that the stabilization of Ni metallic species in this alloy could prevent surface sintering and, consequently, the formation of coke. In contrast, the absence of coke deposition in 1.5NA600 can be attributed to its low activity, which is further diminished by the presence of impurities and its specific physicochemical characteristics. In conclusion, 1NA600 demonstrates the best catalytic activity indicating that a Ni/Ag ratio of 1 provides the optimal performance among these formulations.

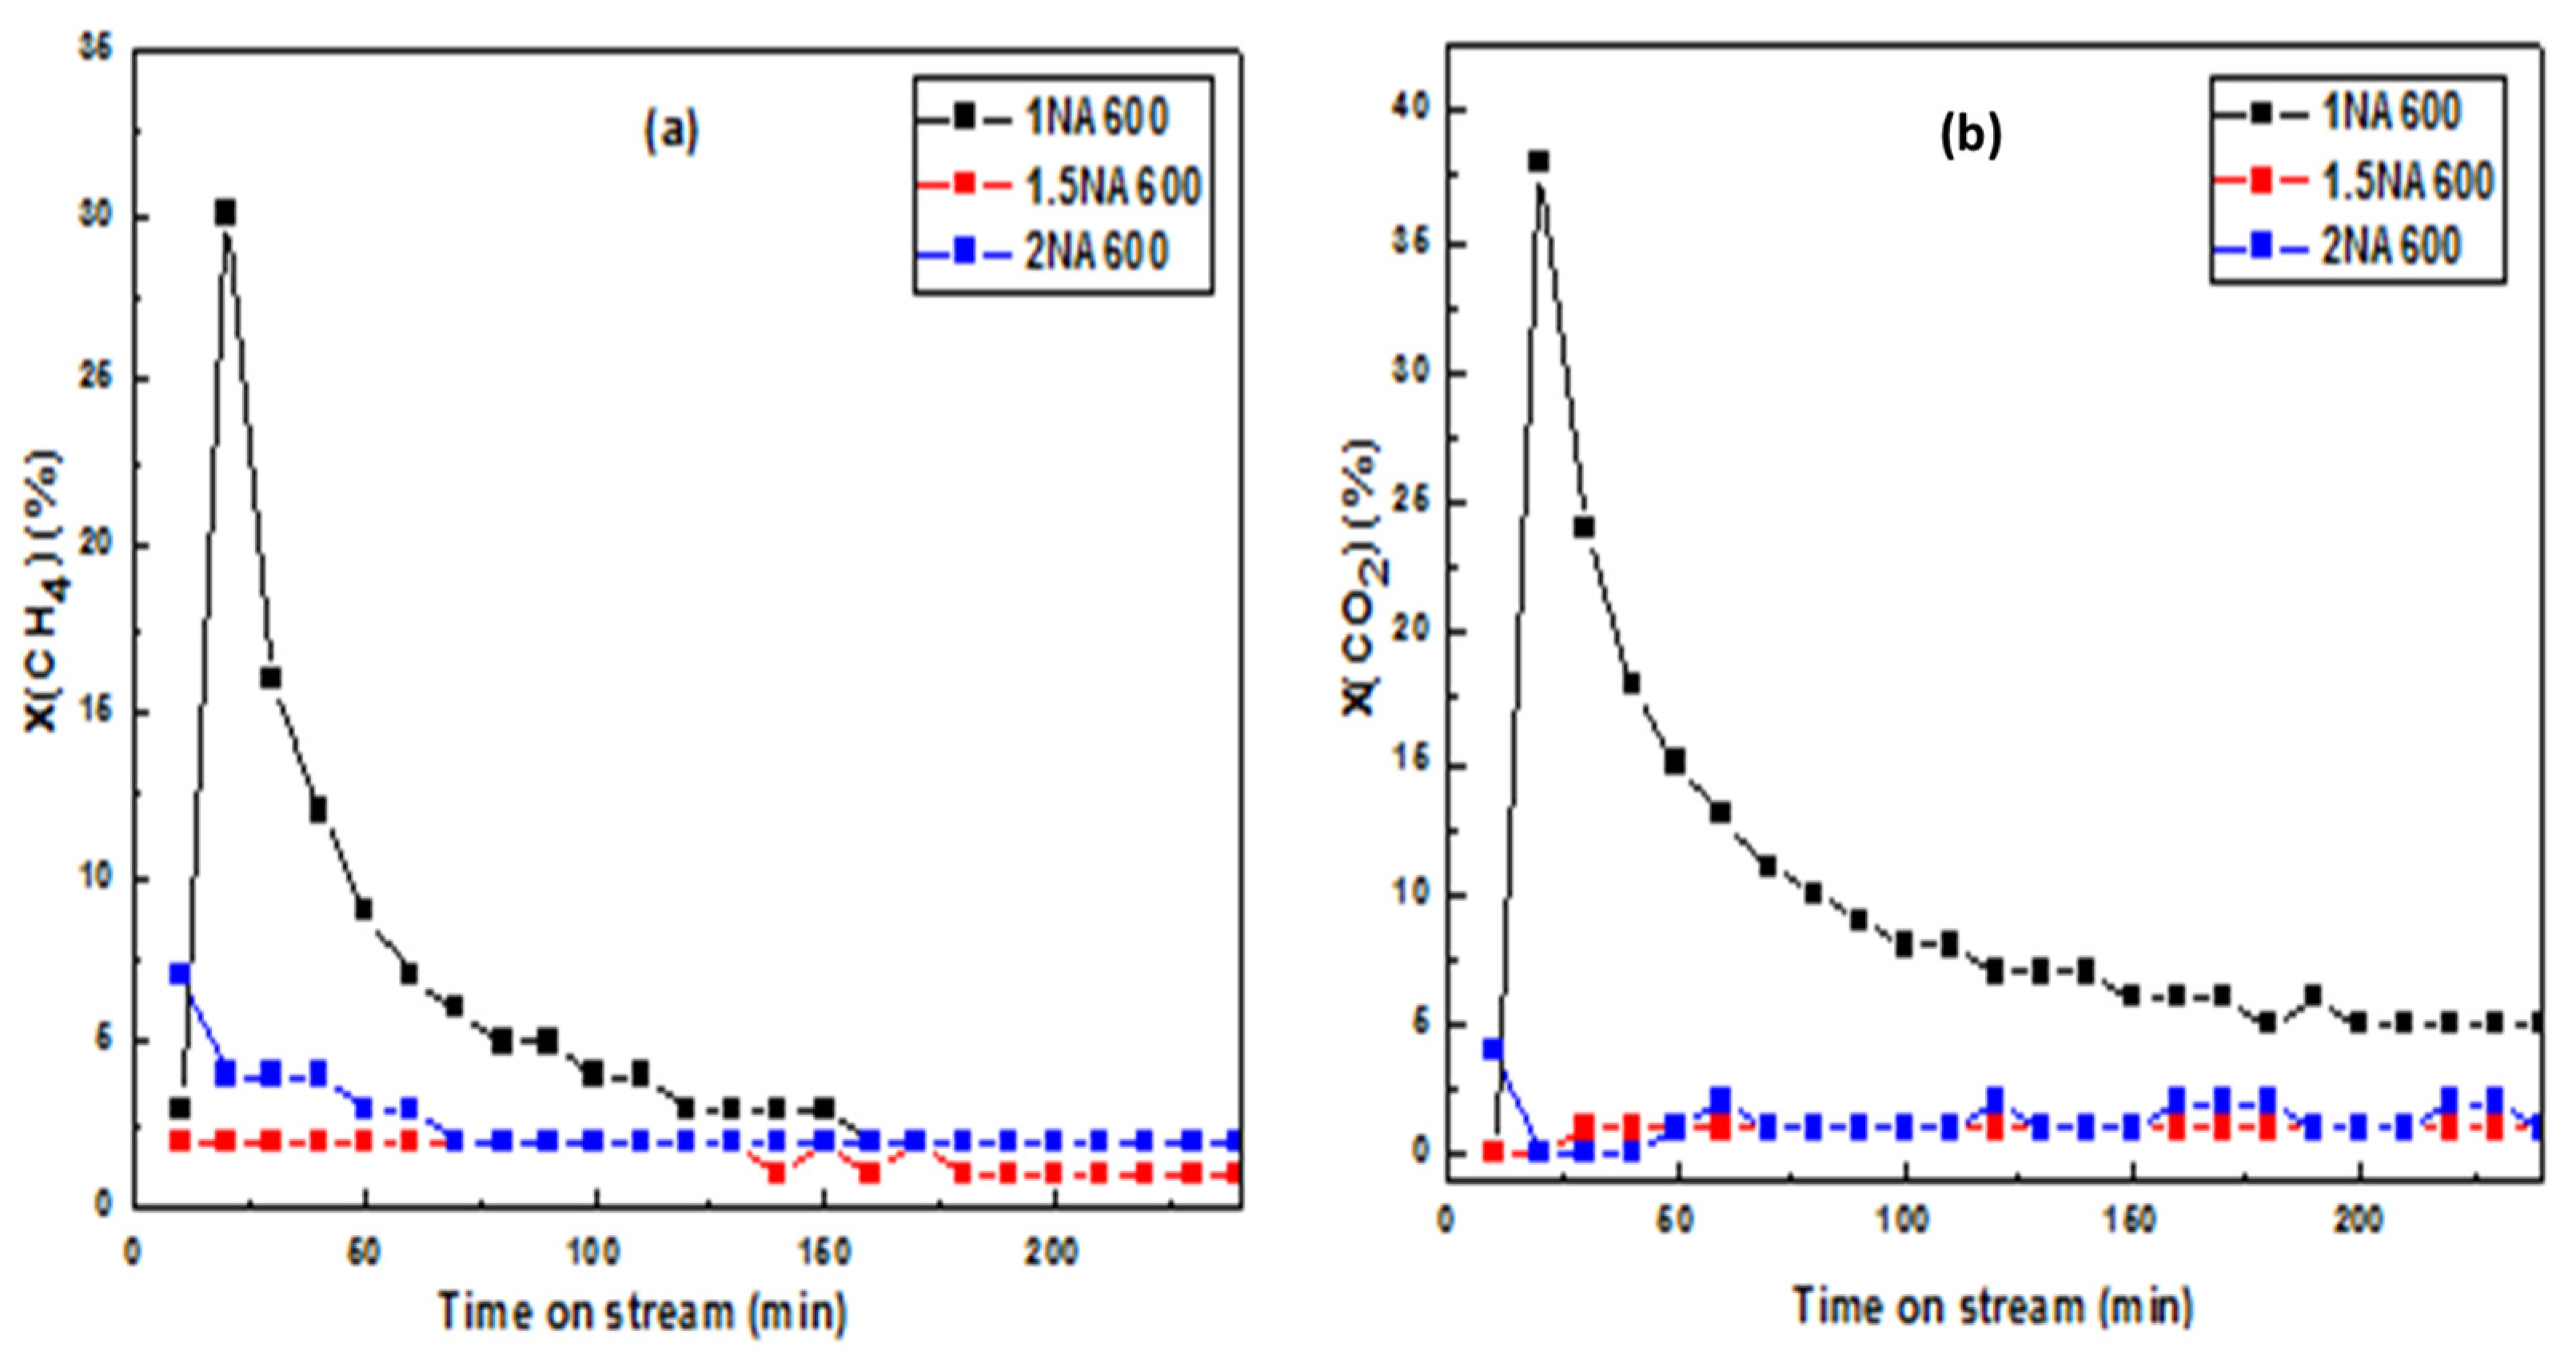
2.2.2. The Time-on-Stream Test

Afterwards, a series of 4 h time-on-stream tests were conducted at 650 °C to evaluate the stability of the synthesized catalysts over time, as illustrated in Figure 11 and Figure 12. Isothermal tests were performed using a new catalyst sample heated to the reaction temperature (650 °C) in inert gas and exposed to reactants for approximately 4 h under the same reaction conditions. Among the catalysts, 1NA600 exhibited higher conversion compared to 1.5NA600 and 2NA600, but the conversion of reactants gradually decreased with time. On the other hand, the conversion of reactants for 1.5NA600 and 2NA600 remained relatively low and stable throughout the studied period (up to 240 min). The CH4 conversion was similar for both 1.5NA600 and 2NA600 catalysts. The sample 1NA600 catalyst showed signs of deactivation starting from the 12th minute, which could be attributed to sintering. However, some residual activity was observed after 150 min. The isothermal reactivity test at 650 °C is aligned with the results of the temperature rise test at the same temperature.
In contrast to the temperature rise test at 650 °C, which showed no conversion of CO2, the isothermal reactivity test of 2NA600 revealed a low conversion of CO2 at the 50th minute. The H2/CO ratio for 1NA600 initially reached its maximum value of 0.5 but gradually decreased and stabilized around 0.3 after the 100th minute. For 2NA600, after an unexpected drop, the H2/CO ratio progressively increased, approaching the value of 0.6. In the case of 1.5NA600, it reached its maximum value at the 30th minute and remained stable. While the H2 selectivity tended to decrease with time for 1NA600, it started to increase again from the 130th minute. On the other hand, it continued to increase over time for 2NA600 and 1.5NA600.
It is worth noting that the CH4 conversion was higher than the CO2 conversion for the 1.5NA600 and 2NA600 catalysts, which could be attributed to the combustion of methane given the low H2/CO. This combustion is linked to the reduction of the catalyst, which releases oxygen responsible for the oxidation of methane. The results obtained at the 20 min mark for the three catalysts are consistent with those obtained during the temperature rise catalytic test at the temperature of 650 °C.
XRD (Figure 13) and Raman spectroscopy (Figure 14) analyses were conducted on the catalysts after the isothermal tests. XRD reveals lines corresponding to the cubic structure of silver (PDF 89-3722) with peaks at 2θ = 38.12° (111), 44.307° (200) and 64.45° (220) and the metallic nickel phase (PDF 04-0850) with peaks at 2θ = 44.5° (111), 51.8° (200) and 76.4° (220). Furthermore, despite the prior sieving of the catalysts, characteristic peaks of SiC are observed. Raman spectra show mainly the line of SiC at 760, 780 and 960 cm−1, with no lines at 1500 cm−1 suggesting that there is no deposited carbon. The analyses after the reaction indicate that deactivation might be due mainly to sintering phenomena. After the reaction, a volcano change in crystallite size was observed (Table 2); the 1NA600 sample shows the lowest crystallite size value of Ni metallic species (30 nm).

3. Materials and Methods

3.1. Chemicals

Nickel (II) nitrate hexahydrate (Ni(NO3)2,6H2O, ≥97%, Rectapur), silver nitrate (AgNO3, ≥98%, Alfa Aesar), sodium hydroxide (NaOH, ≥99%, AnalaR NORMAPUR) and ethanol absolute (C2H5OH, ≥99.8%, AnalaR NORMAPUR) were used in catalysts preparation. All reagents were analytical grade and used without any further purification. Distilled water was used in the synthesis and washing processes.

3.2. Catalyst Preparation

Catalysts based on silver and nickel were synthesized using the coprecipitation method by varying the molar ratio of Ni and Ag (Ni/Ag = 1, 1.5 and 2). The starting salts, silver nitrate and nickel nitrate, are dissolved separately in distilled water. Then the two solutions are mixed and placed under moderate stirring. The precipitating agent NaOH (2M) was added drop by drop until the pH of the mixture reached the value of 10. The product obtained was washed with distilled water and ethanol, dried at 100 °C, then ground and calcined at 600 °C. The obtained powders are afterward denoted 1NA600, 1.5NA600 and 2NA600 in this manuscript.

3.3. Catalysts Characterization

Several physicochemical methods were used for the characterization of the catalysts before and after heating treatment and also after catalytic tests.
Thermogravimetry differential thermal analysis (TG-DSC) was performed on a TA instrument SDT Q600. The sample was heated at 5 °C/min from 25 to 1000 °C. The analyses were carried out with a total flow rate of 100 mL/min (20% O2 in helium). The released gases that evolved during the analysis were monitored by a Pfeiffer Omnistar mass spectrometer. X-ray powder diffraction (XRD) was performed using a Bruker AXS D8 Advance diffractometer working in Bragg–Brentano geometry using Cu Kα radiation (λ = 1.54 Å), equipped with a LynxEye detector. Patterns were collected at room temperature, in the 2θ = 10–80° range, with a 0.02° step and 96s counting time per step. The EVA (version 6.1.0.4 Bruker AXS GmbH, Karlsruhe, Germany) software was used for phase identification, and the unit cell parameters were optimized by Rietveld refinement using the Jana2020 crystallographic software. The elemental analysis was performed by inductively coupled plasma-optic emission spectroscopy (ICP-OES) 720-ES ICP-OES (Agilent, Santa Clara, CA, USA) with axially viewing and simultaneous CCD detection. The quantitative determination of metal content in the catalysts was based on the analysis of certificated standard solutions. The ICP ExpertTM software (version 2.0.4) provides the concentration of metal in samples allowing estimating the weight percentage of Ag and Ni. All the analyses were performed 40 min after the spectrometer was turned on to achieve a stable plasma as well as constant and reproducible sample introduction. The sample preparation was made by dissolving 10 mg of dried and ground samples catalyst in concentrated 4 mL of HNO3. All the sample solutions were heated to 80 °C in a sonicator for 2 h. Then, the solution was diluted up to 20 mL with ultrapure water before being analyzed by ICP-OES. The surface areas were calculated from N2 adsorption–desorption isotherms measured on a FlowSorb III Micromeritics (Norcross, GA, USA) analyzer by Brunauer–Emmett–Teller (B.E.T). The morphology of catalysts was examined by scanning electron microscopy (SEM) (S-3400N, Hitachi, Tokyo, Japan). The energy-dispersive X-ray spectra (EDX) (Thermo, Waltham, MA, USA) SCIENTIFIC UltraDry) of samples were also acquired during their conventional scanning electron microscopic investigations. X-ray photoelectron spectroscopy (XPS) was carried out on Escalab 220 XL (Vacuum Generators, Seoul, Republic of Korea) spectrometer. A monochromatic Al Kα X-ray source was used, and electron energies were measured in the constant analyzer energy mode. The pass energy was 100 eV for the survey of spectra and 40 eV for the single-element spectra. All XPS binding energies were referred to C1s core level at 285 eV. The angle between the incident X-rays and the analyzer was 58°, with photoelectrons being collected perpendicularly to the sample surface. Spectra were analyzed with the CasaXPS software (version 2.3.25). The reducible species that existed in the catalysts were profiled by temperature-programmed reduction. Hydrogen temperature-programmed reduction (H2-TPR) was measured on a Micromeritics AutoChem II 2920 apparatus with a thermal conductivity detector (TCD) to monitor the H2 consumption. After calibration of H2 on the TCD, samples were sealed in a U-shaped quartz tube reactor and pre-treated in an argon atmosphere to remove surface impurities. Then, the temperature was raised from 25 to 1000 °C at 5 °C/min in a stream of 5% v/v H2/ Ar. Laser-Raman spectra were recorded from 200 to 1500 cm−1 at room temperature using an FT-Raman spectrometer (Dilor XY Raman, Horiba France, Palaiseau, France) at an excitation wavelength of 647.1 nm, laser power of 3 mW and spectral resolution of 0.5 cm−1.

3.4. Catalytic Reforming Experiments

The catalytic performance test was conducted under atmospheric pressure in a fixed-bed quartz flow reactor, which was placed inside a programmable oven. Prior to loading into the reactor, the catalyst (200 mg) was thoroughly mixed with silicon carbide (SiC) powder (1000 mg). A mixture of methane, carbon dioxide and argon (CH4:CO2:Ar = 20:20:60) with a total flow of 100 mL/min was introduced into the reactor, and the reaction was initiated by gradually increasing the temperature from room temperature up to 850 °C at a heating rate of 5 °C/min. Online mass spectrometry (OmniStar, Pfeiffer Vacuum, Asslar, Germany) was used to analyze all effluents during the reaction.
In the initial phase of the experiment, the catalysts were tested for their activities at temperatures ranging from 600 to 850 °C. Subsequently, isothermal reactivity tests were performed using a fresh sample of the catalyst heated to a reaction temperature of 650 °C. The samples were exposed to the same reaction conditions for approximately 4 h. After the evaluation through isothermal tests, each catalyst was characterized using XRD analysis.

4. Conclusions

In summary, the findings from this study on CO2 reforming of methane lead to several significant conclusions. Firstly, the catalysts exhibited relative stability in composition and structure at high calcination temperatures. XRD analysis confirmed the presence of metallic silver and nickel oxide as the main phases in the catalysts after calcination at different temperatures. EDX analysis further detected the presence of Ag and Ni elements, with a higher concentration of nickel observed in the upper layers of the catalysts. The morphological and surface properties of the catalysts were also investigated. BET analysis revealed a decrease in specific surface area with an increase in the Ni/Ag ratio, indicating the agglomeration of silver particles on the catalyst surface. SEM images showed variations in particle shapes and agglomeration patterns influenced by the loading of nickel in the catalysts. Regarding catalytic performance, catalyst 1NA600 demonstrated the highest activity, with the highest CH4, CO2 conversions and H2/CO ratio achieved at 650 °C. 2NA600 catalyst exhibited the highest selectivity, reaching a maximum of 85% at 600 °C. 1NA600 catalyst showed higher activity attributed to its higher specific surface area and smaller crystallite size of NiO. Both 1NA600 and 2NA600 demonstrated low carbon loss, while 1.5NA600 showed no loss. This study opens the path for further investigation through adequate process conditions (e.g., by adding another metal) in order to slow the reduction of the material or through further investigation of material design and synthesis to better stabilize the active species.

Author Contributions

Conceptualization and methodology: A.L. and R.B.; catalysts preparation: H.H.; characterizations: R.B., P.R. and A.L.; writing—original draft preparation: H.H., R.B., P.R. and A.L.; DRM experiments: H.H.; supervision: A.L. and R.B. All authors have read and agreed to the published version of the manuscript.

Funding

This work was partially supported by the Algerian Petroleum Institute/Sonatrach and UCCS-Lille.

Data Availability Statement

Data available within the article.

Acknowledgments

H.H. gratefully acknowledges UCCS in providing the necessary facilities to conduct the work. Additionally, H.H. extends her heartfelt appreciation to Pardis Simon, Olivier Gardol, Laurence Burylo and Martine Trentesaux for the technical assistance and fruitful discussion. Chevreul Institute (CNRS FR2638) is acknowledged for funding X-ray and XPS facilities. H.H. is grateful for the support from the IAP Institute.

Conflicts of Interest

The authors declare that they have no known competing financial interests or personal relationships that could have appeared to influence the work reported in this paper.

References

  1. Le Saché, E.; Reina, T.R. Analysis of Dry Reforming as direct route for gas phase CO2 conversion. The past, the present and future of catalytic DRM technologies. Prog. Energy Combust. Sci. 2022, 89, 100970. [Google Scholar] [CrossRef]
  2. Fischer, F.; Tropsch, H. The Preparation of Synthetic Oil Mixture from Carbon Monoxide and Hydrogen. Brennstoff-Chem 1928, 9, 539. [Google Scholar]
  3. Tungatarova, S.; Xanthopoulou, G. Ni-Al Self-Propagating High-Temperature Synthesis Catalysts in Dry Reforming of Methane to Hydrogen-Enriched Fuel Mixtures. Catalysts 2022, 12, 1270. [Google Scholar] [CrossRef]
  4. Ashcroft, A.; Cheetham, A.K. Partial oxidation of methane to synthesis gas using carbon dioxide. Nature 1991, 352, 225–226. [Google Scholar] [CrossRef]
  5. Liu, C.J.; Ye, J. Progresses in the preparation of coke resistant Ni-based catalyst for steam and CO2 reforming of methane. ChemCatChem 2011, 3, 529–541. [Google Scholar] [CrossRef]
  6. Hu, Y.H. Advances in catalysts for CO2 reforming of methane. Advances in CO2 conversion and utilization. ACS Publ. 2010, 1056, 155–174. [Google Scholar] [CrossRef]
  7. Chen, W.; Zhao, G. High carbon-resistance Ni/CeAlO3-Al2O3 catalyst for CH4/CO2 reforming. Appl. Catal. B Environ. 2013, 136, 260–268. [Google Scholar] [CrossRef]
  8. Aziz, M.; Setiabudi, H. A review of heterogeneous catalysts for syngas production via dry reforming. J. Taiwan Inst. Chem. Eng. 2019, 101, 139–158. [Google Scholar] [CrossRef]
  9. Rostrup-Nielsen, J.R. Catalytic Steam Reforming; Springer: Berlin/Heidelberg, Germany, 1984. [Google Scholar] [CrossRef]
  10. Lercher, J.A.; Bitter, J.H.; Steghuis, A.G.; Van Ommen, J.G.; Seshan, K. Methane utilisation via synthesis gas generation-catalytic chemistry and technology. In Environmental Catalysis; World Scientific Publishing Co Pte Ltd.: Singapore, 1999. [Google Scholar] [CrossRef]
  11. Yu, M.; Zhu, Y.A.; Lu, Y.; Tong, G.; Zhu, K.; Zhou, X. The promoting role of Ag in Ni-CeO2 catalyzed CH4-CO2 dry reforming reaction. Appl. Catal. B Environ. 2015, 165, 43–56. [Google Scholar] [CrossRef]
  12. Djinović, P.; Črnivec, I.G.O. Influence of active metal loading and oxygen mobility on coke-free dry reforming of Ni–Co bimetallic catalysts. Appl. Catal. B Environ. 2012, 125, 259–270. [Google Scholar] [CrossRef]
  13. San-José-Alonso, D.; Juan-Juan, J. Ni, Co and bimetallic Ni–Co catalysts for the dry reforming of methane. Appl. Catal. A Gen. 2009, 371, 54–59. [Google Scholar] [CrossRef]
  14. Gaur, S.; Haynes, D.J. Rh, Ni, and Ca substituted pyrochlore catalysts for dry reforming of methane. Appl. Catal. A Gen. 2011, 403, 142–151. [Google Scholar] [CrossRef]
  15. Lavoie, J.M. Review on dry reforming of methane, a potentially more environmentally-friendly approach to the increasing natural gas exploitation. Front. Chem. 2014, 2, 81. [Google Scholar] [CrossRef] [PubMed]
  16. Ginsburg, J.M.; Piña, J.; El Solh, T.; De Lasa, H.I. Coke formation over a nickel catalyst under methane dry reforming conditions: Thermodynamic and kinetic models. Ind. Eng. Chem. Res. 2005, 44, 4846–4854. [Google Scholar] [CrossRef]
  17. Bradford, M.C.; Vannice, M.A. Catalytic reforming of methane with carbon dioxide over nickel catalysts II. Reaction kinetics. Appl. Catal. A Gen. 1996, 142, 97–122. [Google Scholar] [CrossRef]
  18. Pakhare, D.; Spivey, J. A review of dry (CO2) reforming of methane over noble metal catalysts. Chem. Soc. Rev. 2014, 43, 7813–7837. [Google Scholar] [CrossRef]
  19. James, O.O.; Maity, S. Towards reforming technologies for production of hydrogen exclusively from renewable resources. Green Chem. 2011, 13, 2272–2284. [Google Scholar] [CrossRef]
  20. Labinger, J.A.; Bercaw, J.E. Understanding and exploiting C–H bond activation. Nature 2002, 417, 507–514. [Google Scholar] [CrossRef] [PubMed]
  21. Yao, L.; Shi, J.; Xu, H.; Shen, W.; Hu, C. Low-temperature CO2 reforming of methane on Zr-promoted Ni/SiO2 catalyst. Fuel Process. Technol. 2016, 144, 1–7. [Google Scholar] [CrossRef]
  22. Tomiyama, S.; Takahashi, R.; Sato, S.; Sodesawa, T.; Yoshida, S. Preparation of Ni/SiO2 catalyst with high thermal stability for CO2-reforming of CH4. Appl. Catal. A Gen. 2003, 241, 349–361. [Google Scholar] [CrossRef]
  23. Uchida, T.; Ikeda, I.Y.; Takeya, S.; Kamata, Y.; Ohmura, R.; Nagao, J.; Buffett, B.A. Kinetics and stability of CH4–CO2 mixed gas hydrates during formation and long-term storage. ChemPhysChem 2005, 6, 646–654. [Google Scholar] [CrossRef]
  24. Al-Fatesh, A.S.; Amin, A.; Ibrahim, A.A.; Khan, W.U.; Soliman, M.A.; AL-Otaibi, R.L.; Fakeeha, A.H. Effect of Ce and Co addition to Fe/Al2O3 for catalytic methane decomposition. Catalysts 2016, 6, 40. [Google Scholar] [CrossRef]
  25. Mette, K.; Kühl, S.; Tarasov, A.; Düdder, H.; Kähler, K.; Muhler, M.; Behrens, M. Redox dynamics of Ni catalysts in CO2 reforming of methane. Catal. Today 2015, 242, 101–110. [Google Scholar] [CrossRef]
  26. Angeli, S.D.; Turchetti, L.; Monteleone, G.; Lemonidou, A.A. Catalyst development for steam reforming of methane and model biogas at low temperature. Appl. Catal. B Environ. 2016, 181, 34–46. [Google Scholar] [CrossRef]
  27. Cao, C.; Bourane, A.; Schlup, J.R.; Hohn, K.L. In situ IR investigation of activation and catalytic ignition of methane over Rh/Al2O3 catalysts. Appl. Catal. A Gen. 2008, 344, 78–87. [Google Scholar] [CrossRef]
  28. Bian, Z.; Kawi, S. Highly carbon-resistant Ni–Co/SiO2 catalysts derived from phyllosilicates for dry reforming of methane. J. CO2 Util. 2017, 18, 345–352. [Google Scholar] [CrossRef]
  29. Nikoo, M.K.; Amin, N. Thermodynamic analysis of carbon dioxide reforming of methane in view of solid carbon formation. Fuel Process. Technol. 2011, 92, 678–691. [Google Scholar] [CrossRef]
  30. Challiwala, M.S.; Ibrahim, G.; Choudhury, H.A.; Elbashir, N.O. Scaling Up the Advanced Dry Reforming of Methane (DRM) Reactor System for Multi-Walled Carbon Nanotubes and Syngas Production: An Experimental and Modeling Study. Chem. Eng. Process. Process Intensif. 2024, 197, 109693. [Google Scholar] [CrossRef]
  31. Pinto, D.; Hu, L.; Urakawa, A. Enabling complete conversion of CH4 and CO2 in dynamic coke-mediated dry reforming (DC-DRM) on Ni catalysts. Chem. Eng. J. 2023, 474, 145641. [Google Scholar] [CrossRef]
  32. Gamal, A.; Eid, K.; Abdullah, A.M. Engineering of Pt-based nanostructures for efficient dry (CO2) reforming: Strategy and mechanism for rich-hydrogen production. Int. J. Hydrogen Energy 2022, 47, 5901–5928. [Google Scholar] [CrossRef]
  33. Faroldi, B.; Múnera, J. Well-dispersed Rh nanoparticles with high activity for the dry reforming of methane. Int. J. Hydrogen Energy 2017, 42, 16127–16138. [Google Scholar] [CrossRef]
  34. Luisetto, I.; Sarno, C. Packed and monolithic reactors for the dry reforming of methane: Ni supported on γ-Al2O3 promoted by Ru. Adv. Sci. Lett. 2017, 23, 5977–5979. [Google Scholar] [CrossRef]
  35. Xanthopoulou, G.; Varitis, S.; Zhumabek, M.; Karanasios, K.; Vekinis, G.; Tungatarova, S.A.; Baizhumanova, T.S. Direct Reduction in Greenhouse Gases by Continuous Dry (CO2) Reforming of Methane over Ni-Containing SHS Catalysts. Energies 2021, 14, 6078. [Google Scholar] [CrossRef]
  36. Abdullah, B.; Abd Ghani, N.A. Recent advances in dry reforming of methane over Ni-based catalysts. J. Clean. Prod. 2017, 162, 170–185. [Google Scholar] [CrossRef]
  37. Chen, L.W.; Ng, K.H. Hydrothermally synthesized tremella-like monometallic Ni/SiO2 for effective and stable dry reforming of methane (DRM) to syngas. Process Saf. Environ. Prot. 2024, 183, 244–259. [Google Scholar] [CrossRef]
  38. Zhao, R.; Cao, K.; Ye, R.; Tang, Y.; Du, C.; Liu, F.; Shan, B. Deciphering the stability mechanism of Pt-Ni/Al2O3 catalysts in syngas production via DRM. Chem. Eng. J. 2024, 491, 151966. [Google Scholar] [CrossRef]
  39. Gutiérrez, M.C.; Hernández, P.S.; Anzures, F.M.; Martínez, A.G.; Galicia, G.M.; García, M.E.F.; Pérez-Hernández, R. MgO impregnation to Al2O3 supported Ni catalyst for SYNGAS production using greenhouse gases: Some aspects of chemical state of Ni species. Int. J. Hydrogen Energy 2024, 52, 1131–1140. [Google Scholar] [CrossRef]
  40. Alabi, W.O.; Adesanmi, B.M.; Wang, H.; Patzig, C. Correlation of MgO loading to spinel inversion, octahedral site occupancy, site generation and performance of bimetal Co–Ni catalyst for dry reforming of CH4. Int. J. Hydrogen Energy 2024, 51, 1087–1098. [Google Scholar] [CrossRef]
  41. Wen, F.; Xu, C.; Huang, N.; Wang, T.; Sun, X.; Li, H.; Xia, G. Exceptional stability of spinel Ni–MgAl2O4 catalyst with ordered mesoporous structure for dry reforming of methane. Int. J. Hydrogen Energy 2024, 69, 1481–1491. [Google Scholar] [CrossRef]
  42. Zhang, Z.; Bi, G.; Zhong, J.; Xie, J. Key features of nano NixMg1-xAl2O4 spinel for biogas bi-reforming: CO2 activation and coke elimination. Int. J. Hydrogen Energy 2024, 53, 383–393. [Google Scholar] [CrossRef]
  43. Yang, T.; Zhang, J.; Rao, Q.; Gai, Z.; Li, Y.; Li, P.; Jin, H. Reversible exsolution of iron from perovskites for highly selective syngas production via chemical looping dry reforming of methane. Fuel 2024, 366, 131386. [Google Scholar] [CrossRef]
  44. Cao, D.; Luo, C.; Luo, T.; Shi, Z.; Wu, F.; Li, X.; Zhang, L. Dry reforming of methane by La2NiO4 perovskite oxide: B-site substitution improving reactivity and stability. Chem. Eng. J. 2024, 482, 148701. [Google Scholar] [CrossRef]
  45. Jagadeesh, P.; Varun, Y.; Reddy, B.H.; Sreedhar, I.; Singh, S.A. A short review on recent advancements of dry reforming of methane (DRM) over pyrochlores. Mater. Today Proc. 2024, 72, 361–369. [Google Scholar] [CrossRef]
  46. Cheng, H.; Su, P.; Yuan, S.W.; Wang, Z.; Liu, M. Preparation of a green and highly active vermiculite-derived hydrotalcite and its application in methane dry reforming. Int. J. Hydrogen Energy 2024, 50, 726–733. [Google Scholar] [CrossRef]
  47. Maziviero, F.V.; Melo, D.M.; Medeiros, R.L.; Silva, J.C.; Araújo, T.R.; Oliveira, Â.A.; Melo, M.A. Influence of Mn, Mg, Ce and P promoters on Ni-X/Al2O3 catalysts for dry reforming of methane. J. Energy Inst. 2024, 113, 101523. [Google Scholar] [CrossRef]
  48. Chaudhary, K.J.; Al-Fatesh, A.S.; Ibrahim, A.A.; Osman, A.I.; Fakeeha, A.H.; Alhoshan, M.; Kumar, R. Enhanced hydrogen production through methane dry reforming: Evaluating the effects of promoter-induced variations in reducibility, basicity, and crystallinity on Ni/ZSM-5 catalyst performance. Energy Convers. Manag. 2024, 23, 100631. [Google Scholar] [CrossRef]
  49. Vang, R.T.; Honkala, K. Controlling the catalytic bond-breaking selectivity of Ni surfaces by step blocking. Nat. Mater. 2005, 4, 160–162. [Google Scholar] [CrossRef] [PubMed]
  50. Parizotto, N.; Rocha, K. Alumina-supported Ni catalysts modified with silver for the steam reforming of methane: Effect of Ag on the control of coke formation. Appl. Catal. A Gen. 2007, 330, 12–22. [Google Scholar] [CrossRef]
  51. Lauritsen, J.V.; Vang, R.T. From atom-resolved scanning tunneling microscopy (STM) studies to the design of new catalysts. Catal. Today 2006, 111, 34–43. [Google Scholar] [CrossRef]
  52. Gavrielatos, I.; Montinaro, D. Thermogravimetric and Electrocatalytic Study of Carbon Deposition of Ag-doped Ni/YSZ Electrodes under Internal CH4 Steam Reforming Conditions. Fuel Cells 2009, 9, 883–890. [Google Scholar] [CrossRef]
  53. Jeong, H.; Kang, M. Hydrogen production from butane steam reforming over Ni/Ag loaded MgAl2O4 catalyst. Appl. Catal. B Environ. 2010, 95, 446–455. [Google Scholar] [CrossRef]
  54. Rovik, A.K.; Klitgaard, S.K. Effect of alloying on carbon formation during ethane dehydrogenation. Appl. Catal. A Gen. 2009, 358, 269–278. [Google Scholar] [CrossRef]
  55. Xu, Y.; Fan, C. Effect of Ag on the control of Ni-catalyzed carbon formation: A density functional theory study. Catal. Today 2012, 186, 54–62. [Google Scholar] [CrossRef]
  56. Zhu, Y.A.; Chen, D. First-principles calculations of C diffusion through the surface and subsurface of Ag/Ni (1 0 0) and reconstructed Ag/Ni (1 0 0). Surf. Sci. 2010, 604, 186–195. [Google Scholar] [CrossRef]
  57. Boldrin, P.; Ruiz-Trejo, E.; Mermelstein, J.; Bermúdez Men´endez, J.M.; Ramírez Reina, T.; Brandon, N.P. Strategies for Carbon and Sulfur Tolerant Solid Oxide Fuel Cell Materials, Incorporating Lessons from Heterogeneous Catalysis. Chem. Rev. 2016, 116, 13633–13684. [Google Scholar] [CrossRef] [PubMed]
  58. Carrasco-Ruiz, S.; Zhang, Q.; Gándara-Loe, J.; Pastor-Pérez, L.; Odriozola, J.A.; Reina, T.R.; Bobadilla, L.F. H2-rich syngas production from biogas reforming: Overcoming coking and sintering using bimetallic Ni-based catalysts. Int. J. Hydrogen Energy 2023, 48, 27907–27917. [Google Scholar] [CrossRef]
  59. Fang, X.; Mao, L.; Xu, L.; Shen, J.; Xu, J.; Xu, X.; Wang, X. Ni-Fe/La2O3 bimetallic catalysts for methane dry reforming: Elucidating the role of Fe for improving coke resistance. Fuel 2024, 357, 129950. [Google Scholar] [CrossRef]
  60. Armengol-Profitós, M.; Braga, A.; Pascua-Solé, L.; Lucentini, I.; Garcia, X.; Soler, L.; Llorca, J. Enhancing the performance of a novel CoRu/CeO2 bimetallic catalyst for the dry reforming of methane via a mechanochemical process. Appl. Catal. B Environ. 2024, 345, 123624. [Google Scholar] [CrossRef]
  61. Diao, J.F.; Zhang, T.; Xu, Z.N.; Guo, G.C. The atomic-level adjacent NiFe bimetallic catalyst significantly improves the activity and stability for plasma-involved dry reforming reaction of CH4 and CO2. Chem. Eng. J. 2023, 467, 143271. [Google Scholar] [CrossRef]
  62. Pandey, S.K.; Tripathi, M.K.; Ramanathan, V.; Mishra, P.K.; Tiwary, D. Highly facile Ag/NiO nanocomposite synthesized by sol-gel method for mineralization of rhodamine B. J. Phys. Chem. Solids 2021, 159, 110287. [Google Scholar] [CrossRef]
  63. Zhou, L.X.; Yang, Y.Y. In situ synthesis of Ag/NiO derived from hetero-metallic MOF for supercapacitor application. Chem. Pap. 2021, 75, 1795–1807. [Google Scholar] [CrossRef]
  64. Nagamuthu, S.; Ryu, K.S. Synthesis of Ag/NiO honeycomb structured nanoarrays as the electrode material for high performance asymmetric supercapacitor devices. Sci. Rep. 2019, 9, 4864. [Google Scholar] [CrossRef]
  65. Aydoghmish, S.M.; Hassanzadeh-Tabrizi, S. Facile synthesis and investigation of NiO–ZnO–Ag nanocomposites as efficient photocatalysts for degradation of methylene blue dye. Ceram. Int. 2019, 45, 14934–14942. [Google Scholar] [CrossRef]
  66. Khedkar, C.V.; Vedpathak, A.S. Synthesis, characterization, electrochemical and catalytic performance of NiO nanostructures and Ag-NiO nanocomposite. Chem. Phys. Impact 2023, 6, 100153. [Google Scholar] [CrossRef]
  67. Zhang, X.W.; Su, Y.X. Effect of Ag on deNOx performance of SCR-C3H6 over Fe/Al-PILC catalysts. J. Fuel Chem. Technol. 2019, 47, 1368–1378. [Google Scholar] [CrossRef]
  68. Predoi, D.; Jitianu, A. Study of FexOy–SiO2 nanoparticles obtained by sol-gel synthesis. Dig. J. Nanomater. Biostruct 2006, 1, 93–97. [Google Scholar]
  69. Singh, A.; Yadav, B.C. Green synthesized ZnO/NiO heterostructures based quick responsive LPG sensor for the detection of below LEL with DFT calculations. Results Surf. Interfaces 2023, 11, 100103. [Google Scholar] [CrossRef]
  70. Prieto, P.; Nistor, V.; Nouneh, K.; Oyama, M.; Abd-Lefdil, M.; Díaz, R. XPS study of silver, nickel and bimetallic silver–nickel nanoparticles prepared by seed-mediated growth. Appl. Surf. Sci. 2012, 258, 8807–8813. [Google Scholar] [CrossRef]
  71. X-ray Photoelectron Spectroscopy (XPS) reference pages. Available online: http://www.xpsfitting.com/ (accessed on 1 March 2024).
  72. Biesinger, M.C.; Payne, B.P.; Grosvenor, A.P.; Lau, L.W.; Gerson, A.R.; Smart, R.S.C. Resolving surface chemical states in XPS analysis of first row transition metals, oxides and hydroxides: Cr, Mn, Fe, Co and Ni. Appl. Surf. Sci. 2011, 257, 2717–2730. [Google Scholar] [CrossRef]
  73. Wandekar, R.; Ali, M. Physicochemical studies of NiO–GDC composites. Mater. Chem. Phys. 2006, 99, 289–294. [Google Scholar] [CrossRef]
  74. Augusto, B.L.; Costa, L.O. Ethanol reforming over Ni/CeGd catalysts with low Ni content. Int. J. Hydrogen Energy 2012, 37, 12258–12270. [Google Scholar] [CrossRef]
  75. Pérez-Hernández, R.; Galicia, G.M. Synthesis and characterization of bimetallic Cu–Ni/ZrO2 nanocatalysts: H2 production by oxidative steam reforming of methanol. Int. J. Hydrogen Energy 2008, 33, 4569–4576. [Google Scholar] [CrossRef]
  76. Ashok, J.; Subrahmanyam, M. Hydrotalcite structure derived Ni–Cu–Al catalysts for the production of H2 by CH4 decomposition. Int. J. Hydrogen Energy 2008, 33, 2704–2713. [Google Scholar] [CrossRef]
  77. Montoya, J.A.; Romero-Pascual, E. Methane reforming with CO2 over Ni/ZrO2–CeO2 catalysts prepared by sol–gel. Catal. Today 2000, 63, 71–85. [Google Scholar] [CrossRef]
  78. Shan, W.; Luo, M. Reduction property and catalytic activity of Ce1−XNiXO2 mixed oxide catalysts for CH4 oxidation. Appl. Catal. A Gen. 2003, 246, 1–9. [Google Scholar] [CrossRef]
  79. Kirumakki, S.R.; Shpeizer, B.G. Hydrogenation of naphthalene over NiO/SiO2–Al2O3 catalysts: Structure–activity correlation. J. Catal. 2006, 242, 319–331. [Google Scholar] [CrossRef]
  80. Joo, O.S.; Jung, K.D. CH4 dry reforming on alumina-supported nickel catalyst. Bull. Korean Chem. Soc. 2002, 23, 1149–1153. [Google Scholar] [CrossRef]
  81. Casenave, S.; Martinez, H. Acid–base properties of Mg–Ni–Al mixed oxides using LDH as precursors. Thermochim. Acta 2001, 379, 85–93. [Google Scholar] [CrossRef]
  82. Casenave, S.; Martinez, H. Acid-Base properties of MgCuAl mixed oxides. J. Therm. Anal. Calorim. 2003, 72, 191–198. [Google Scholar] [CrossRef]
  83. Benrabaa, R.; Löfberg, A.; Rubbens, A.; Bordes-Richard, E.; Vannier, R.N.; Barama, A. Structure, reactivity and catalytic properties of nanoparticles of nickel ferrite in the dry reforming of methane. Catal. Today 2013, 203, 188–195. [Google Scholar] [CrossRef]
  84. Hallassi, M.; Benrabaa, R. Characterization and Syngas Production at Low Temperature via Dry Reforming of Methane over Ni-M (M= Fe, Cr) Catalysts Tailored from LDH Structure. Catalysts 2022, 12, 1507. [Google Scholar] [CrossRef]
  85. Benrabaa, R.; Boukhlouf, H.; Löfberg, A.; Rubbens, A.; Vannier, R.N.; Bordes-Richard, E.; Barama, A. Nickel ferrite spinel as catalyst precursor in the dry reforming of methane: Synthesis, characterization and catalytic properties. J. Nat. Gas Chem. 2012, 21, 595–604. [Google Scholar] [CrossRef]
  86. Slagtern, Å.; Olsbye, U. Partial oxidation of methane to synthesis gas using La-MO catalysts. Appl. Catal. A Gen. 1994, 110, 99–108. [Google Scholar] [CrossRef]
Figure 1. TG-DSC curves of 2NA100 precursors.
Catalysts 14 00400 g001
Figure 2. X-ray diffraction profiles of precursors calcined at high temperatures (600, 700, 1000 and 1200 °C).
Catalysts 14 00400 g002
Figure 3. Rietveld refinement of the catalyst calcined at 600 °C (Ni/Ag = 1).
Catalysts 14 00400 g003
Figure 4. SEM pictures of (a) 1NA600, (b) 1.5NA600 and (c) 2NA600.
Catalysts 14 00400 g004
Figure 5. XPS spectra of Ag species of 1NA600, 1.5NA600 and 2NA600 catalysts.
Catalysts 14 00400 g005
Figure 6. XPS spectra of Ni species of 1NA600, 1.5NA600 and 2NA600 catalysts.
Catalysts 14 00400 g006
Figure 7. H2-TPR profiles of fresh catalysts.
Catalysts 14 00400 g007
Figure 8. XRD patterns of reduced catalysts after reduction at 400 °C for 1 h.
Catalysts 14 00400 g008
Figure 9. CH4 (a) and CO2 (b) conversions obtained on the fresh catalysts performed between 600 and 850 °C.
Catalysts 14 00400 g009
Figure 10. H2/CO ratio (a) and H2 selectivity (b) obtained on the fresh catalysts performed between 600 and 850 °C.
Catalysts 14 00400 g010
Figure 11. CH4 (a) and CO2 (b) conversions obtained on the fresh catalysts performed at 650 °C.
Catalysts 14 00400 g011
Figure 12. H2/CO ratio (a) and H2 selectivity (b) obtained on the fresh catalysts performed at 650 °C.
Catalysts 14 00400 g012
Figure 13. XRD analysis obtained on the spent catalysts performed at 650 °C.
Catalysts 14 00400 g013
Figure 14. Raman spectra obtained on the spent catalysts performed at 650 °C.
Catalysts 14 00400 g014
Table 1. Reactions in DRM [29].
Reaction NameReaction Equation ΔH298K (kJ/mol)
Main reaction
1Dry reforming of CH4CH4 + CO2 ↔ 2CO + 2H2+247
Side reactions
2Reverse water–gas shiftCO2 + H2 ↔ CO + H2O+41
3Decomposition of CH4CH4 ↔ C + 2H2+75
4Disproportionation of CO2CO ↔ C + CO2−172
5Hydrogenation of CO2CO2 + 2H2 ↔ C + 2H2O−90
6Hydrogenation of COCO + H2 ↔ C + H2O−131
Table 2. Composition, refined structural parameters and specific surface area of synthesized catalysts.
CatalystB.E.T. XRD DataEDXICPXPS
SSA (m2/g)Phase RatioCs a (n m)Cs b (nm)Cs c (nm)a d (Å)Ni/AgNi/AgNi/Ag
1NA60020NiO (69)
Ag (31)
8.7 (6)
70 (4)
Ni: 12.6 (2)
Ag: 21.3 (2)
NiO: 3.2 (1)
Ni: 30 (1)
Ag: 20.8 (4)
4.177 (2)
4.0875 (5)
1.30.736.7
1.5NA6003NiO (71)
Ag (29)
12.6 (5)
6.5 (3)
Ni: 13.1 (1)
Ag: 12.7 (1)
NiO: 7.4 (1)
Ni: 39 (3)
Ag:21 (1)
4.177 (2)
4.092 (2)
1.90.966.5
2NA6005NiO (80)
Ag (20)
16.8 (4)
7.5 (3)
Ni: 15.1 (1)
Ag: 12.2 (1)
NiO: 7.6 (2)
Ni: 35 (2)
Ag: 16.3 (1)
4.1801 (7)
4.0917 (9)
31.516.6
a Crystallite size after calcination at 600 °C. b Crystallite size after reduction. c Crystallite size after the reaction. d Cell parameter, between brackets is a mass phase (%).
Disclaimer/Publisher’s Note: The statements, opinions and data contained in all publications are solely those of the individual author(s) and contributor(s) and not of MDPI and/or the editor(s). MDPI and/or the editor(s) disclaim responsibility for any injury to people or property resulting from any ideas, methods, instructions or products referred to in the content.

