

Patterns of Formation of Binary Cobalt–Magnesium Oxide Combustion Catalysts of Various Composition

 , , , , , , ,
  , , , , , and
Abstract
1. Introduction
2. Results
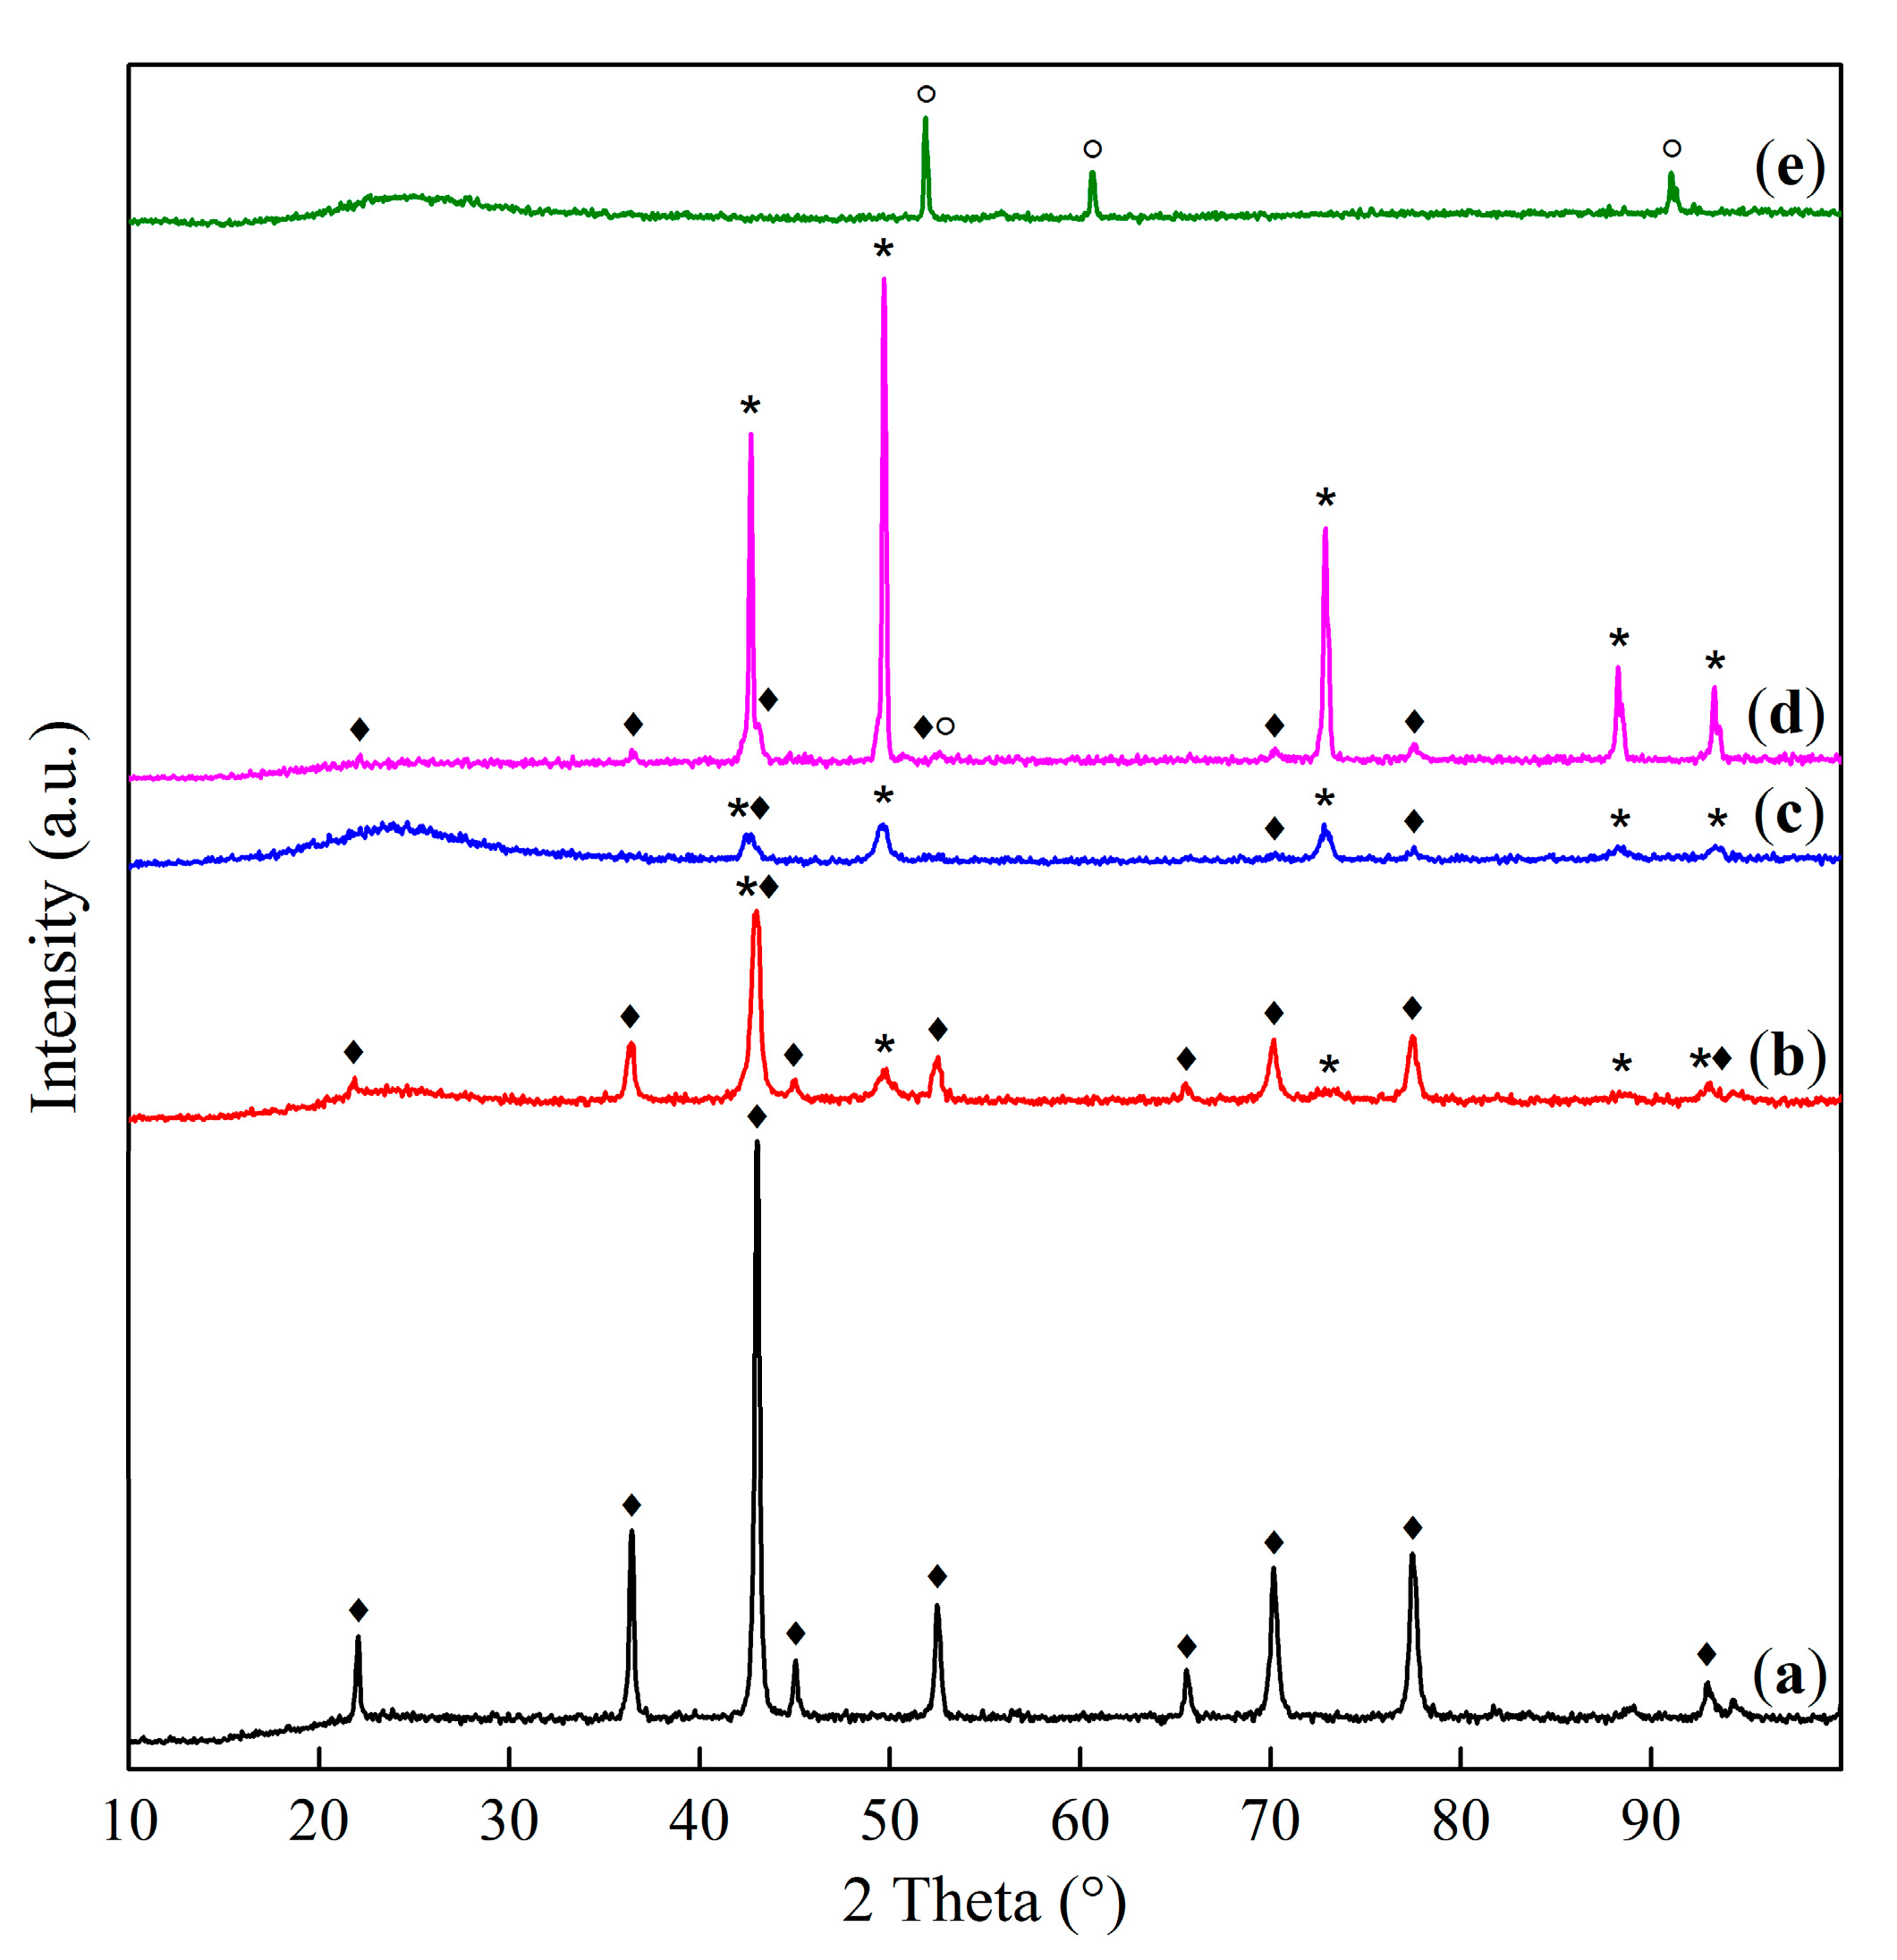
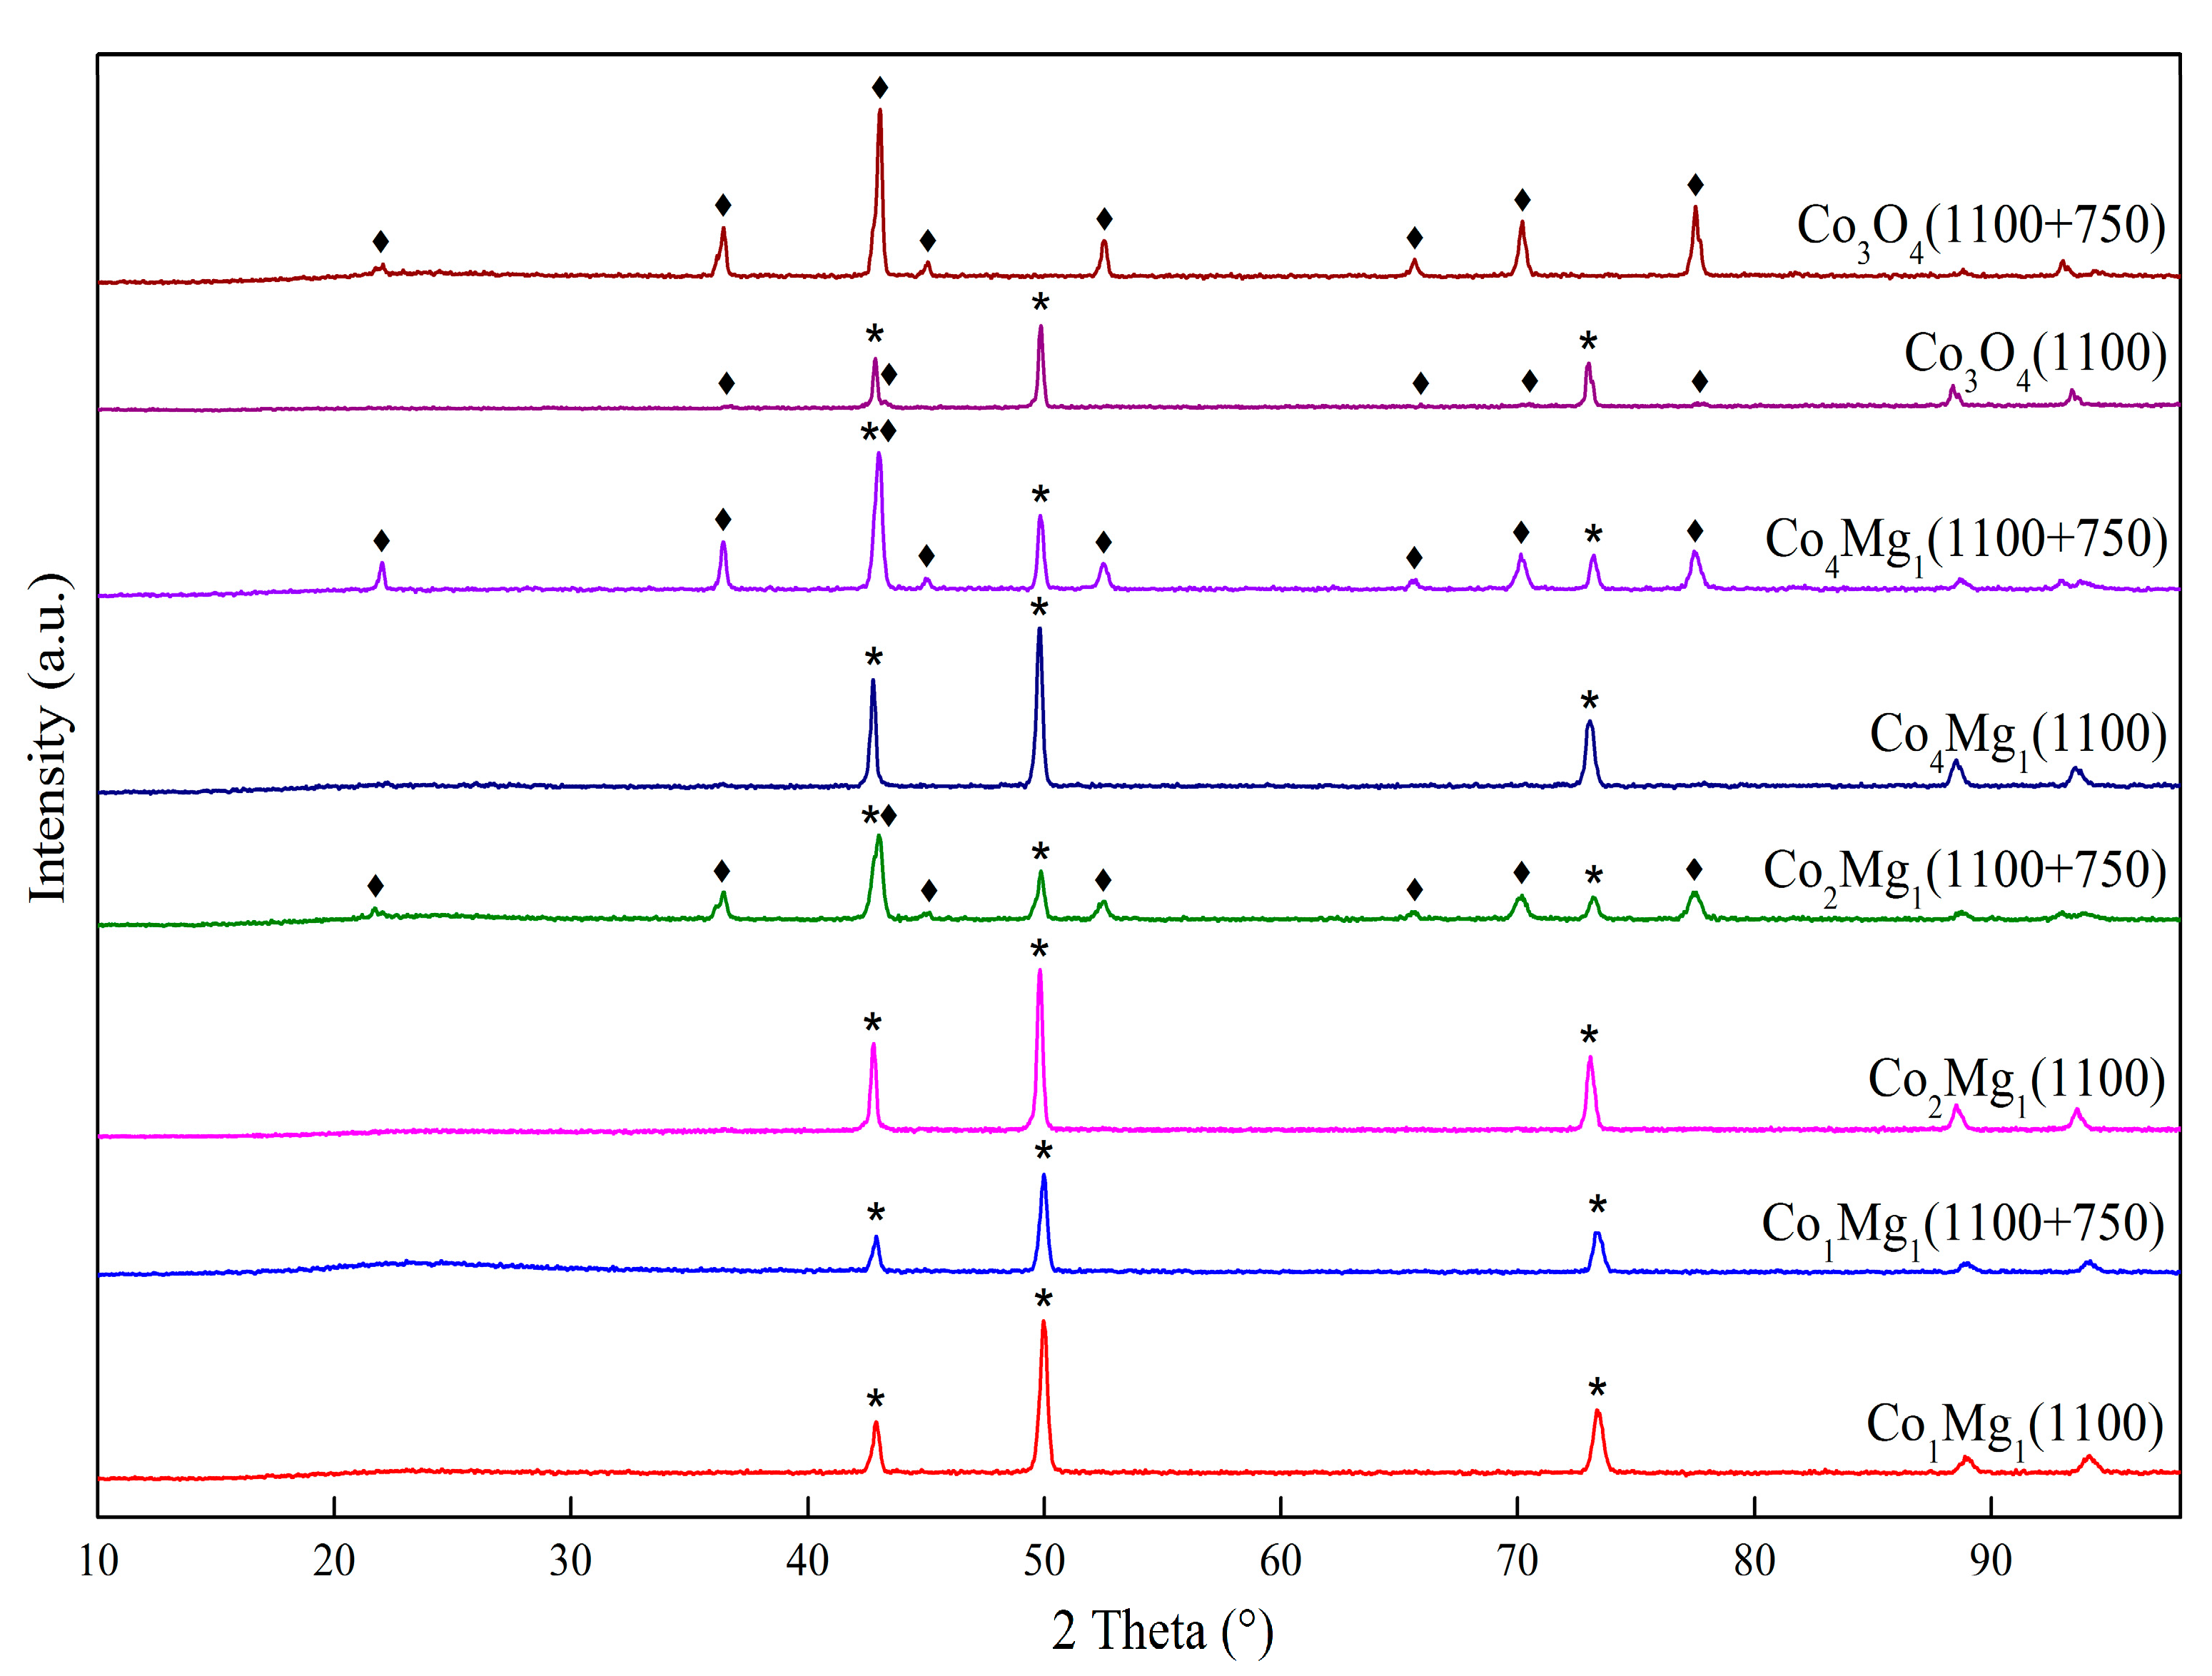
2.1. Phase Composition and Structure of Samples
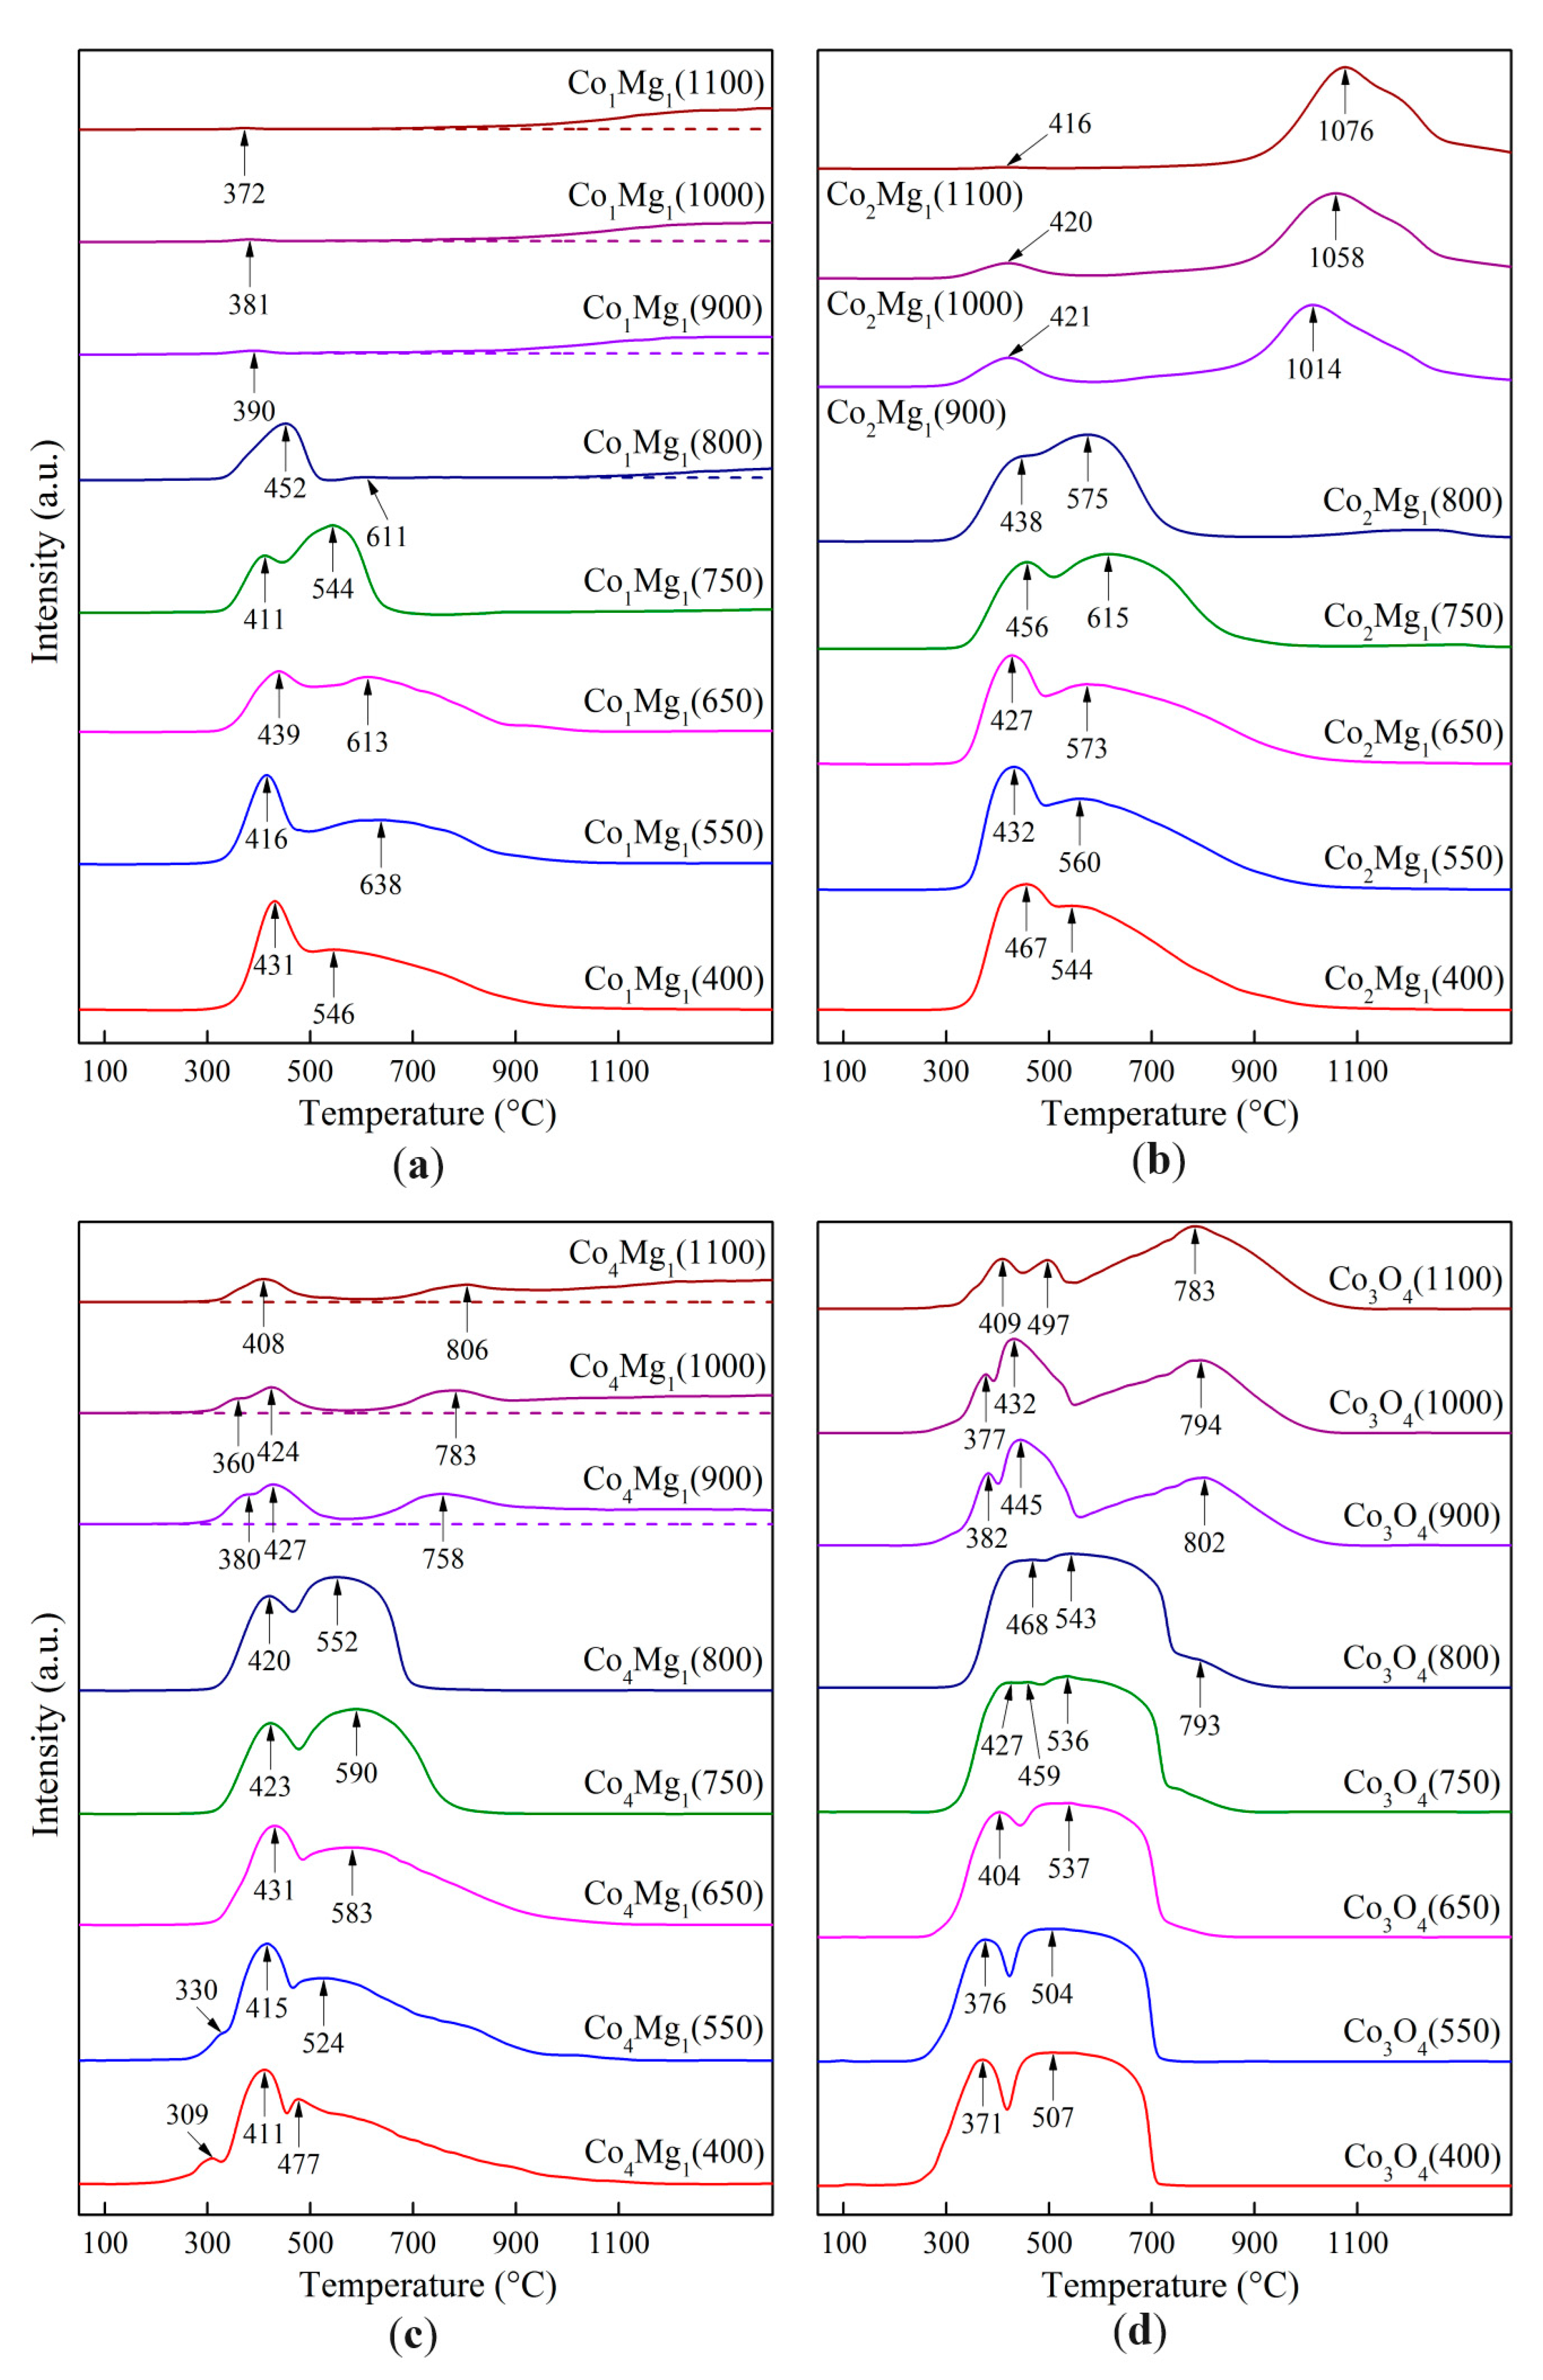
2.2. Oxygen Reactivity of the Samples
2.3. Regeneration Ability of Samples
3. Materials and Methods
3.1. Preparation of Samples
3.2. Study of Samples
4. Conclusions
Author Contributions
Funding
Data Availability Statement
Acknowledgments
Conflicts of Interest
References
- Larki, I.; Zahedi, A.; Asadi, M.; Forootan, M.M.; Farajollahi, M.; Ahmadi, R.; Ahmadi, A. Mitigation approaches and techniques for combustion power plants flue gas emissions: A comprehensive review. Sci. Total Environ. 2023, 903, 166108. [Google Scholar] [CrossRef]
- Yalcin, S.; Konukman, A.E.Ş.; Midilli, A. A perspective on fossil fuel-based flue gas emission reduction technologies. Greenhouse Gases 2020, 10, 664–677. [Google Scholar] [CrossRef]
- Fu, L.R.Z.; Si, W.; Ma, Q.; Huang, W.; Liao, K.; Huang, Z.; Wang, Y.; Li, J.; Xu, P. Research progress on CO2 capture and utilization technology. J. CO2 Util. 2022, 66, 102260. [Google Scholar] [CrossRef]
- Madejski, P.; Chmiel, K.; Subramanian, N.; Kuś, T. Methods and techniques for CO2 capture: Review of potential solutions and applications in modern energy technologies. Energies 2022, 15, 887. [Google Scholar] [CrossRef]
- Zhang, J.; Xiao, P.; Li, G.; Webley, P.A. Effect of flue gas impurities on CO2 capture performance from flue gas at coal-fired power stations by vacuum swing adsorption. Energy Procedia 2009, 1, 1115–1122. [Google Scholar] [CrossRef]
- Majchrzak-Kucęba, I.; Wawrzyńczak, D.; Zdeb, J.; Smółka, W.; Zajchowski, A. Treatment of flue gas in a CO2 capture pilot plant for a commercial CFB boiler. Energies 2021, 14, 2458. [Google Scholar] [CrossRef]
- Abbas, Z.; Mezher, T.; Abu-Zahra, M.R.M. CO2 purification. I. Purification requirement review and the selection of impurities deep removal technologies. Int. J. Greenh. Gas Control 2013, 16, 324–334. [Google Scholar] [CrossRef]
- Kim, H.S.; Kim, H.J.; Kim, J.H.; Kim, J.H.; Kang, S.H.; Ryu, J.H.; Park, N.K.; Yun, D.S.; Bae, J.W. Noble-metal-based catalytic oxidation technology trends for volatile organic compound (VOC) removal. Catalysts 2022, 12, 63. [Google Scholar] [CrossRef]
- Feng, X.; Jiang, L.; Li, D.; Tian, S.; Zhu, X.; Wang, H.; He, C.; Li, K. Progress and key challenges in catalytic combustion of lean methane. J. Energy Chem. 2022, 75, 173–215. [Google Scholar] [CrossRef]
- Tang, Z.; Zhang, T.; Luo, D.; Wang, Y.; Hu, Z.; Yang, R.T. Catalytic combustion of methane: From mechanism and materials properties to catalytic performance. ACS Catal. 2022, 12, 13457–13474. [Google Scholar] [CrossRef]
- Golodets, G.I. Heterogenous catalytic reactions involving molecular oxygen. Stud. Sur. Sci. Catal. 1983, 15, 437–469. [Google Scholar]
- Tsyrul’nikov, P.G. Thermal activation effect on catalytic systems MnOx/Al2O3 for deep oxidation of hydrocarbons. Russ. J. Gen. Chem. 2007, 77, 2328–2336. [Google Scholar] [CrossRef]
- Wang, Q.; Peng, Y.; Fu, J.; Kyzas, G.Z.; Billah, S.M.R.; An, S. Synthesis, characterization, and catalytic evaluation of Co3O4/γ-Al2O3 as methane combustion catalysts: Significance of Co species and the redox cycle. Appl. Catal. B 2015, 168, 42–50. [Google Scholar] [CrossRef]
- Choya, A.; de Rivas, B.; Gutiérrez-Ortiz, J.I.; López-Fonseca, R. Comparative study of strategies for enhancing the performance of Co3O4/Al2O3 catalysts for lean methane combustion. Catalysts 2020, 10, 757. [Google Scholar] [CrossRef]
- Massenova, A.; Kalykberdiyev, M.; Sass, A.; Kenzin, N.; Ussenov, A.; Baiken, A.; Rakhmetova, K. Catalytic technologies for solving environmental problems in the production of fuels and motor transport in Kazakhstan. Catalysts 2020, 10, 1197. [Google Scholar] [CrossRef]
- Varga, G.; Sápi, A.; Varga, T.; Baán, K.; Szenti, I.; Halasi, G.; Mucsi, R.; Óvári, L.; Kiss, J.; Fogarassy, Z.; et al. Ambient pressure CO2 hydrogenation over a cobalt/manganese-oxide nanostructured interface: A combined in situ and ex situ study. J. Catal. 2020, 386, 70–80. [Google Scholar] [CrossRef]
- Varga, G.; Szenti, I.; Kiss, J.; Baán, K.; Halasi, G.; Óvári, L.; Szamosvölgyi, Á.; Mucsi, R.; Dodony, E.; Fogarassy, Z.; et al. Decisive role of Cu/Co interfaces in copper cobaltite derivatives for high performance CO2 methanation catalyst. J. CO2 Util. 2023, 75, 102582. [Google Scholar] [CrossRef]
- Wang, H.Y.; Ruckenstein, E. Partial oxidation of methane to synthesis gas over alkaline earth metal oxide supported cobalt catalysts. J. Catal. 2001, 199, 309–317. [Google Scholar] [CrossRef]
- Choya, A.; de Rivas, B.; González-Velasco, J.R.; Gutiérrez-Ortiz, J.I.; López-Fonseca, R. On the beneficial effect of MgO promoter on the performance of Co3O4/Al2O3 catalysts for combustion of dilute methane. Appl. Catal. A 2019, 582, 117099. [Google Scholar] [CrossRef]
- Zhao, L.; Ji, S.; Yin, F.; Lu, Z.; Liu, H.; Li, C. Catalytic combustion of methane over Co1–xMgxO/Al2O3/FeCrAl monolithic catalysts. J. Nat. Gas. Chem. 2006, 15, 287–296. [Google Scholar] [CrossRef]
- Navrotsky, A.; Kleppa, O.J. The thermodynamics of cation distributions in simple spinels. J. Inorg. Nucl. Chem. 1967, 29, 2701–2714. [Google Scholar] [CrossRef]
- Kiselev, V.F.; Krylov, O.V. Adsorption and Catalysis on Transition Metals and Their Oxides; Springer: Berlin/Heidelberg, Germany, 1989; p. 445. ISBN 978-3-642-73887-6. [Google Scholar]
- Zhylkybek, M.; Khussain, B.; Sass, A.; Torlopov, I.; Baizhumanova, T.; Tungatarova, S.; Brodskiy, A.; Xanthopoulou, G.; Rakhmetova, K.; Sarsenova, R.; et al. Cobalt–magnesium oxide catalysts for deep oxidation of hydrocarbons. Catalysts 2024, 14, 136. [Google Scholar] [CrossRef]
- Yagi, S.; Ichikawa, Y.; Yamada, I.; Doi, T.; Ichitsubo, T.; Matsubara, E. Synthesis of binary magnesium-transition metal oxides via inverse co-precipitation. Jap. J. Appl. Phys. 2013, 52, 025501. [Google Scholar] [CrossRef]
- Syeda, A.F.; Khan, M.N. Spin state of cobalt and electrical transport in MgCo2O4 system. J. Supercond. Nov. Magn. 2018, 31, 3545–3551. [Google Scholar] [CrossRef]
- Zigla, A.A.; Kox, T.; Mevoa, D.; Assaouka, H.T.; Nsangou, I.N.; Daawe, D.M.; Kenmoe, S.; Kouotou, P.M. Magnesium-modified Co3O4 catalyst with remarkable performance for toluene low temperature deep oxidation. Catalysts 2022, 12, 411. [Google Scholar] [CrossRef]
- Veselov, G.B.; Stoyanovskii, V.O.; Cherepanova, S.V.; Vedyagin, A.A. Sol–gel prepared Co–Mg–O oxide systems: Redox behavior, thermal stability and catalytic performance in CO oxidation. React. Kinet. Mech. Catal. 2023, 136, 233–250. [Google Scholar] [CrossRef]
- Robin, J. Recherches sur la constitution et la stabilité de quelques solutions solides a base d’oxyde de cobalt. Ann. De Chim. 12e Série 1955, 10, 389–412. [Google Scholar]
- Busca, G.; Guidetti, R.; Lorenzelli, V. Fourier-transform infrared study of the surface properties of cobalt oxides. J. Chem. Soc. Faraday Trans. 1990, 86, 989–994. [Google Scholar] [CrossRef]
- Casas-Cabanas, M.; Binotto, G.; Larcher, D.; Lecup, A.; Giordani, V.; Tarascon, J.M. Defect chemistry and catalytic activity of nanosized Co3O4. Chem. Mater. 2009, 21, 1939–1947. [Google Scholar] [CrossRef]
- Raveau, B.; Seikh, M. Cobalt Oxides: From Crystal Chemistry to Physics; Wiley–VCH: Weinheim, Germany, 2012; p. 333. ISBN 978-3-527-64552-7. [Google Scholar]
- Peshev, P.; Toshev, A.; Gyurov, G. Preparation of high-dispersity MCo2O4 (M = Mg, Ni, Zn) spinels by thermal dissociation of coprecipitated oxalates. Mater. Res. Bull. 1989, 24, 33–40. [Google Scholar] [CrossRef]
- Krezhov, K.; Konstantinov, P. On the cationic distribution in MgxCo3–xO4 spinels. J. Phys. Condens. Matter. 1992, 4, L543–L548. [Google Scholar] [CrossRef]
- Aukrust, E.; Muan, A. Activities of components in oxide solid solutions: The systems CoO–MgO, CoO–MnO, and CoO–FeO at 1200 °C. Trans. Metall. Soc. AIME 1963, 227, 1378–1380. [Google Scholar]
- Cimino, A.; Lo Jacono, M.; Porta, P.; Valigi, M. Structural and magnetic investigations of oxide solid solutions. IV. Cobalt oxide in magnesium oxide. Z. Phys. Chem. Neue Folge 1970, 70, 166–178. [Google Scholar] [CrossRef]
- Hagan, A.P.; Lofthouse, M.G.; Stone, F.S.; Trevethan, M.A. High surface area oxide solid solution catalyst. Stud. Surf. Sci. Catal. 1979, 3, 417–438. [Google Scholar]
- Ketchik, S.V.; Plyasova, L.M.; Chigrina, V.A.; Minyukova, T.P.; Yurieva, T.M. Phase transformation in the cupric magnesium oxide system. React. Kinet. Catal. Lett. 1980, 14, 135–140. [Google Scholar] [CrossRef]
- Litvak, G.S.; Minyukova, T.P.; Demeshkina, M.P.; Plyasova, L.M.; Yurieva, T.M. Physico-chemical studies of the temperature range for the formation of anion-modified oxides. React. Kinet. Catal. Lett. 1986, 31, 403–408. [Google Scholar] [CrossRef]
- Guan, D.; Shi, C.; Xu, H.; Gu, Y.; Zhong, J.; Sha, Y.; Hu, Z.; Ni, M.; Shao, Z. Simultaneously mastering operando strain and reconstruction effects via phase-segregation strategy for enhanced oxygen-evolving electrocatalysis. J. Energy Chem. 2023, 82, 572–580. [Google Scholar] [CrossRef]
- Tang, C.W.; Wang, C.B.; Chien, S.H. Characterization of cobalt oxides studied by FT-IR, Raman, TPR and TG-MS. Thermoch. Acta 2008, 473, 68–73. [Google Scholar] [CrossRef]
- Nayak, S.; Dasari, K.; Joshi, D.C.; Pramanik, P.; Palai, R.; Sathe, V.; Chauhan, R.N.; Tiwari, N.; Thota, S. Spectroscopic studies of Co2TiO4 and Co3O4 two-phase composites. Phys. Status Solidi B 2016, 253, 2270–2282. [Google Scholar] [CrossRef]
- Preudhomme, J.; Tarte, P. Infrared studies of spinels. III: The normal II–III spinels. Spectrochim. Acta Part A 1971, 27, 1817–1835. [Google Scholar] [CrossRef]
- Li, Y.; Qiu, W.; Qin, F.; Fang, H.; Hadjiev, V.G.; Litvinov, D.; Bao, J. Identification of cobalt oxides with Raman scattering and Fourier transform infrared spectroscopy. J. Phys. Chem. C 2016, 120, 4511–4516. [Google Scholar] [CrossRef]
- Gielisse, P.J.; Plendl, J.N.; Mansur, L.C.; Marshall, R.; Mitra, S.S.; Mykolajewycz, R.; Smakula, A. Infrared properties of NiO and CoO and their mixed crystals. J. Appl. Phys. 1965, 36, 2446–2450. [Google Scholar] [CrossRef]
- Kant, C.; Rudolf, T.; Schrettle, F.; Mayr, F.; Deisenhofer, J.; Lunkenheimer, P.; Eremin, M.V.; Loidl, A. Optical spectroscopy in CoO: Phononic, electric, and magnetic excitation spectrum within the charge-transfer gap. Phys. Rev. B 2008, 78, 245103. [Google Scholar] [CrossRef]
- Angelov, S.; Zhecheva, E.; Stoyanova, R.; Atanasov, M. Bulk defects in Co3O4, pure and slightly doped with lithium, revealed by EPR of the tetrahedral Co2+ ions. J. Phys. Chem. Solids 1990, 51, 1157–1161. [Google Scholar] [CrossRef]
- Dutta, P.; Seehra, M.S.; Thota, S.; Kumar, J. A comparative study of the magnetic properties of bulk and nanocrystalline Co3O4. J. Phys. Condens. Matter 2008, 20, 015218. [Google Scholar] [CrossRef]
- Dyrek, K.; Sojka, Z. Coordination and dispersion of Co2+ ions in CoO–MgO solid solutions. J. Chem. Soc. Faraday Trans. 1982, 78, 3177–3185. [Google Scholar] [CrossRef]
- Gazzoli, D.; Occhiuzzi, M.; Cimino, A.; Cordischi, D.; Minelli, G.; Pinzari, F. XPS and EPR study of high and low surface area CoO-MgO solid solutions: Surface composition and Co2+ ion dispersion. J. Chem. Soc. Faraday Trans. 1996, 92, 4567–4574. [Google Scholar] [CrossRef]
- Querini, C.A.; Ulla, M.A.; Requejo, F.; Soria, J.; Sedrán, U.A.; Miró, E.E. Catalytic combustion of diesel soot particles. Activity and characterization of Co/MgO and Co, K/MgO catalysts. Appl. Catal. B 1998, 15, 5–19. [Google Scholar] [CrossRef]
- Zasada, F.; Janas, J.; Piskorz, W.; Gorczynska, M.; Sojka, Z. Total oxidation of lean methane over cobalt spinel nanocubes controlled by the self-adjusted redox state of the catalyst: Experimental and theoretical account for interplay between the Langmuir–Hinshelwood and Mars–van Krevelen mechanisms. ACS Catal. 2017, 7, 2853–2867. [Google Scholar] [CrossRef]
- Mekhemer, G.A.; Rabee, A.I.; Gaid, C.B.; Zaki, M.I. Cobalt oxide-catalyzed CO oxidation under steady-state conditions: Influence of the metal oxidation state. Colloids Surf. A 2023, 663, 130992. [Google Scholar] [CrossRef]
- Rabee, A.I.; Gaid, C.B.; Mekhemer, G.A.; Zaki, M.I. Combined TPR, XRD, and FTIR studies on the reduction behavior of Co3O4. Mater. Chem. Phys. 2022, 289, 126367. [Google Scholar] [CrossRef]
- Bulavchenko, O.A.; Cherepanova, S.V.; Malakhov, V.V.; Dovlitova, L.S.; Ishchenko, A.V.; Tsybulya, S.V. In situ XRD study of nanocrystalline cobalt oxide reduction. Kinet. Catal. 2009, 50, 192–198. [Google Scholar] [CrossRef]
- Liptay, G. (Ed.) Atlas of Thermoanalytical Curves; Akadémiai Kiadó: Budapest, Hungary, 1974; Volume 3, p. 160. ISBN 963-05-0216-X. [Google Scholar]

 —Co1Mg1,
  —Co2Mg1,
  —Co4Mg1, and
  —Co3O4.
—Co1Mg1, —Co2Mg1, —Co4Mg1, and —Co3O4.
—Co3O4.
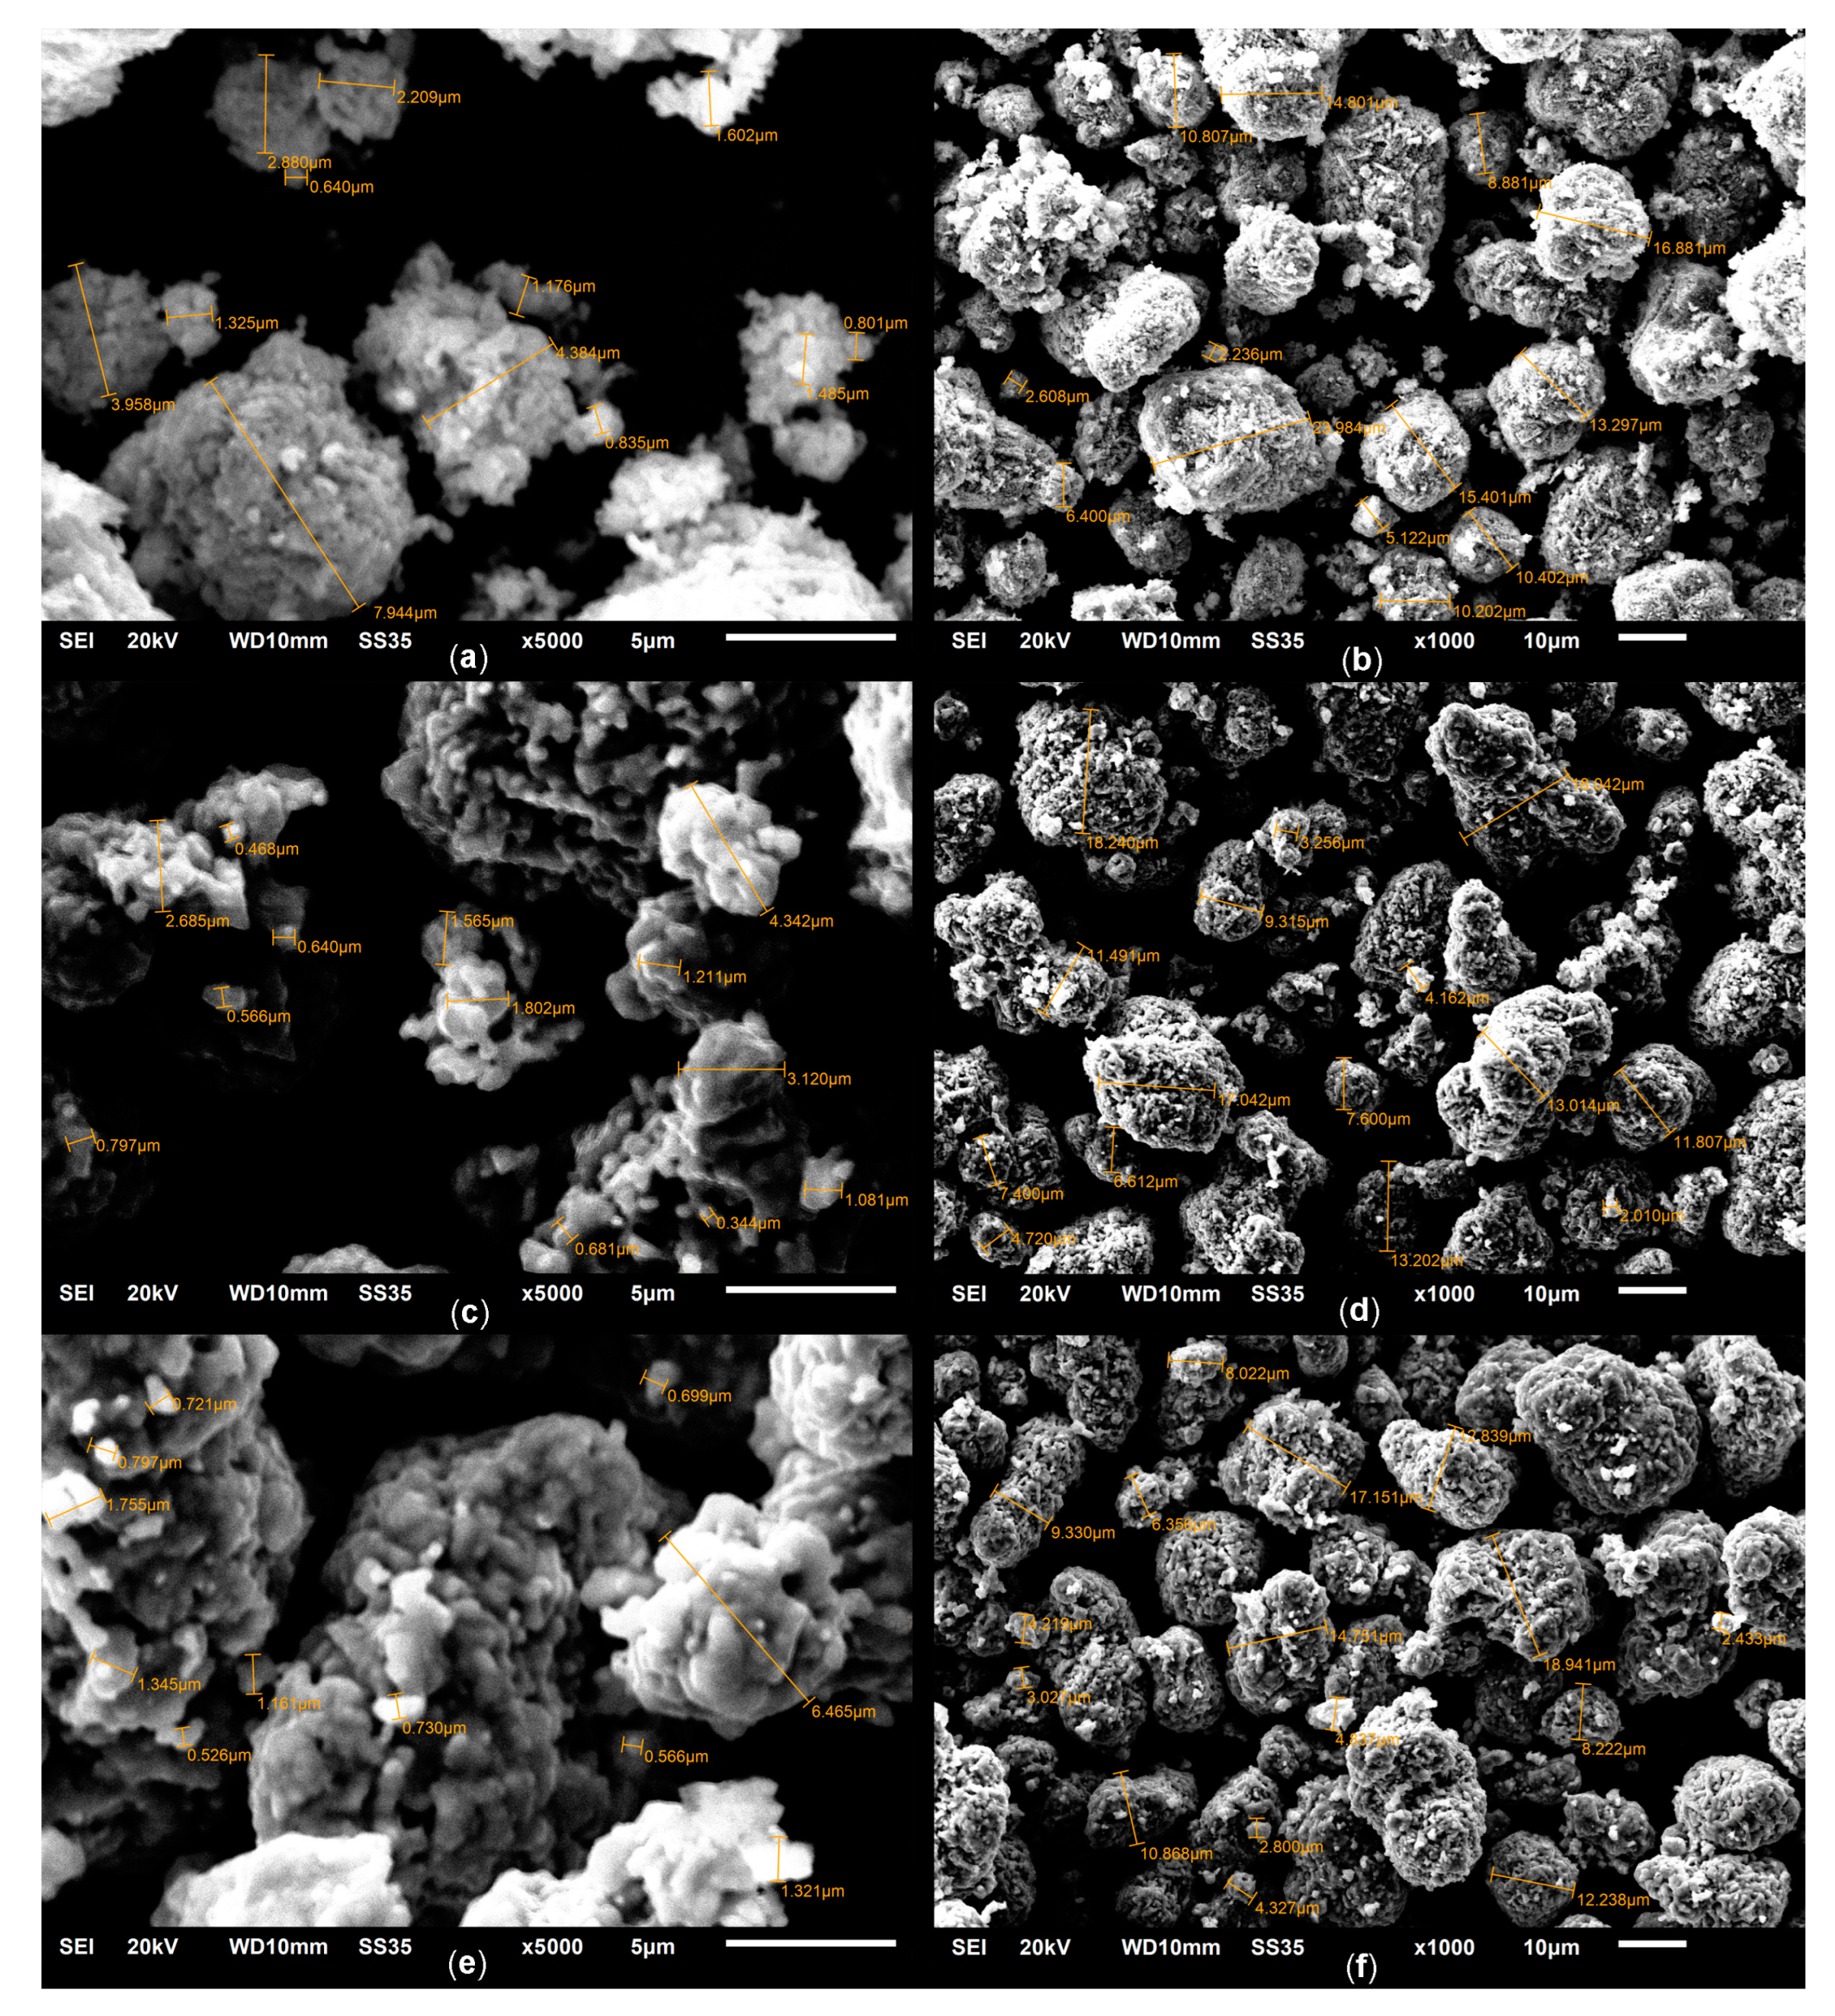
—Co1Mg1, —Co2Mg1, —Co4Mg1, and —Co3O4.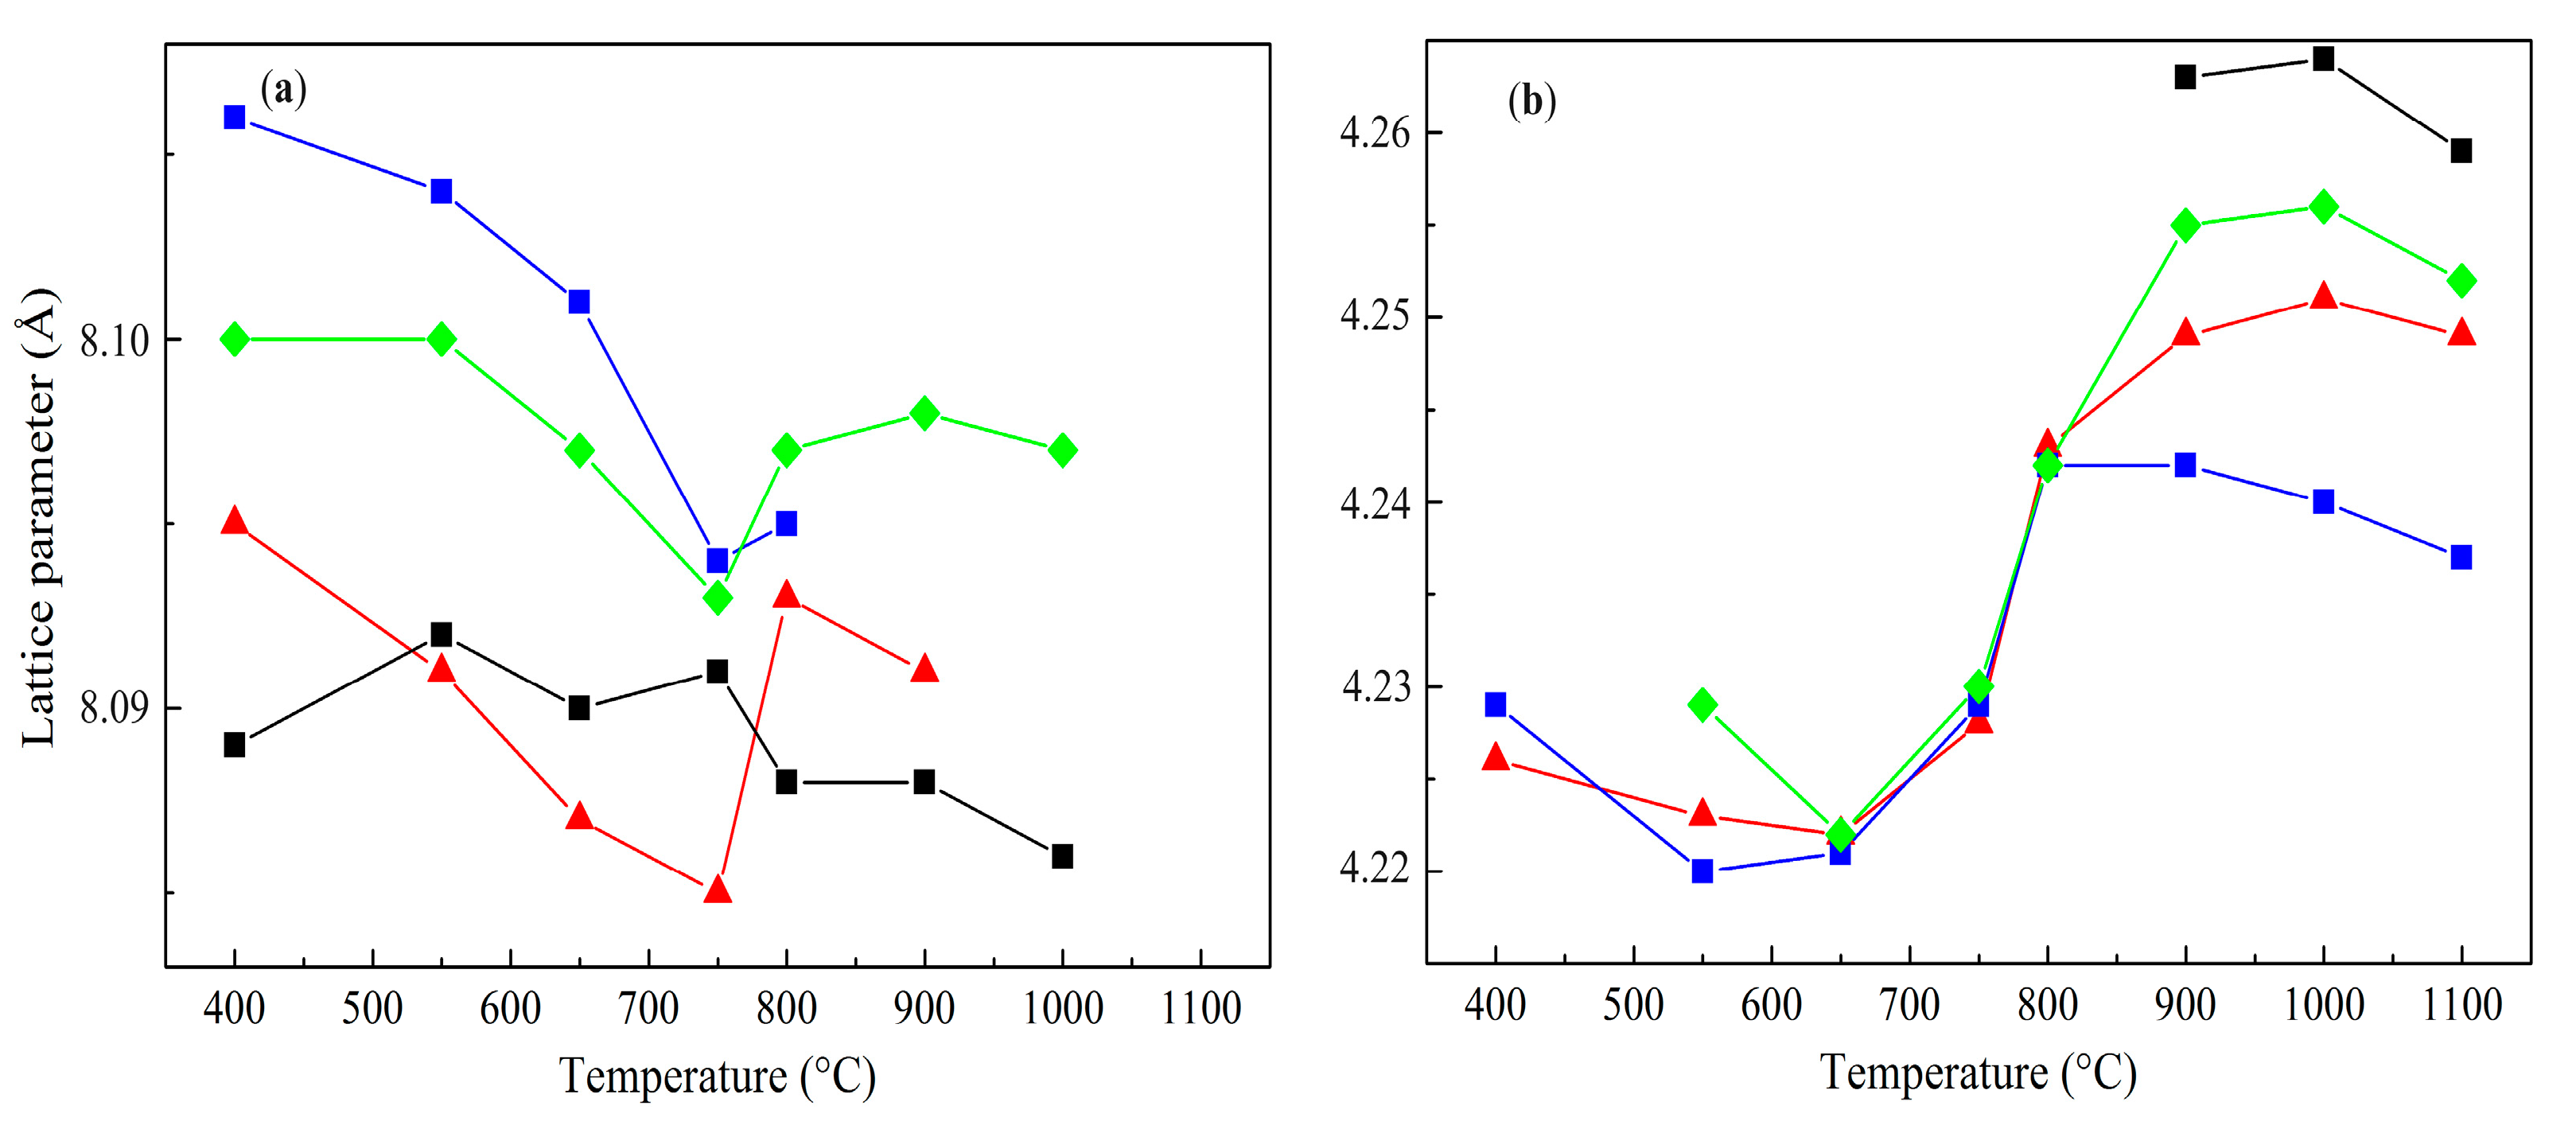 —calcined at 550 °C, —calcined at 800 °C, and —calcined at 1100 °C.
—calcined at 550 °C, —calcined at 800 °C, and —calcined at 1100 °C.
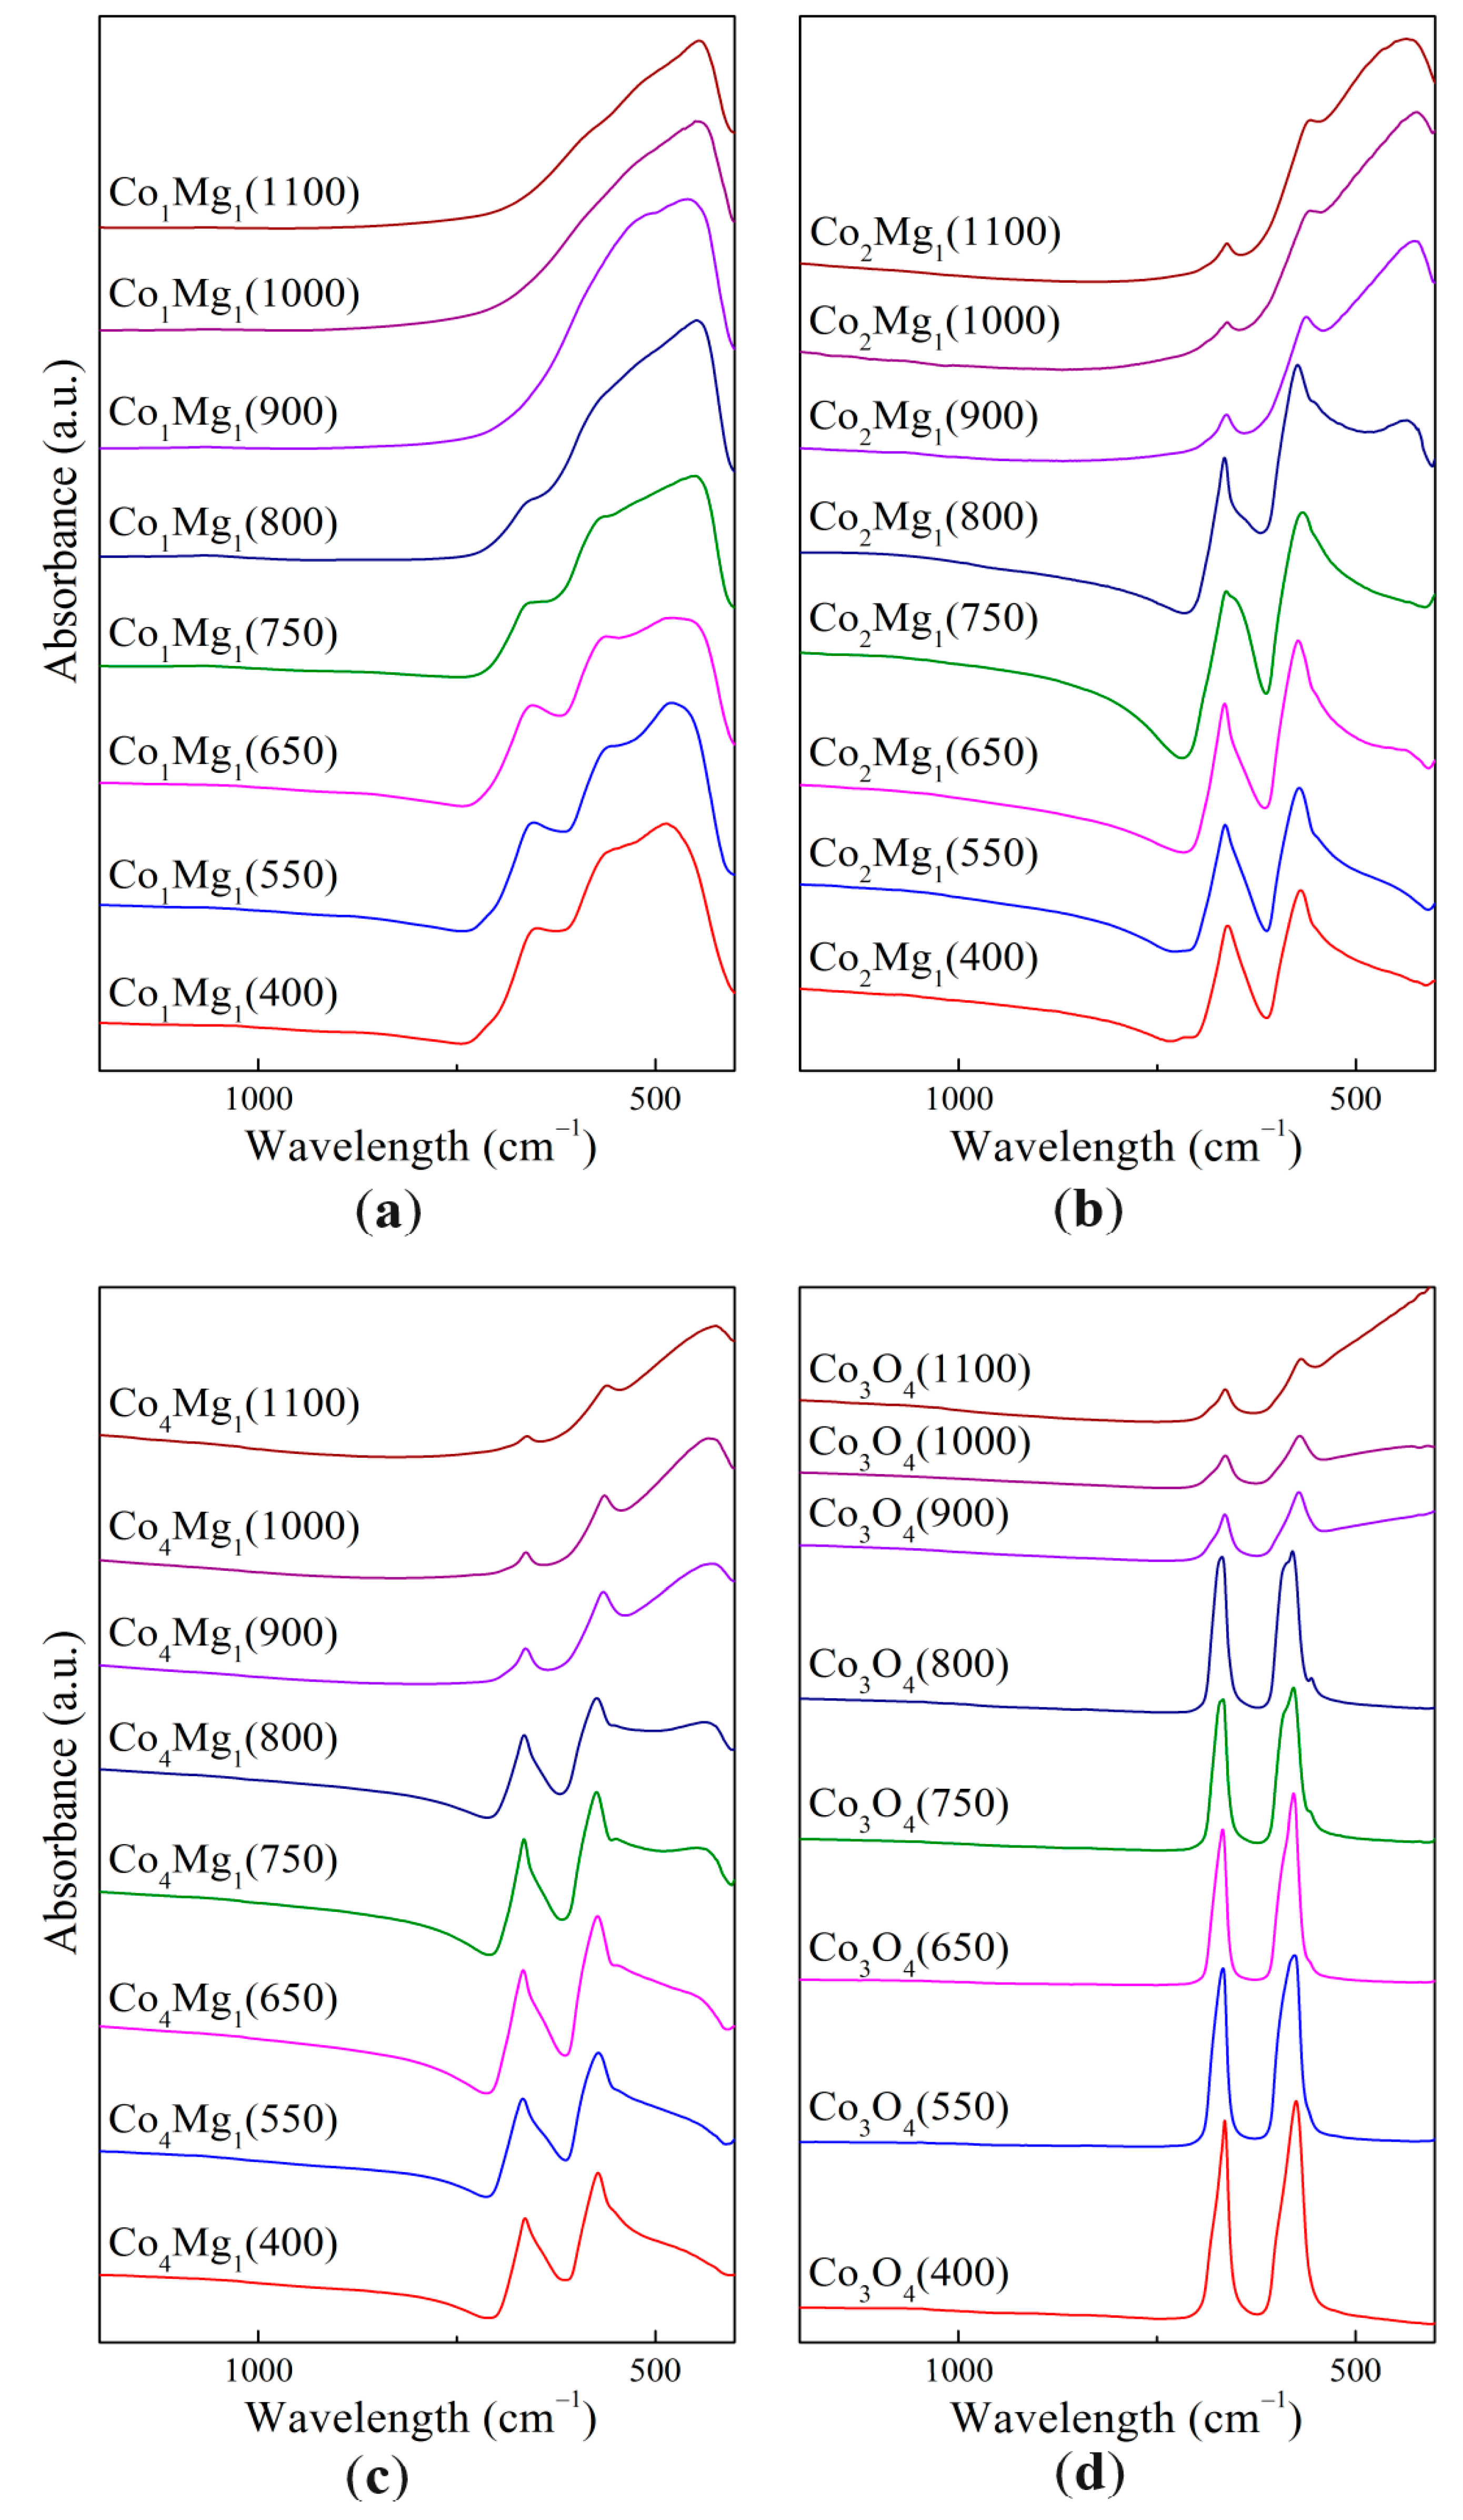
—calcined at 550 °C, —calcined at 800 °C, and —calcined at 1100 °C. —Co1Mg1, —Co2Mg1, —Co4Mg1, and —Co3O4.
—Co1Mg1, —Co2Mg1, —Co4Mg1, and —Co3O4.
—Co1Mg1, —Co2Mg1, —Co4Mg1, and —Co3O4.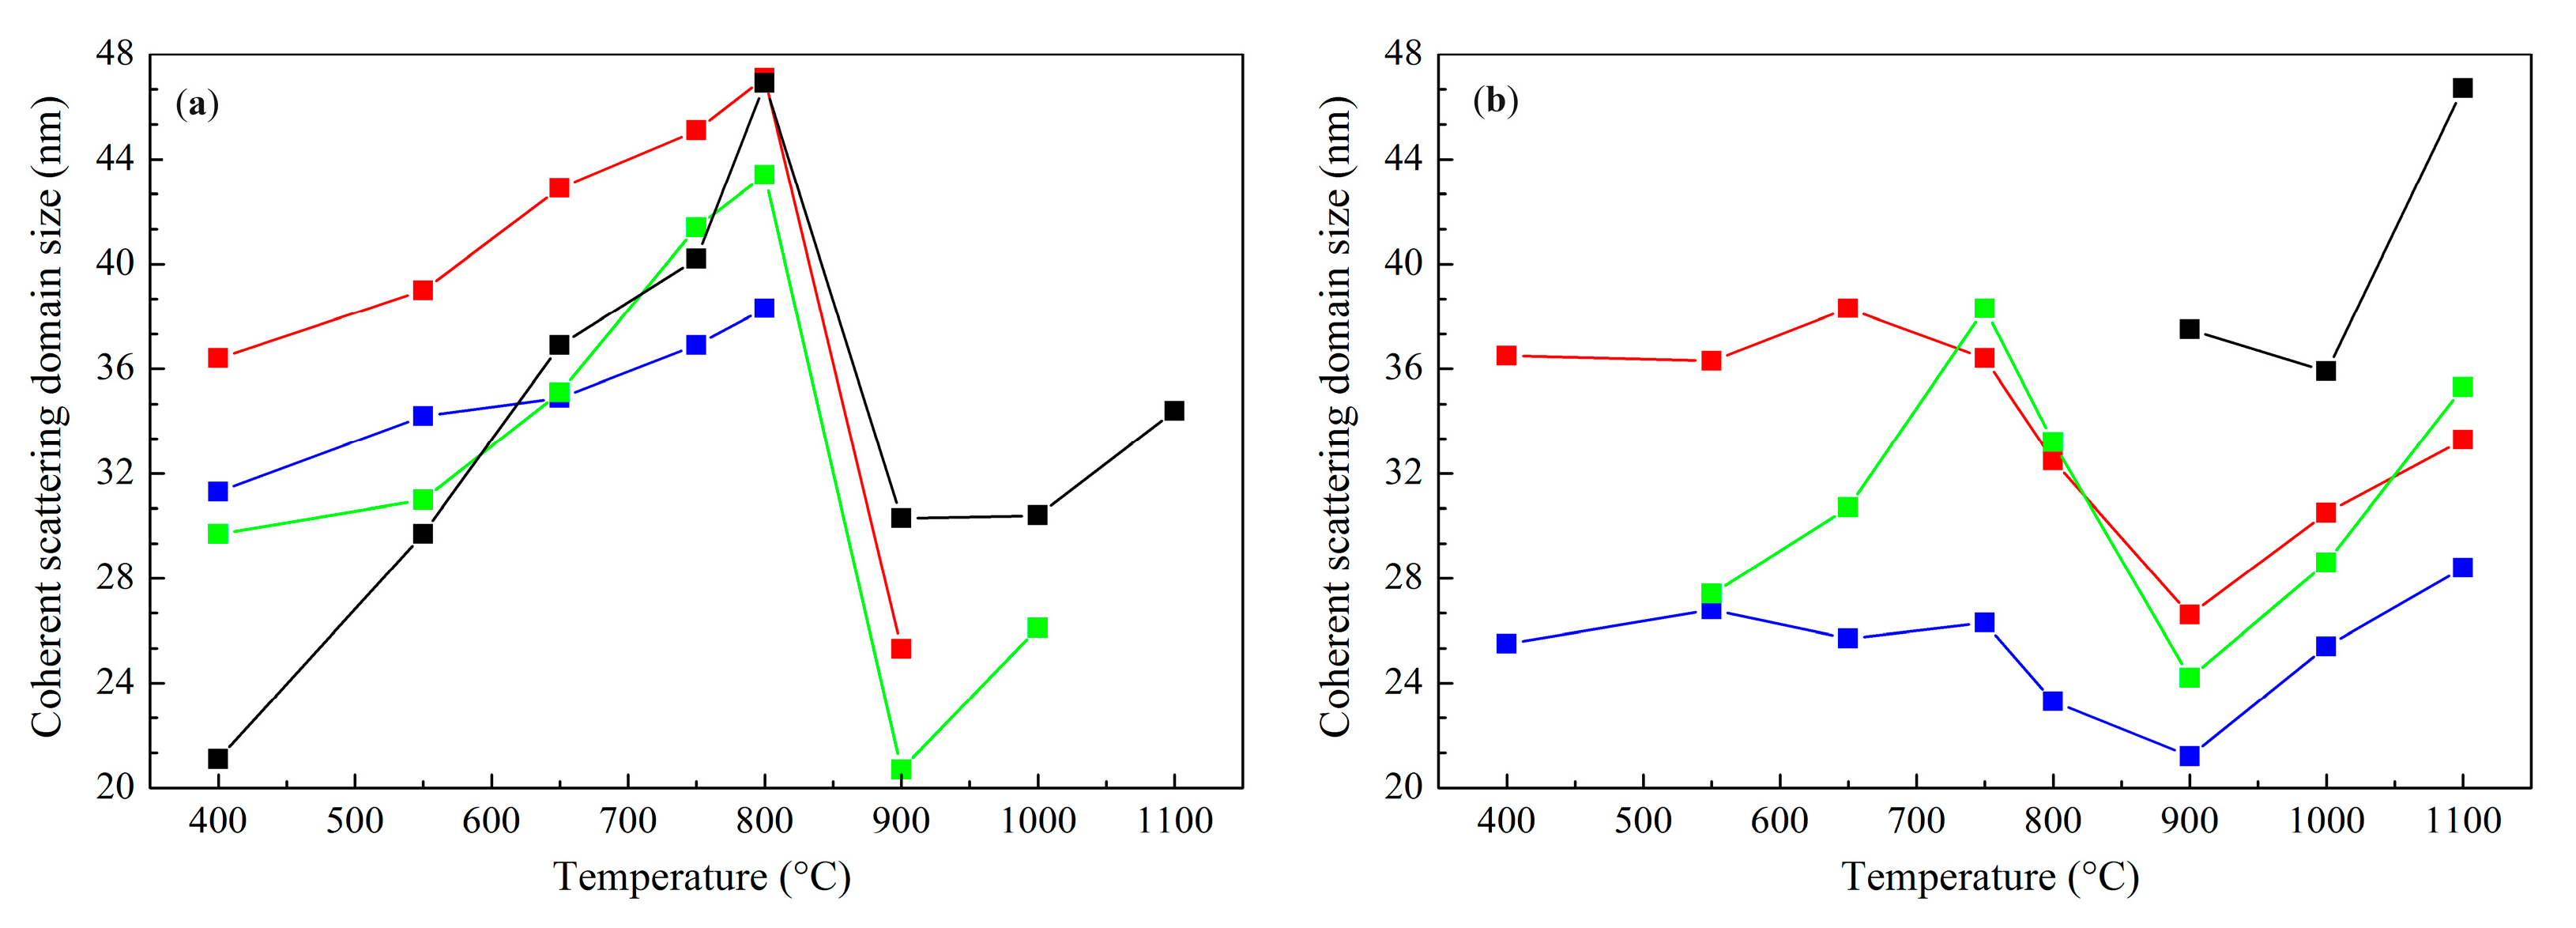
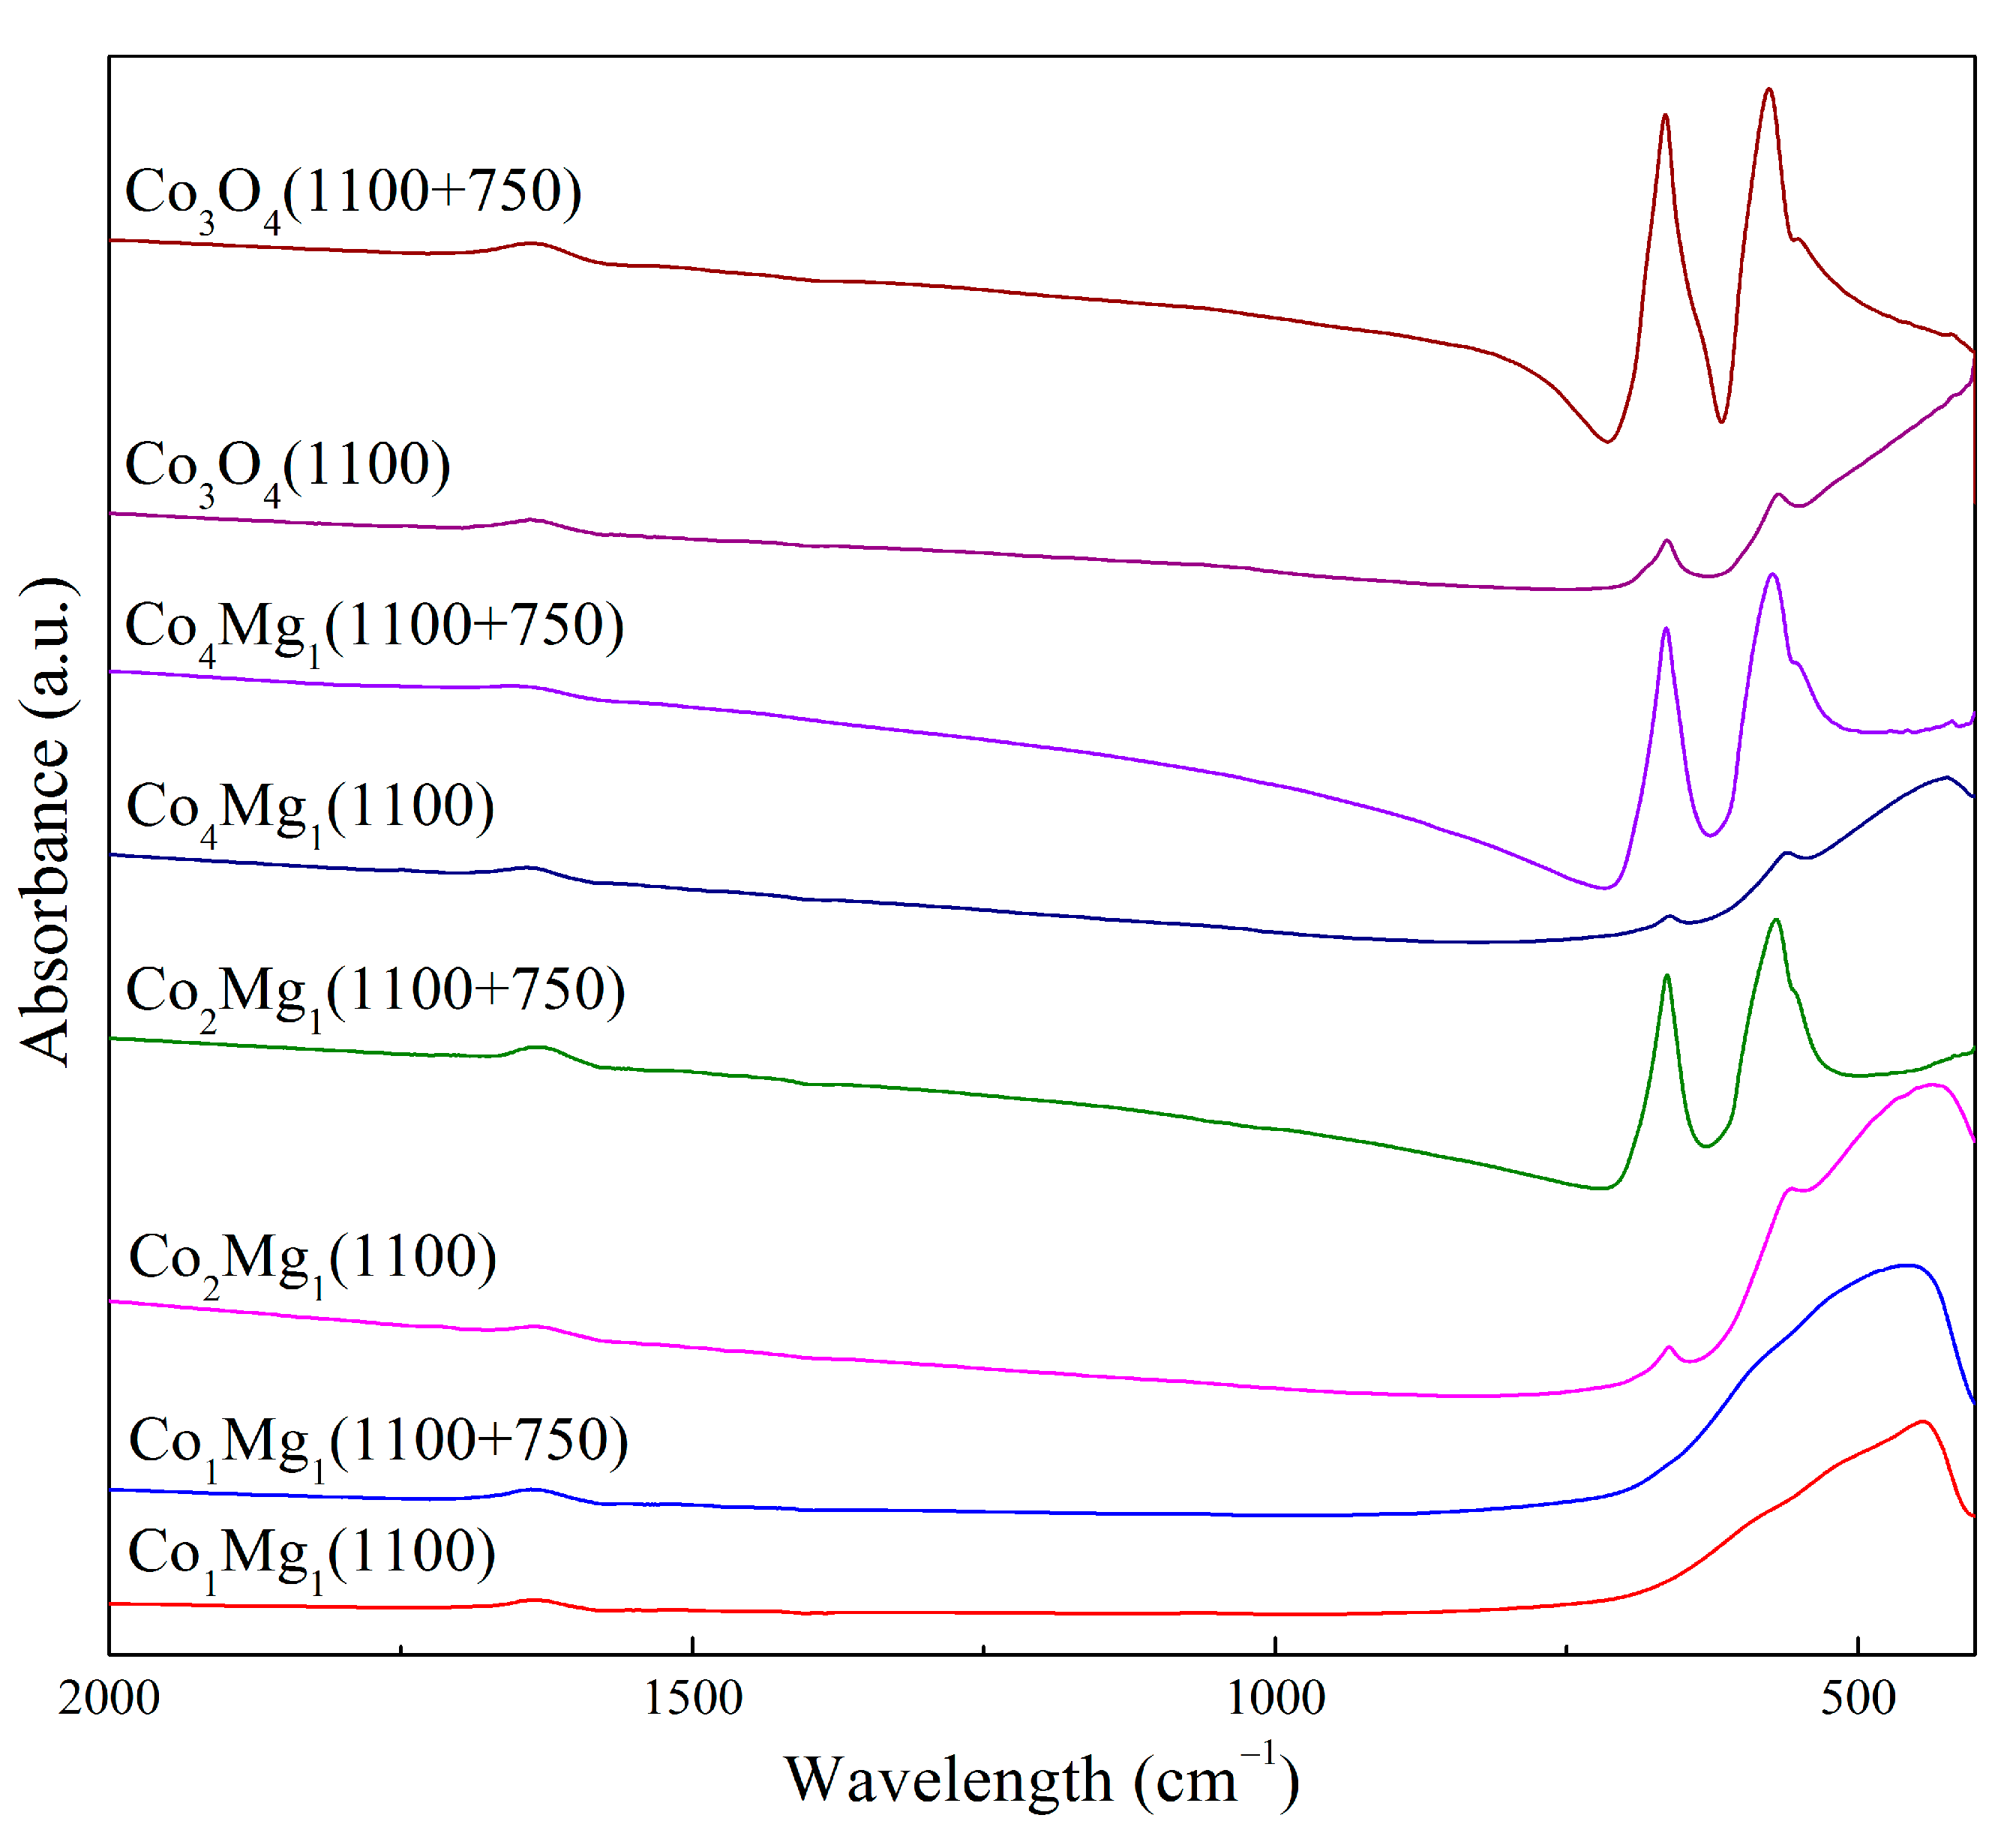
 —ν1 a.b. of samples calcined at 400–800 °C, —ν2 a.b. of samples calcined at 400–800 °C, and —Mg–O a.b. of samples calcined at 900–1100 °C.
—ν1 a.b. of samples calcined at 400–800 °C, —ν2 a.b. of samples calcined at 400–800 °C, and —Mg–O a.b. of samples calcined at 900–1100 °C.
—ν1 a.b. of samples calcined at 400–800 °C, —ν2 a.b. of samples calcined at 400–800 °C, and —Mg–O a.b. of samples calcined at 900–1100 °C.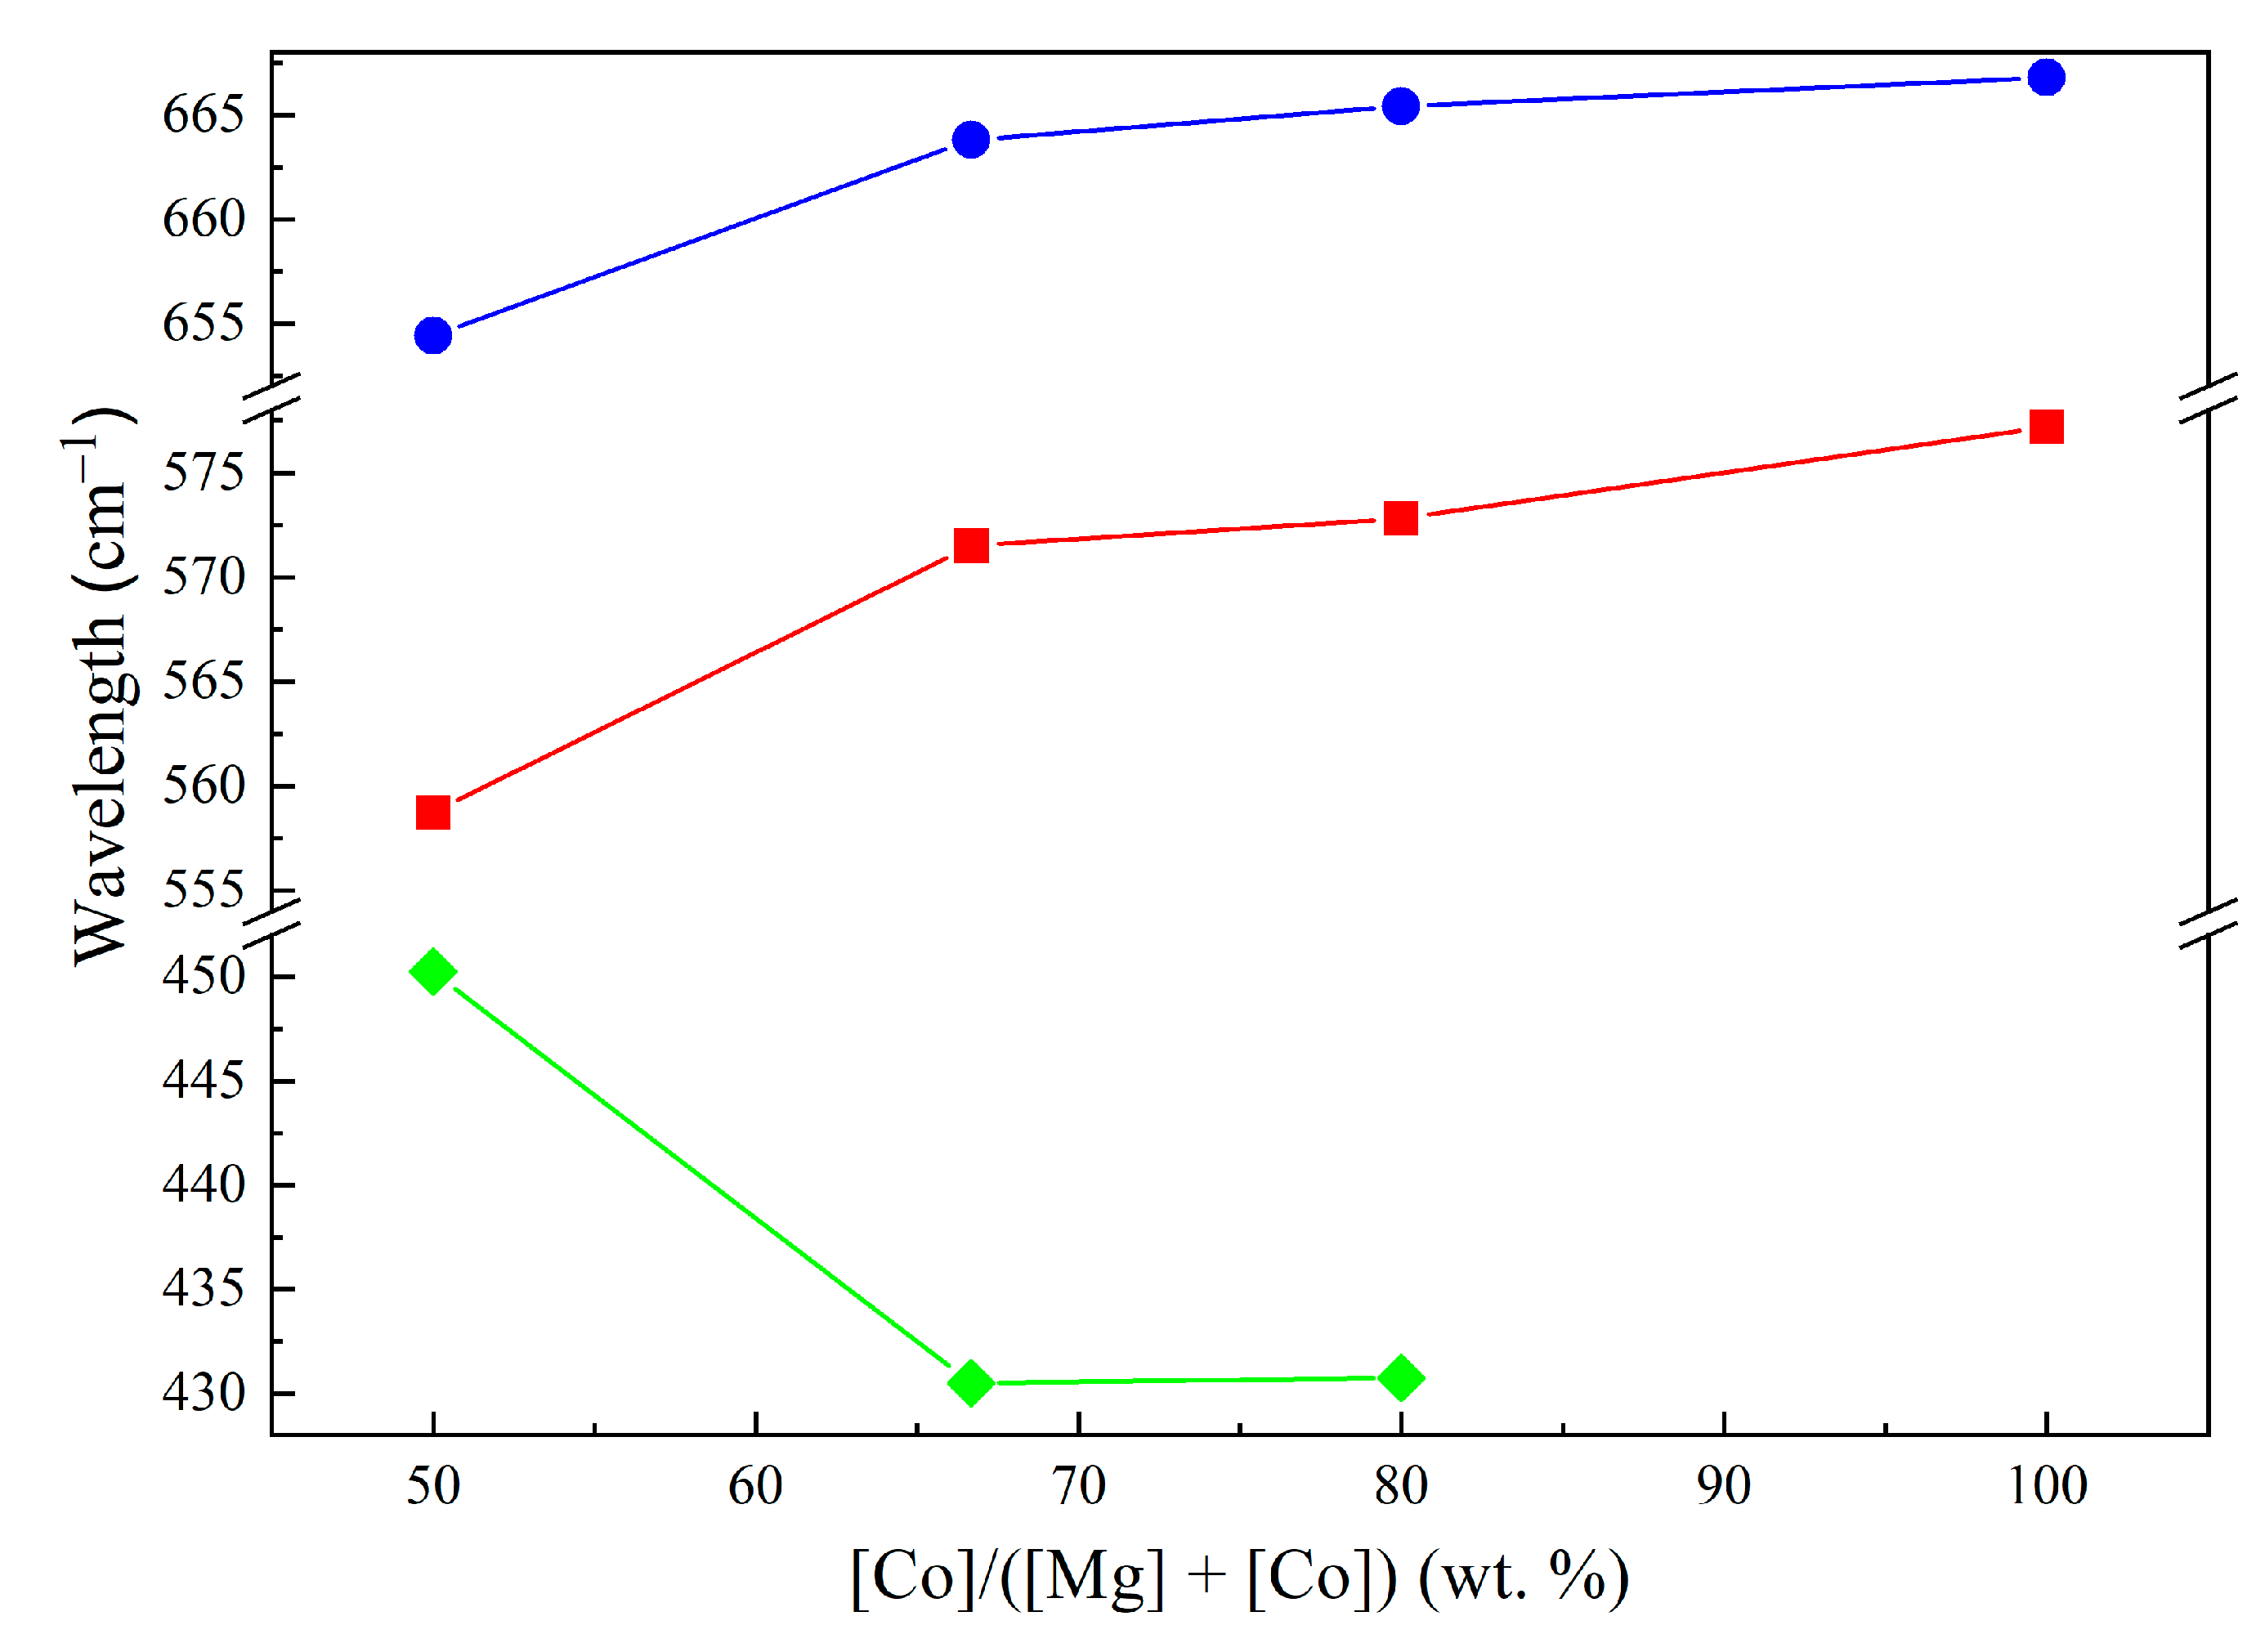 —Co1Mg1, —Co2Mg1, —Co4Mg1, and —Co3O4.
—Co1Mg1, —Co2Mg1, —Co4Mg1, and —Co3O4.
—Co1Mg1, —Co2Mg1, —Co4Mg1, and —Co3O4.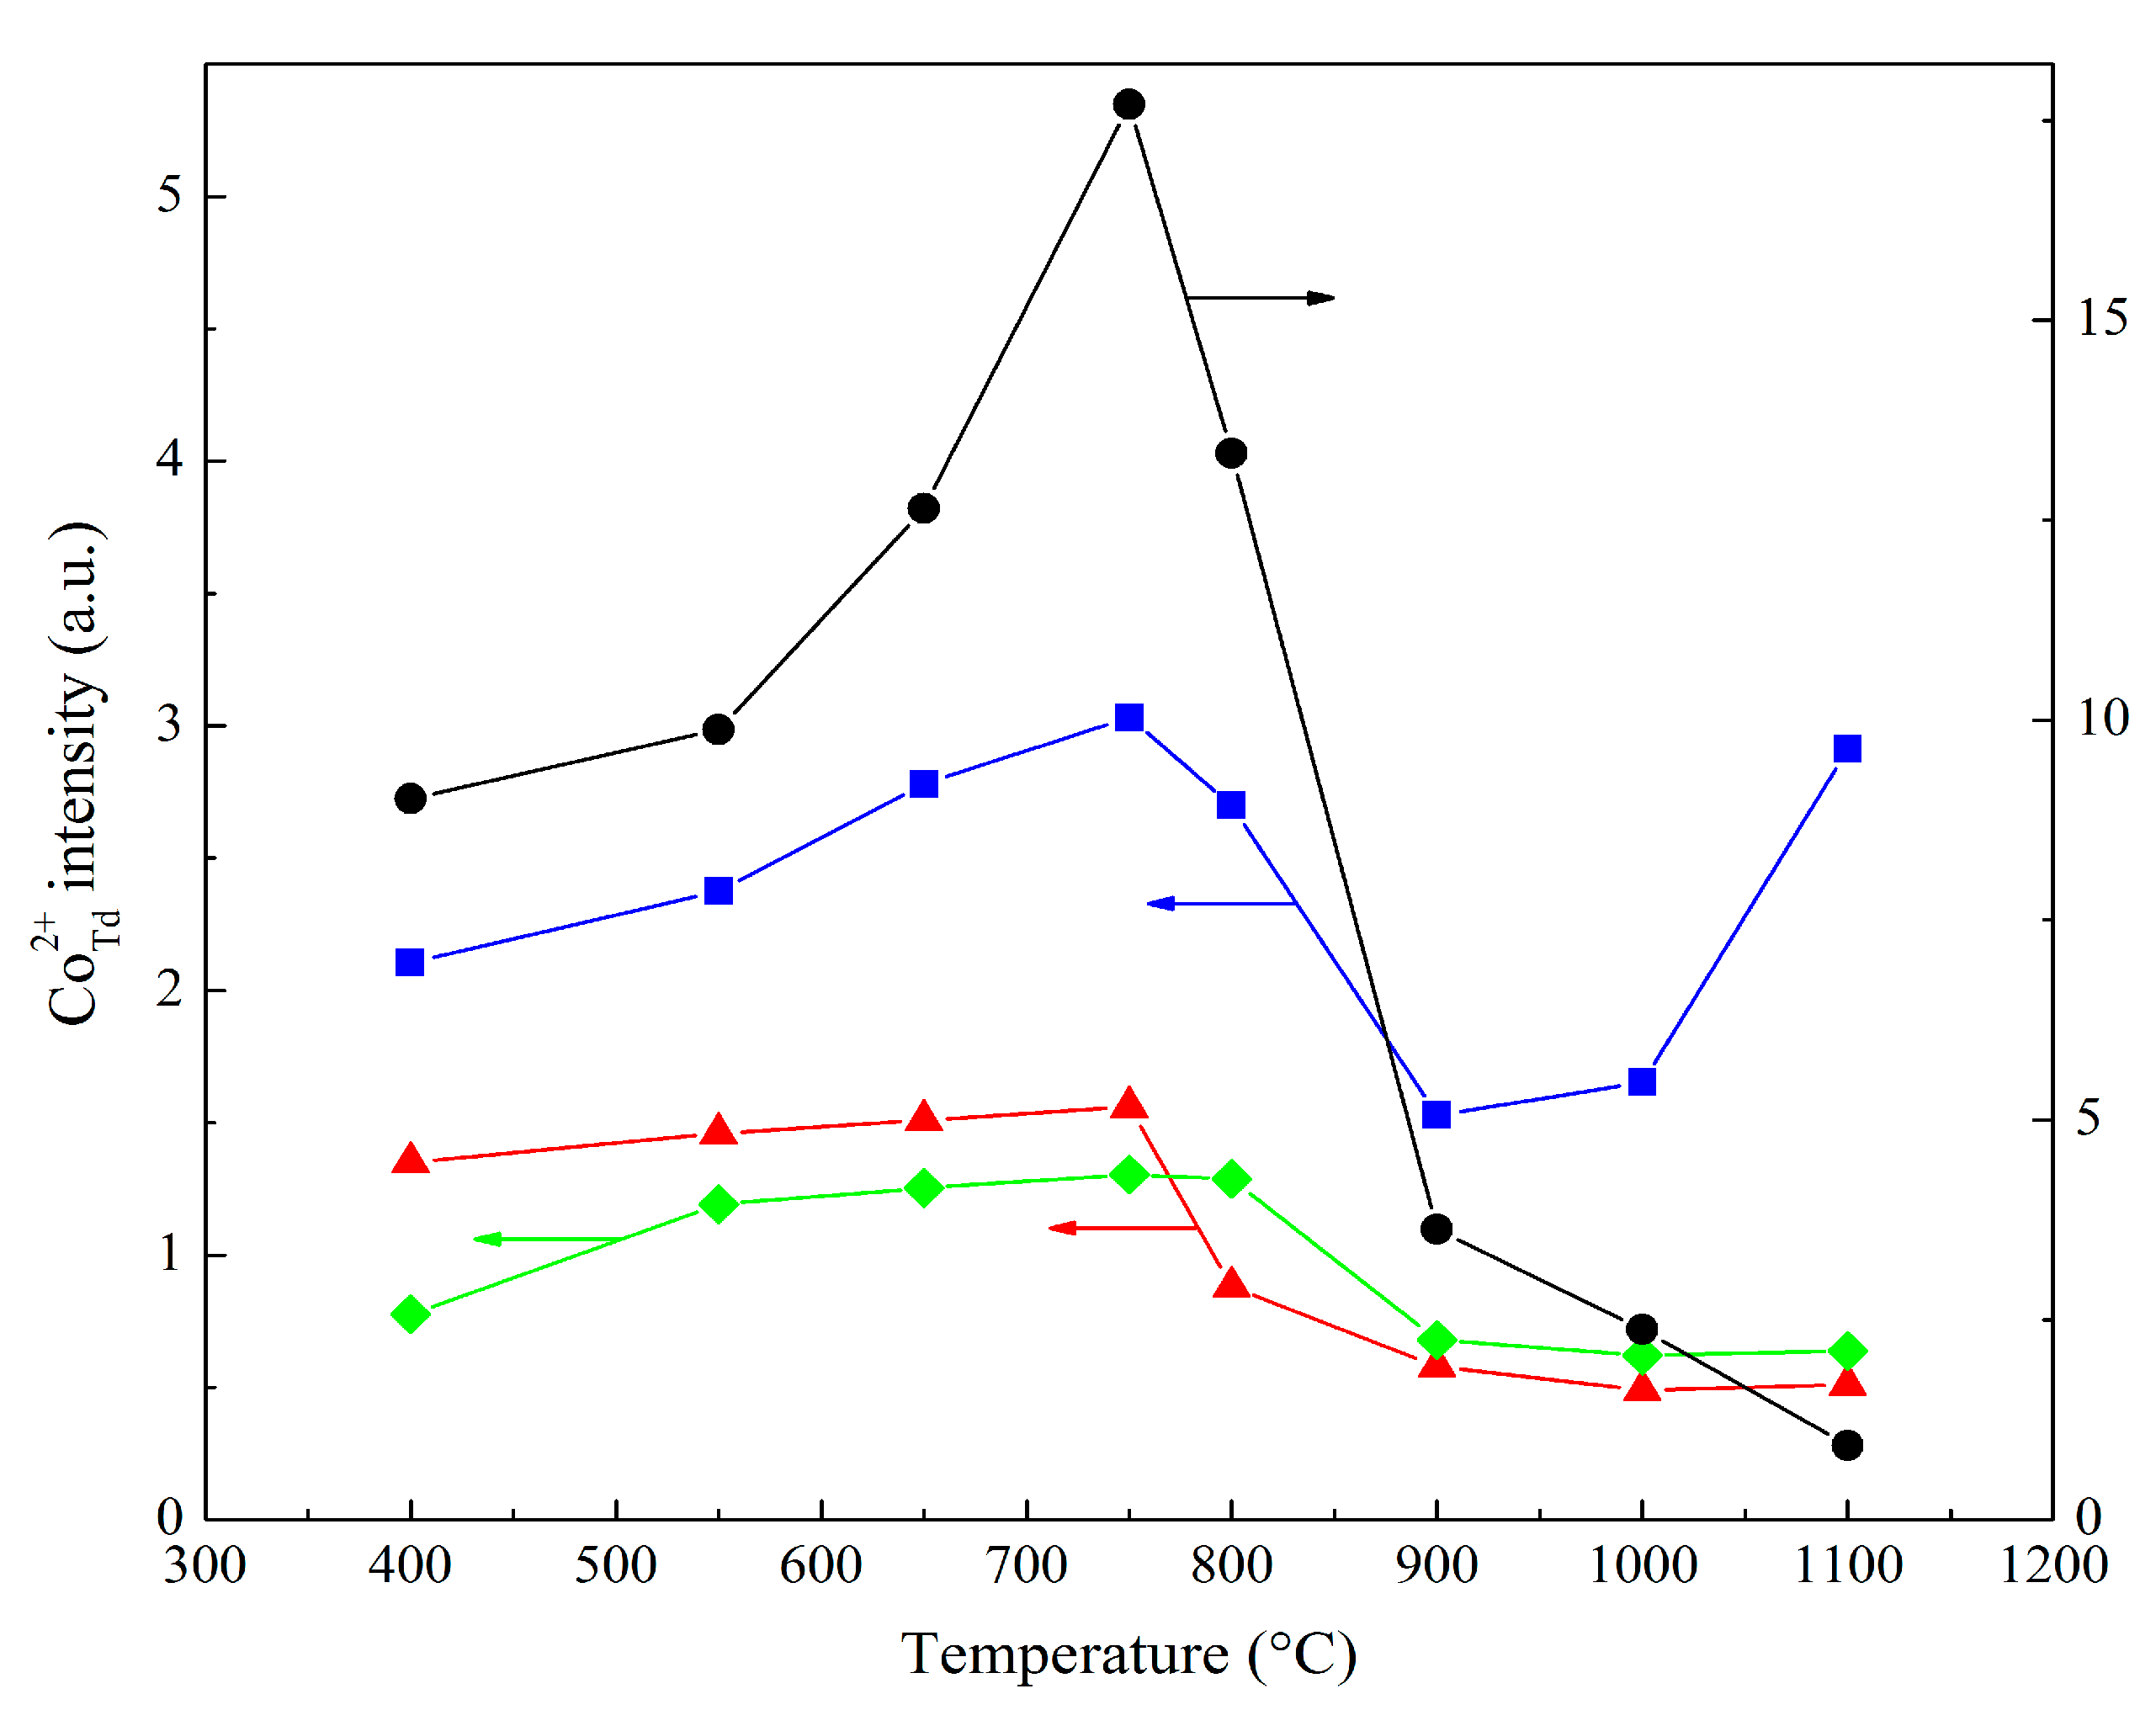


| Sample | Lattice Parameter (Å) | |||
|---|---|---|---|---|
| Co1Mg1 | Co2Mg1 | Co4Mg1 | Co3O4 | |
| Co-Mg(400) | 8.106/4.229 | 8.095/4.226 | 8.100/– | 8.089/– |
| Co-Mg(550) | 8.104/4.220 | 8.091/4.223 | 8.100/4.229 | 8.092/– |
| Co-Mg(650) | 8.101/4.221 | 8.087/4.222 | 8.097/4.222 | 8.090/– |
| Co-Mg(750) | 8.094/4.229 | 8.085/4.228 | 8.093/4.230 | 8.091/– |
| Co-Mg(800) | 8.095/4.242 | 8.093/4.243 | 8.097/4.242 | 8.088/– |
| Co-Mg(900) | –/4.242 | 8.091/4.249 | 8.098/4.255 | 8.088/4.263 |
| Co-Mg(1000) | –/4.240 | –/4.251 | 8.097/4.256 | 8.086/4.264 |
| Co-Mg(1100) | –/4.237 | –/4.249 | –/4.252 | 8.076/4.259 |
| Temperature (°C) | a.b. Co1Mg1 (cm−1) | a.b. Co2Mg1 (cm−1) | a.b. Co4Mg1 (cm−1) | a.b. Co3O4 (cm−1) |
|---|---|---|---|---|
| 400 | 486, (553), 649 | 569, 661, (712) | (553), 572, 664 | 575, 665 |
| 550 | 479, 555, 653 | 571, 665 | (548), 572, 667 | 576, 667 |
| 650 | 478, 562, 655 | (437), 573, 665 | 550, 573, 666 | (558), 578, 667 |
| 750 | 449, (565), 658 | (431), 567, (652), 663 | 448, 550, 574, 665 | (557), 578, (589), 667, (670) |
| 800 | 449, (657) | 436, (552), 573, (643), 665 | 439, (550), 573, 665 | 555, 579, (587), 668 |
| 900 | 460, (504) | 426, 562, 663 | 428, 565, 664 | 571, 664 |
| 1000 | 447 | 424, 557, 662 | 433, 564, 663 | 570, 664 |
| 1100 | 445 | 436, 557, 662 | 423, 561, 661 | 568, 664 |
| Heat Treatment Temperature (°C) | Ratio of Signal and Reference Intensities at a Given Co:Mg Ratio | |||
|---|---|---|---|---|
| Co1Mg1 | Co2Mg1 | Co4Mg1 | Co3O4 | |
| 400 | 2.11 | 1.35 | 0.77 | 9.02 |
| 550 | 2.37 | 1.46 | 1.19 | 9.88 |
| 650 | 2.78 | 1.51 | 1.25 | 12.64 |
| 750 | 3.03 | 1.56 | 1.31 | 17.70 |
| 800 | 2.70 | 0.88 | 1.29 | 13.34 |
| 900 | 1.53 | 0.58 | 0.68 | 3.63 |
| 1000 | 1.65 | 0.49 | 0.62 | 2.38 |
| 1100 | 2.91 | 0.51 | 0.64 | 0.93 |
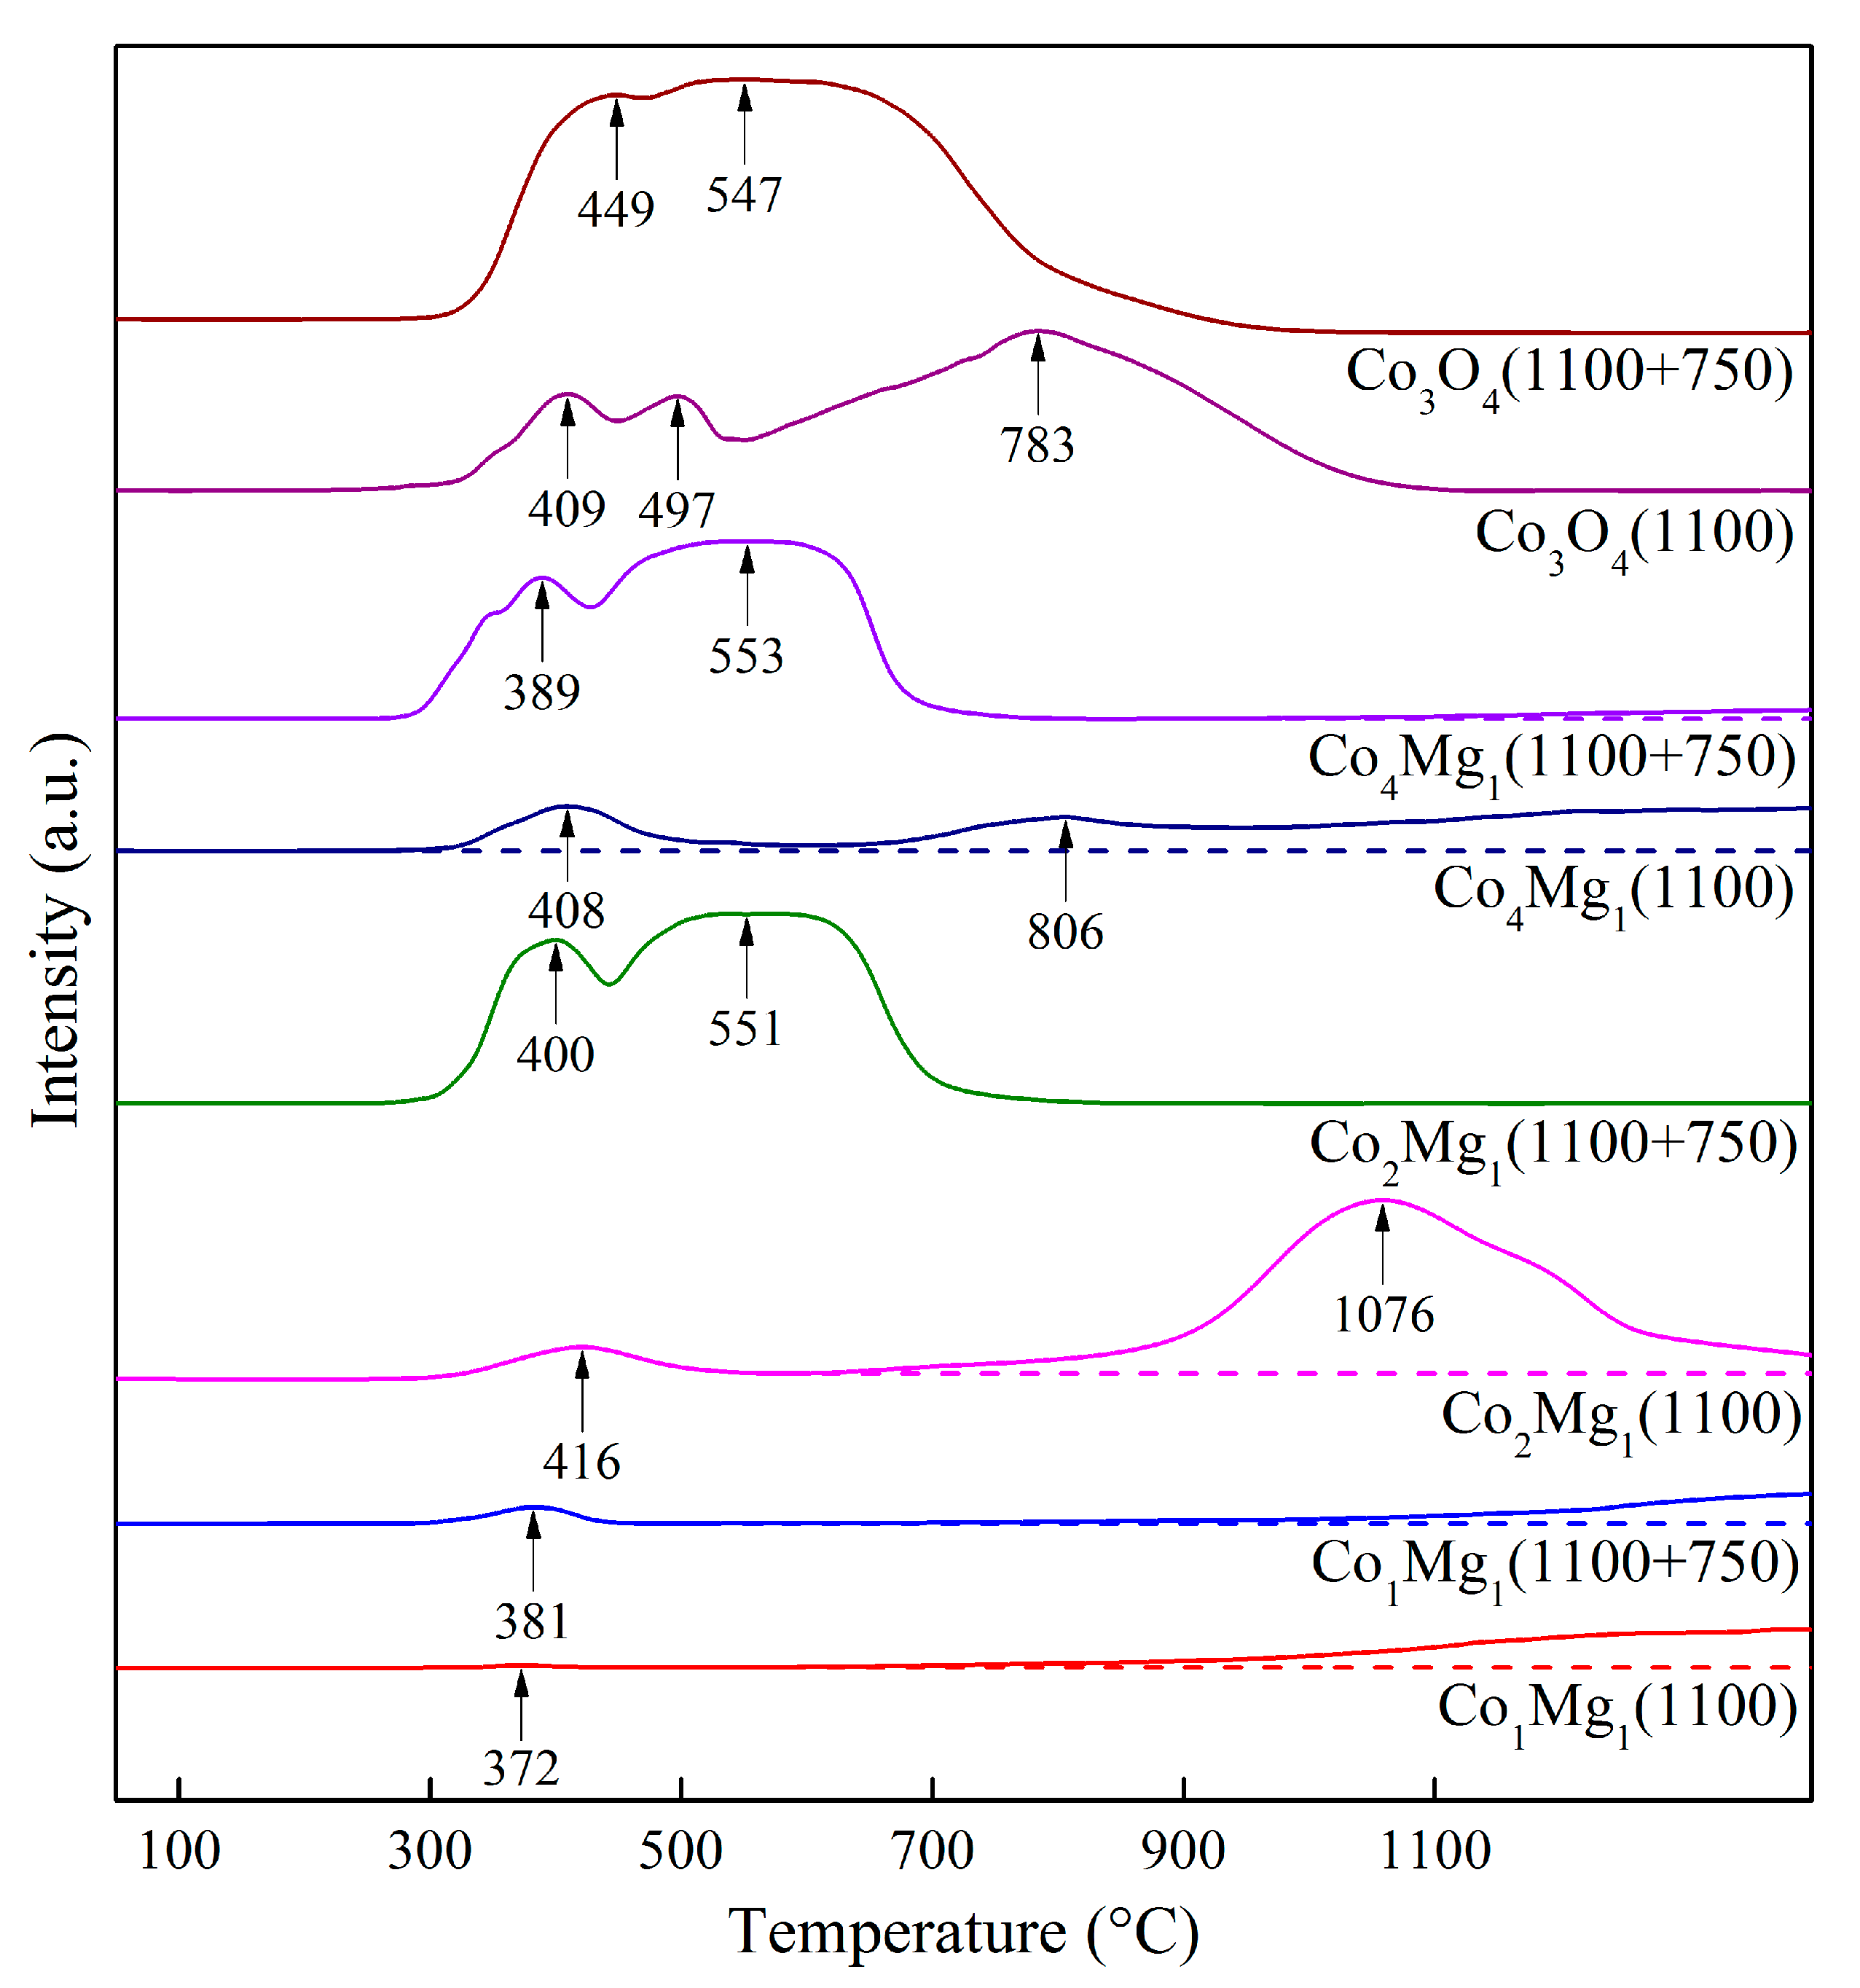
| Sample | Desorption Peak Temperature (°C) | Volume of O2 Released in the Temperature Range (μmol/g) | ||||
|---|---|---|---|---|---|---|
| 1 | 2 | 3 | 1 | 2 | 3 | |
| Co3O4(400) | 197 | 680 | 873 | 3.711 | 32.14 | 2074.69 |
| Co3O4(550) | 201 | 667 | 862 | 1.325 | 2.76 | 2073.68 |
| Co3O4(650) | 257 | 657 | 854 | 0.802 | 0.90 | 2047.98 |
| Co3O4(750) | 254 | — | 863 | 0.758 | — | 2092.33 |
| Co3O4(800) | 270 | — | 869 | 0.979 | — | 2076.39 |
| Co3O4(900) | 284 | — | 837 | 0.629 | — | 801.73 |
| Co3O4(1000) | 273 | — | 842, 871 | 0.139 | — | 634.01 |
| Co3O4(1100) | 263 | — | 805 | 0.115 | — | 240.26 |
Disclaimer/Publisher’s Note: The statements, opinions and data contained in all publications are solely those of the individual author(s) and contributor(s) and not of MDPI and/or the editor(s). MDPI and/or the editor(s) disclaim responsibility for any injury to people or property resulting from any ideas, methods, instructions or products referred to in the content. |
© 2024 by the authors. Licensee MDPI, Basel, Switzerland. This article is an open access article distributed under the terms and conditions of the Creative Commons Attribution (CC BY) license (https://creativecommons.org/licenses/by/4.0/).
Share and Cite
Khussain, B.; Sass, A.; Brodskiy, A.; Rakhmetova, K.; Torlopov, I.; Zhylkybek, M.; Baizhumanova, T.; Tungatarova, S.; Khussain, A.; Zhurinov, M.; et al. Patterns of Formation of Binary Cobalt–Magnesium Oxide Combustion Catalysts of Various Composition. Catalysts 2024, 14, 425. https://doi.org/10.3390/catal14070425
Khussain B, Sass A, Brodskiy A, Rakhmetova K, Torlopov I, Zhylkybek M, Baizhumanova T, Tungatarova S, Khussain A, Zhurinov M, et al. Patterns of Formation of Binary Cobalt–Magnesium Oxide Combustion Catalysts of Various Composition. Catalysts. 2024; 14(7):425. https://doi.org/10.3390/catal14070425
Chicago/Turabian StyleKhussain, Bolatbek, Alexandr Sass, Alexandr Brodskiy, Kenzhegul Rakhmetova, Ivan Torlopov, Magira Zhylkybek, Tolkyn Baizhumanova, Svetlana Tungatarova, Atabek Khussain, Murat Zhurinov, and et al. 2024. "Patterns of Formation of Binary Cobalt–Magnesium Oxide Combustion Catalysts of Various Composition" Catalysts 14, no. 7: 425. https://doi.org/10.3390/catal14070425
APA StyleKhussain, B., Sass, A., Brodskiy, A., Rakhmetova, K., Torlopov, I., Zhylkybek, M., Baizhumanova, T., Tungatarova, S., Khussain, A., Zhurinov, M., Kenessary, A., Tyulebayeva, R., Logvinenko, A., & Narimanov, Y. (2024). Patterns of Formation of Binary Cobalt–Magnesium Oxide Combustion Catalysts of Various Composition. Catalysts, 14(7), 425. https://doi.org/10.3390/catal14070425