Article

Dependence of the Fluidizing Condition on Operating Parameters for Sorption-Enhanced Methanol Synthesis Catalyst and Adsorbent

Catalysis and Reactor Engineering Group (CREG), Aragon Institute of Engineering Research (I3A), University of Zaragoza, C/Mariano Esquillor s/n, 50018 Zaragoza, Spain
*
Author to whom correspondence should be addressed.
Catalysts 2024, 14(7), 432; https://doi.org/10.3390/catal14070432
Submission received: 30 May 2024 / Revised: 27 June 2024 / Accepted: 5 July 2024 / Published: 7 July 2024
(This article belongs to the Special Issue Fluidizable Catalysts for Novel Chemical Processes)

Abstract

:
The fluidization of two different solids was investigated by varying the temperature and pressure conditions and the fluidizing gas. The solids are a novel catalyst and a water sorbent that could be used to perform sorption-enhanced methanol synthesis; the operating conditions were selected accordingly to this process. The aim of this investigation was to find an expression for predicting the minimum fluidization conditions of a methanol synthesis catalyst and an adsorbent in the presence of their process stream and operating conditions. The findings of this study highlighted how umf (STP) decreases with a rise in temperature and increases with a rise in pressure, according to other works in the literature with different solids. Furthermore, the type of gas was found to influence the minimum fluidization velocity significantly. The experimental results agreed well with a theoretical expression of the minimum fluidization velocity adjusted for temperature, pressure, and viscosity. The choice of the expression for viscosity calculation in the case of gas mixtures was found to be of key importance. These results will be useful for researchers aiming to calculate the minimum fluidization velocity of a catalyst or other solids under reaction conditions using results obtained at ambient conditions with air or inert gas.

Graphical Abstract

1. Introduction

Nowadays, fluidized bed reactors are a mature technology employed in several industrial processes. In many cases, they can ensure economy of scale, overcome several issues of more common fixed-bed technologies, such as hot spot generation or catalyst deactivation, and allow easy regeneration procedures because of the mobility of the solid bed [1]. Various processes can benefit from fluidized bed application, including many catalytic processes [2,3], pyrolysis of biomass [4,5], and coal combustion [6,7]. Despite the numerous advantages of their application, it is undoubted that operating with a fluidized bed increases the complexity of data interpretation [8], especially in the case of catalytic reactions [9]. Nonetheless, predicting the phenomena that can possibly occur during fluidization is vital [10]. For this reason, attention to studying the behavior of fluidized beds goes back and forth, periodically adding new information.
The most important parameter for expressing the fluidization behavior of a solid or a mixture of solids is certainly the minimum fluidization velocity, umf. The correlation at the basis of its determination is Ergun’s equation (Equation (1)), which expresses the pressure drop in the bed at velocities below umf. As can be observed, the equation includes the dependency on system parameters at the minimum fluidization condition (namely, the expanded bed height Hmf, velocity umf, and porosity εmf), fluid properties (viscosity μf and density ρf), and particle properties (sphericity φ, diameter dp, and density ρp). At minimum fluidization conditions, the same pressure drop can be expressed as the difference between the flotation and the net weight of the solid per unit of surface (Equation (2)). The equality of Equations (1) and (2) (expressed as Equation (3)) gives an expression for calculating umf. Depending on the fluidization conditions, it is possible to simplify the resolution of Equation (3). The flow regime can be expressed through the Reynolds number (Equation (4)), with the distinction in laminar regime when Re < 20 and turbulent regime when Re > 1000. For the laminar regime, viscous forces are prevalent, and it is possible to neglect the inertial term of the equation (umf2 term); hence, umf is given by Equation (5). On the other hand, in the turbulent regime, the inertial forces overcome the viscous forces (hence, the term expressing linear dependence on velocity can be neglected), resulting in the expression of minimum fluidization velocity given by Equation (6).
Δ P = H mf 150 ( 1 ε mf ) 2 ε mf 3 μ f ( φ · d p ) 2 u mf + 1.75 ( 1 ε mf ) ε mf 3 ρ f φ · d p u mf 2
Δ P = H mf ( ρ p ρ f ) ( 1 ε mf ) g
H mf ( ρ p ρ f ) ( 1 ε mf ) g = H mf 150 ( 1 ε mf ) 2 ε mf 3 μ f ( φ · d p ) 2 u mf + 1.75 ( 1 ε mf ) ε mf 3 ρ f φ · d p u mf 2
Re mf = d p · u mf · ρ f μ f
u mf = ( φ · d p ) 2 150 ( ρ p ρ f ) μ f g ε mf 3 ( 1 ε mf )
u mf = φ · d p 1.75 ( ρ p ρ f ) ρ f ε mf 3 g
In the case of A and B Geldart solids, the minimum fluidization velocity has a magnitude that generally establishes a laminar regime. Hence, considering Equation (5) it is possible to observe that umf depends on fluid properties. In particular, since, in the case of gasses, the quantity p − ρf) does not vary remarkably with temperature or pressure, the minimum fluidization velocity is directly correlated to gas viscosity with an inverse proportionality (umf ∝ 1/μf). Obviously, the physical properties have an implicit dependence on temperature and pressure, and the same can be stated for the bed porosity, εmf.
When applying fluidized beds to catalytic reactions, this implicit relation is of key importance since minimum fluidization conditions are normally measured at room temperature and atmospheric pressure, while the chemical processes usually take place at high temperatures and may require high pressures, depending on the reaction.
This aspect was evaluated in a few earlier studies, and a summary of the experimental observations was given by Kunii and Levenspiel in their book “Fluidization Engineering” [11] as follows: slight increases in the operating pressure (1–4%), while the change in umf is not significant for particles with dp < 100 μm but becomes considerable for larger particles (variation up to 40% for dp ≅ 360 μm); εmf increases with temperature for fine particles (variation up to 8% for temperatures up to 500 °C) but does not change remarkably for coarse particles. These considerations, however, cannot provide a prediction of the umf value in different conditions.
Further studies on this topic were reported during the 1990s, leading to different conclusions. Wu and Baeyens [12] developed an empirical equation based on dimensionless parameters that could provide the minimum fluidization velocity for a given solid–gas system at any temperature condition. Bi and Grace [13] reported through experimental observations that there is a tendency to shift toward lower umf when increasing the temperature and toward higher umf when increasing the pressure. In contrast, Liu et al. [14] reported that the variation in umf upon temperature depends on the type of solid investigated, and it tends to decrease for B-group Geldart solids and to increase for D-group Geldart solids. More recently, Raganati et al. [15] studied the influence of temperature on the fluidization of A- and C-group Geldart solids when perturbed by acoustic fields to discern the role of cohesive forces and how they change with temperature. They observed a general increase in cohesiveness with the increase in temperature. The fluidization at different temperatures of B-group Geldart solids was modeled with a 2D analysis by Gosavi et al. [16] with an agreement between modeled and experimental data within a 5% error. The authors reported that the drag model employed in the simulation was of key importance for the adequacy of the result. None of the above-discussed results, however, provided a simple equation to predict the variation in fluidization conditions with operating temperature and pressure. Chirone et al. [17] provided an interesting result in this sense, investigating group B and C Geldart solids, even though nitrogen was the only gas employed for fluidization and not so many indications of the employed solids were given in their work for confidentiality reasons.
The need for a new study related to minimum fluidization velocity dependency on temperature and pressure arose from studies on sorption-enhanced methanol synthesis [18,19]. For this application, in a recent patent, Menéndez et al. [20] proposed a new configuration for fluidized bed reactors. In a process like methanol synthesis from CO2, in which the space velocity should be kept relatively low because of the kinetic limitations of the reaction, accurate knowledge of the minimum fluidization conditions is a key issue. Indeed, the minimum fluidization velocity fixes the minimum operating reactants’ flowrates, while the space velocity controls the highest value and, therefore, the catalyst mass to ensure an adequate yield of the process. Even if working with relative velocities of 1.2–1.5, it is necessary to load significant catalyst mass in the reactor to accomplish the minimum contact time required, leading to the design of reactors with quite high L/D ratios. According to the principles of sorption-enhanced reactions, two solids should be employed in the system including a catalyst and an adsorbent. Hence, the two of them must be well-characterized in their fluidization behavior prior to being used in the final application, where the mixture of the two solids will be employed to run the reaction. Naturally, it is always possible to determine the minimum fluidization velocity of a solid in ambient conditions, but the reaction usually takes place at mild temperatures (200–300 °C) and high pressures (20–50 bar) [21]. What value should one consider as the minimum fluidization velocity at the reaction conditions?
The above-reviewed studies give many examples of solid behavior in different situations, but a simple expression for the calculation of minimum fluidization velocity at desired temperature/pressure/gas-type conditions is still missing.
Therefore, this study seeks to evaluate the variation in minimum fluidization velocity as a function of temperature, pressure, and gas type, and to correlate the experimental evidence with the theoretical concepts of fluidization. The choice of which solids, gasses, and operating conditions to employ is strictly related to the process of sorption-enhanced methanol synthesis. Hence, two solids are selected with remarkably different physical characteristics, specifically in density and size. In detail, the solids are a zeolite and a catalyst that belong to two different classes of particles, respectively, light-small-fluid (LSF) and heavy-big-packed (HBP) particles. The results of the activity allowed us to obtain a simple and trustworthy equation for determining the fluidization conditions—and consequently, the reactants’ flowrates—to operate this reaction.

2. Results

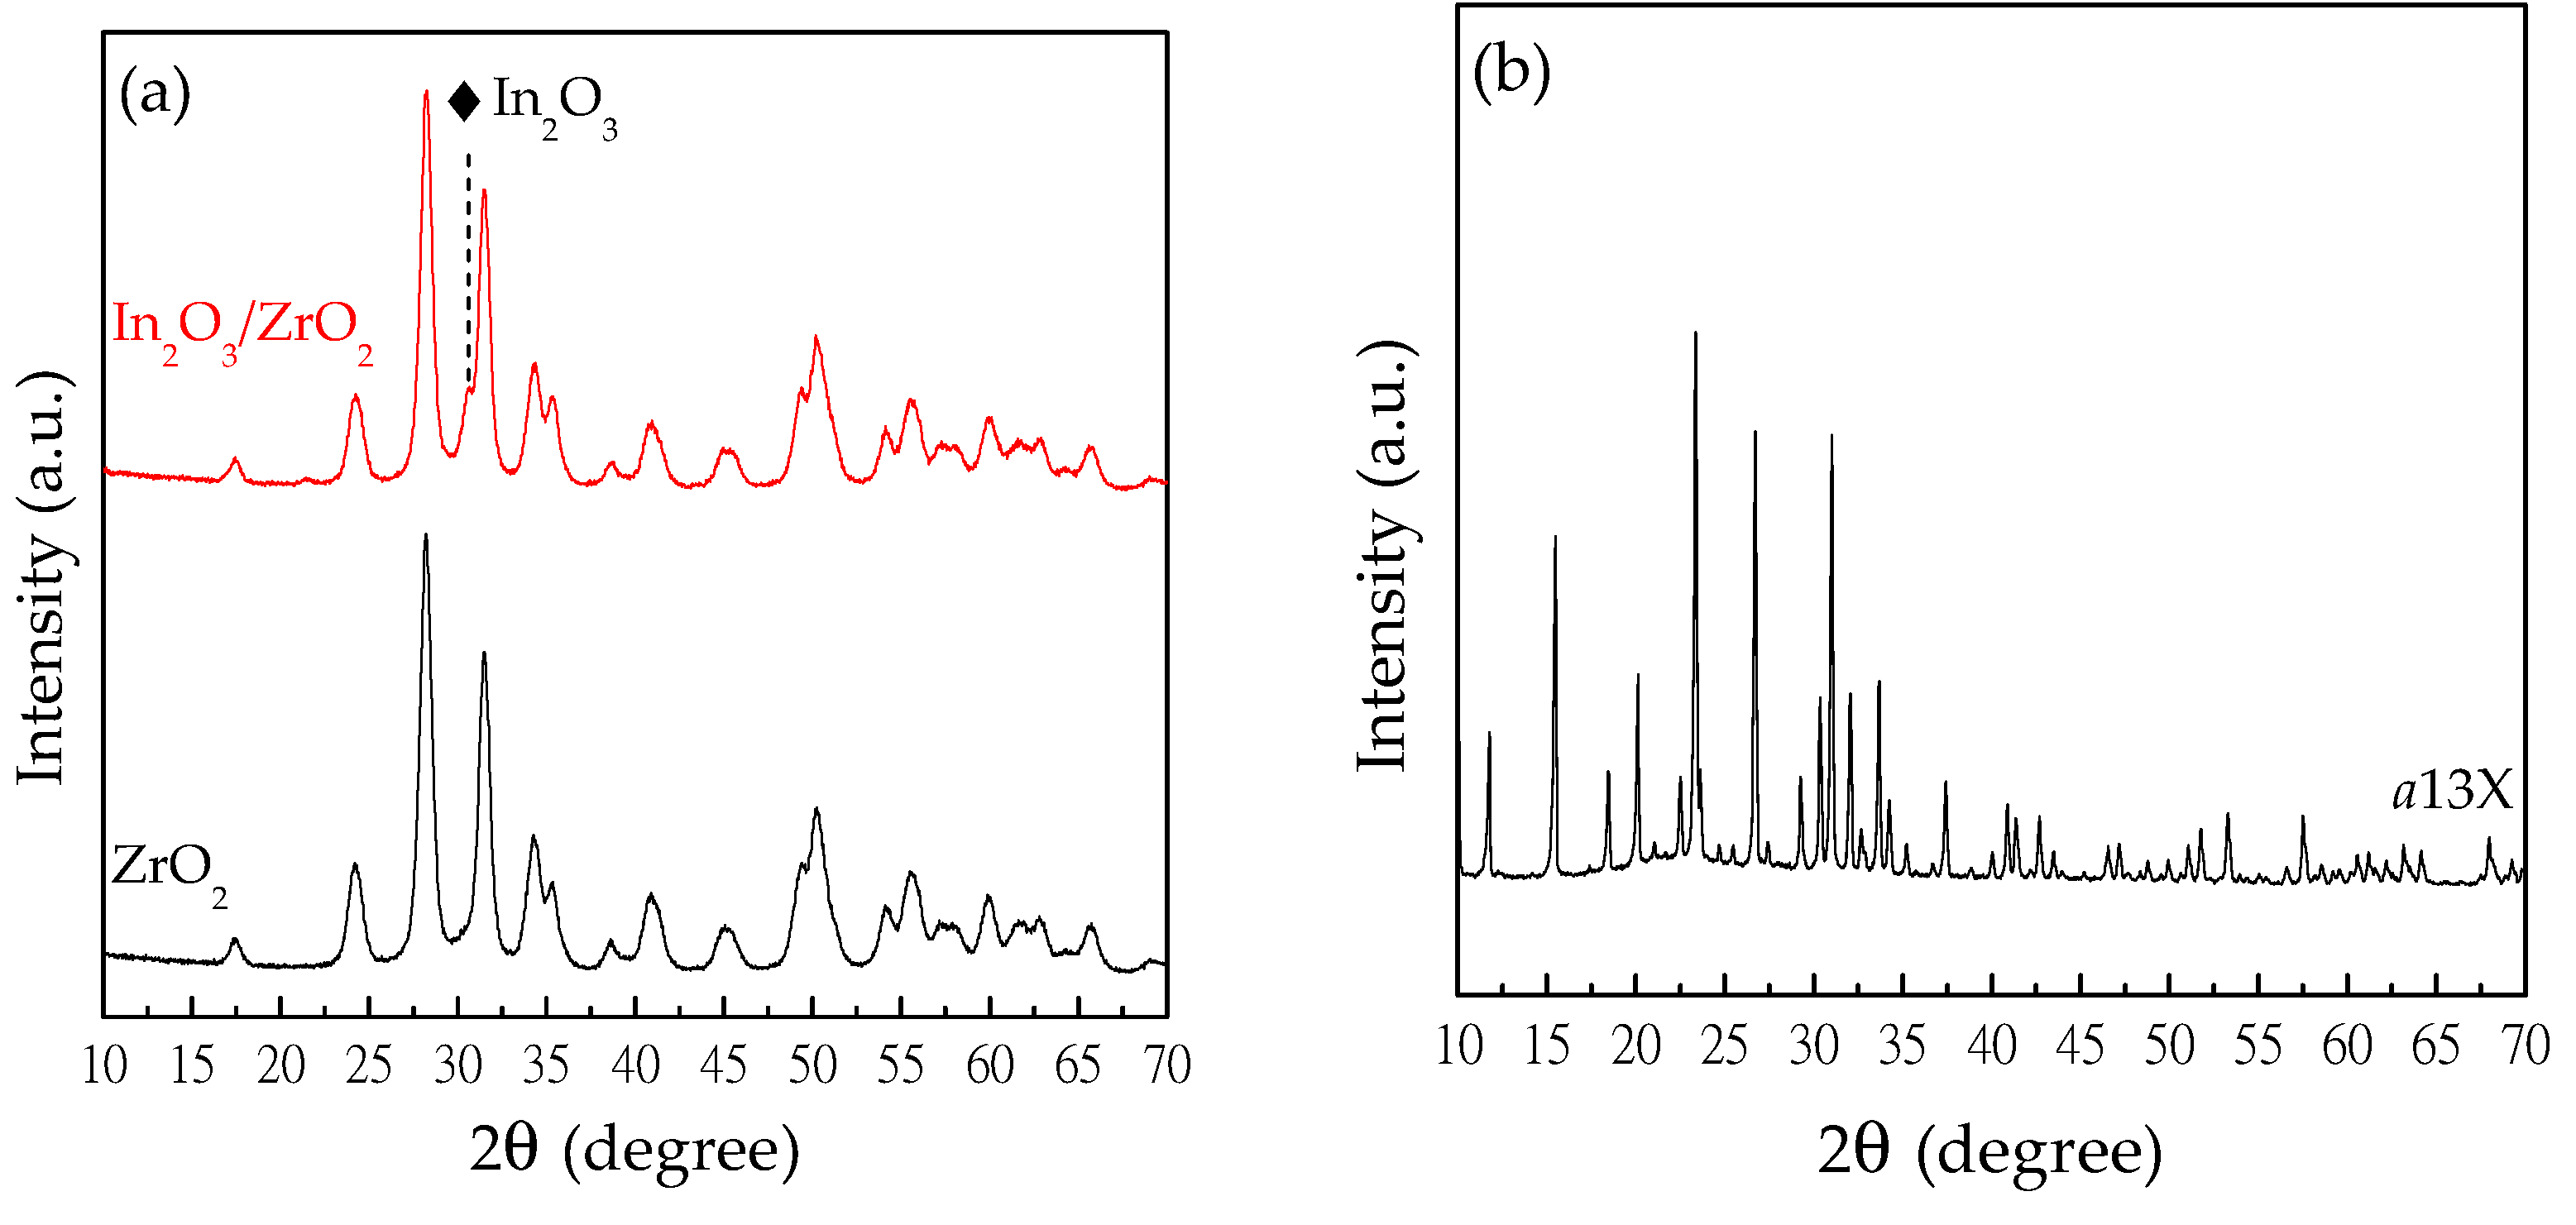
2.1. Solid Characterization

A novel methanol catalyst based on In2O3/ZrO2 and a previously agglomerated commercial 13X zeolite were chosen as solids for this study; the detailed catalyst preparation and the agglomeration procedure are described in Section 4. A full characterization of the solids is not particularly relevant to the aim of this study. Considering this, only XRD and XRF were performed. The XRD spectra are reported in Figure 1. Figure 1a shows the diffractograms of the catalyst and ZrO2 added as a reference. because the signals overlap, the presence of indium oxide is only slightly appreciable. However, cubic In2O3 (222) is visible as a shoulder at 30.44° [22]. Figure 1b displays the agglomerated 13X spectrum.
XRF analysis allowed us to identify the change in the composition of the zeolite with respect to the pristine solid. The results are reported in Table 1. As can be observed, the above-described procedure determines the addition of approximately 20 wt.% of SiO2 to the zeolite, changing the characteristic Si/Al ratio from 1.40 to 2.05.

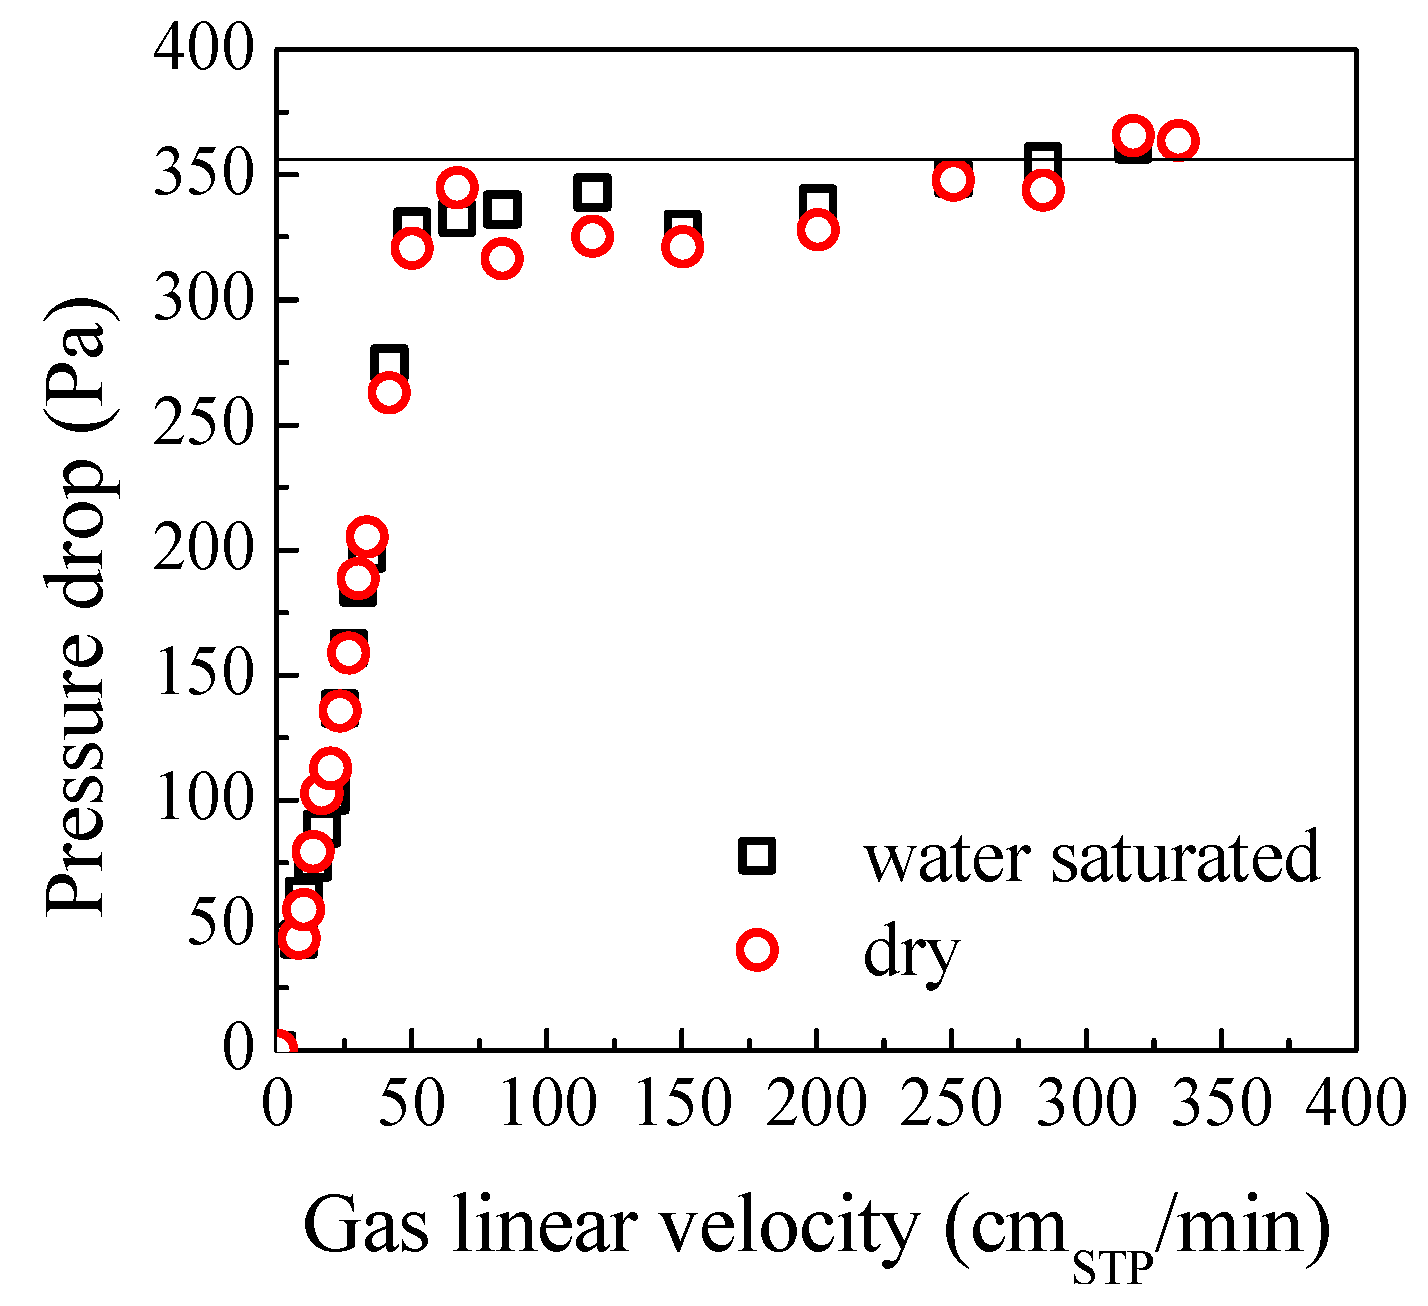
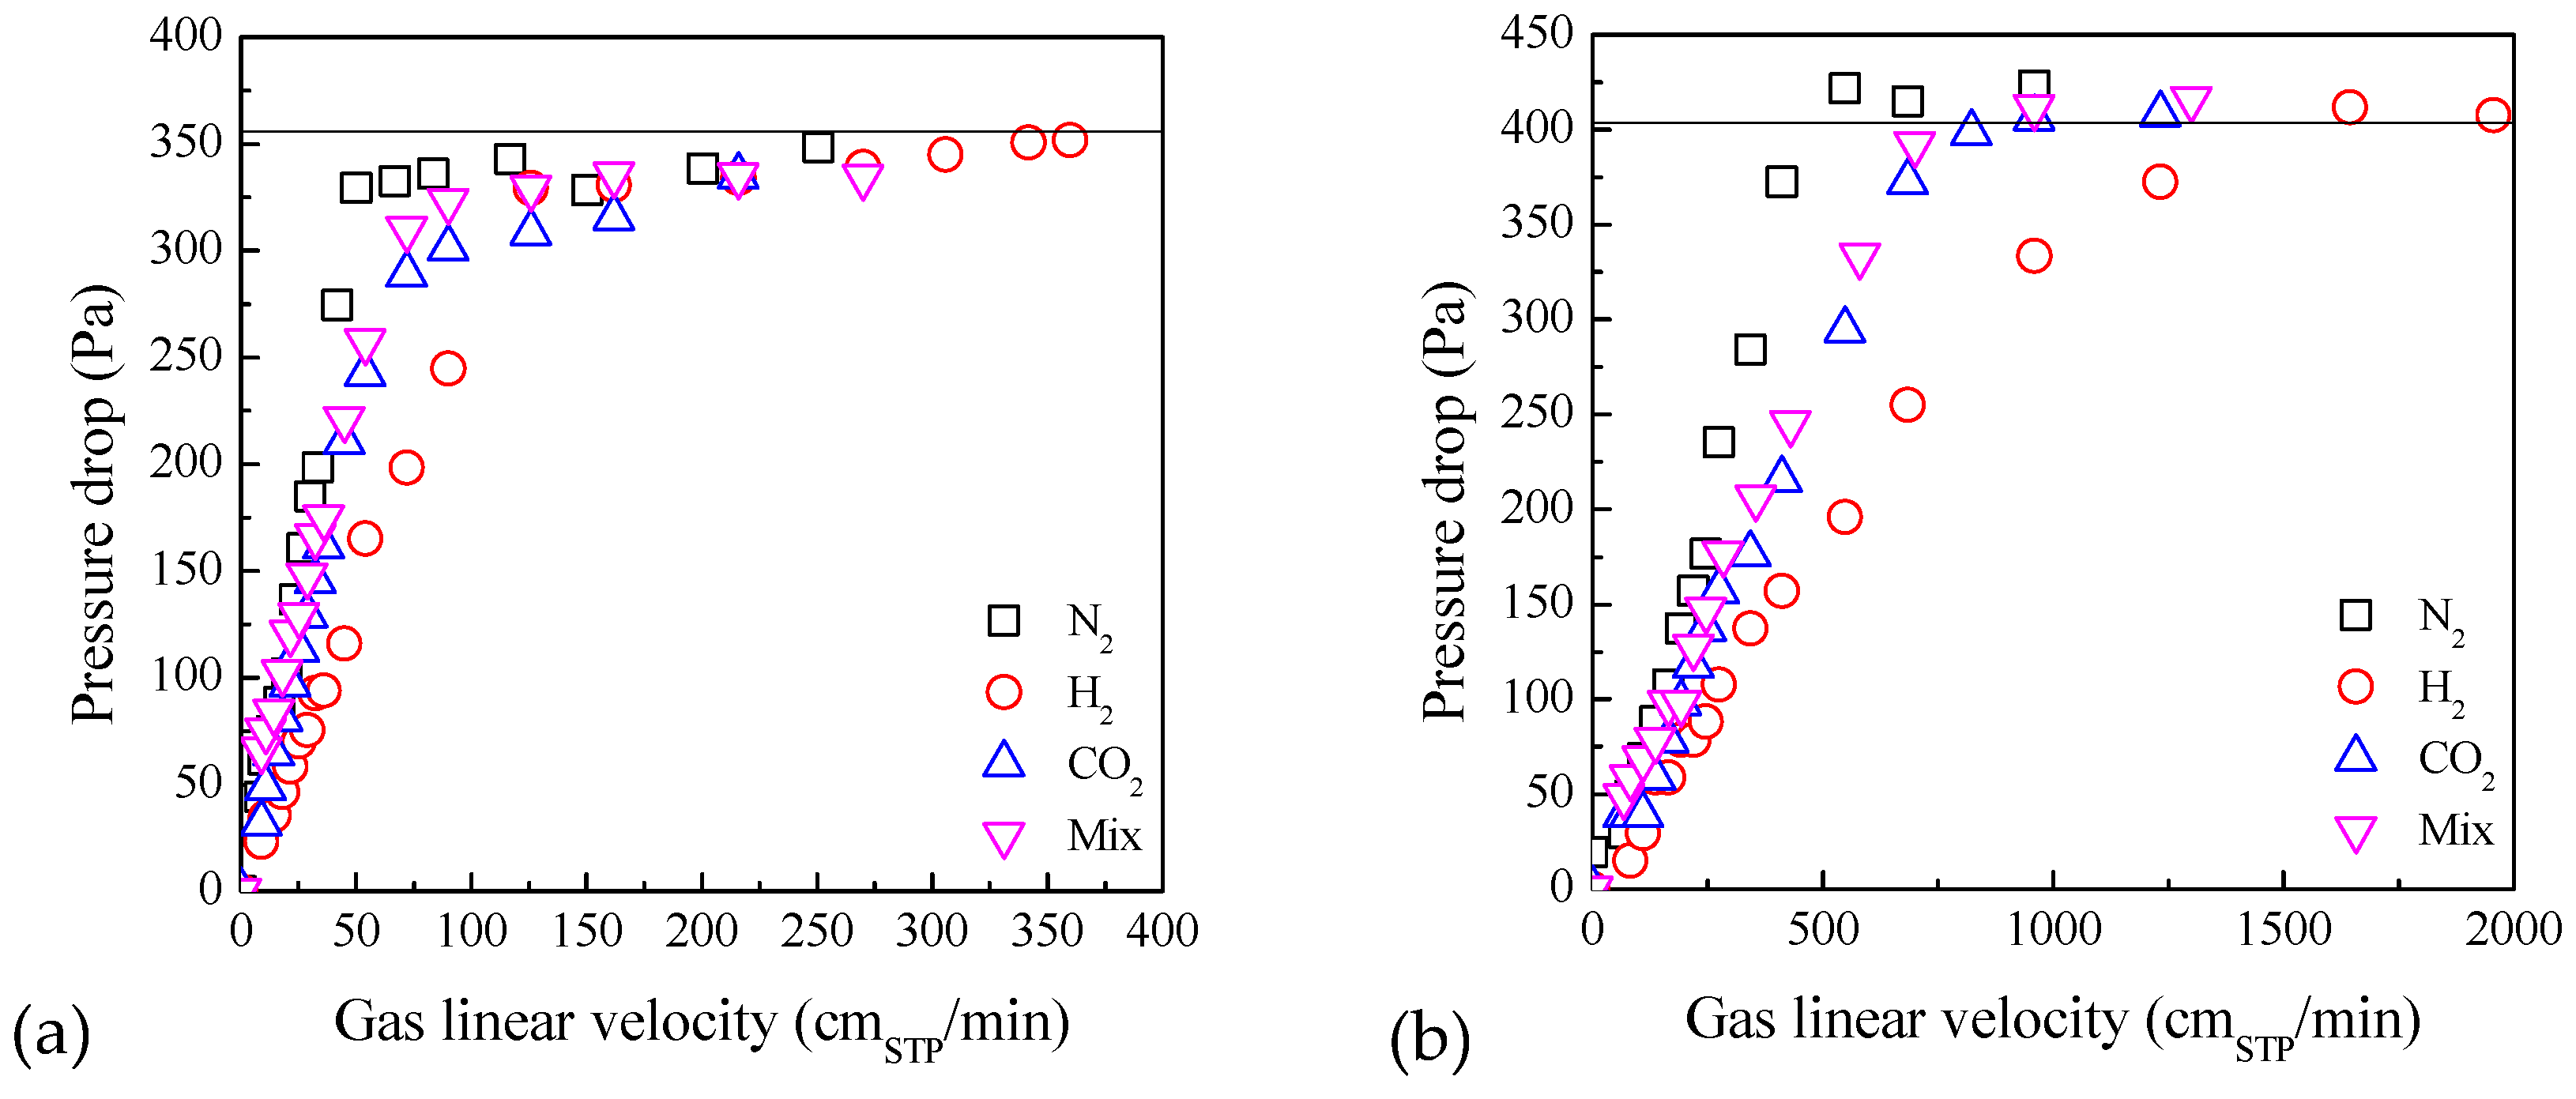
2.2. Influence of Gas Type on Fluidization

Considering the target application for the solids in this study, a preliminary test of the minimum fluidization velocity was calculated for the zeolite in both the condition of a dry powder and a water-saturated powder. This evaluation is particularly important for the following two reasons: in the first instance, it ensures the absence of humidity-related phenomena when comparing the 25 °C experiment with the high-temperature ones; then, even more importantly, it excludes changes in fluidization behavior during the sorption-enhanced reaction. The results, reported in Figure A1, ensured that no significant change in umf occurs with a change in the humidity of the zeolite.
Then, the effect of the gas type on the minimum fluidization velocity was investigated, keeping ambient conditions (the room temperature was 25 °C, and the atmospheric pressure was 709 mmHg) for both the zeolite (LSF solid) and the catalyst (HBP solid). As explained in detail in Section 4, N2, CO2, H2, and a 3:1 H2:CO2 mixture (from now on referred to as “mixture”) were used as fluidizing gas.
To evaluate the minimum fluidization velocity, the conventional procedure of fluidization–defluidization of a bed of solids was employed; this is described in more detail in Section 4. This study also allowed us to calculate the physical parameters of the solids, according to Equations (A1)–(A3) in Appendix A. It is worth mentioning that the umf(STP) value is calculated as the ratio between the gas flowrate (Q, measured at STP conditions) and the bed cross-sectional area (S). Therefore, it is related with the value of umf in Equations (1)–(5) by Equation (6), where Ps = 100 kPa and Ts = 273 K.
u mf STP = Q   STP S = u mf P P s T s T
The results are displayed in Figure 2, and the values of minimum fluidization velocity are reported in Table 2. As can be observed, the linear velocity realized in the two systems to reach fluidization differs in orders of magnitude. Compared with zeolite, the catalyst needs an extensively higher gas linear velocity to fluidize. The agglomerated zeolite employed in this study has a calculated particle density of 0.9 g/cm3 and a particle size distribution in the range of 75–150 μm. According to Geldart’s classification of powders, it is an aeratable solid (A/A′ group); hence, a relatively low minimum fluidization velocity is expected, coherent with the experimental results. On the other hand, the catalyst has significantly different properties. It has a calculated particle density of 1.4 g/cm3 and a particle size distribution (PSD) in the range of 250–400 μm. According to Geldart’s classification of powders, the catalyst is on the edge of the A/B groups, even though the PSD suggests that it should be mainly a sand-like solid (B group).
As can be observed, the fluidization of both solids is influenced by the type of gas employed, according to earlier observations [23]. N2, CO2, and the mixture are fluidizing agents that behaves almost equally both in the case of zeolite and the catalyst. Nitrogen is the most “effective” in fluidizing both solids since it reaches the maximum theoretical pressure drop at the lowest gas linear velocity. On the other hand, it is possible to appreciate a sensible difference when performing the experiment with hydrogen. This could be easily expected since hydrogen is a much less viscous gas; hence, a greater flow stream is necessary to produce a given pressure drop. Fluidization in presence of CO2 and the mixture gave similar behavior of the solid, despite the relatively low CO2 percentage in the mixture. This must be related to the viscosity of CO2, which is much higher than that of hydrogen.

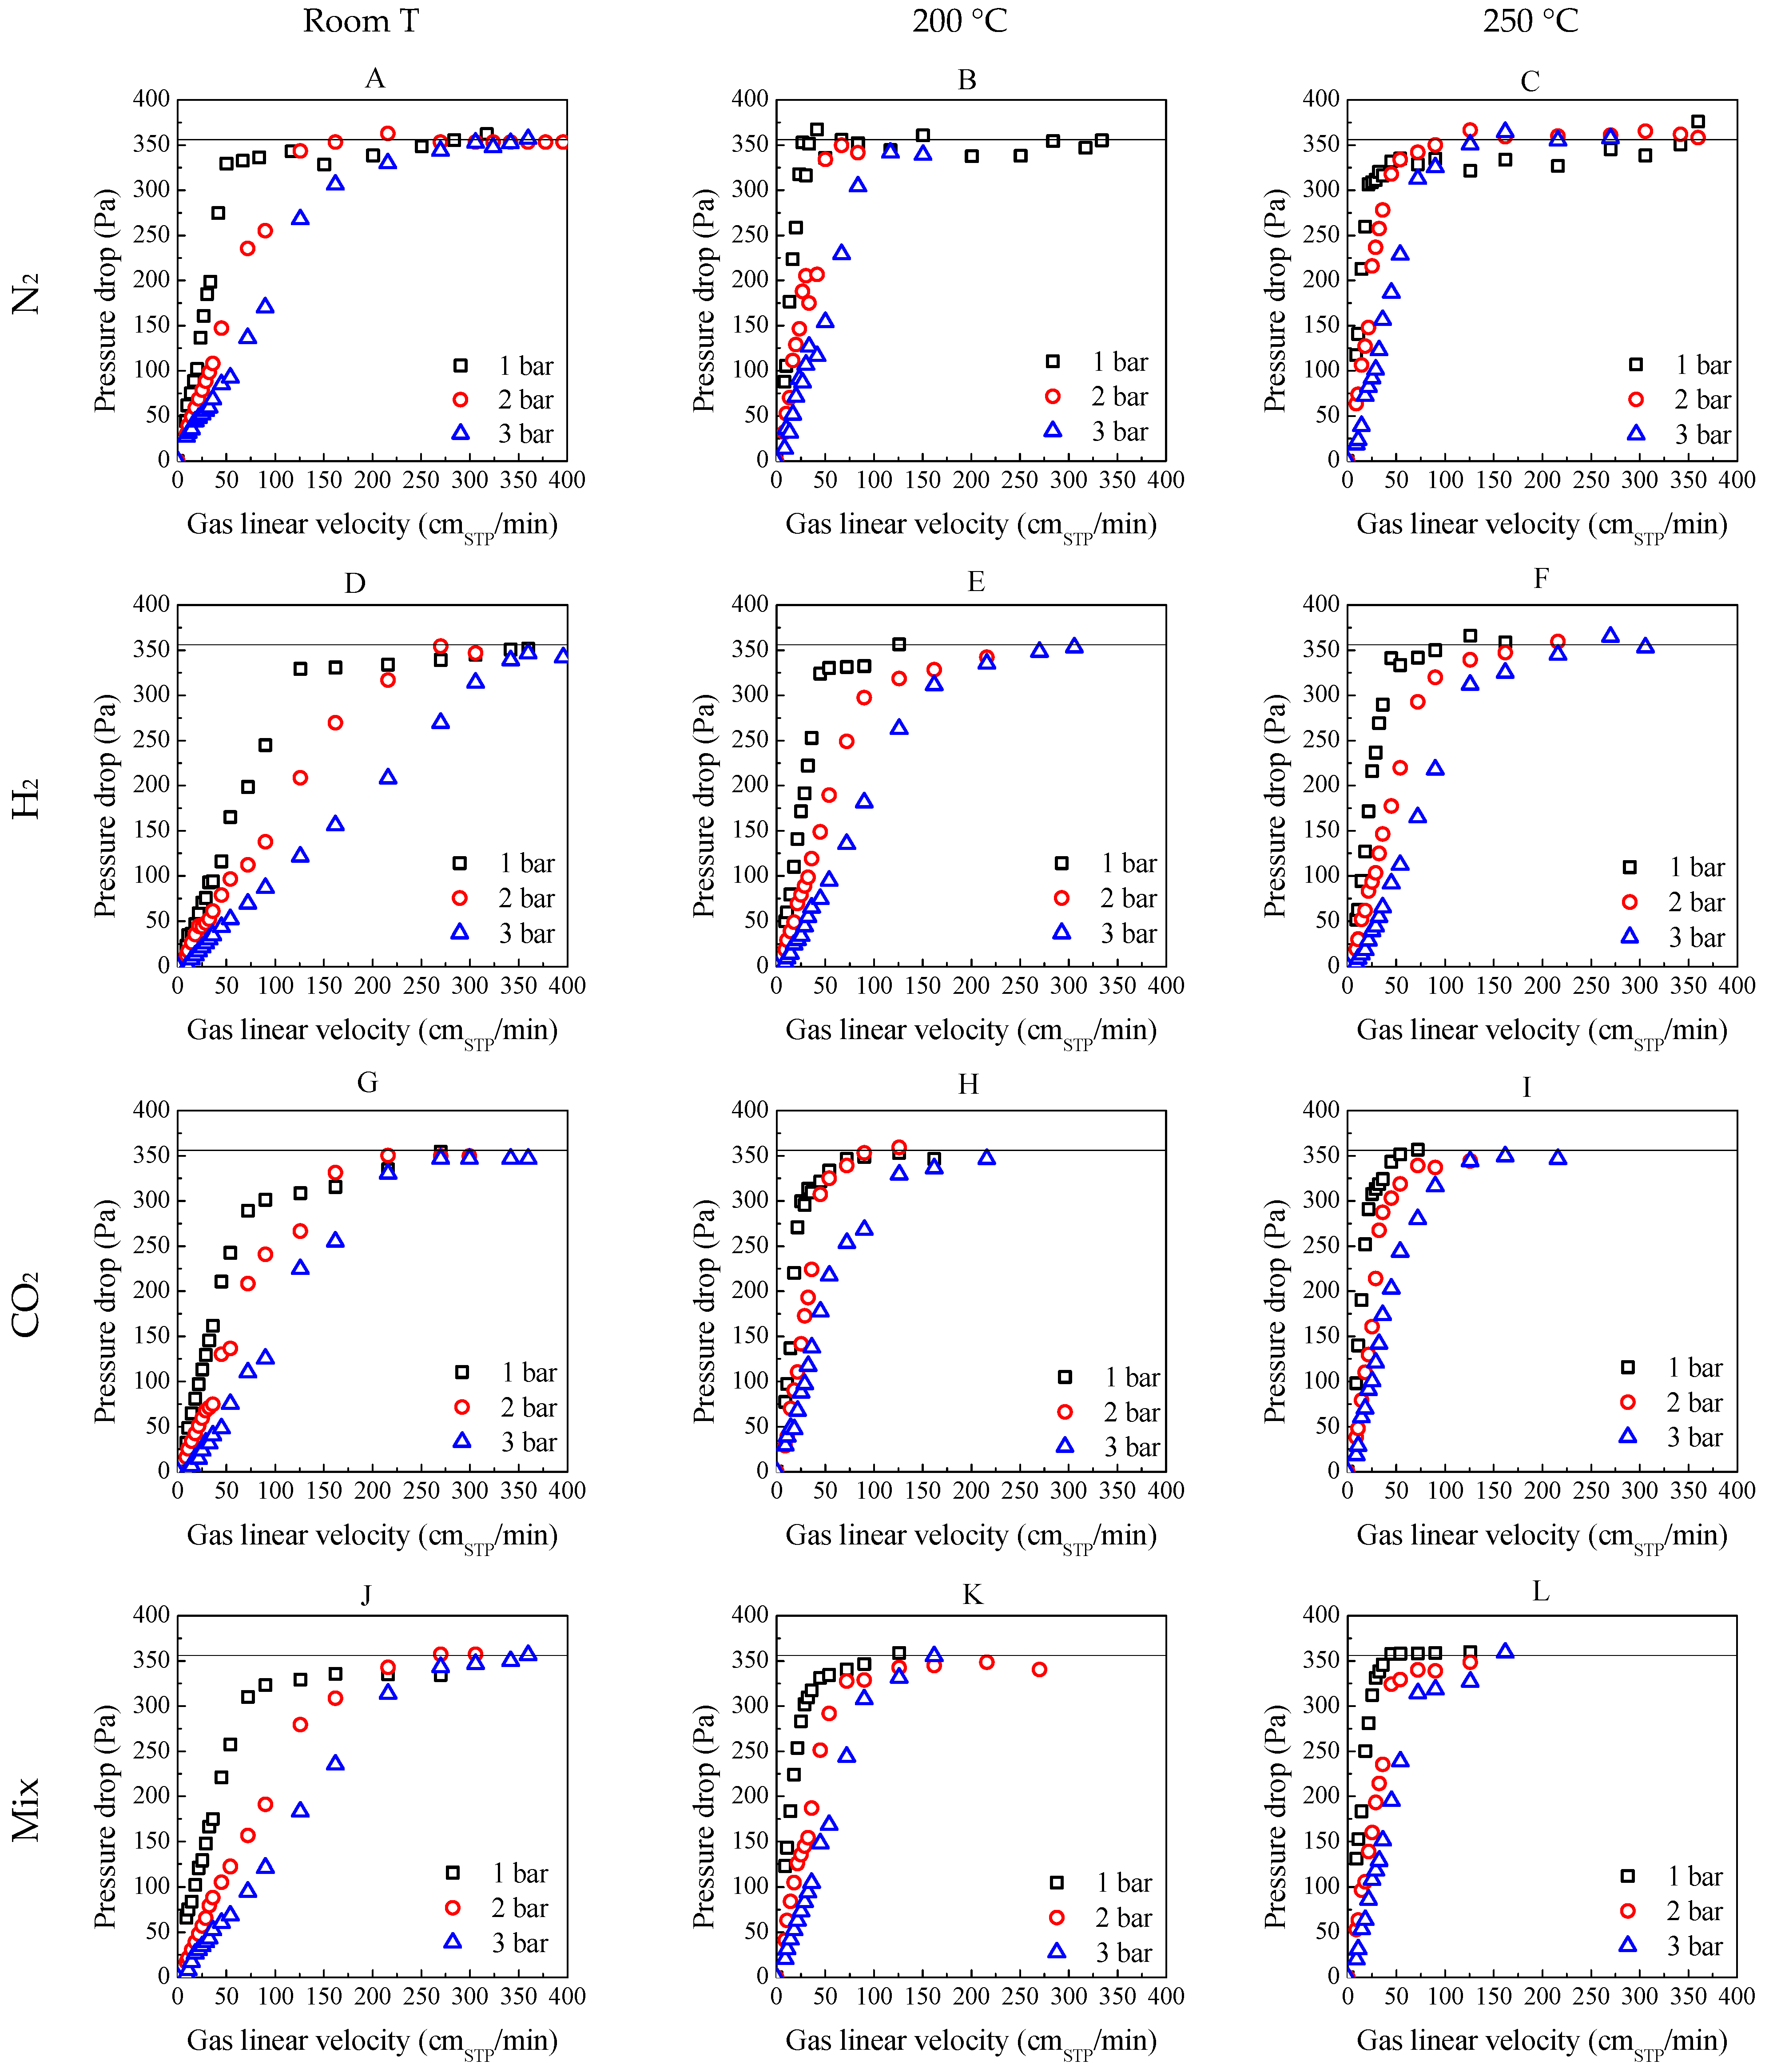
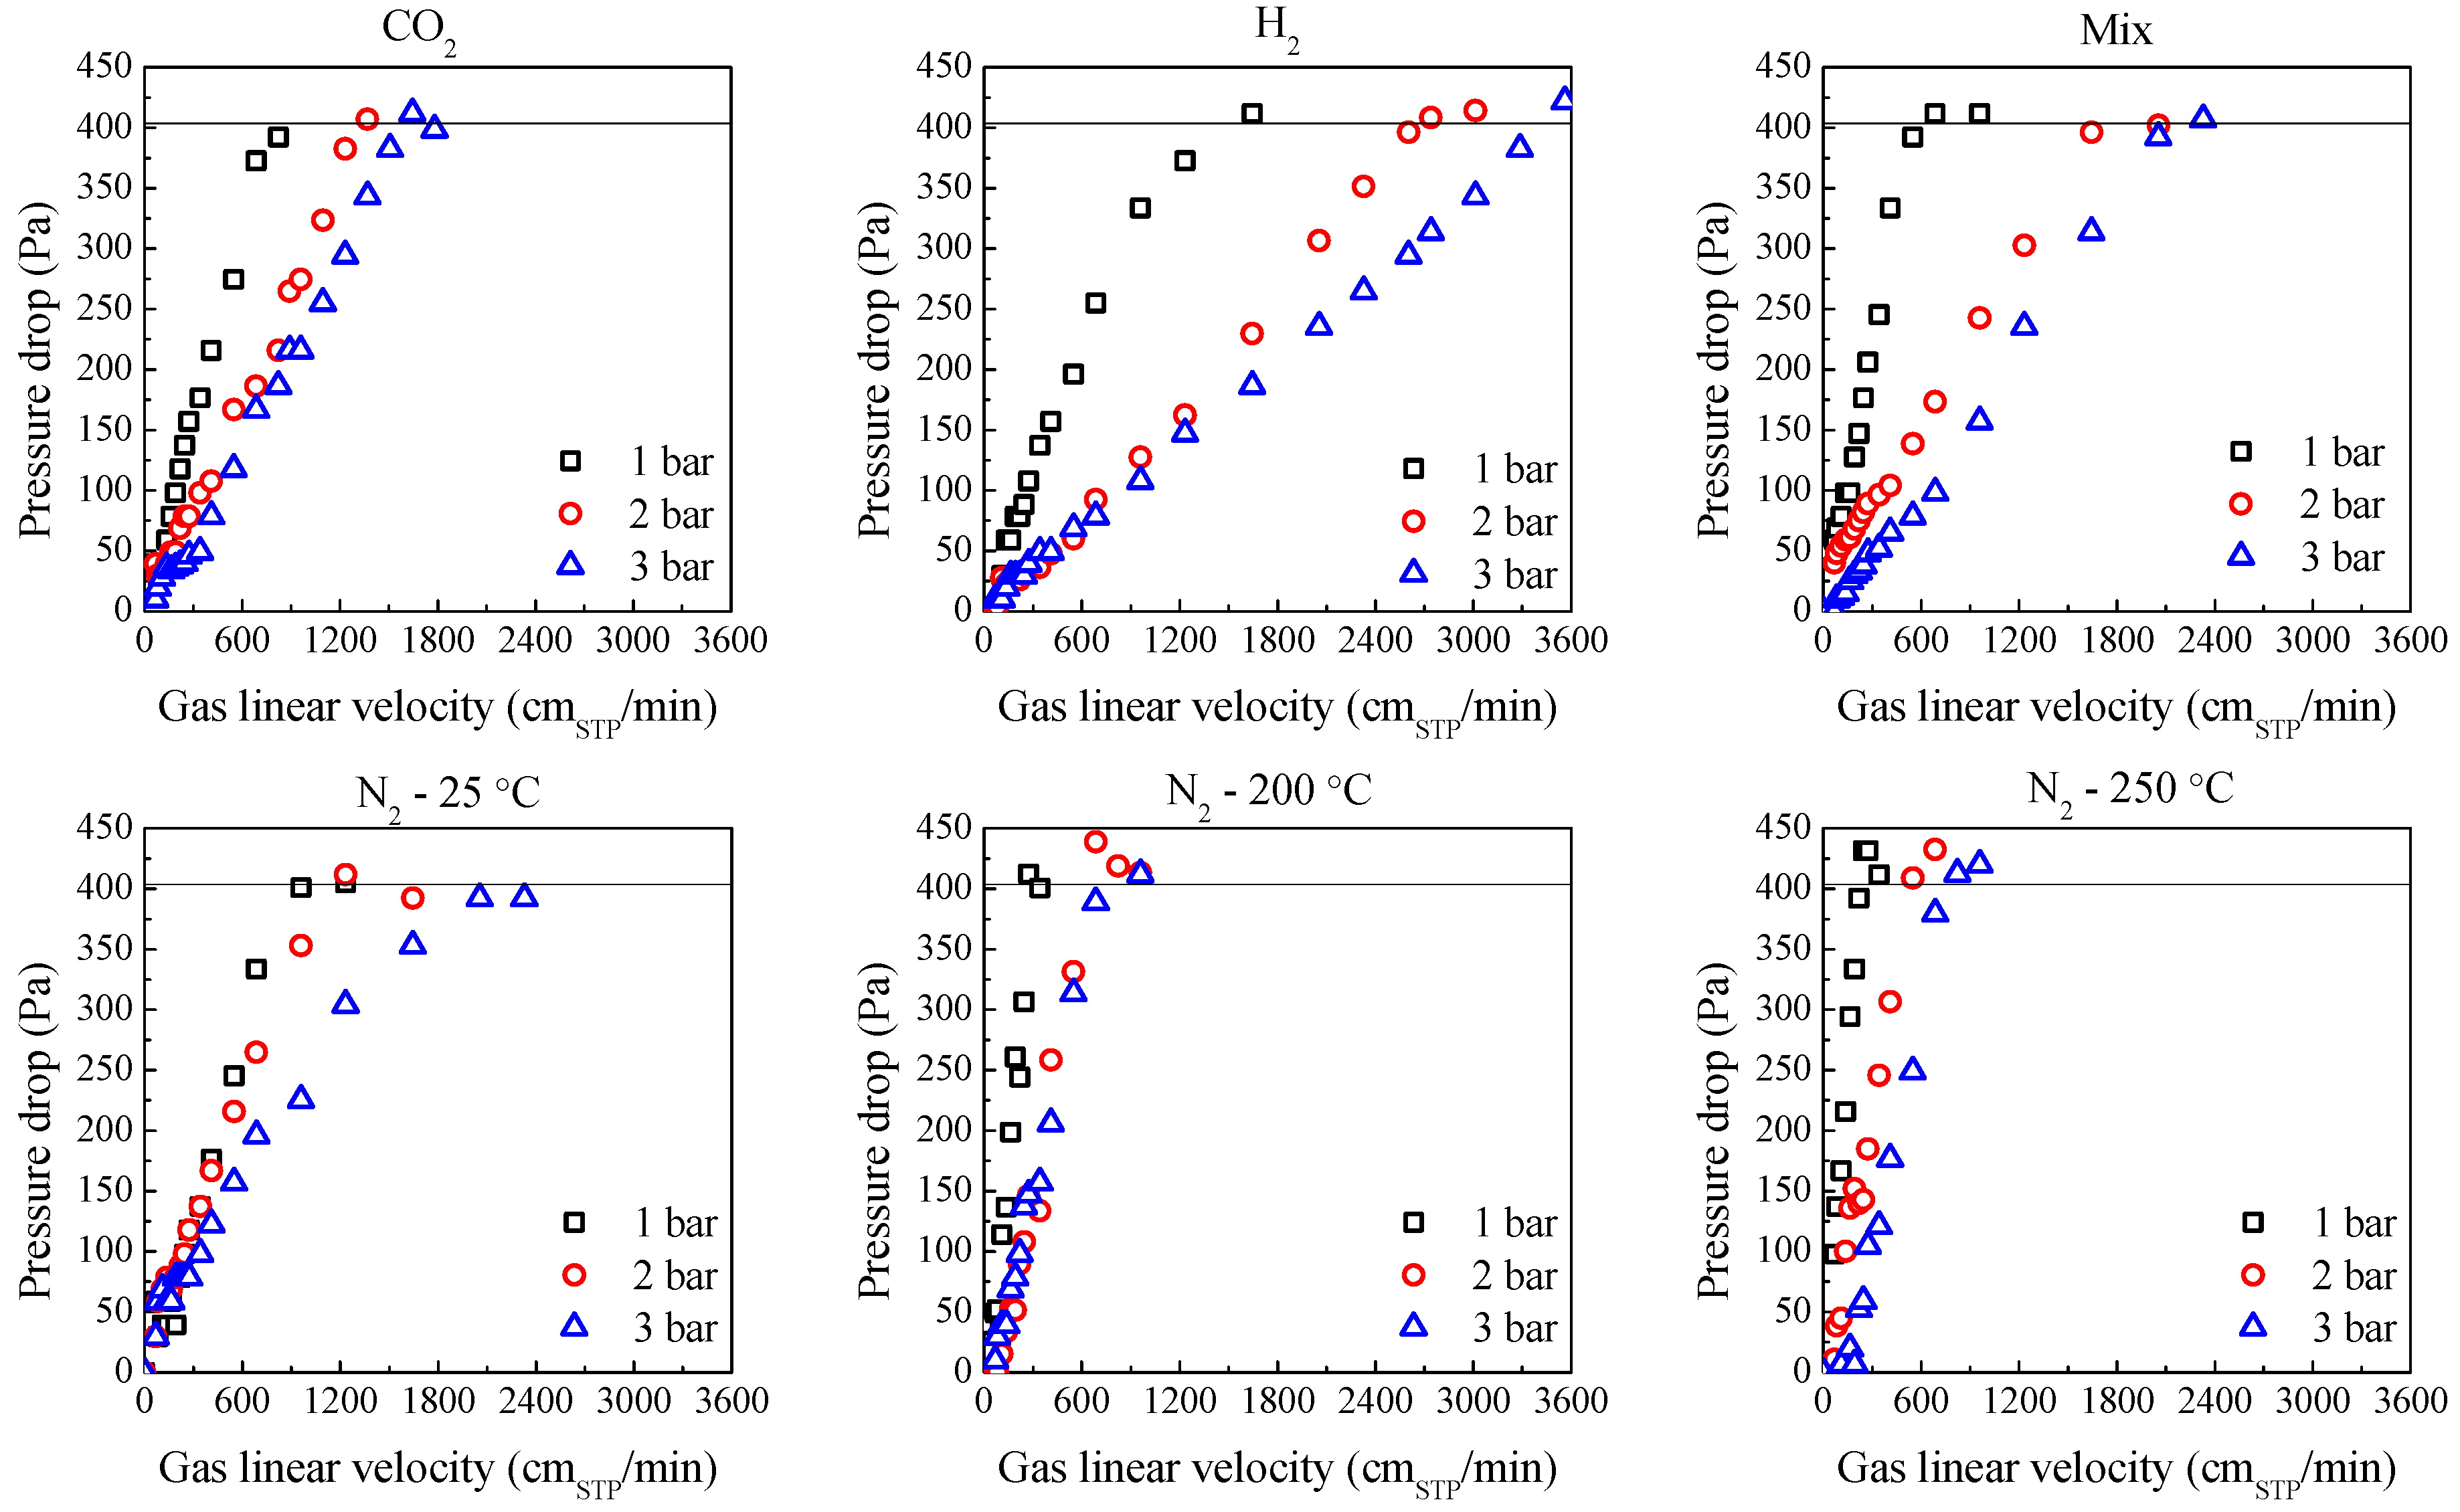
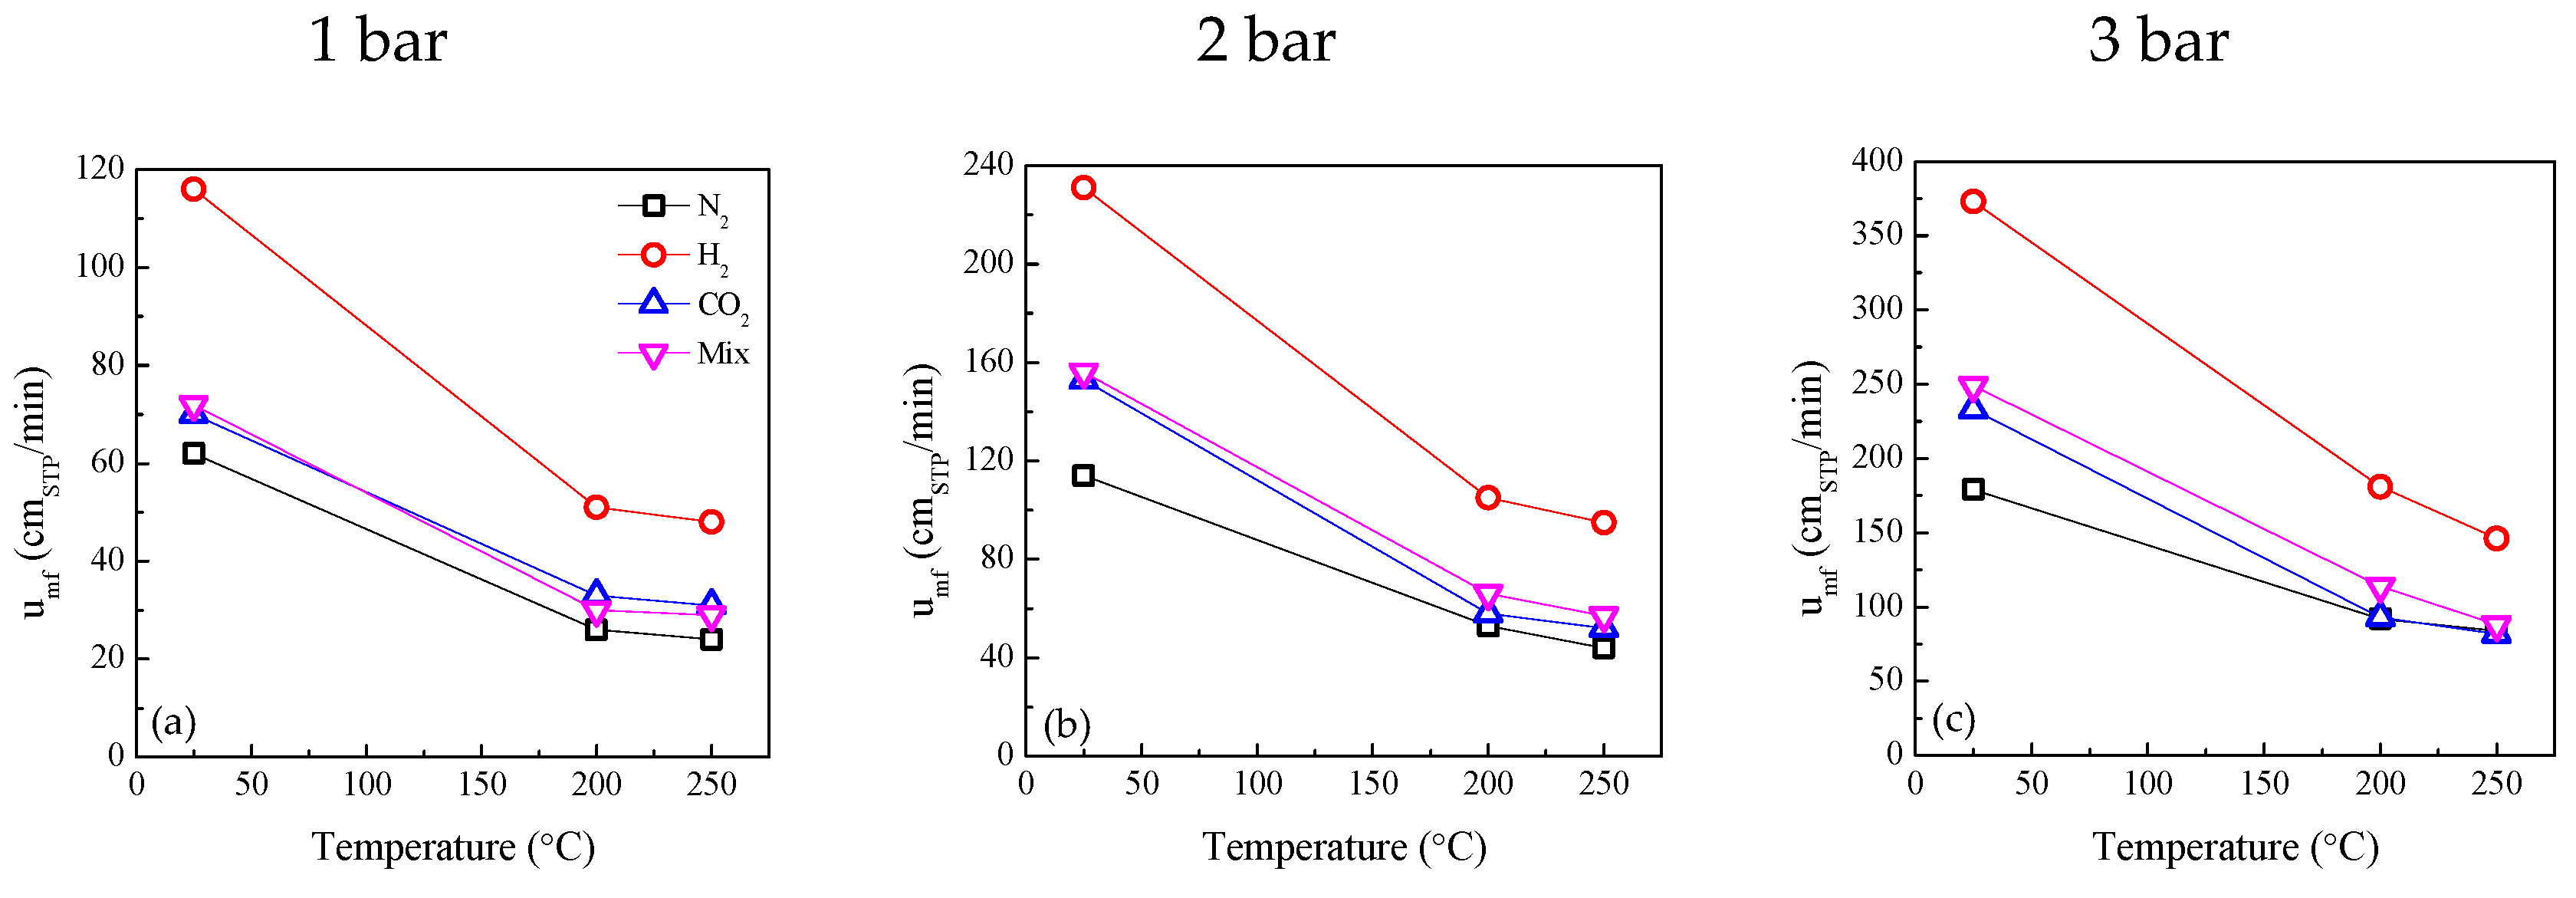
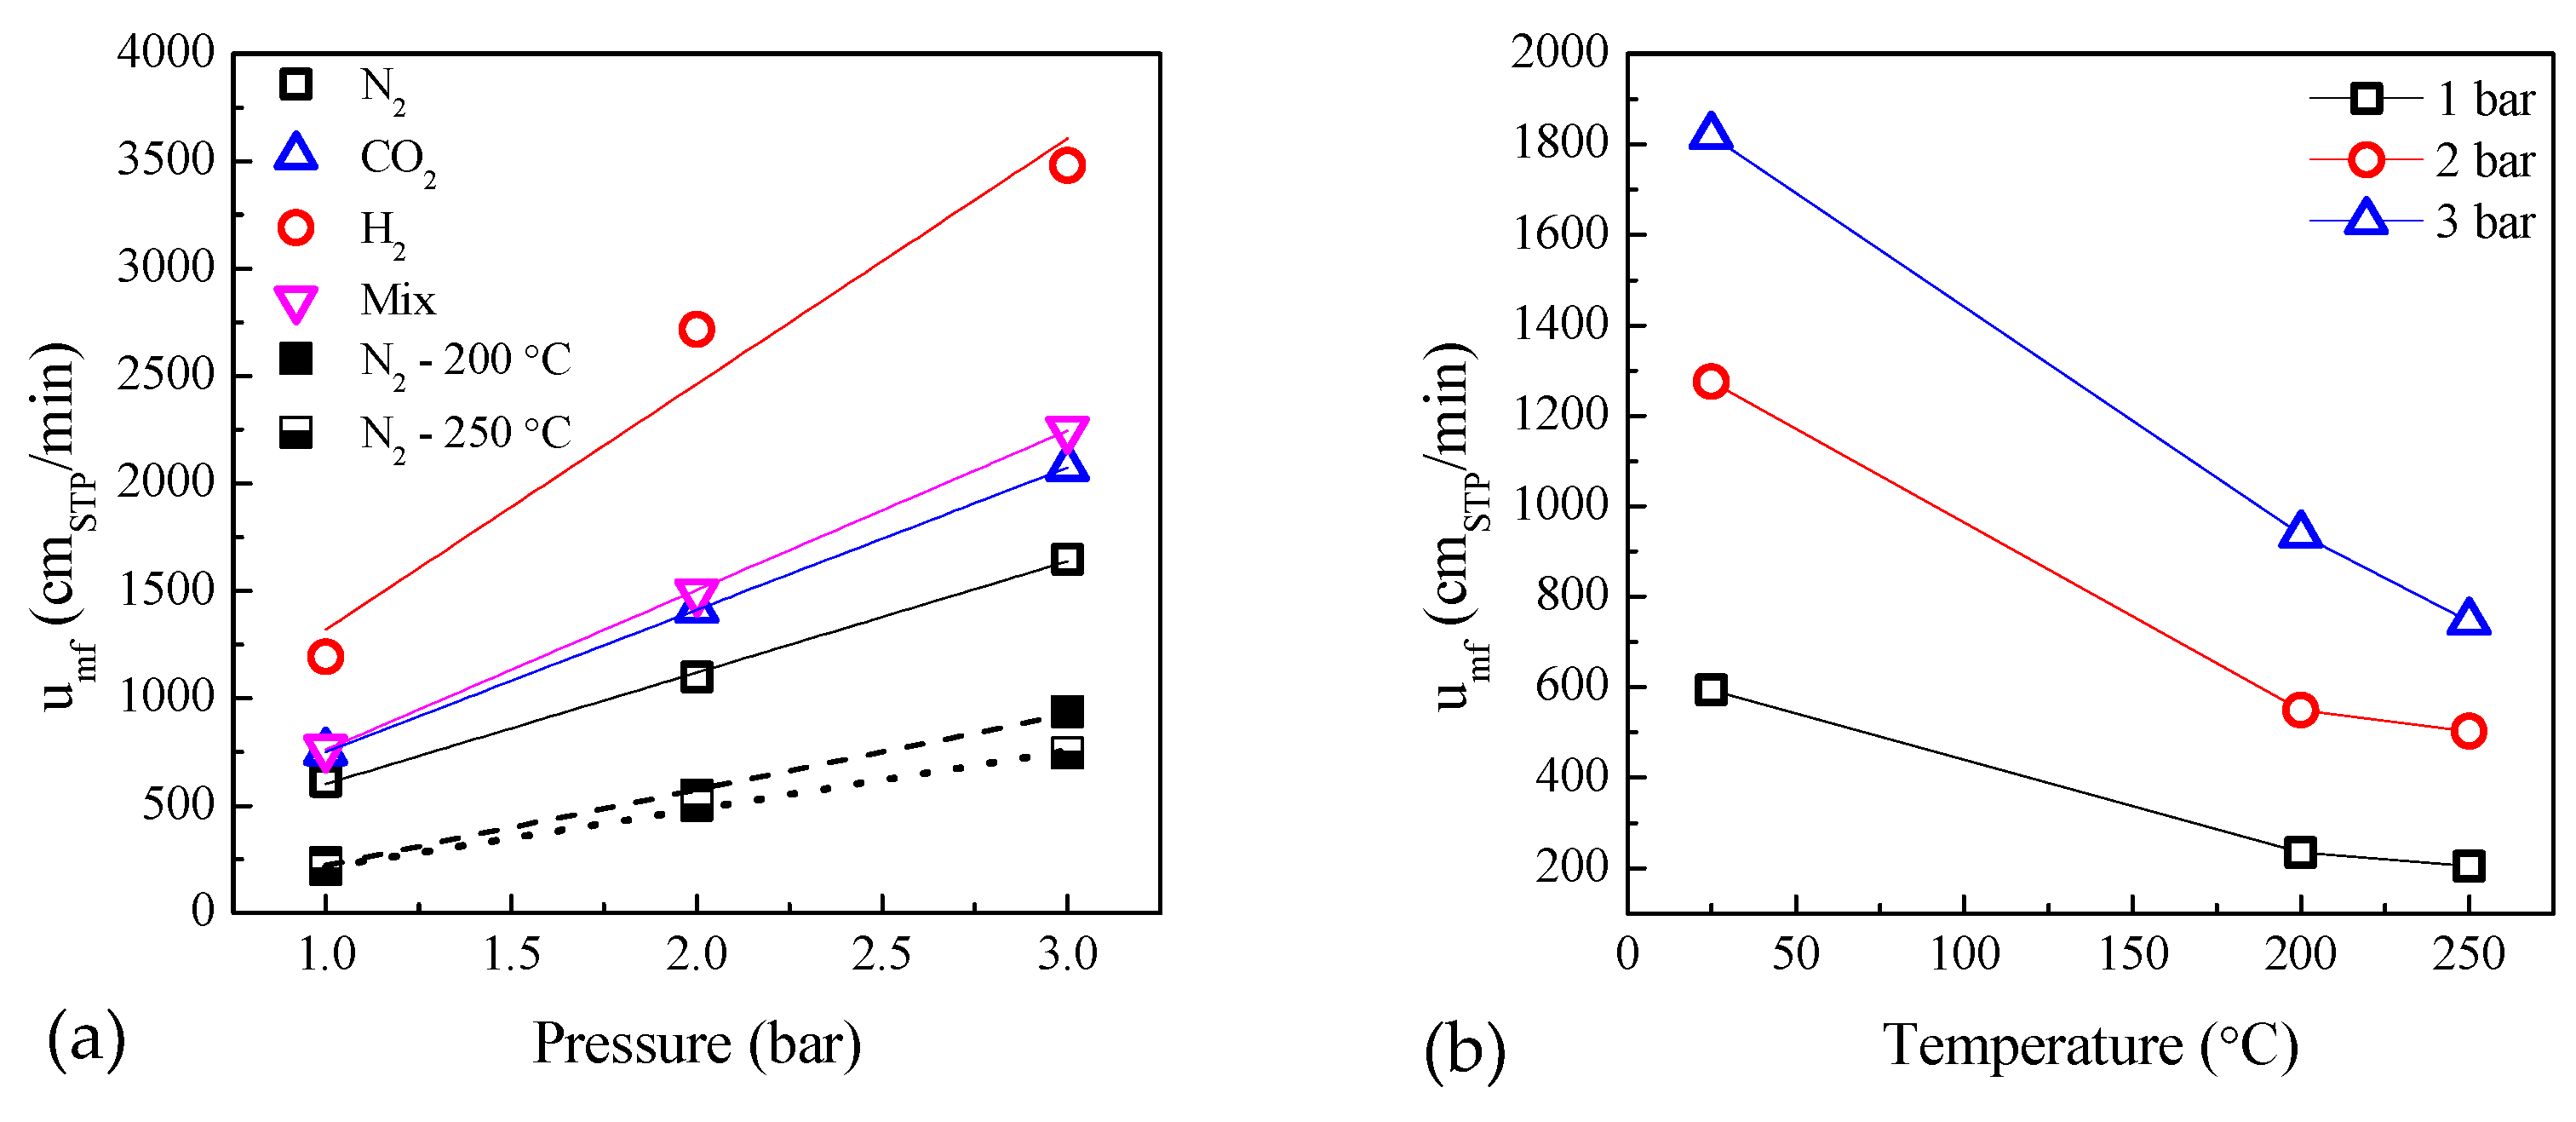
2.3. Influence of Temperature and Pressure on Fluidization

When applying higher temperature or pressure, the pressure drop curve is expected to be modified significantly, at least according to the existing literature reviewed in the Introduction. Even though it was not reported in the case of other fluidizing agents, this result should be expected for each gas.
Because of its non-reactivity, all gasses were applied to investigate the temperature and pressure effect on fluidization in the presence of zeolite. The experiments of fluidization–defluidization were performed in every condition of fluidizing gas, temperature, and pressure. The evolution of pressure drop vs. gas linear velocity for each case of temperature and pressure is given in the Appendix A, Figure A2A–L, and the numerical values of the minimum fluidization velocity obtained are reported in Table A1. It was observed that when applying higher temperature, the slope of the pressure drop curve during fluidization increased; when applying higher pressure, the slope was observed to decrease.
The dependence of umf (STP) on temperature and pressure is better shown by the obtained values. Figure 3 displays the evolution of the minimum fluidization velocity of zeolite in every condition of gas and pressure with increasing temperature. As can be observed, umf (STP) has a monotonic decreasing dependence on temperature. This result is in good agreement with the evaluations of Chirone et al. [17] for A group solids in the presence of nitrogen, while it disagrees with the experimental results of Raganati et al. [15], who reported a slight tendency of umf to increase with temperature for the same class of powders. Nonetheless, in the last case, the authors stated that the fluidization of the employed silica sand was strongly influenced by the presence of cohesive forces.
A decrease in umf (STP) with an increase in temperature was observed in the presence of N2 and CO2 also by Li et al. [24]. Their study also involved the influence of pressure, which was especially investigated at high temperatures, but the trend they reported contrasts with what was experimentally observed in this work. With an increase in pressure, indeed, an increase in the minimum fluidization velocity was observed in all cases, as reported in Figure 4. Moreover, the umf (STP) increase with pressure is well approximated with a linear trend. The incongruence with the work of Li et al. can be addressed by the remarkably different particle sizes and hence, fluidization behavior. Indeed, the authors observed a decrease in umf with pressure especially with bigger particles, for which the turbulent component of pressure drop may have an effect; thus, the increase in density may decrease umf (see Equation (5)). For smaller particles (for which laminar flow is expected), umf did not vary significantly with pressure. It is worth noting that the solids for which this behavior was observed had a size on the order of magnitude of 1 mm, while the Geldart A group solid in this study had the maximum dimension of 150 μm.
Regarding the catalyst, the effect of temperature on umf (STP) was evaluated only in the presence of nitrogen to avoid any possible reaction effect; hence, the temperature and pressure influences on fluidization in the presence of the HBP solid were obtained only with N2. On the other hand, the effect of pressure was evaluated at room temperature for all gasses. Once again, the evolution of pressure drop vs. gas linear velocity for each case of temperature and pressure is given in the Appendix A, Figure A3, and the numerical values of the minimum fluidization velocity obtained are reported in Table A2.
Figure 5a displays the effect of pressure for all gasses at ambient temperature, where not specifically indicated, and for nitrogen at 200 °C and 250 °C. Figure 5b shows the effect of temperature on the minimum fluidization velocity of the catalyst in the presence of nitrogen and at various pressures. Even though the catalyst belongs to a different class of Geldart solids (B group), the influence of temperature and pressure on changing the fluidization conditions agrees with the previously observed results obtained with zeolite: high temperatures decrease umf (STP), while high pressures increase umf (STP). The variation in temperature is once again in agreement with the work of Chirone et al. [17]. On the other hand, for both Geldart A and B group solids, our findings agree well with the literature [25,26] since umf (calculated at T, P conditions) did not vary significantly with the increase in pressure, meaning that umf (STP) varies with P′/P0.

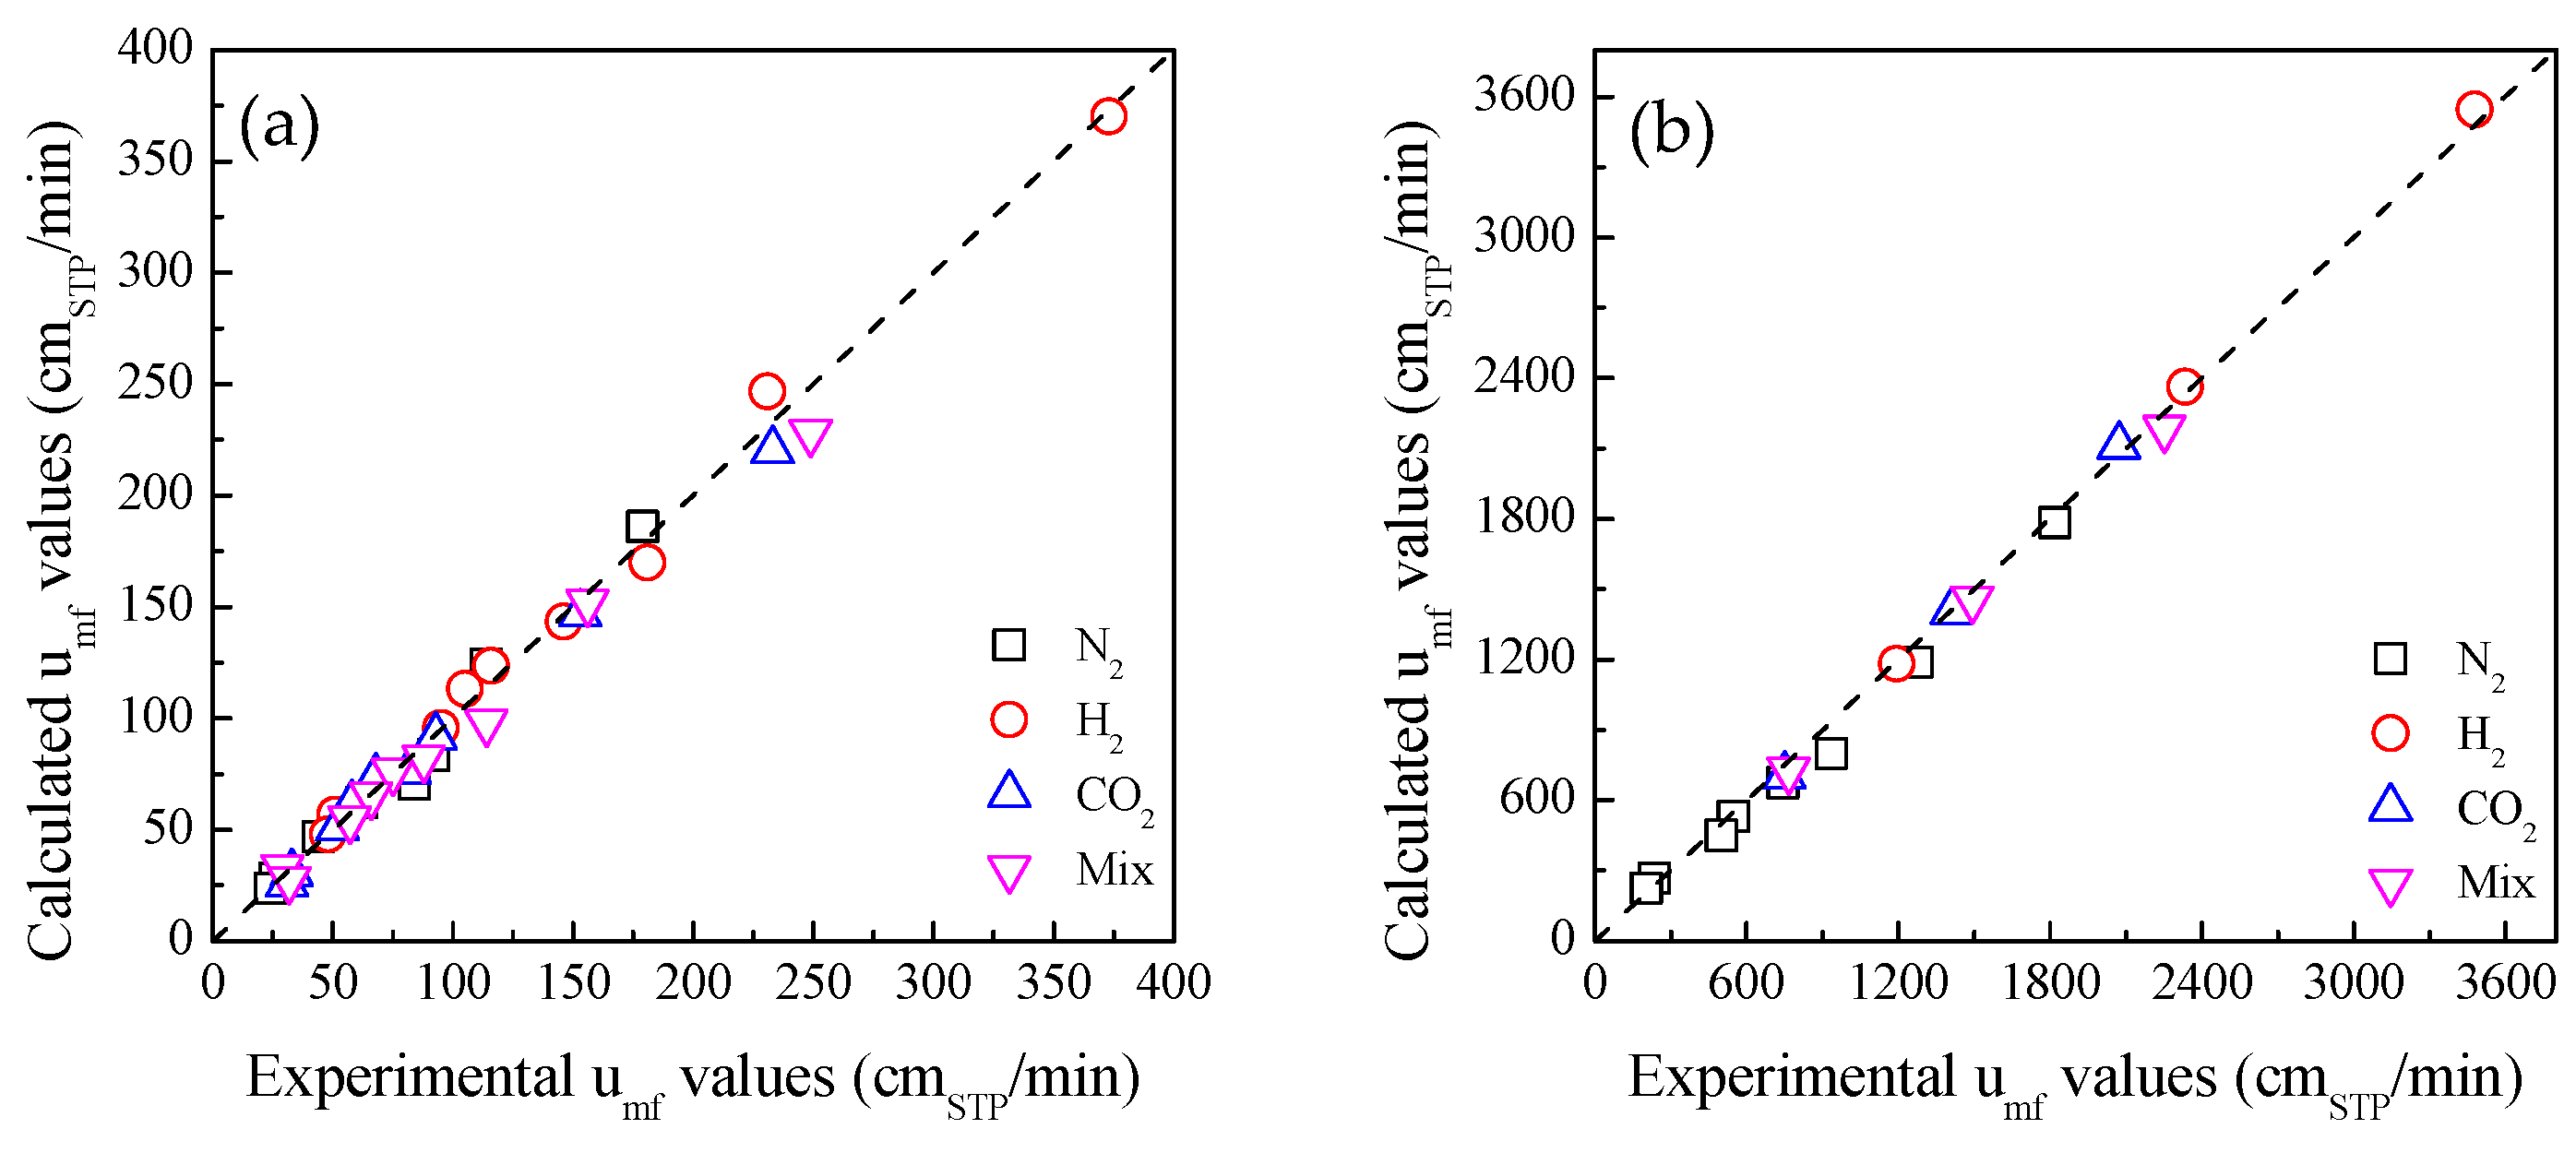
3. Discussion and Theoretical Analysis

The clear dependence of the minimum fluidization velocity—umf (STP)—on temperature and pressure adds up to the undoubted dependence on viscosity since a different value is found when changing the fluidizing gas.
The absolute viscosity in turn is also a function of temperature and pressure. The dependence of viscosity on temperature is often expressed as Equation (8), where terms containing the C and D constants can be easily neglected since ln(μ) is often linear with T. On the other hand, the dependence on pressure is mainly a density effect [27]. The Jossi–Stiel–Thodos method [28] is commonly applied and allows for estimating viscosity changes with less than 9% error with respect to experimental measurements. For non-polar gasses with 0.1 < ρr < 3.0, the correlation is given by Equation (9), where ρr is the ratio between the gas density at T and P conditions and the critical gas density (Tc and Pc conditions), as Equation (10), and the parameter ξ is expressed as Equation (11). Constants for use in Equation (8) are available in Perry’s Chemical Engineers’ Handbook [27].
Hence, it is possible to state that umf (STP) has a sort of double dependence on temperature and pressure, an explicit proportionality, and an implicit correlation given by the viscosity. The equation proposed in this work to predict the minimum fluidization velocity u′(STP)—knowing a reference minimum fluidization uRef (STP) in fixed conditions of gas, temperature, and pressure—can be expressed as Equation (12).
However, concerning the mixture, the analysis needs to be deepened. Indeed, a quite common way of considering physical properties for a mixture is to calculate the weighted average, considering the amount of each gas in the mixture. This approach is not always accurate, as we found in this case study. In addition, a wrong viscosity estimation would lead to a badly calculated umf value. A large overview of methods for calculating gas mixtures viscosity is given in [29]. The work highlights how the choice of the method became critical when the molecular weights of the constituting components are notably different. Since the mixture employed in this study consists of H2 and CO2, this is clearly a case in which the mixture viscosity cannot be approximated by the weighted average. The Wilke equation [30], through approximation based on the kinetic theory of diffusion (Equation (13)), demonstrated that it works quite well with He-N2 mixtures; therefore, it was applied in this study.
μ = AT B 1 + C / T + D / T 2
μ μ 0 mPa · s ξ + 1 1 / 4 = 1.0230 + 0.23364 ρ r + 0.58533 ρ r 2 0.40758 ρ r 3 + 0.093324 ρ r 4
ρ c = P C Z c R T c
ξ = 2173.4 T c K 1 / 16 M kg / kmol 1 / 2 P c MPa 2 / 3
u ( STP ) = u Ref ( S T P ) T T P P μ μ
μ m i x = i = 1 n μ i 1 + 1 x i   j = 1 j i j = n   x j 1 + μ i μ j 1 / 2 ×   M j M i 1 / 4 2 2 2 1 + M i M j 1 / 2
URef was chosen as the minimum fluidization velocity in the presence of nitrogen at room temperature and atmospheric pressure for each solid; hence, URef = 594 cmSTP/min and URef = 62 cmSTP/min, respectively, for the catalyst and a13X. A comparison between the experimental umf values obtained for zeolite fluidization and the ones calculated according to the above-explained equations (and reported in Table A1 and Table A2 for zeolite a13X and catalyst, respectively) is given through the parity plot in Figure 6.
As can be observed, according to these considerations it is possible to obtain a satisfactory estimation of the minimum fluidization velocity in a significantly wide range of temperature and pressure conditions for different kinds of gasses. The calculated value in the case of zeolite gave an R2 value of 0.996, while in the case of the catalyst, it was 0.998, thus highlighting the accuracy of the calculation. In addition, more value is added to this result since it was obtained for the two employed solids, which were remarkably different in physical characteristics and gave substantially diverse magnitudes for minimum fluidization velocity values.
It is worth mentioning that the equation proposed in this work is not the first attempt to predict the minimum fluidization velocity in various conditions. For example, Ergun’s equation expressed with a dimensionless number (Equations (A4) and (A5)) has been highly employed by many researchers, like Wen and Yu [31] or Grace [32], to cite some well-known models. However, our approach—based on the same physics as Wen and Yu—instead of using a set of empirical constants (lumping porosity and shape factor), proposes to measure umf under ambient conditions and to calculate umf at other pressures, temperatures and gas compositions, using that experimental value. This prediction will be more reliable, as demonstrated, since porosity and shape factor are the actual ones, and the uncertainty in the mean particle size is avoided.

Example Application

Using the equation proposed in this study, is possible to use the minimum fluidization velocities measured at ambient conditions and with nitrogen (reported in Table 2) for the catalyst and the zeolite to calculate the umf of the mixture in the reaction conditions. Considering the operating conditions of the catalyst employed in this study [33], it is possible to estimate the umf for 5 MPa and 573 K.
To determine of the umf of the solid mixture, Equation (14) for binary mixtures is applied, considering a 1:1 mass ratio between the catalyst and zeolite. The x in the formula indicates the mass fraction of the solid.
u m f , m i x = u m f , c a t u m f , a 13 X u m f , c a t x a 13 X 2
Applying Equation (14) to calculate the umf of the solid mixture catalyst/zeolite at reference conditions, i.e., room temperature, atmospheric pressure and in presence of nitrogen, a value of 337 cmSTP/min is obtained. Then, applying the proposed Equation (12), a minimum fluidization velocity in reaction conditions of approximately 6300 cmSTP/min is calculated. With this value, the experimental setup for conducting sorption-enhanced methanol synthesis can be designed. With the hypothesis of a 30 mm internal diameter reactor, to ensure a relative velocity (gas linear velocity/minimum fluidization velocity, i.e., u0/umf) of at least 1.2, a reactant flowrate of approximately 53 L/min (STP) is required. Hence, considering the gas hour space velocity of the reference work [31], which was 48,000 h−1, a catalyst mass of 70 g is required, meaning 140 g of total solids (according to the 1:1 mass ratio hypothesis) to be loaded in the reactor.
As demonstrated, the proposed equation is particularly useful in predicting the fluidization behavior in reaction conditions and, therefore, in designing the best experimental setup for the desired application.

4. Materials and Methods

4.1. Solid Preparation

As previously stated, two solids were employed in this study as follows: an In2O3/ZrO2 catalyst (a novel methanol catalyst that is acquiring a discrete interest) and a cubic faujasite type zeolite (the water adsorbent).
The catalyst formulation is 9 wt.% of In, according to Martin et al. [33]. It was synthetized using a commercial support (zirconium oxide monoclinic phase—m-ZrO2—1/8” pellets, provided by Thermoscientific) and following the incipient wetness procedure for indium deposition. The support was previously grinded and sieved to reach the desired catalyst dimension, 250–400 μm. Then, a solution of indium (III) nitrate hydrate, In(NO3)3·xH2O (Sigma Aldrich, purity 99.9%), was prepared and added dropwise to the support. Then, the impregnated catalyst was dried for 2 h at 110 °C (heating ramp 2 °C/min) and calcined at 500 °C for 3 h (heating ramp 2 °C/min). Although the impregnation procedure was observed not to impact the particle dimensions, the final catalyst was again sieved after calcination.
The 13X zeolite employed for this study was a commercial zeolite (provided by IQE—Industrias Químicas del Ebro) in a former dimension of ultra-fine powder. For this reason, to reach the desired dimension of 75–150 μm, the solid was agglomerated using a colloidal silica solution as a binder (Ludox® AS-40, 40 wt.% colloidal silica in water, provided by Sigma-Aldrich, Merck KGaA, Darmstadt, Germany) diluted 1:1 in distilled water. The amount of binder suspension employed for the agglomeration was experimentally determined as the minimum quantity sufficient to wet the powder and corresponded to 48 wt.% of the powder weight. Then, the agglomerated powder was dried overnight at 110 °C and subsequently ground and sieved to the desired size. Employing the binder in the process allowed us to not only ensure the desired size for the zeolite but also to improve its mechanical stability.
Both solids were finally subjected to an erosion procedure in order to smooth the particles and obtain an almost-spheric shape. This was achieved in a two-step optimized procedure, in which each solid was strongly fluidized for 3 h, then sieved, then again strongly fluidized for 3 h, and finally sieved again. The absence of fine particles in the final sieving also demonstrated the mechanical stability of both solids. From now on, the solids will be referred to as “catalyst” for the In2O3/ZrO2 catalyst and “a13X” for the agglomerated 13X zeolite.

4.2. Solid Characterization

XRF was performed in an ARL™ PERFORM’X Sequential X-Ray Fluorescence Spectrometer (Thermo Fisher scientific, Waltham, MA, United States) using UNIQUANT software (https://www.thermofisher.cn/order/catalog/product/IQLAAHGABUFABXMATU, accessed on 29 May 2024) for the semiquantitative elemental and oxides analysis. XRD was performed in a rotating anode X-ray diffractometer (Rigaku, model D/Max 2500, Rigaku Corporation, Akishima, Japan) with a Cu anode radiation source (40 kV and 80 mA) equipped with a graphite monochromator for the selection of Kα radiation. The analysis conditions for XRD were 2θ in the range of 10°–70°, step = 0.03°, and t = 1 s/step. The determination of the crystalline phases was performed with the aid of the database JCPDS—International Centre for Diffraction Data 2000.

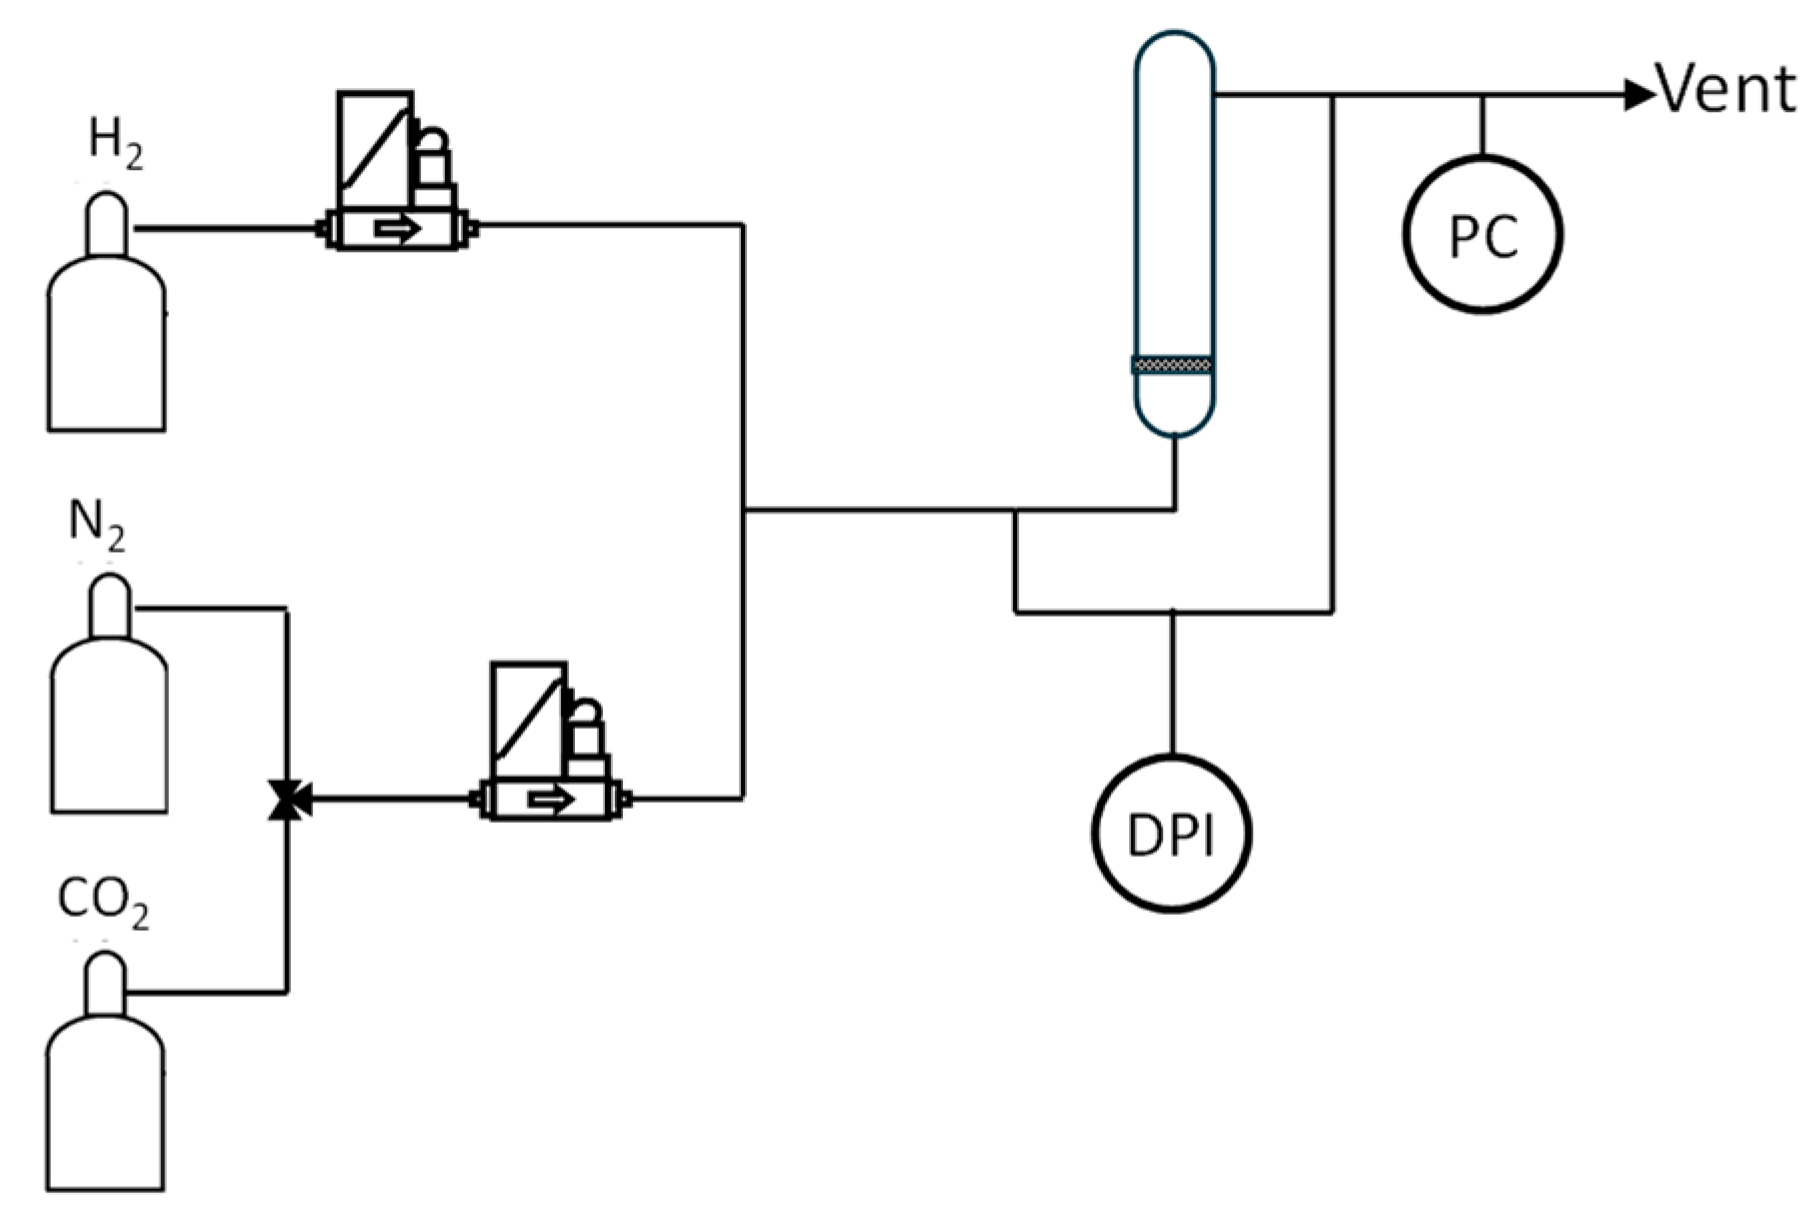
4.3. Experimental Setup

Fluidization experiments were conducted in two Pyrex reactors equipped with a sintered quartz porous plate. The use of two different reactors was dictated by the experimental evidence: the catalyst needed high linear velocities to reach fluidization hence, it was chosen to shrink the cross-sectional area. For zeolite, a 26 mm ID and 300 mm long reactor was employed; for the catalyst, a 9.4 mm ID and 300 mm long reactor was chosen. The gasses were fed with a battery of mass flow controllers. The pressure was measured in the system with a differential pressure indicator (DPI); since the pressure drop induced by the plate is included because of the configuration, it was measured in the absence of solids and subtracted for every experimental condition. A pressure controller (PC) is present downstream of the reactor for the experiments at different pressures. The scheme of the experimental setup is provided in Figure 7.

4.4. Experimental Procedure

The fluidization experiments were conducted at three different temperature (room temperature, 200 °C, and 250 °C) and pressure (atmospheric pressure, 2 bar, and 3 bar) conditions and using four different gasses (N2, CO2, H2, and a 3:1 mixture of H2:CO2). The temperatures in the range of 200–250 °C and the 3:1 H2:CO2 mixture reflect typical operating conditions of methanol synthesis. On the other hand, the pressure is far from the conventional methanol synthesis operating pressure (around 50 bar). Employing a Pyrex reactor to measure the bed height and to verify the correct fluidization of the bed (absence of bypass or slugging phenomena) clearly forced the operating pressure below a threshold value. Hence, lower values (1–3 bar) were selected to determine the dependency of umf on pressure.
The procedure for measuring the minimum fluidization velocity was the well-known method [11] of gradually increasing the gas linear velocity and measuring the pressure drop generated by the bed, which reaches a plateau value when the bed is completely expanded and fluidized. Then, the pressure drop was again measured with an expanded bed by decreasing the velocity. The slope of the linear zone of the decreasing curve provides the value for the minimum fluidization velocity. In detail, the linear zone can be approximated to a straight line with the slope given by the experimental points and intercept in zero; the intersection between the extrapolation of the straight line and the theoretical maximum pressure drop through the packed bed (i.e., its weight per unit of area) gives the value of the minimum fluidization velocity.
The design of experiments considered the reactivity of the catalyst. Indeed, high-temperature experiments in the presence of the catalyst were performed only with N2 to avoid the occurrence of reactions.

5. Conclusions

In this work, the fluidization behavior of two different solids was evaluated in the presence of various gasses and under different temperature and pressure conditions. Since the final application of this work is the process of sorption-enhanced methanol synthesis, the type of solids, as well as the operating conditions, were chosen accordingly. Therefore, a methanol-synthesis catalyst and a typical adsorbent were used as solids; N2, CO2, H2, and a 3:1 mixture of CO2-H2 were fed to the system; and increasing temperatures and pressures were applied based on the necessity of the process. For both solids, a monotonic decrease in the minimum fluidization velocity corresponded to an increase in temperature; this was observed with all gasses used as fluidizing agents. It was also observed that a linear growth in the minimum fluidization velocity corresponded to an increase in pressure, which was not previously reported. Finally, a simple equation was proposed to predict the minimum fluidization velocity at different T and P conditions than the ones measured as a reference. Furthermore, since the equation included the dependence on viscosity, it was demonstrated that with correct viscosity estimation, it is possible to predict the desired value for different gasses with high accuracy, including mixtures.
In the absence of other phenomena (e.g., slugging conditions or cohesive behavior) the proposed equation allows a good estimation of umf (STP) in different conditions, easing the researcher’s work. According to the proposed expression, it is possible to estimate experimentally the minimum fluidization velocity of a solid belonging to groups A and B with a reference gas and at ambient conditions and predict its variation faithfully using a different fluidizing medium and operating conditions.

Author Contributions

Conceptualization, M.M., J.H. and J.S.; methodology, M.M. and J.L.; validation, S.R.; formal analysis, S.R.; investigation, S.R. and J.L.; resources, M.M., J.H. and J.S.; data curation, S.R.; writing—original draft preparation, S.R.; writing—review and editing, M.M., J.H. and J.S.; visualization, S.R.; supervision, M.M., J.H. and J.S.; project administration, M.M., J.H. and J.S.; funding acquisition, M.M., J.H. and J.S. All authors have read and agreed to the published version of the manuscript.

Funding

This work is part of the project PDC2022-133066-I00, with financial support from MCIN/AEI/10.13039/501100011033 and from the European Union “NextGeneration EU”/PRTR.

Data Availability Statement

Data are contained within the article.

Acknowledgments

All authors would like to acknowledge the use of Servicio General de Apoyo a la Investigación-SAI, Universidad de Zaragoza.

Conflicts of Interest

The authors declare no conflicts of interest. The funders had no role in the design of this study; in the collection, analyses, or interpretation of data; in the writing of this manuscript; or in the decision to publish the results.

List of Symbols

εmfvoid fraction at minimum fluidization-
ΔPpressure dropPa
φparticle sphericity-
μfluid viscositymPa *s
ρpparticle densityg/cm3
ρffluid densityg/cm3
ρcfluid density at critical pointg/cm3
ρrrelative density ρfc-
dpparticle diametercm
ggravity accelerationm/s2
Hmfexpanded bed height at minimum fluidization cm
Hpackpacked bed heightcm
Mmolecular weightg/mol
Pccritical pressure-
RemfReynolds number at minimum fluidization-
TtemperatureK *
Tccritical temperature-
umfminimum fluidization velocitycm/s
Zcacentric factor at critical point-
* if not indicated otherwise
subscripts
0actual condition (u0 indicates the considered value of gas velocity)
ccritical conditions
i, jgeneric rotation index; indicates i species, j species
ffluid (of a property relative to the fluid)
mfminimum fluidization
pparticle (of a property relative to the particle)
packin packed bed conditions
rrelative property (property at defined T,P/property at critical conditions)
Refreference conditions
sstandard conditions (273 K and 100 kPa)

List of Abbreviations

DPIdifferential pressure indicator
HBPheavy-big-packed
IDinternal diameter
LSFlight-small-fluid
PCpressure controller
PSDparticle size distribution
STPstandard temperature and pressure
XRDX-ray diffraction
XRFX-ray fluorescence

Appendix A

In this appendix, complimentary information will be provided to the reader.
Equations (A1)–(A3) were employed to calculate the void fraction at minimum fluidization condition, the particle density, and the particle sphericity. They all derive from Ergun’s equation (Equation (1)) applied to the bed for gas velocities below umf, both before fluidization and after fluidization. The subscript “pack” and “mf” correspond to the fixed bed before fluidization (packed) and after fluidization, respectively. This method assumes that the porosity of the bed after fluidization is similar to that at minimum fluidization. For the calculation of sphericity, the particle diameter dp is a key variable. Five different methods were employed for its calculation; finally, the mass-average diameter was employed as dp in the equations.
Equation (A4) is Ergun’s equation (Equation (1)) adjusted in the form of dimensionless Archimedes and Reynolds numbers. By solving Equation (A4) for Re, Equation (A5) is obtained. The C1 and C2 constants were given by numerous researchers such as Wen and Yu (C1 = 33.7 and C2 = 0.0408) or Grace (C1 = 27.2 and C2 = 0.0408).
ε m f = 1 H m f H p a c k Δ P m f Δ P p a c k H m f H p a c k 3 H m f H p a c k
W = S · H m f ( 1 ε m f ) ρ P
φ = 1 ε m f d P 150 H m f Δ P μ · u 0 ε m f 3
Ar = 150 ( 1 ε mf ) ε mf 3 φ 2 Re mf + 1.75 1 ε mf 3 φ Re mf 2
R e m f = C 1 2 + C 2 A r 1 2 C 1
Zeolite dp (μm)Catalyst dp (μm)
Mass average diameter118.6330.3
Surface average diameter104.5333.9
Arithmetic mean112.5325
Weighted arithmetic mean120.8333.2
Figure A1 shows the experimental tests conducted to verify if—and eventually how—the adsorption of water onto zeolite could affect its fluidization behavior. As can be observed, there is no significative change in the pressure drop profiles.
Figure A1. Pressure drop vs. gas linear velocity in the case of the water-saturated and dry zeolite.
Catalysts 14 00432 g0a1
Table A1 and Table A2 include all the values of experimental and calculated minimum fluidization velocities obtained for this study, for zeolite and for catalyst. These values were used to calculate the coefficient of determination for the regression analysis.
Table A1. umf values (in cmSTP/min) in the presence of a13X obtained experimentally and by calculation.
Experimental Calculated
P (bar) P (bar)
T (°C)123T (°C)123
N2256211417924 124186
200265392200285683
250244484250234770
CO225681532332473147220
200335893200316192
250315282250255176
H22511623137324123247370
2005110518120057113170
25048951462504896143
Mix25751562492476152228
2002966114200336598
250325788250275582
Table A2. umf values (in cmSTP/min) in the presence of the catalyst obtained experimentally and by calculation.
Experimental Calculated
P (bar) P (bar)
T (°C)123T (°C)123
N2255941275181925 11881782
200235549937200266533799
250204502745250224449673
CO225750141220732570314062109
H22511932334347925118223633545
Mix25767149222512572814562185
Figure A2 and Figure A3 display the series of experiments performed on zeolite and on the catalyst, respectively, to obtain the value of the minimum fluidization velocity discussed in the main text.
Figure A2. Pressure drop study for the determination of umf for the zeolite (LSF solid). (A) N2, 24 °C; (B) N2, 200 °C; (C) N2, 250 °C; (D) H2, 24 °C; (E) H2, 200 °C; (F) H2, 250 °C; (G) CO2, 24 °C; (H) CO2, 200 °C; (I) CO2, 250 °C; (J) Mix, 24 °C; (K) Mix, 200 °C; and (L) Mix, 250 °C.
Catalysts 14 00432 g0a2
Figure A3. Influence of pressure upon fluidization in the presence of catalyst using either CO2, H2, or the mixture as a fluidizing agent.
Catalysts 14 00432 g0a3

References

  1. Menéndez, M.; Herguido, J.; Bérard, A.; Patience, G.S. Experimental Methods in Chemical Engineering: Reactors—Fluidized Beds. Can. J. Chem. Eng. 2019, 97, 2383–2394. [Google Scholar] [CrossRef]
  2. Acosta-López, J.G.; de Lasa, H. Artificial Intelligence for Hybrid Modeling in Fluid Catalytic Cracking (FCC). Processes 2024, 12, 61. [Google Scholar] [CrossRef]
  3. Bin Sulayman, A.; Torres Brauer, N.; de Lasa, H. A Fluidizable Catalyst for N-Butane Oxidative Dehydrogenation under Oxygen-Free Reaction Conditions. Catalysts 2023, 13, 1462. [Google Scholar] [CrossRef]
  4. Rojas Chaves, F.; Torres Brauer, N.; Torres, C.; de Lasa, H. Conversion of Biomass-Derived Tars in a Fluidized Catalytic Post-Gasification Process. Catalysts 2024, 14, 202. [Google Scholar] [CrossRef]
  5. Kaushal, P.; Abedi, J. A Simplified Model for Biomass Pyrolysis in a Fluidized Bed Reactor. J. Ind. Eng. Chem. 2010, 16, 748–755. [Google Scholar] [CrossRef]
  6. Pang, L.; Shao, Y.; Zhong, W.; Liu, H. Experimental Investigation on the Coal Combustion in a Pressurized Fluidized Bed. Energy 2018, 165, 1119–1128. [Google Scholar] [CrossRef]
  7. Basu, P. Combustion of Coal in Circulating Fluidized-Bed Boilers: A Review. Chem. Eng. Sci. 1999, 54, 5547–5557. [Google Scholar] [CrossRef]
  8. Rüdisüli, M.; Schildhauer, T.J.; Biollaz, S.M.A.; Van Ommen, J.R. Scale-up of Bubbling Fluidized Bed Reactors—A Review. Powder Technol. 2012, 217, 21–38. [Google Scholar] [CrossRef]
  9. Kim, S.D.; Kangt, Y. Heat and Mass Transfer in Three-Phase Fluidized-Bed Reactors-an Overview. Chem. Eng. Sci. 1997, 52, 3639–3660. [Google Scholar] [CrossRef]
  10. Khadilkar, A.; Rozelle, P.L.; Pisupati, S.V. Models of Agglomerate Growth in Fluidized Bed Reactors: Critical Review, Status and Applications. Powder Technol. 2014, 264, 216–228. [Google Scholar] [CrossRef]
  11. Kunii, D.; Levenspiel, O. Fluidization Engineering, 2nd ed.; Butterworth-Heinemann: Stoneham, MA, USA, 1991; ISBN 0409902330. [Google Scholar]
  12. Wu, S.Y.; Baeyens, J. Effect of Operating Temperature on Minimum Fluidization Velocity. Powder Technol. 1991, 67, 217–220. [Google Scholar] [CrossRef]
  13. Bi, H.T.; Grace, J.R. Effects of Pressure and Temperature on Flow Regimes in Gas-Solid Fluidization Systems. Can. J. Chem. Eng. 1996, 74, 1025–1027. [Google Scholar] [CrossRef]
  14. Liu, Z.; Kawaguchi, T.; Tanaka, T.; Tsuji, Y. The Effect of Temperature on the Minimum Fluidization Velocity Calculated by Distinct Element Method. JSME Int. J. 2002, 45, 66–71. [Google Scholar] [CrossRef]
  15. Raganati, F.; Chirone, R.; Ammendola, P. Effect of Temperature on Fluidization of Geldart’s Group A and C Powders: Role of Interparticle Forces. Ind. Eng. Chem. Res. 2017, 56, 12811–12821. [Google Scholar] [CrossRef]
  16. Gosavi, S.; Kulkarni, N.; Mathpati, C.S.; Mandal, D. CFD Modeling to Determine the Minimum Fluidization Velocity of Particles in Gas-Solid Fluidized Bed at Different Temperatures. Powder Technol. 2018, 327, 109–119. [Google Scholar] [CrossRef]
  17. Chirone, R.; Poletto, M.; Barletta, D.; Lettieri, P. The Effect of Temperature on the Minimum Fluidization Conditions of Industrial Cohesive Particles. Powder Technol. 2020, 362, 307–322. [Google Scholar] [CrossRef]
  18. Gorbe, J.; Lasobras, J.; Francés, E.; Herguido, J.; Menéndez, M.; Kumakiri, I.; Kita, H. Preliminary Study on the Feasibility of Using a Zeolite A Membrane in a Membrane Reactor for Methanol Production. Sep. Purif. Technol. 2018, 200, 164–168. [Google Scholar] [CrossRef]
  19. Raso, R.; Tovar, M.; Lasobras, J.; Herguido, J.; Kumakiri, I.; Araki, S.; Menéndez, M. Zeolite Membranes: Comparison in the Separation of H2O/H2/CO2 Mixtures and Test of a Reactor for CO2 Hydrogenation to Methanol. Catal. Today 2021, 364, 270–275. [Google Scholar] [CrossRef]
  20. Menéndez, M.; Herguido, J.; Soler, J.; Lasobras, J. Reactor System for Sorption-Enhanced Catalytic Reactions with Continuous Regeneration of Sorbent and Related Methods. Patent Application EP23382685.8, 2023. [Google Scholar]
  21. Trifan, B.; Lasobras, J.; Soler, J.; Herguido, J.; Menéndez, M. Modifications in the Composition of CuO/ZnO/Al2O3 Catalyst for the Synthesis of Methanol by CO2 Hydrogenation. Catalysts 2021, 11, 774. [Google Scholar] [CrossRef]
  22. Mohamed, S.H. Transparent Conductive Gallium-Doped Indium Oxide Nanowires for Optoelectronic Applications. J. Korean Phys. Soc. 2013, 62, 902–905. [Google Scholar] [CrossRef]
  23. Ergun, S.; Orning, A.A. Fluid Flow through Randomly Packed Columns and Fluidized Beds. Ind. Eng. Chem. 1949, 41, 1179. [Google Scholar] [CrossRef]
  24. Li, L.; Duan, Y.; Duan, L.; Xu, C.; Anthony, E.J. Flow Characteristics in Pressurized Oxy-Fuel Fluidized Bed under Hot Condition. Int. J. Multiph. Flow 2018, 108, 1–10. [Google Scholar] [CrossRef]
  25. Sidorenko, I.; Rhodes, M.J. Influence of Pressure on Fluidization Properties. Powder Technol. 2004, 141, 137–154. [Google Scholar] [CrossRef]
  26. Shao, Y.; Li, Z.; Zhong, W.; Bian, Z.; Yu, A. Minimum Fluidization Velocity of Particles with Different Size Distributions at Elevated Pressures and Temperatures. Chem. Eng. Sci. 2020, 216, 115555. [Google Scholar] [CrossRef]
  27. Green, D.W.; Perry, R.H. Perry’s Chemical Engineers’ Handbook, 8th ed.; McGraw-Hill: New York, NY, USA, 2007. [Google Scholar]
  28. Jossi, J.A.; Stiel, L.I.; Thodos, G. The Viscosity of Pure Substances in the Dense Gaseous and Liquid Phases. AIChE J. 1962, 8, 59. [Google Scholar] [CrossRef]
  29. Davidson, T.A. A Simple and Accurate Method for Calculating Viscosity of Gaseous Mixtures; United States Department of the Interior, Bureau of Mines: Washington, DC, USA, 1993. [Google Scholar]
  30. Wilke, C.R. A Viscosity Equation for Gas Mixtures. J. Chem. Phys. 1950, 18, 517–519. [Google Scholar] [CrossRef]
  31. Johnson, C.A.; Solomon, E.; Rubin, L.C.; Gerster, J.A.; Colburn, A.P.; Wohl, K.; Wang, Y.; Eng, Z.; Wen, C.Y.; Yu, Y.H. A Generalized Method for Predicting the Minimum Fluidization Velocity. Wohl K. Trans. Am. Inst. Chem. Eng. 1953, 47, 271–272. [Google Scholar]
  32. Grace, J.R. Modelling and Simulation of Two-Phase Fluidized Bed Reactors. In Chemical Reactor Design and Technology; Springer: Dordrecht, The Netherlands, 1986; p. 245. [Google Scholar]
  33. Martin, O.; Martín, A.J.; Mondelli, C.; Mitchell, S.; Segawa, T.F.; Hauert, R.; Drouilly, C.; Curulla-Ferré, D.; Pérez-Ramírez, J. Indium Oxide as a Superior Catalyst for Methanol Synthesis by CO2 Hydrogenation. Angew. Chem. 2016, 128, 6369–6373. [Google Scholar] [CrossRef]
Figure 1. XRD analysis of (a) the prepared catalyst and its support and (b) the a13X zeolite.
Catalysts 14 00432 g001
Figure 2. Pressure drop variation as a function of gas linear velocity in defluidization. Room T and atmospheric P with various fluidizing gasses. Solids: (a) zeolite a13X—LSF particles and (b) catalyst—HBP particles. The horizontal line indicates the maximum pressure drop.
Catalysts 14 00432 g002
Figure 3. Evolution of minimum fluidization velocity with an increase in temperature. Solid: a13X; fluidizing agent: either N2, CO2, H2, or mixture; absolute pressure: (a) 1 bar, (b) 2 bar, and (c) 3 bar.
Catalysts 14 00432 g003
Figure 4. Evolution of minimum fluidization velocity with an increase in pressure. Solid: a13X; temperature: either 25, 200, or 25 °C; fluidizing agent: (a) N2, (b) CO2, (c) H2, or (d) mixture.
Catalysts 14 00432 g004
Figure 5. Evolution of minimum fluidization velocity in presence of the catalyst with an increase in (a) pressure and (b) temperature.
Catalysts 14 00432 g005
Figure 6. Parity plot of calculated vs. experimental umf values in every condition. Solids: (a) zeolite a13X—LSF particles and (b) catalyst—HBP particles.
Catalysts 14 00432 g006
Figure 7. Scheme of the experimental setup.
Catalysts 14 00432 g007
Table 1. Composition of 13X and agglomerated 13X obtained via XRF analysis.
13Xa13X
SiO249.9160.92
Al2O331.4226.25
Na2O16.9713.94
Si/Al ratio1.402.05
Added Si (g/100 g) 8.98
Added SiO2 (g/100 g) 19.2
Table 2. Minimum fluidization velocity at ambient T and P and in the presence of all gasses, fluidization parameters, and physical parameters of both solids.
umf (cmSTP/min)εmf *φp *ρapp a
(g/cm3)
ρp *
(g/cm3)
N2H2CO2Mix
Cat.59411487507670.320.991.051.41
a13X6211668750.560.870.530.96
* Calculated from Equations (A1)–(A3). a Experimentally determined as the ratio between 1 g of solid and its volume in packed conditions. Hence, it also accounts for the void fraction in packed conditions.
Disclaimer/Publisher’s Note: The statements, opinions and data contained in all publications are solely those of the individual author(s) and contributor(s) and not of MDPI and/or the editor(s). MDPI and/or the editor(s) disclaim responsibility for any injury to people or property resulting from any ideas, methods, instructions or products referred to in the content.

