Article

Enhancement Study of the Photoactivity of TiO2 Photocatalysts during the Increase of the WO3 Ratio in the Presence of Ag Metal

1
Department of Physics, Faculty of Science, King Khalid University, Abha 61413, Saudi Arabia
2
Nanostructured Materials and Nanotechnology Department, Advanced Materials Institute, Central Metallurgical R&D Institute (CMRDI), P.O. Box 87 Helwan, Cairo 11421, Egypt
*
Authors to whom correspondence should be addressed.
Catalysts 2024, 14(9), 633; https://doi.org/10.3390/catal14090633
Submission received: 22 July 2024 / Revised: 9 September 2024 / Accepted: 11 September 2024 / Published: 18 September 2024
(This article belongs to the Special Issue Cutting-Edge Photocatalysis)

Abstract

:
Nanocomposites (NCs) consisting of 4%Ag/x%WO3/TiO2, with varied concentrations (x = 1, 3, 5, 7 wt.%) of WO3, were successfully synthesized using the sol-gel process to examine their photocatalytic performance. The synthesized 4%Ag/x%WO3/TiO2 nanopowder was characterized using X-ray diffraction (XRD), Raman spectroscopy, scanning electron microscopy (SEM), transmission electron microscopy (TEM), UV–vis diffuse reflectance spectra (UV–vis DRS), photoluminescence (PL), and Brunauer–Emmett–Teller (BET) surface area analysis to elucidate its physicochemical properties. The photocatalytic evaluation revealed that the Ag/1%WO3/TiO2 nanocomposite exhibits 98% photoreduction efficiency for Cr(VI) after 2 h under visible light due to the impact of the plasmonic effect of Ag atoms. In addition, the Ag/4%WO3/TiO2 shows about 95% photooxidation efficiency for methylene blue (MB) dye after 4 h.

1. Introduction

Titanium dioxide (TiO2) is renowned as a highly promising photocatalyst due to its advantages, such as its photostability, low cost, and non-toxicity [1,2]. However, its photocatalytic activity is limited to ultraviolet (UV) light due to its wide bandgap (3.20 eV), which constitutes only 3–5% of the total solar irradiance [3]. To address this, researchers have explored modifications like metal doping composites with other materials to shift its optical response into the visible range [4]. One effective approach involves doping TiO2 with metals (e.g., Ag, Au, and Cr) and rare earth metals (Eu, Ce etc.) [5,6], or nonmetal atoms (e.g., N, S, and F). These modifications can trap electrons, enhance charge separation, and decrease the bandgap, potentially leading to new sunlight-driven photocatalysts [7,8,9,10]. Additionally, coupling TiO2 with other semiconductors (such as SnO2, and WO3) can extend the photoexcitation energy range that improves pollutant photodegradation [11]. Fundamentally, WO3 possesses a conduction band potential of +0.77 eV [12], enabling a new band position that efficiently receives photogenerated electrons from the conduction band of TiO2. Therefore, introducing tungsten doping into TiO2 matrices has resulted in higher electrical conductivity [13]. The exploration of TiO2/WO3 composites has emerged as a prominent area of research, driven by their promising properties and diverse functionalities. For instance, TiO2-supported WO3 has demonstrated remarkable efficacy as a heterogeneous catalyst for redox reactions [14]. Additionally, synthesizing highly ordered cubic mesoporous WO3/TiO2 thin films has enhanced photocatalytic activity compared to pure TiO2 films [15]. Furthermore, studies by Reyes-Gil et al. (2013) and Reyes-Gil et al. (2015) highlighted the enhanced ion storage capacity and electrochromic activity of WO3/TiO2 nanostructures, underscoring the significance of composite materials in advanced applications [16,17]. Archana et al. (2014) also investigated the photocatalytic and electrical properties of WO3-doped TiO2 nanowires, revealing promising results for high-efficiency dye-sensitized solar cells [13]. These recent literature reviews provide valuable insights into the multifaceted properties of nanocomposites, offering a comprehensive understanding of their structural, optical, electrical, dielectric, and photocatalytic characteristics and paving the way for further advancements in diverse technological applications. Despite these advancements, challenges persist, particularly in supercapacitors and photocatalysis utilizing TiO2-based materials. [18,19]. Additionally, TiO2-based photocatalysts often suffer from relatively low photocatalytic efficiency and limited light absorption in the visible region [20], which restricts their practical applications. To address these challenges, incorporating Ag nanoparticles and WO3 into TiO2-based materials may offer promising solutions. Ag nanoparticles possess excellent electrical conductivity, which can enhance the charge transport within TiO2 matrices. Li et al. prepared Ag/WO3/TiO2 nanowires via the hydrothermal technique [21]. They reported that the as-prepared composite photocatalysts showed greatly improved absorbance even in the infrared regime and dramatically improved photocatalytic activities toward methyl orange degradation in comparison to those of pure TiO2 nanowires. In addition, the as-prepared Ag/WO3/TiO2 composite exhibited excellent recyclability for pollutant degradation. It is suggested that, with the synergetic help of WO3 and Ag nanoparticles, more photogenerated electrons and hole pairs can be produced, participate in the photodegradation reaction, and enhance the photocatalytic activity dramatically [22]. Xu et al. used an aqueous sol-gel route for the preparation of nanostructured Ag-WO3/TiO2 [23]. Ag-WO3/TiO2 nanoparticles with a mixed phase (anatase/rutile) showed more excellent photocatalytic activity on the removal of MB than single-doped TiO2, owing to their small particle size distribution, larger surface area, and higher absorbance of visible light [23]. Ag@TiO2/WO3 was synthesized using the sol-gel method and its photocatalytic activity was enhanced compared to its counterparts [24]. The rate of degradation of methylene blue (MB) using Ag@TiO2/WO3 was ~20 and ~25 times higher in contrast with pure TiO2 and Degussa P25, respectively. This increase in the photocatalytic performance was because of the enhancement of light harvesting, a large amount of charge carrier injection due to the surface plasmon resonance effect exhibited by Ag nanoparticles under the irradiation of visible light, and a lower recombination rate due to the ease of charge carrier transfer through the junction between the two metal oxides [24]. Similarly, the addition of WO3 to TiO2 matrices can significantly enhance photocatalytic performance. WO3 possesses a favorable electronic band structure and a high surface area, facilitating the charge transfer processes [25]. In photocatalysis, WO3 acts as a co-catalyst, promoting the separation of photoinduced charge carriers and enhancing photocatalytic activity, particularly in the visible light region [26]. In this paper, we aim to see the impact of the variation of the %WO3 weight ratio with 4% Ag doping on structural, optical, and photocatalytic properties of TiO2 NPs. The pure and doped TiO2 NPs were prepared using the facile sol-gel method and studied from the application point of view. The obtained results are discussed in different sections of the article. The composite revealed that the photoactivity was enhanced, which was clear from the photoreduction of Cr(VI) ions and photodegradation of MB dye.

2. Result and Discussion

The X-ray diffraction (XRD) technique confirmed the phase structure of the prepared nanocomposite samples. XRD patterns for pure TiO2 and 4% Ag/x%WO3/TiO2 (x = 1, 3, 5, and 7%) nanocomposites are represented in Figure 1a. They revealed that all samples are related to the classic anatase structure of TiO2, showing patterns at 2θ = 25.6°, 37.8°, 48.18°, 54.1°, 55.2°, 62.8°, 69°, and 70.5°, which are related to the (101), (004), (200), (105), (211), (204), (116), and (220) planes, respectively, and are matched to the stander card of TiO2 [JCPDS#21-1272] [27,28]. The face-centered cubic metallic Ag crystal structure is associated with the diffraction peaks (200) and (220) at 44.48° and 64.68° (JCPDS# 87-0597), respectively. Incorporating various weight percentages of 1, 3, 5, and 7 wt.% of WO3 onto 4% Ag/TiO2 leads to the appearance of the diffraction peaks of WO3 for 5% and 7% between 2θ = 23.5° and 25° for the (002), (020), and (200) planes. The slight shift in the characteristic peaks of TiO2 at 2θ = 25.4°, shown in Figure 1b, could be attributed to the shrinking of the crystallite size due to the replacement of the Ti atom by the W atom. The W6+ ion can easily replace the Ti4+ ion in the TiO2 lattice because the radius of W6+ is 62 pm smaller than Ti4+ ions, which equals to 68 pm [29]. It is important to investigate the microstructural parameters of any material synthesized at the nanoscale and to see the impact of doping on such parameters. Hence, herein we have investigated the impact of doping on the crystallinity of TiO2, and we have estimated the crystallite size (D) values of the prepared nanocomposites for the most intense peak (101) using the Scherrer equation:
D = k λ β c o s θ
where β denotes the full width at half maximum (FWHM), k is the shape factor with a value of 0.9, and λ represents the wavelength of the XRD source. The calculated D values of the prepared pure WO3, pure TiO2 NPs, and 4% Ag/x%WO3/TiO2 (with x = 1, 3, 5, and 7 wt.% of WO3) nanocomposites are presented in Table 1. The crystallite size values decrease systematically when the WO3 dopant ratio increase in TiO2. Also, the other parameters of the structure, such as the dislocation density (δ) and the microstrain ( ε ) , were calculated using FWHM for the most intense peak (101) and its angular position for the prepared samples by [30,31]:
δ = 1 D 2
ε = β 4 t a n θ
The estimated values of δ and ε are also presented in Table 1. The given values of δ after doping WO3/TiO2 with 4%Ag samples increase as the D values decrease. The δ values increase when increasing the WO3 content, whereas the ε values vary between 11.2 × 10⁻³ and 7.55 × 10⁻³. These microstructural parameters indicate the impact of doping.
To confirm the changes in the prepared samples, Raman spectra for pure TiO2 and 4% Ag/x%WO3/TiO2 (with x = 1, 3, 5, and 7 wt.% of WO3) nanocomposites were recorded and are displayed in Figure 2.
The Raman spectra confirm the data extracted from the XRD graph that prove the anatase phase structure of pure TiO2 and 4% Ag/x%WO3-doped TiO2 nanocomposites. The tetragonal anatase titania exhibits typical vibration modes, with the most active modes at 143, 196, and 637 cm−1 corresponding to the Eg (symmetric stretching vibration) band, 395 cm−1 related to the A1g (symmetric bending vibration) band, and 513 that corresponds to B1g (antisymmetric bending vibration) modes [32]. Moreover, there is a slight redshift to the lower wavenumber for the peak at 141 cm−1 with an increase in the WO3 weight ratio due to the insertion of a small radius of W6+ that equals 62 pm into the TiO2 molecule that has a radius of Ti4+ ions equal 68 pm according to the number of the available vacancies, causing shrinking of the unit cell [32,33,34].
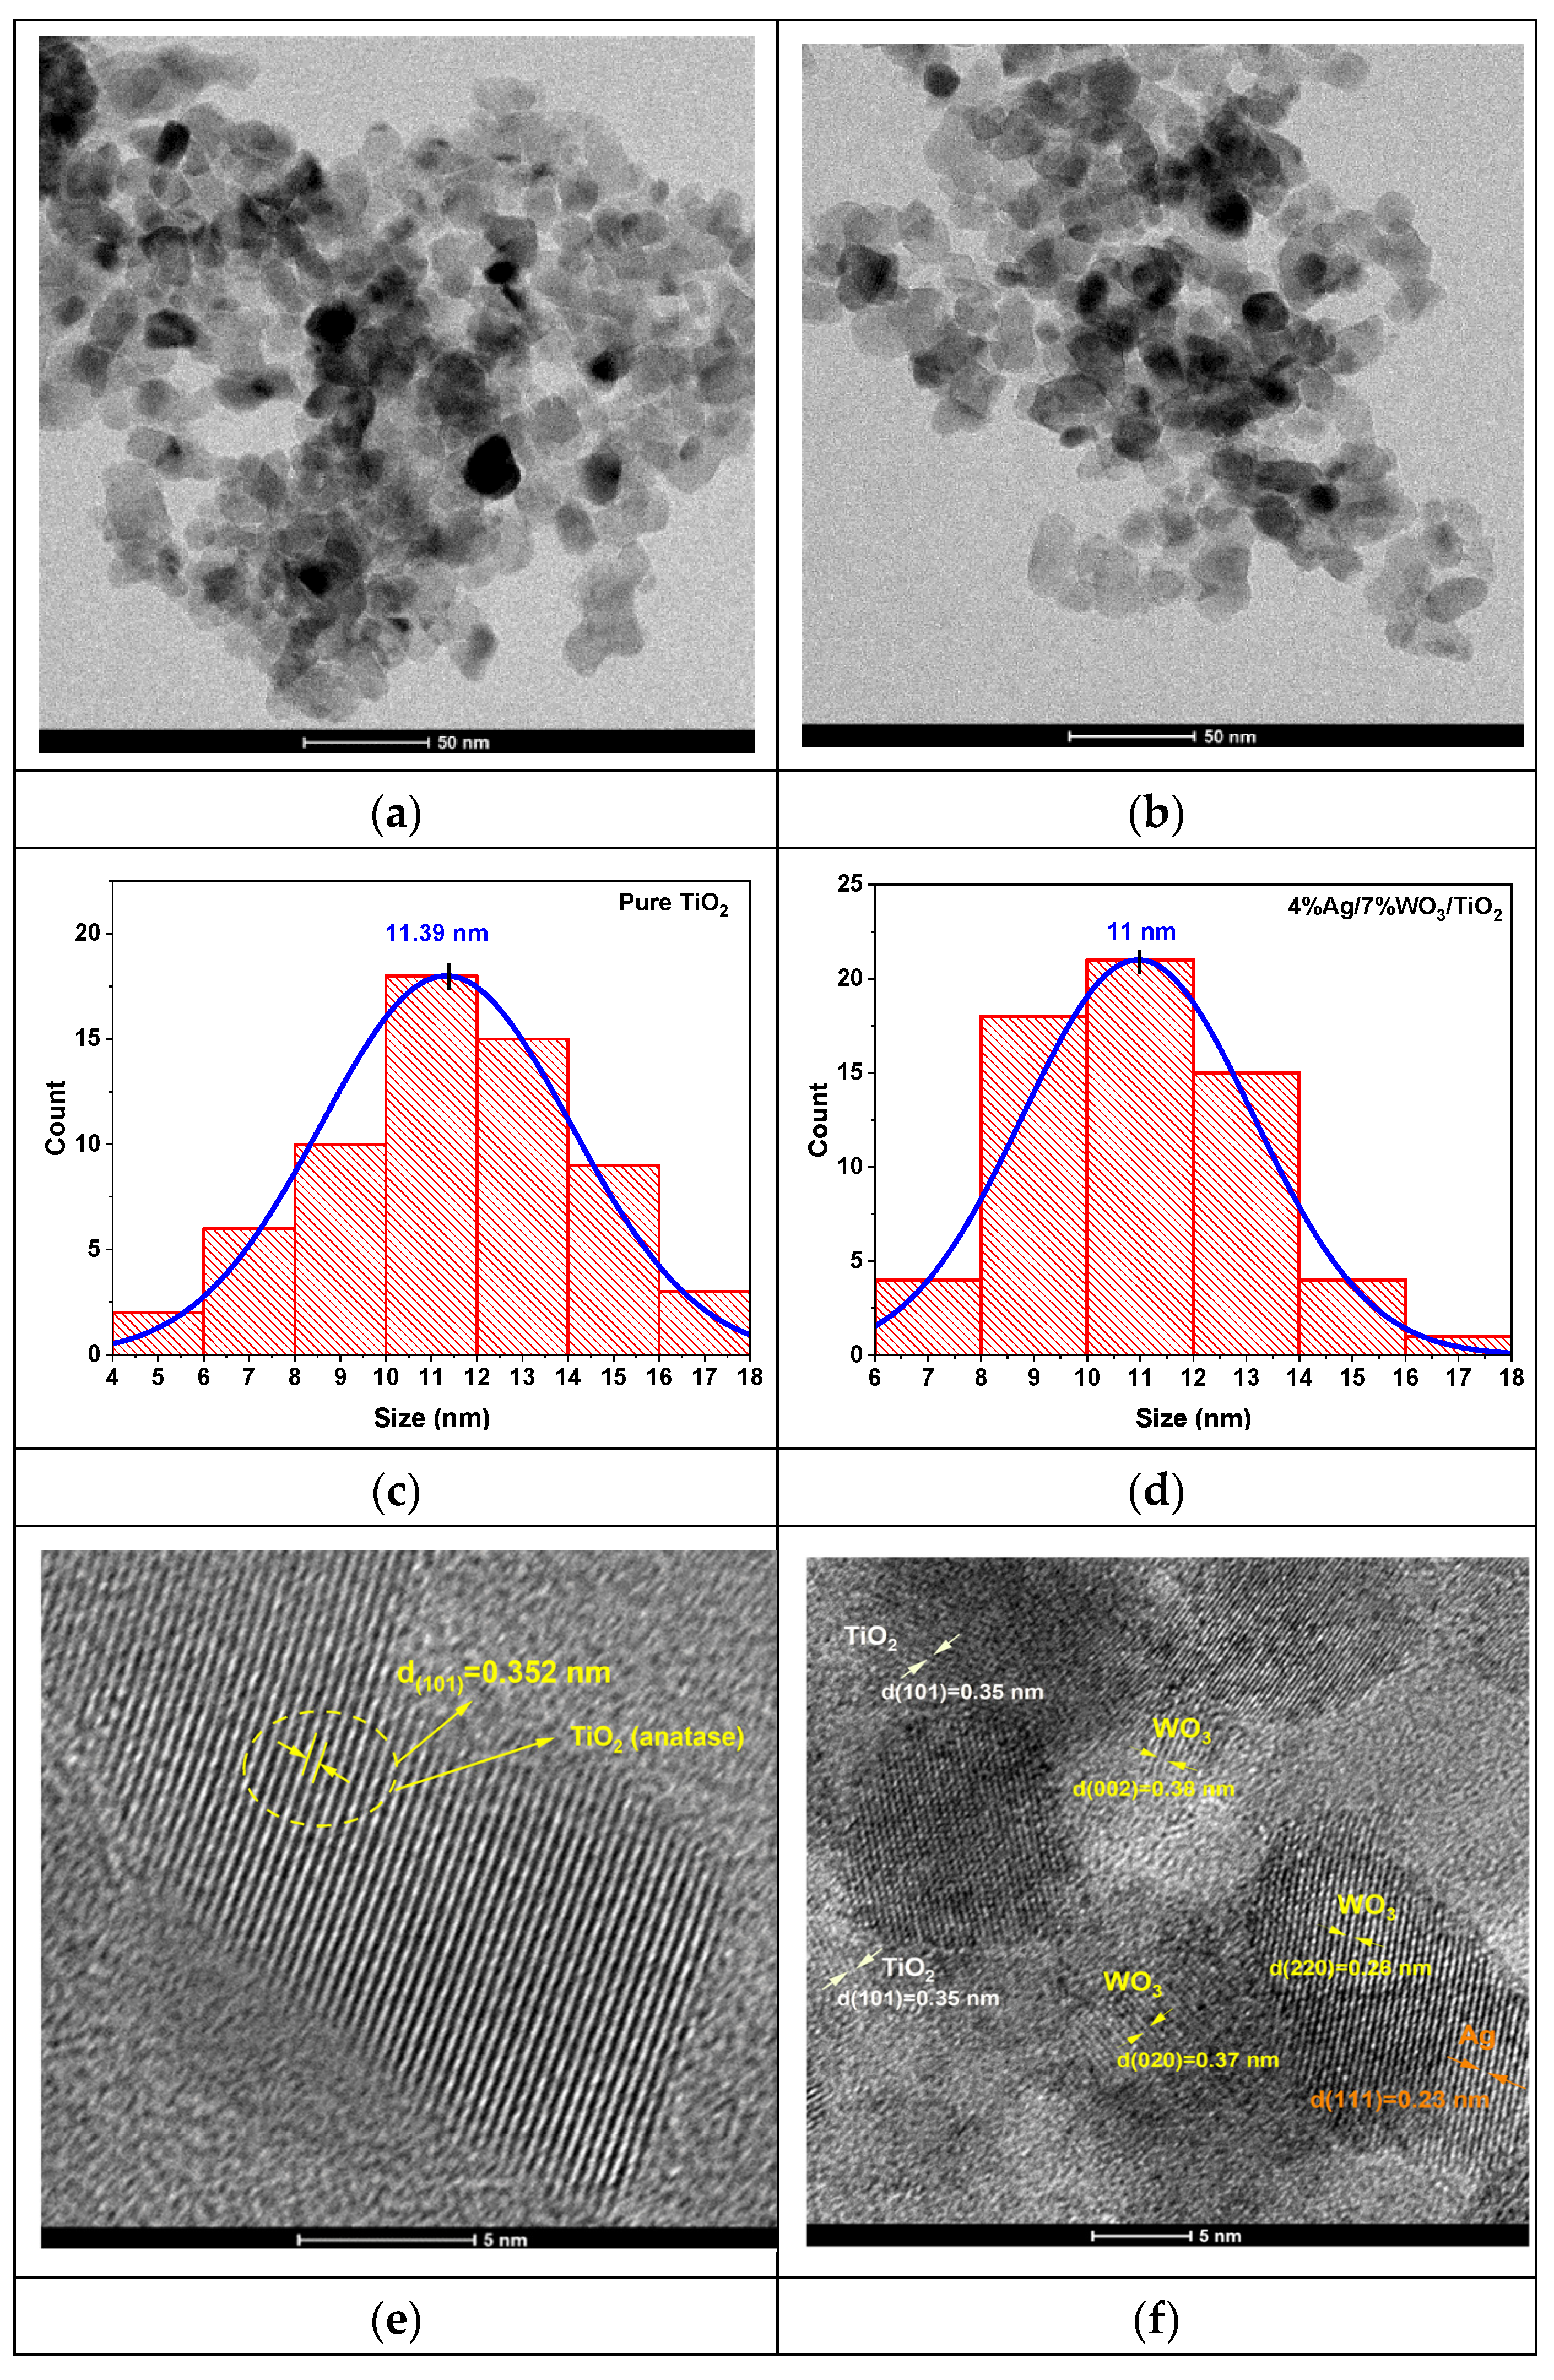
High-resolution transmission electron microscopy (HRTEM) images were recorded to clarify the structural attributes of pure TiO2 and 4%Ag/x%WO3/TiO2 and nanocomposites (NCs), as shown in Figure 3.
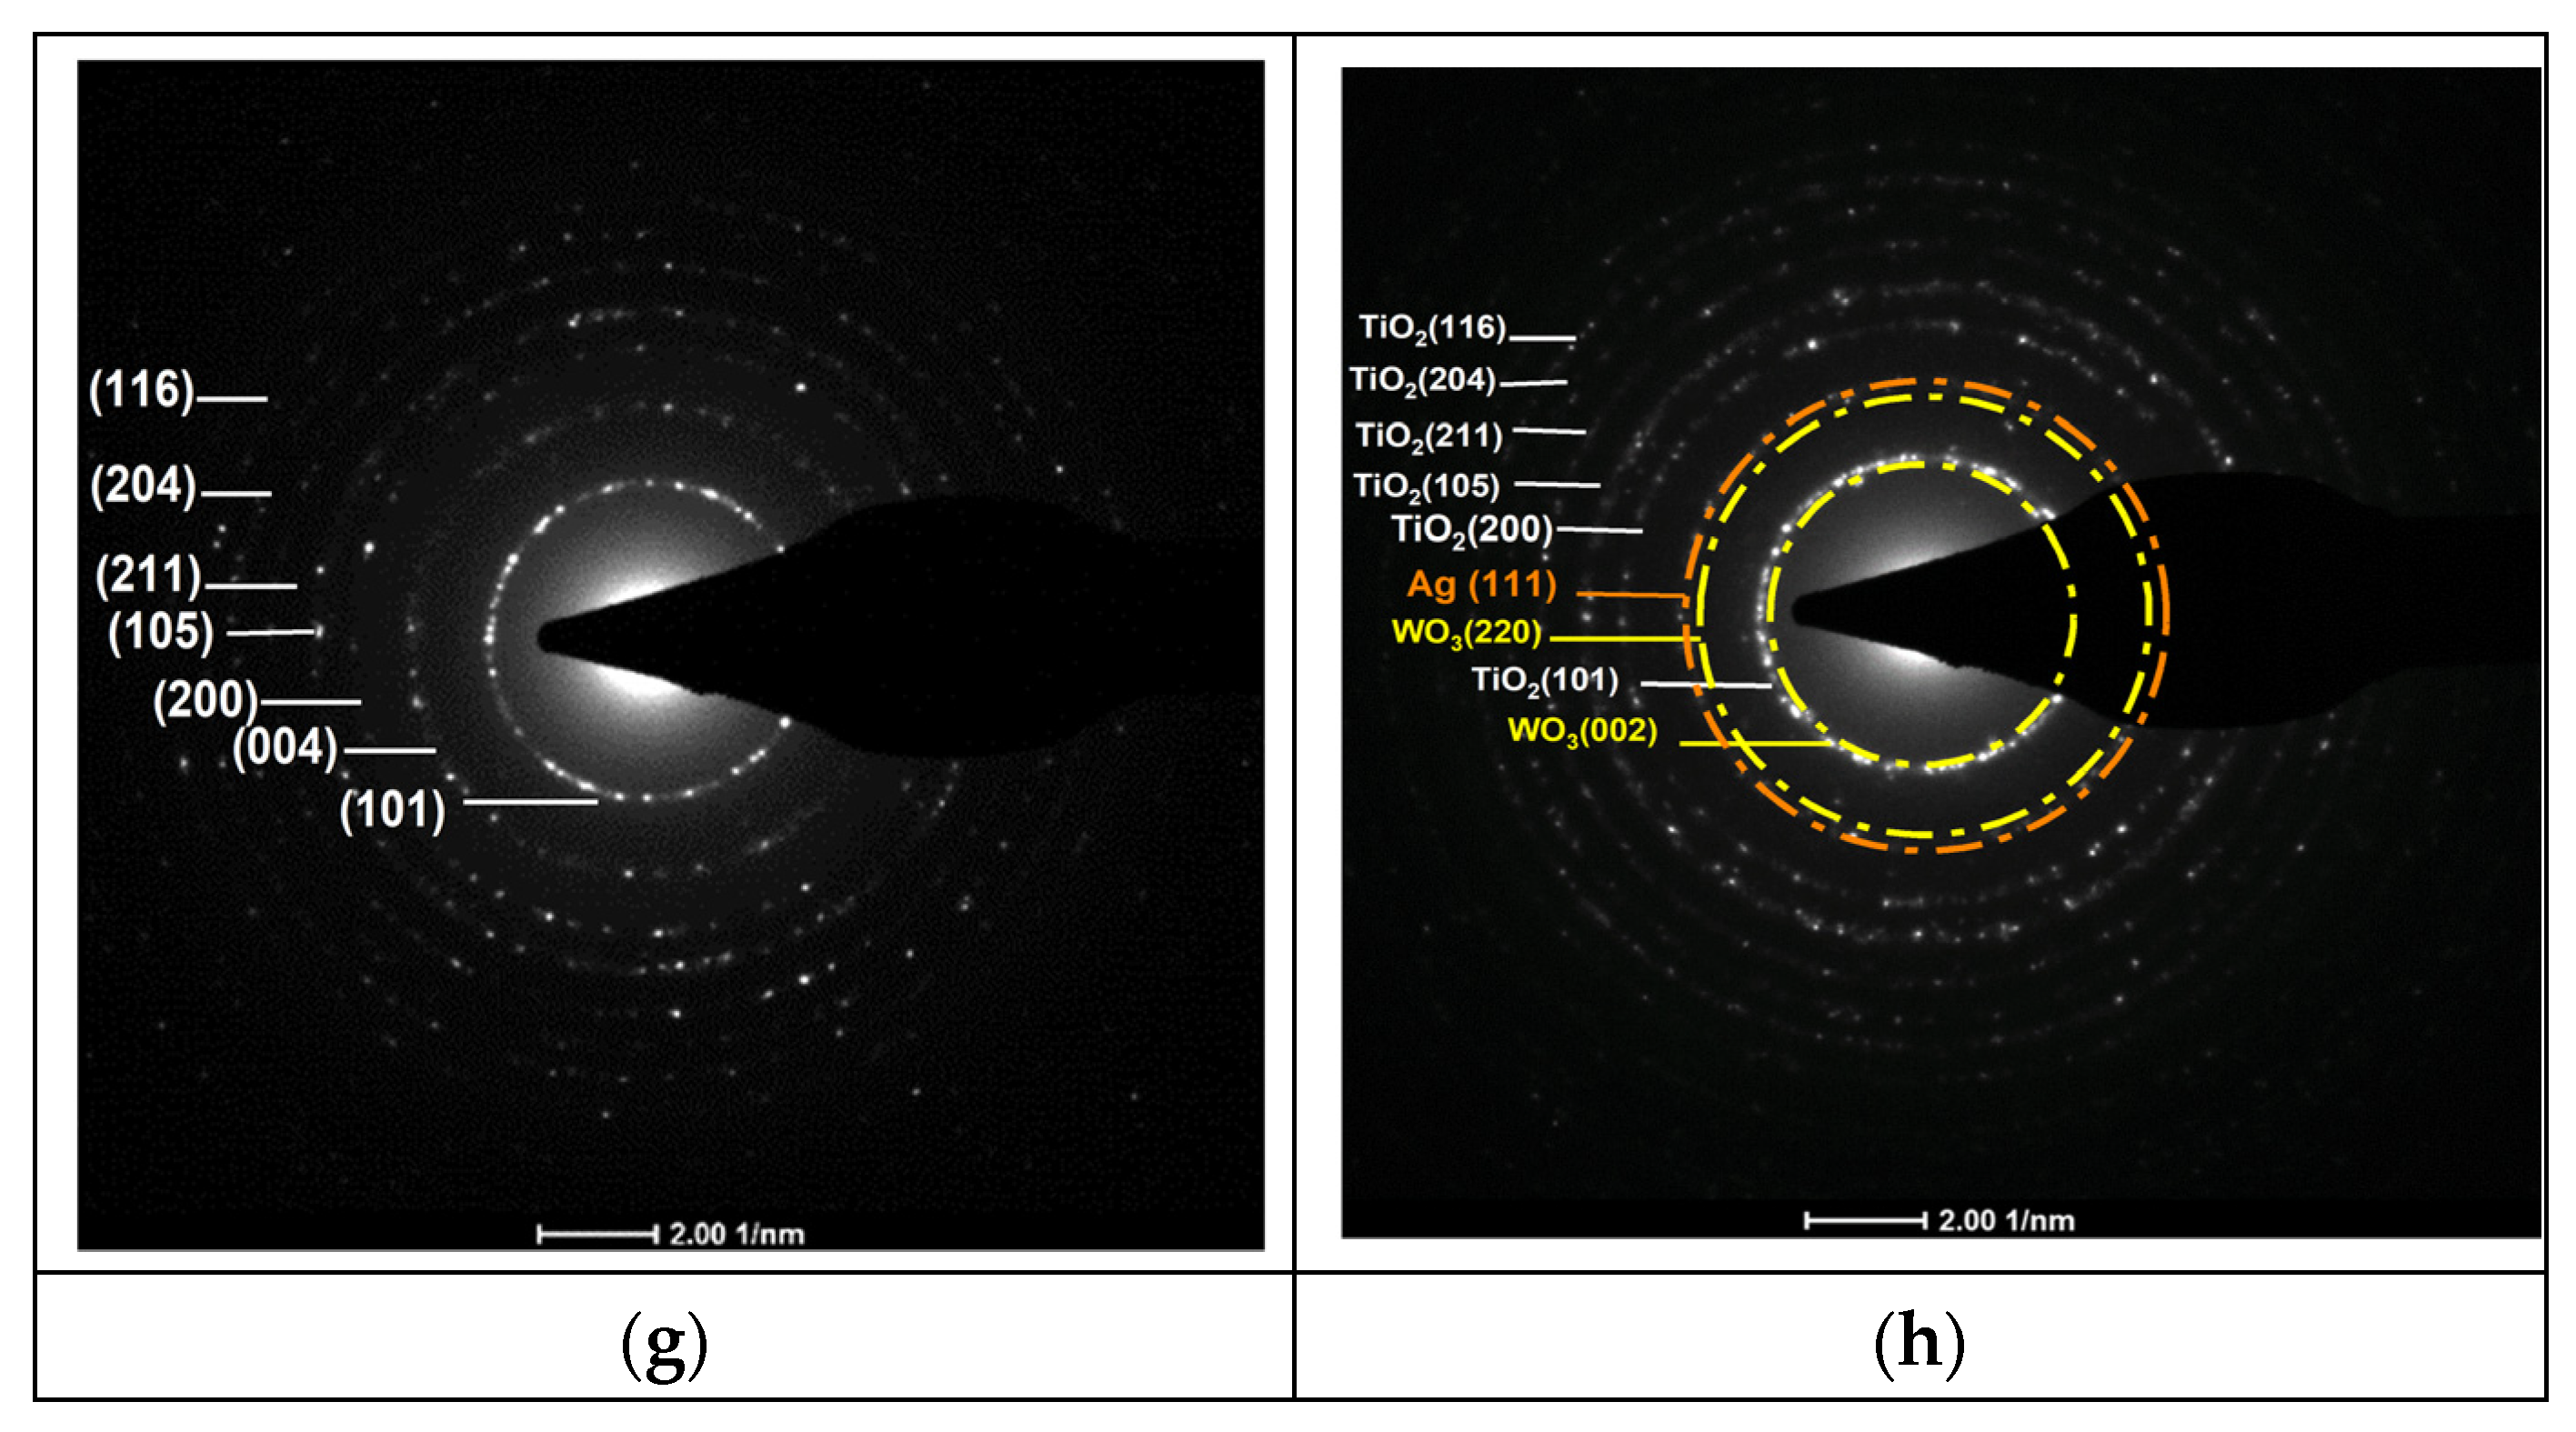
Figure 3a,b prove that pure TiO2 and 4%Ag/3%WO3/TiO2 exhibit a homogenous morphology, with a grain size within the approximate range of 10–15 nm. The average particle sizes for the pure TiO2 and its composite have been determined from the histograms in Figure 3c,d, which show particle size distributions of 11 nm and 11.39 nm for TiO2 and 4%Ag/3%WO3/TiO2, respectively. The HR images of the TiO2 and the composite, which are shown in Figure 3e–h, expose the presence of fringes that were identified by SAED pattern lattice spacing values of 0.352 nm corresponding to the lattice spacing values of the (101) plane of anatase TiO2, 0.38 nm that agrees with the (002) plane of monoclinic WO3, and 0.23 nm for the (111) plane; these values are in agreement with the XRD results and previous reports [34,35,36,37].
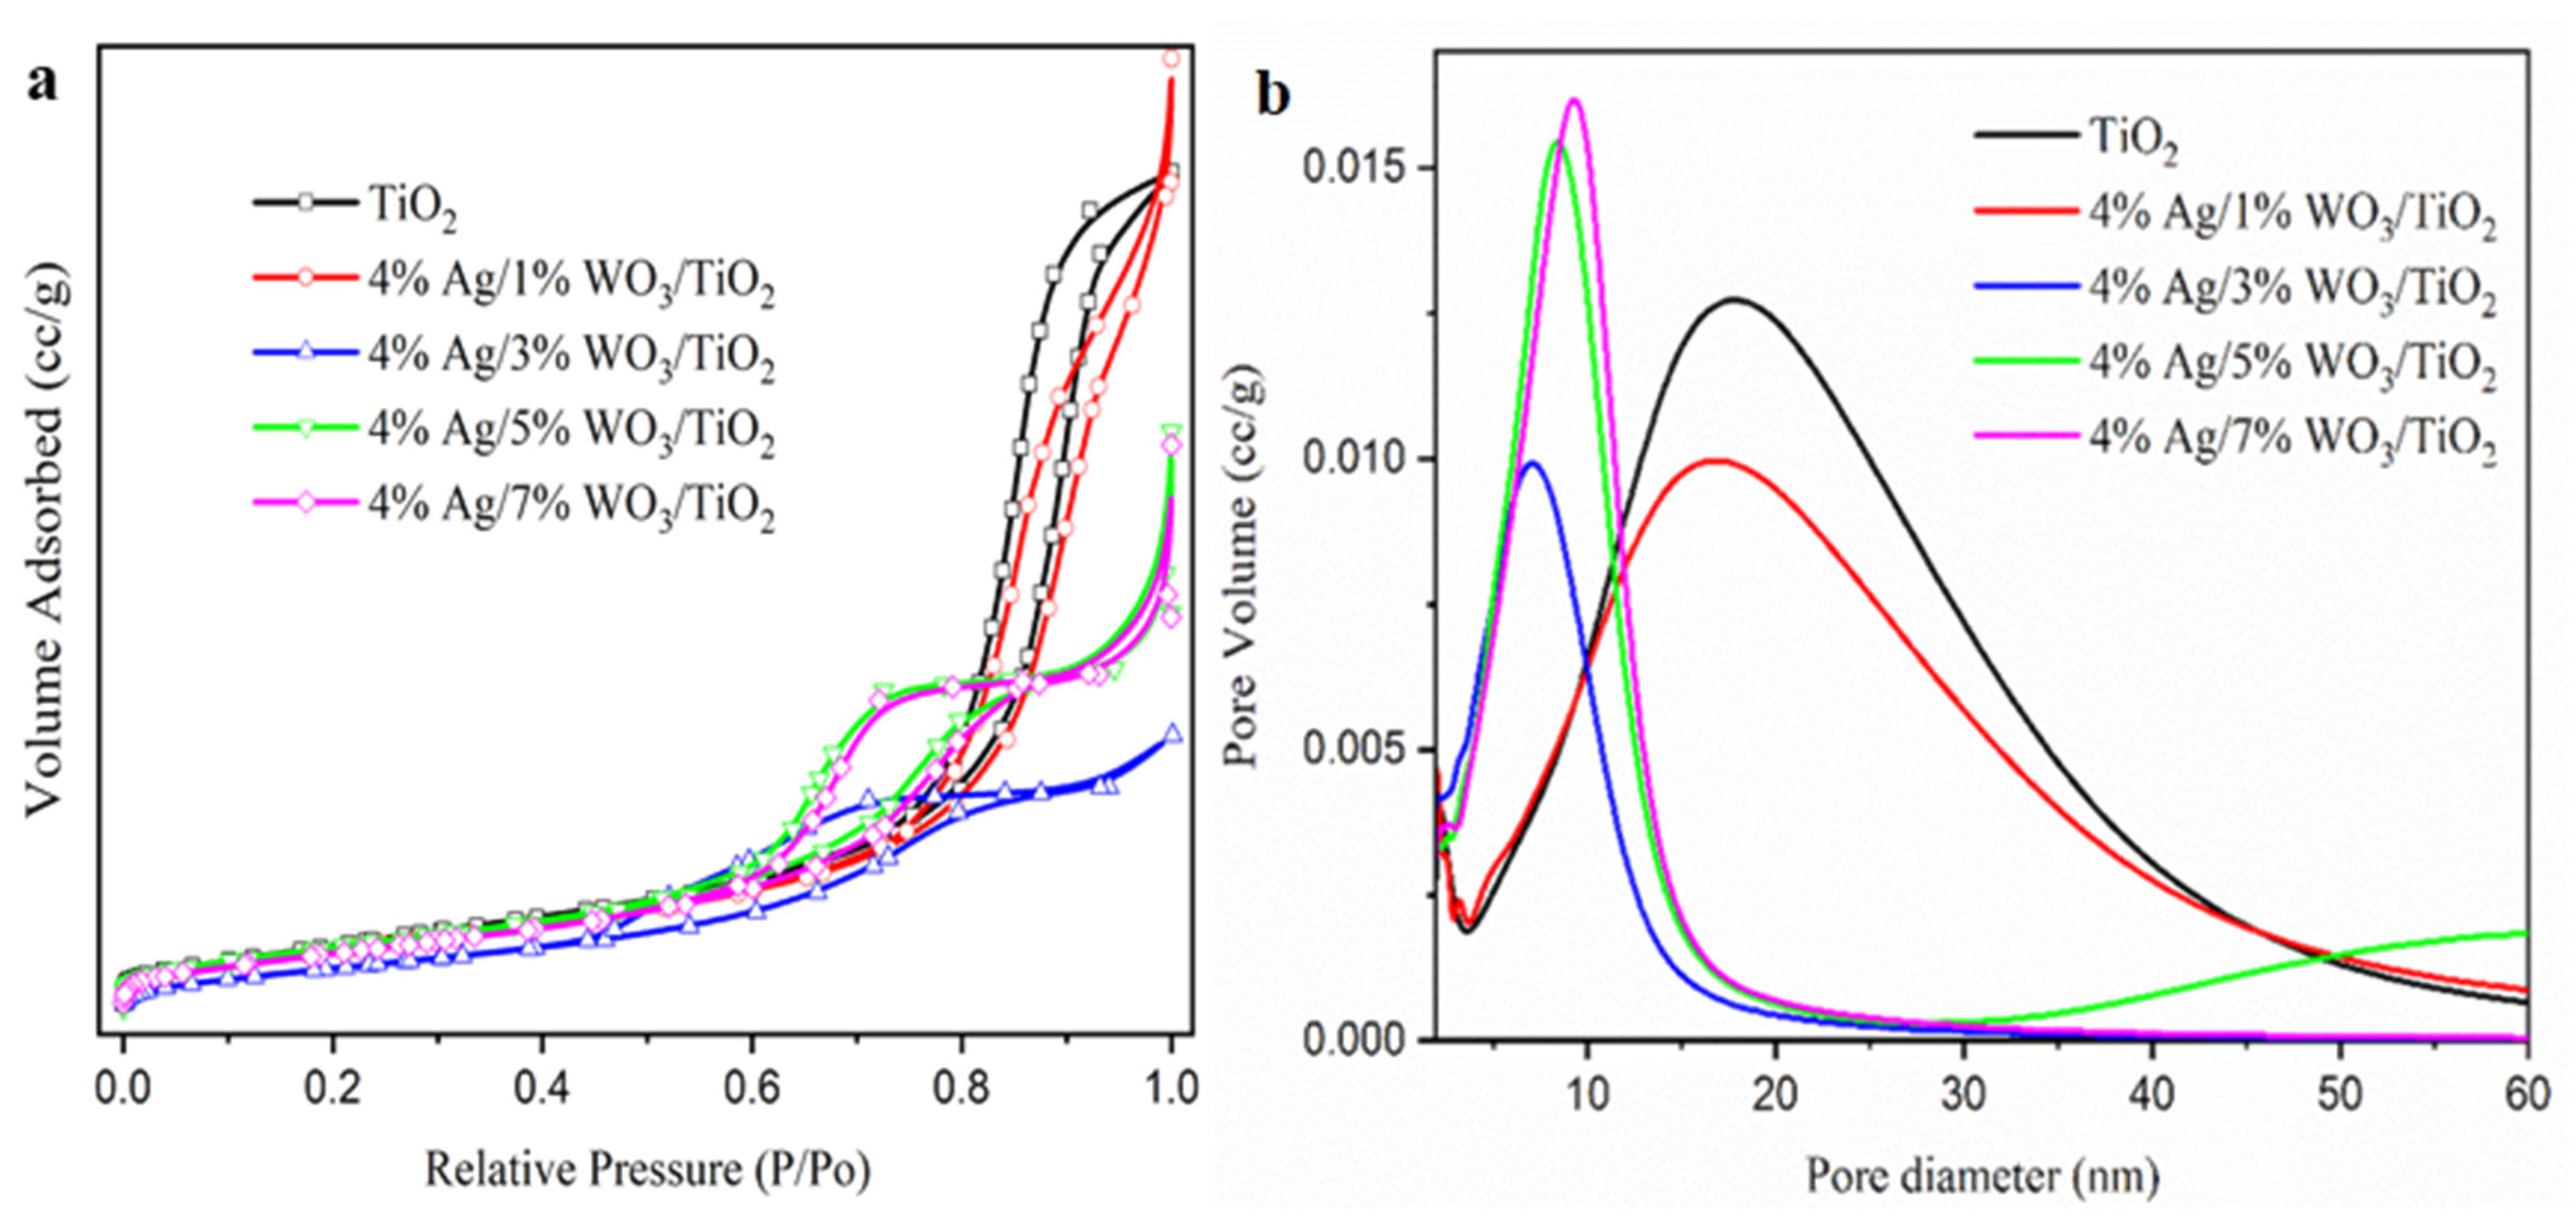
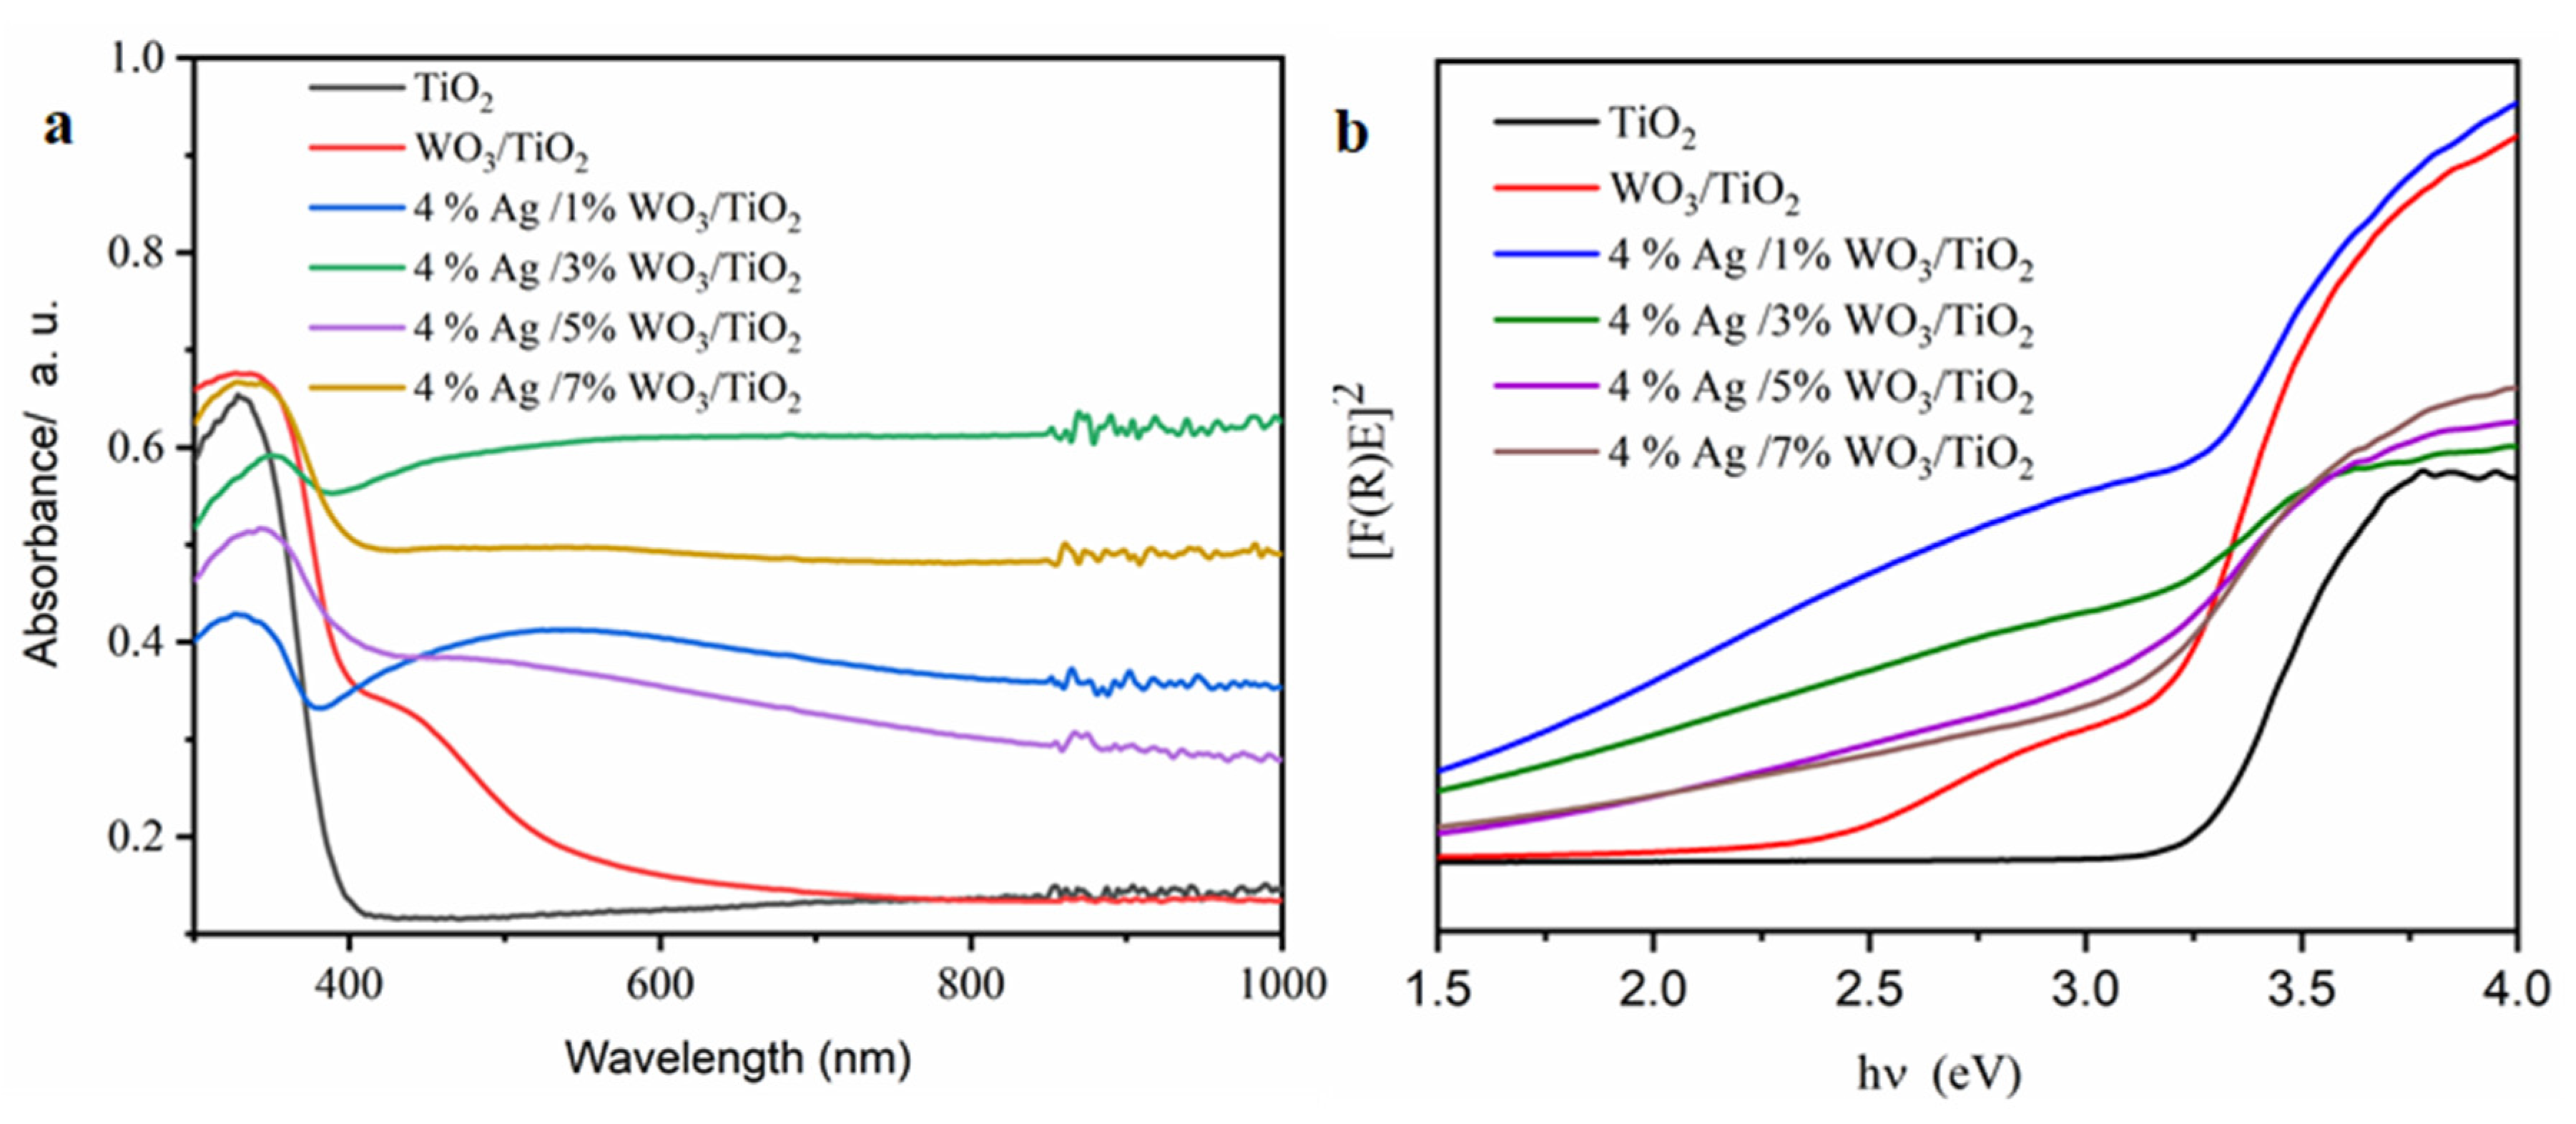
Employing the N2 adsorption–desorption method described by Brunaure, Emmett, and Teller (BET), the physical adsorption of the produced samples was determined. The adsorption–desorption isotherms in Figure 4a display a type IV isotherm with mesopores and H2-type hysteresis loops, indicating that the processed samples are categorized as mesoporous materials [38,39,40,41,42]. The surface area and pore size distribution curves, obtained using the Barrett–Joyner–Halenda (BJH) method and shown Figure 4b, reveal that the pore size decreased with an increase in the WO3 content (Table 2) due to the incorporation of WO3 particles into the pore of the TiO2. However, at a higher 4% Ag/7%WO3/TiO2 content, the surface area increases again due to the sediment of the small-size WO3 particles on the surface of the TiO2. To evaluate the enhancement of the optical response of the prepared materials, UV–visible diffuse reflectance spectroscopy (UV-DRS) was employed. Figure 5a shows the absorbance spectra for pure TiO2 and 4% Ag/x%WO3/TiO2 (with x = 1, 3, 5, and 7 wt.%) nanocomposites.
The absorption edge of pure TiO2 was observed at 380 nm, indicating that the sample has a high bandgap; however, for 4% Ag/3%WO3/TiO2 nanocomposites, the bandgap was noticed to be lowest viz. 2.40 eV due to the redshift in the absorption edge (Figure 5a). The Ag and WO3 particles on the surface of the TiO2 contribute to the composite’s improvement [43].
The broad peaks ranged between 400 and 700 nm, especially in the 4% Ag/1%WO3/TiO2 sample (Figure 5a), due to plasmon-resonance Ag particles on the surface [24]. Furthermore, it was observed that with the increase in the WO3 ratio, the plasmon peak decreased, and the absorption spectra around the heterojunction between WO3/TiO2 photocatalysts were wider and exhibited a redshift in comparison to the pristine titania [24]. The main source of this redshift is the lattice mismatch between the metal oxides, which leads to the formation of mid-gap states in the bandgap of titania.
The optical energy gap of the prepared samples was calculated using the Kubelka–Munk relation [44] as follows:
F R = ( 1 R ) 2 2 R
where R is the reflectance. In terms of F(R), Tauc’s equation adjusts the result to become [45]:
F R h ν = A ( h ν E g ) n
Eg refers to the bandgap as mentioned above, h ν represents the energy of light, n = 1/2 is for the direct allowed transition, and n = 2 is for the indirect allowed transition.
As shown in Figure 5b, the energy gap was reduced as a result of the WO3 particles being loaded onto the TiO2 surface, according to the data in Table 2. The increase in WO3 concentration on the surface of the TiO2 composite contributes to the decrease of the energy gap and, consequently, increases the conductivity of the prepared materials. PL was employed to investigate the impact of the increase in the WO3 ratio on the charge carrier trapping and transfer into the prepared composites. The emission spectra of pure TiO2 and 4% Ag/x%WO3/TiO2 (with x = 1, 3, 5, and 7 wt.% of WO3) nanocomposites are displayed in Figure 6. The prepared samples were excited at 380 nm to obtain the emission spectra and the result exhibited two luminescence emissions at 450 nm and 470 nm; according to the results, the emission peak at 450 nm was related to the surface defects. The composite and the analysis of the effectiveness of the charge carrier trapping and transfer through the knowledge of the bath of e−/h + pairs in semiconductors can be linked to particular electronic properties of the WO3–TiO2 nanocomposites [46]. However, the recombination of excited charge carriers on the WO3 surface is responsible for the emission peak at 467 nm [47]. The results reveal that the PL spectra were decreased with an increase in the WO3 weight ratio at 4% Ag/x%WO3/TiO2 (with x = 1, 3 wt.% of WO3) nanocomposites, which means that there is an increase in the lifetime of the electrons at the exited state that gives a high photonic efficiency and photocatalytic activity [48,49]. On the other hand, when the WO3 weight ratio increases to 5 and 7%, the impurity energy level works as a charge carrier recombination center, and the PL spectrum re-increases again, which decreases the photonic efficiency and photocatalytic activity [30,50].
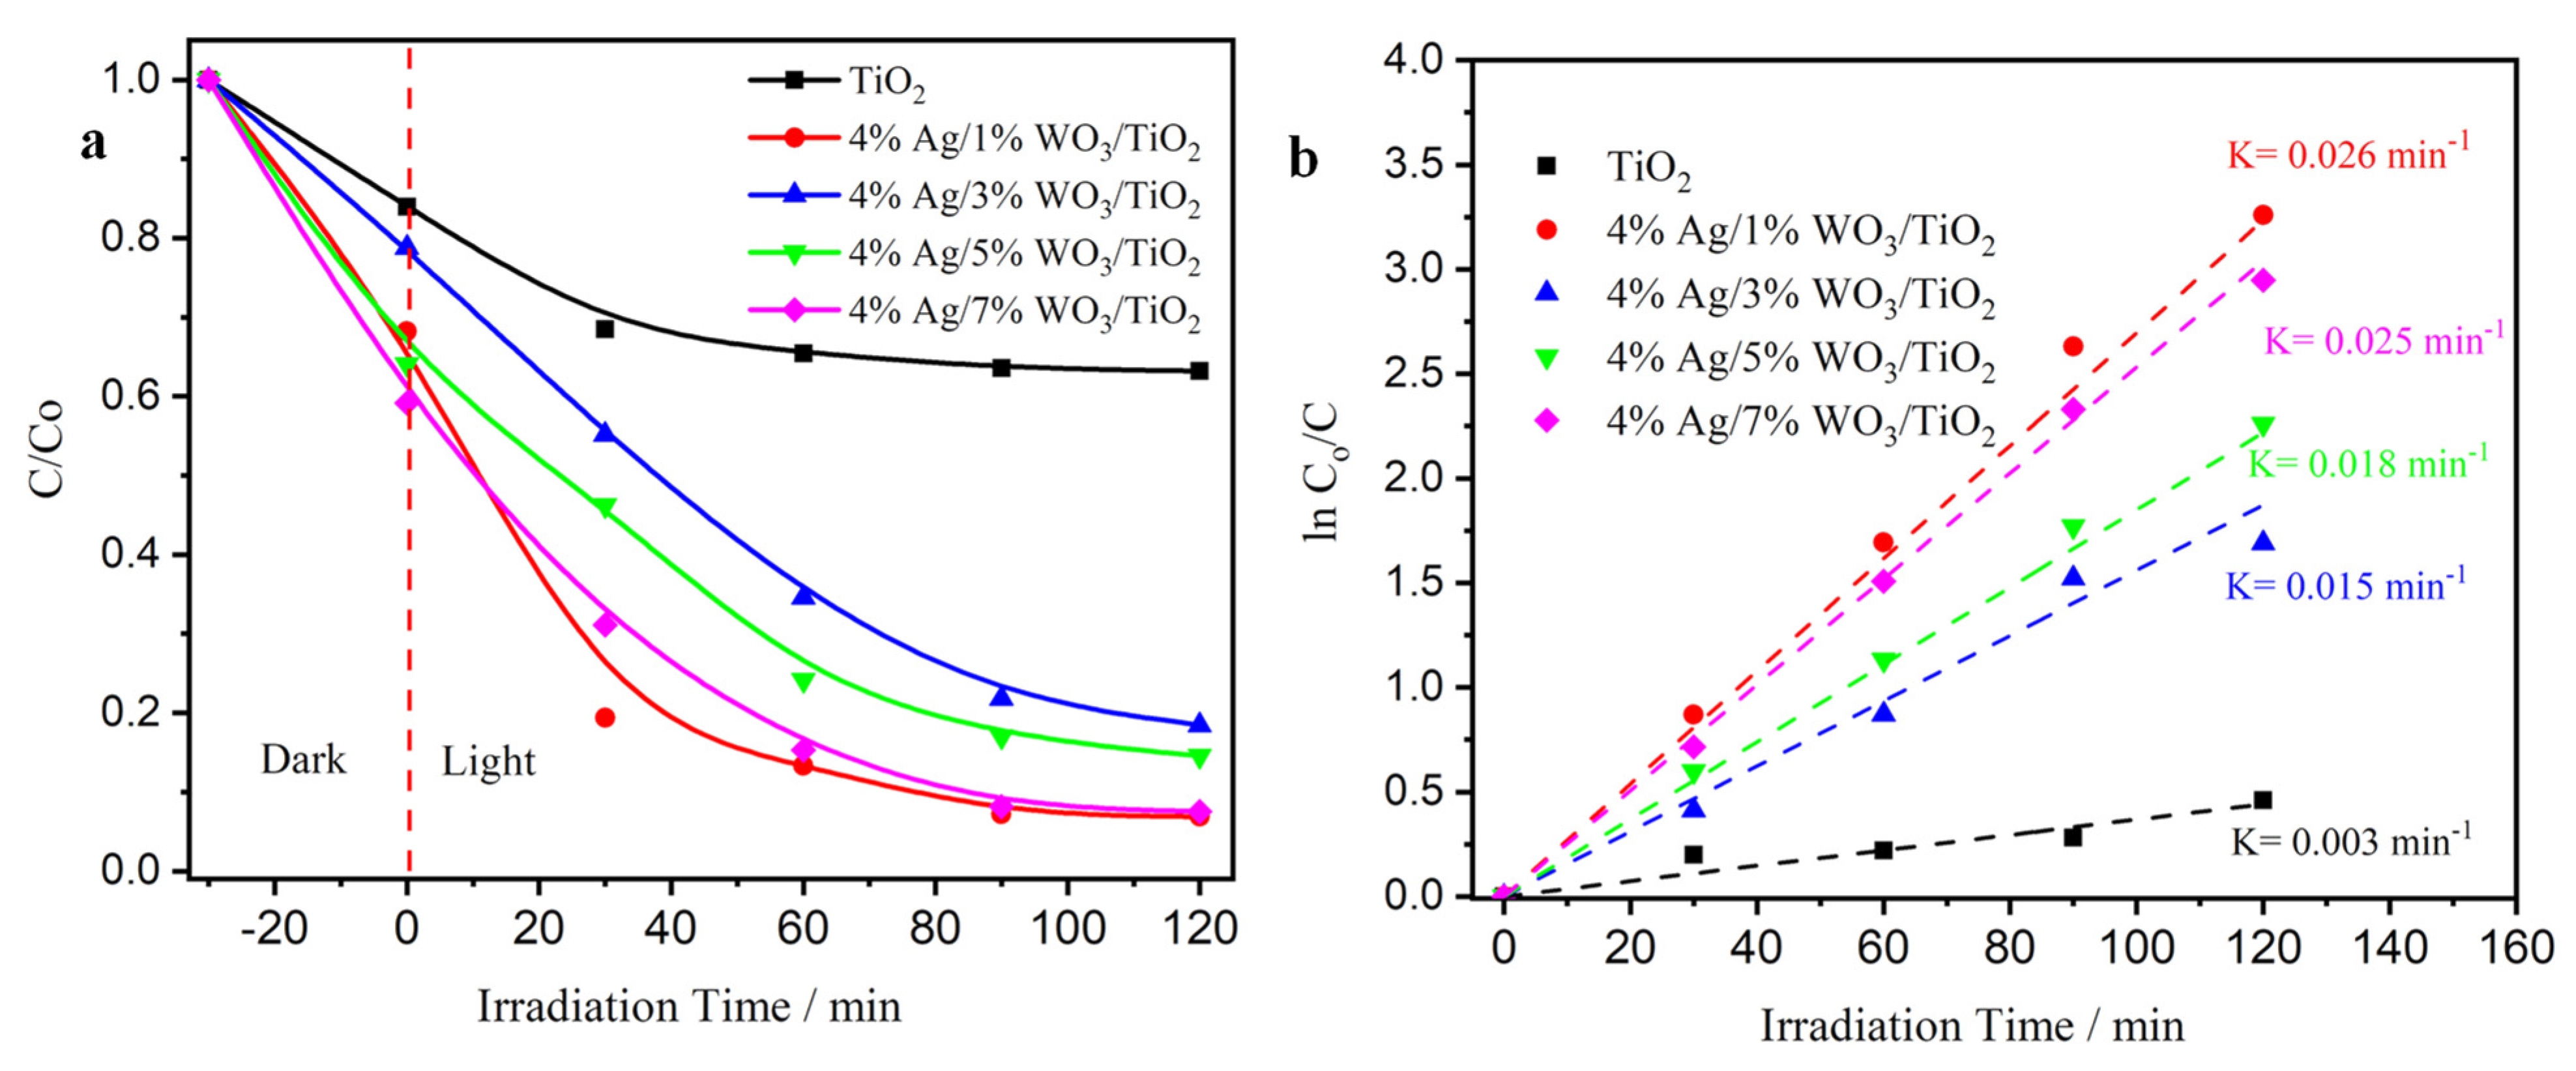
The photocatalytic activity of pure TiO2, WO3/TiO2, and with 4% Ag/x%WO3/TiO2 (with x = 1, 3 wt.% of WO3) nanocomposites was studied using Cr(VI) as a heavy metal module photoreduction to nontoxic Cr (III). As presented in Figure 7a, the results demonstrate that the photoreduction efficiency of pure TiO2 is 25%. Moreover, the photoreduction efficiency was nearly 95% in the 4% Ag/1%WO3/TiO2 sample. Nonetheless, the photoactivity was decreased after an increase of the 4% Ag/3%WO3/TiO2 to 78%, and re-increased again with 4% Ag/5%WO3/TiO2, reaching 95% in the presence of 4% Ag/7%WO3/TiO2. The obtained results are comparable with several previous reports [21,22,51,52,53,54,55,56] as provided in a comparative Table S1 (see supporting data). These changes are due to the two mechanisms’ impact on the catalyst activity. First, the pure TiO2 activity is very small due to the wide bandgap of the TiO2. The high activity of the 4% Ag/1%WO3/TiO2 sample is due to the impact of the plasmonic effect of the Ag metal that appeared clearly in the absorption graph. At the same time, the impact of the heterojunction between the TiO2 and WO3 molecules is very low. When the WO3 molecule was increased to 3% and 5%, the impact of the plasmon effect was decreased. By contrast, the impact of the heterojunction between the TiO2 and WO3 molecules was increased till it reached 95% efficiency in the presence of the 4% Ag/7%WO3/TiO2 sample. Based on the pseudo-first-order model, the kinetics of Cr(VI) photoreduction over the synthesized photocatalysts were further explored as depicted in Figure 7b (Equation (6)) [21]:
Ln C o C t = k . t
where Co and Ct are the Cr(VI) concentration at time zero and time t, and k is the rate constant. By fitting the ln (Ct/Co) vs. t curves, the 4% Ag/1%WO3/TiO2 and 4% Ag/7%WO3/TiO2 nanocomposite appear to have a k value almost nine times greater than that of pure TiO2, revealing that the Ag/WO3/TiO2 nanocomposite serves as an outstanding and efficient photocatalyst for the Cr(VI) photoreduction.
The other technique is to evaluate the organic waste degradation activity of the prepared photocatalysts using a photooxidation mechanism. Figure 8a shows the photodegradation efficiency of MB dye discharged into waterways from the textile industrial sector. The results exhibit that the 4% Ag/5%WO3/TiO2 catalyst shows improved degradation efficiency of MB to 85% after 30 min and 93% after 4 h. the efficiency of the sample refers to the impact of the heterojunction between the TiO2 and WO3, in addition to the impact of the plasmon effect of Ag that works as a trapping point for the photogenerated electron and holes [23]. Figure 8b shows the photodegradation rates of MB that exposed the photodegradation following the first-order kinetics. The optimum sample showed a photodegradation rate nine times higher than that of the pure TiO2 sample.

3. Materials and Methods

3.1. Materials

Titanium (IV) isopropoxide (97%) was sourced from Alfa Aesar, Ward Hill, Massachusetts, U.S., and tungsten (VI) chloride (99.9%), Pluronic P123 (a poly (ethylene glycol)-poly(propylene glycol) copolymer with a molecular weight of approximately 5800), hydrochloric acid, ammonium hydroxide (NH4OH) with a purity of >98%, and silver nitrate (AgNO3) were procured from Sigma-Aldrich, Burlington, Massachusetts, United States.

3.2. Methods

3.2.1. Synthesis of Titanium Nanoparticle TiO2 (NPs)

TiO2 nanoparticles were synthesized using the sol-gel method. The procedure involved the following steps. First, 23.4 mL of titanium isopropoxide was mixed with 9.38 mL of hydrochloric acid (HCl) under stirring for 10 min, resulting in a clear solution. After that, 5 g of Pluronic (P123) dissolved into 76.04 mL of ethanol (97%) and was added to the above solution and stirred for 30 min. Second, an Ammonia solution was added to adjust the pH to ~8. The white precipitate was washed five times with distilled water and ethanol, dried for 24 h at 100 °C, and then annealed for 3 h at 450 °C.

3.2.2. Synthesis of (1, 3, 5 and 7% WO3)/TiO2 Nanocomposite

A calculated amount of tungsten precursor (tungsten (VI) chloride) was dissolved in ethanol and then added to the titanium isopropoxide solution to produce a (1, 3, 5, and 7% WO3)/TiO2 weight ratio. After that, the pH was adjusted using an ammonia solution, followed by washing and drying at 100 °C, and it was finally annealed for 3 h at 450 °C.

3.2.3. Synthesis of 4%Ag/x%WO3/TiO2

To prepare a 4% Ag-doped nanocomposite, the previously synthesized (1,3,5, and 7% WO3)/TiO2 samples were suspended in a solution containing 0.063 g AgNO3 and exposed to UV irradiation for 24 h to produce 4% Ag (1, 3, 5, and 7% WO3)/TiO2. Finally, the samples were dried at 60 °C for 24 h.

3.3. Characterization Techniques

The crystal structure of the prepared samples was evaluated using an X-ray diffractometer (XRD-6000, Shimadzu, Kyoto, Japan) with Cu Kα radiation (λ = 1.5406 Å) operated at 40 kV and 30 mA. The synthesized nanoparticles’ photoluminescence (PL) spectra were examined using a spectrofluorophotometer (RF-5301 PC, SHIMADZU, Kyoto, Japan) operating at room temperature with an excitation wavelength of 380 nm. Optical characteristics and optical bandgaps were determined using a diffused reflectance spectrometer (DRS UV-3600, SHIMADZU, Kyoto, Japan). The surface morphology analysis of pure TiO2 and the 4%Ag/x%WO3/TiO2 nanocomposite was performed using transmission electron microscopy (TEM JEM-2100F, Tokyo, Japan) that was employed to investigate particle sizes, shapes, and crystal planes. N2 adsorption-desorption isotherms were employed to determine the specific surface area of the samples using a NOVA2000e apparatus (Quantachrome, Boynton Beac, FL, USA). Additionally, the photocatalytic activity of the prepared samples was illustrated via the photoreduction of Cr(VI) to Cr(III) using visible light irradiation (halogen lamp 1000 W, λ > 420 nm) set at a 20 cm distance above the reactor. In detail, 50 mg of catalyst was added into 50 mL of Cr(VI) solution (10 mg L−1) and suspended and maintained at a constant pH of 3.0 using 100 μ of formic acid as a hole scavenger. The mixture was placed in darkness to reach equilibrium. After that, it was illuminated with visible light, and 2 mL of each interval was centrifuged to remove suspended solids. The aqueous solution of the Cr(VI) sample was determined at λ = 540 nm using the diphenylcarbazide (0.5%) (DPC) solution in acetone and 0.2 M of H2SO that formed a violet color with Cr(VI) [56]. In addition, the catalytic activity for Cr(VI) reduction was evaluated using the formula (photocatalytic degradation = (1 − Ct)/Co), where Co represents the initial concentration after the equilibrium experiment in the dark and Ct is the Cr(VI) concentration after the photoreduction process. Moreover, the photooxidation performance of the prepared materials was evaluated using MB dye as a module of the organic waste for the textile industrial sector. The oxidation efficiency was determined by withdrawing 2 ml of illuminated dye at each interval time and measuring the decreasing absorbance intensity of the dye using a spectrophotometer at λ = 664 nm using the same Cr(VI) degradation equation.

4. Conclusions

In our study, the synthesis of Ag/WO3/TiO2 nanocomposites with different concentrations of WO3 particles via the sol-gel technique exhibited highly efficient photoactivity toward the two mechanisms of the photocatalyst performance. They show a good photoreduction of Cr(VI) ions that are converted to Cr(III) due to the impact of the plasmon effect of Ag. In addition, they exhibit a prerogative efficiency for the photo-oxidation of MB dye to CO2 and H2O.

Supplementary Materials

The following supporting information can be downloaded at: https://www.mdpi.com/article/10.3390/catal14090633/s1, Table S1 a comparative data for the current and the previous reported values of degradation rate of various related materials.

Author Contributions

Conceptualization, methodology, investigation, and writing—original/initial draft preparation, S.H.A.; formal analysis, review and editing, A.H.; formal analysis, original draft and supervision, M.S.; methodology, M.A.S.; conceptualization, formal analysis, review and editing, and supervision, A.M.A. All authors have read and agreed to the published version of the manuscript.

Funding

This research was funded by the Deanship of Research and Graduate Studies at King Khalid University, Saudi Arabia, grant number [RGP2/241/45].

Data Availability Statement

The data presented in this study are available on request from the corresponding author. The data are not publicly available due to it is a part of ongoing research for Ph.D. student.

Acknowledgments

The authors extend their appreciation to the Deanship of Research and Graduate Studies at King Khalid University for funding this work through the Large Research Project under grant number RGP2/241/45.

Conflicts of Interest

The authors declare no conflicts of interest.

References

  1. Lai, C.W. WO3-TiO2 Nanocomposite and Its Applications: A Review. Nano Hybrids Compos. 2018, 20, 1–26. [Google Scholar] [CrossRef]
  2. Khan, A.; Gaikwad, M.A.; Kim, J.H.; Kadam, A. An Overview and Experimental analysis of WO3/TiO2 Composite with Enhanced Electrochromic Properties for Smart Windows Application. Tungsten 2024, 6, 732–747. [Google Scholar] [CrossRef]
  3. Folli, A.; Bloh, J.Z.; Strøm, M.; Pilegaard Madsen, T.; Henriksen, T.; Macphee, D.E. Efficiency of Solar-Light-Driven TiO2 Photocatalysis at Different Latitudes and Seasons. Where and When Does TiO2 Really Work? J. Phys. Chem. Lett. 2014, 5, 830–832. [Google Scholar] [CrossRef] [PubMed]
  4. Kathirvelan, J.; Vijayaraghavan, R.; Thomas, A. Ethylene Detection Using TiO2–WO3 Composite Sensor for Fruit Ripening Applications. Sens. Rev. 2017, 37, 147–154. [Google Scholar] [CrossRef]
  5. Serga, V.; Burve, R.; Krumina, A.; Pankratova, V.; Popov, A.I.; Pankratov, V. Study of Phase Composition, Photocatalytic Activity, and Photoluminescence of TiO2 with Eu Additive Produced by the Extraction-Pyrolytic Method. J. Mater. Res. Technol. 2021, 13, 2350–2360. [Google Scholar] [CrossRef]
  6. Matějová, L.; Kočí, K.; Reli, M.; Čapek, L.; Hospodková, A.; Peikertová, P.; Matěj, Z.; Obalová, L.; Wach, A.; Kuśtrowski, P.; et al. Preparation, Characterization and Photocatalytic Properties of Cerium Doped TiO2: On the Effect of Ce Loading on the Photocatalytic Reduction of Carbon Dioxide. Appl. Catal. B Environ. 2014, 152–153, 172–183. [Google Scholar] [CrossRef]
  7. Li, T.; Luo, S.; Luo, Y.; Yang, L. Ag/AgI Nanoparticles Decorated WO3/TiO2 Nanotubes with Enhanced Visible Light Photocatalytic Activity. Mater. Lett. 2016, 180, 130–134. [Google Scholar] [CrossRef]
  8. Hirakawa, T.; Kamat, P. V Photoinduced Electron Storage and Surface Plasmon Modulation in Ag@ TiO2 Clusters. Langmuir 2004, 20, 5645–5647. [Google Scholar] [CrossRef]
  9. Jakob, M.; Levanon, H.; Kamat, P. V Charge Distribution between UV-Irradiated TiO2 and Gold Nanoparticles: Determination of Shift in the Fermi Level. Nano Lett. 2003, 3, 353–358. [Google Scholar] [CrossRef]
  10. Wang, N.; Xu, Y.; Zhu, L.; Shen, X.; Tang, H. Reconsideration to the Deactivation of TiO2 Catalyst during Simultaneous Photocatalytic Reduction of Cr (VI) and Oxidation of Salicylic Acid. J. Photochem. Photobiol. A Chem. 2009, 201, 121–127. [Google Scholar] [CrossRef]
  11. Vinodgopal, K.; Bedja, I.; Kamat, P. V Nanostructured Semiconductor Films for Photocatalysis. Photoelectrochemical Behavior of SnO2/TiO2 Composite Systems and Its Role in Photocatalytic Degradation of a Textile Azo Dye. Chem. Mater. 1996, 8, 2180–2187. [Google Scholar] [CrossRef]
  12. He, Y.; Wu, Z.; Fu, L.; Li, C.; Miao, Y.; Cao, L.; Fan, H.; Zou, B. Photochromism and Size Effect of WO3 and WO3−TiO2 Aqueous Sol. Chem. Mater. 2003, 15, 4039–4045. [Google Scholar] [CrossRef]
  13. Archana, P.S.; Gupta, A.; Yusoff, M.M.; Jose, R. Tungsten Doped Titanium Dioxide Nanowires for High Efficiency Dye-Sensitized Solar Cells. Phys. Chem. Chem. Phys. 2014, 16, 7448–7454. [Google Scholar] [CrossRef]
  14. Yu, X.-F.; Wu, N.-Z.; Huang, H.-Z.; Xie, Y.-C.; Tang, Y.-Q. A Study on the Monolayer Dispersion of Tungsten Oxide on Anatase. J. Mater. Chem. 2001, 11, 3337–3342. [Google Scholar] [CrossRef]
  15. Pan, J.H.; Lee, W.I. Preparation of Highly Ordered Cubic Mesoporous WO3/TiO2 Films and Their Photocatalytic Properties. Chem. Mater. 2006, 18, 847–853. [Google Scholar] [CrossRef]
  16. Reyes-Gil, K.R.; Robinson, D.B. WO3-Enhanced TiO2 Nanotube Photoanodes for Solar Water Splitting with Simultaneous Wastewater Treatment. ACS Appl. Mater. Interfaces 2013, 5, 12400–12410. [Google Scholar] [CrossRef]
  17. Reyes-Gil, K.R.; Stephens, Z.D.; Stavila, V.; Robinson, D.B. Composite WO3/TiO2 Nanostructures for High Electrochromic Activity. ACS Appl. Mater. Interfaces 2015, 7, 2202–2213. [Google Scholar] [CrossRef]
  18. Vidyadharan, B.; Archana, P.S.; Ismail, J.; Yusoff, M.M.; Jose, R. Improved Supercapacitive Charge Storage in Electrospun Niobium Doped Titania Nanowires. RSC Adv. 2015, 5, 50087–50097. [Google Scholar] [CrossRef]
  19. Krishnan, S.G.; Archana, P.S.; Vidyadharan, B.; Misnon, I.I.; Vijayan, B.L.; Nair, V.M.; Gupta, A.; Jose, R. Modification of Capacitive Charge Storage of TiO2 with Nickel Doping. J. Alloys Compd. 2016, 684, 328–334. [Google Scholar] [CrossRef]
  20. Chen, D.; Cheng, Y.; Zhou, N.; Chen, P.; Wang, Y.; Li, K.; Huo, S.; Cheng, P.; Peng, P.; Zhang, R. Photocatalytic Degradation of Organic Pollutants Using TiO2-Based Photocatalysts: A Review. J. Clean. Prod. 2020, 268, 121725. [Google Scholar] [CrossRef]
  21. Chen, D.; Li, T.; Chen, Q.; Gao, J.; Fan, B.; Li, J.; Li, X.; Zhang, R.; Sun, J.; Gao, L. Hierarchically Plasmonic Photocatalysts of Ag/AgCl Nanocrystals Coupled with Single-Crystalline WO3 Nanoplates. Nanoscale 2012, 4, 5431–5439. [Google Scholar] [CrossRef] [PubMed]
  22. Li, Y.; Wu, W.; Dai, P.; Zhang, L.; Sun, Z.; Li, G.; Wu, M.; Chen, X.; Chen, C. WO3 and Ag Nanoparticle Co-Sensitized TiO2 Nanowires: Preparation and the Enhancement of Photocatalytic Activity. RSC Adv. 2014, 4, 23831–23837. [Google Scholar] [CrossRef]
  23. Xu, J.Y.; Wen, C.; Jia, L.M.; Xiao, C.F. Ag/WO3-Codoped TiO2 Nanoparticles: Relation between Structure, Sorption, and Photocatalytic Activity. In Proceedings of the Second International Conference on Smart Materials and Nanotechnology in Engineering, Weihai, China, 8–11 July 2009; Volume 7493, pp. 1522–1528. [Google Scholar]
  24. Basumatary, B.; Basumatary, R.; Ramchiary, A.; Konwar, D. Evaluation of Ag@TiO2/WO3 Heterojunction Photocatalyst for Enhanced Photocatalytic Activity towards Methylene Blue Degradation. Chemosphere 2022, 286, 131848. [Google Scholar] [CrossRef] [PubMed]
  25. Mineo, G.; Bruno, E.; Mirabella, S. Advances in WO3-Based Supercapacitors: State-of-the-Art Research and Future Perspectives. Nanomaterials 2023, 13, 1418. [Google Scholar] [CrossRef]
  26. Samuel, O.; Othman, M.H.D.; Kamaludin, R.; Sinsamphanh, O.; Abdullah, H.; Puteh, M.H.; Kurniawan, T.A. WO3–Based Photocatalysts: A Review on Synthesis, Performance Enhancement and Photocatalytic Memory for Environmental Applications. Ceram. Int. 2022, 48, 5845–5875. [Google Scholar] [CrossRef]
  27. Bahadur, J.; Agrawal, S.; Parveen, A.; Jawad, A.; Ashraf, S.S.Z.; Ghalib, R.M. Micro-Structural, Optical and Dielectric Properties of Ag Doped TiO2 Synthesized by Sol–Gel Method. Mater. Focus 2015, 4, 134–141. [Google Scholar] [CrossRef]
  28. Abdul Gafoor, A.K.; Musthafa, M.M.; Pradyumnan, P.P. AC Conductivity and Diffuse Reflectance Studies of Ag-TiO2 Nanoparticles. J. Electron. Mater. 2012, 41, 2387–2392. [Google Scholar] [CrossRef]
  29. Liu, S.; Guo, E.; Yin, L. Tailored Visible-Light Driven Anatase TiO2 Photocatalysts Based on Controllable Metal Ion Doping and Ordered Mesoporous Structure. J. Mater. Chem. 2012, 22, 5031. [Google Scholar] [CrossRef]
  30. Ismail, A.A.; Abdelfattah, I.; Helal, A.; Al-Sayari, S.A.; Robben, L.; Bahnemann, D.W. Ease Synthesis of Mesoporous WO3–TiO2 Nanocomposites with Enhanced Photocatalytic Performance for Photodegradation of Herbicide Imazapyr under Visible Light and UV Illumination. J. Hazard. Mater. 2016, 307, 43–54. [Google Scholar] [CrossRef]
  31. Wahba, M.A.; Yakout, S.M.; Sheta, S.M.; Helal, A.; El-Sheikh, S.M. Robust Ferromagnetic V0.05-XCoxZn0.95O (x = 0.01, 0.02, 0.03, 0.04, 0.05) Nano-Compounds: New Dilute Magnetic-Semiconductors with Tailored Optical Activity. J. Alloys Compd. 2024, 1003, 175503. [Google Scholar] [CrossRef]
  32. Ernawati, L.; Wahyuono, R.A.; Muhammad, A.A.; Nurislam Sutanto, A.R.; Maharsih, I.K.; Widiastuti, N.; Widiyandari, H. Mesoporous WO3/TiO2 Nanocomposites Photocatalyst for Rapid Degradation of Methylene Blue in Aqueous Medium. Int. J. Eng. 2019, 32, 1345–1352. [Google Scholar] [CrossRef]
  33. Araújo, E.S.; Leão, V.N.S. TiO2/WO3 Heterogeneous Structures Prepared by Electrospinning and Sintering Steps: Characterization and Analysis of the Impedance Variation to Humidity. J. Adv. Ceram. 2019, 8, 238–246. [Google Scholar] [CrossRef]
  34. Sathasivam, S.; Bhachu, D.S.; Lu, Y.; Chadwick, N.; Althabaiti, S.A.; Alyoubi, A.O.; Basahel, S.N.; Carmalt, C.J.; Parkin, I.P. Tungsten Doped TiO2 with Enhanced Photocatalytic and Optoelectrical Properties via Aerosol Assisted Chemical Vapor Deposition. Sci. Rep. 2015, 5, 10952. [Google Scholar] [CrossRef] [PubMed]
  35. Ren, R.; Wen, Z.; Cui, S.; Hou, Y.; Guo, X.; Chen, J. Controllable Synthesis and Tunable Photocatalytic Properties of Ti3+-Doped TiO2. Sci. Rep. 2015, 5, 10714. [Google Scholar] [CrossRef] [PubMed]
  36. Gao, J.; Yang, W.; Fang, C.; Liang, J.; Cheng, T.; Li, P.; Guo, X.; Jung, Y.; Wang, Y.; Dong, X. Facile Synthesis of TiO2/WO3 Nanocomposites and the Electrochemical Lithiation/Delithiation Activity. J. Mater. Sci. 2021, 56, 14505–14517. [Google Scholar] [CrossRef]
  37. Ramírez-Ortega, D.; Guerrero-Araque, D.; Acevedo-Peña, P.; Lartundo-Rojas, L.; Zanella, R. Effect of Pd and Cu Co-Catalyst on the Charge Carrier Trapping, Recombination and Transfer during Photocatalytic Hydrogen Evolution over WO3–TiO2 Heterojunction. J. Mater. Sci. 2020, 55, 16641–16658. [Google Scholar] [CrossRef]
  38. Fang, H.; Cao, X.; Yu, J.; Lv, X.; Yang, N.; Wang, T.; Jiang, W. Preparation of the All-Solid-State Z-Scheme WO3/Ag/AgCl Film on Glass Accelerating the Photodegradation of Pollutants under Visible Light. J. Mater. Sci. 2019, 54, 286–301. [Google Scholar] [CrossRef]
  39. Roumaih, K.; Ismail, S.M.; Labib, S.; Helal, A. Structural, Magnetic, and Optical Properties of ZnFe2O4/RO (RO = CdO, NiO, Ga2O3, SnO2, and TiO2) Nanocomposites. J. Mater. Sci. 2023, 58, 7948–7967. [Google Scholar] [CrossRef]
  40. Li, Y.; Chen, L.; Guo, Y.; Sun, X.; Wei, Y. Preparation and Characterization of WO3/TiO2 Hollow Microsphere Composites with Catalytic Activity in Dark. Chem. Eng. J. 2012, 181, 734–739. [Google Scholar] [CrossRef]
  41. Sajjad, A.K.L.; Shamaila, S.; Tian, B.; Chen, F.; Zhang, J. One Step Activation of WOx/TiO2 Nanocomposites with Enhanced Photocatalytic Activity. Appl. Catal. B Environ. 2009, 91, 397–405. [Google Scholar] [CrossRef]
  42. Bai, S.; Liu, H.; Sun, J.; Tian, Y.; Chen, S.; Song, J.; Luo, R.; Li, D.; Chen, A.; Liu, C.-C. Improvement of TiO2 Photocatalytic Properties under Visible Light by WO3/TiO2 and MoO3/TiO2 Composites. Appl. Surf. Sci. 2015, 338, 61–68. [Google Scholar] [CrossRef]
  43. Tryba, B.; Piszcz, M.; Morawski, A.W. Photocatalytic Activity of TiO2-WO3 Composites. Int. J. Photoenergy 2009, 2009, 1–7. [Google Scholar] [CrossRef]
  44. Kubelka, P.; Munk, F. A Contribution to the Optics of Pigments. Z. Technol. Phys. 1931, 12, 593–599. [Google Scholar]
  45. Tauc, J.; Grigorovici, R.; Vancu, A. Optical Properties and Electronic Structure of Amorphous Germanium. Phys. Status Solidi B 1966, 15, 627–637. [Google Scholar] [CrossRef]
  46. Zhang, L.; Li, Y.; Zhang, Q.; Wang, H. Hierarchical Nanostructure of WO3 Nanorods on TiO2 Nanofibers and the Enhanced Visible Light Photocatalytic Activity for Degradation of Organic Pollutants. CrystEngComm 2013, 15, 5986. [Google Scholar] [CrossRef]
  47. Ha, J.-H.; Muralidharan, P.; Kim, D.K. Hydrothermal Synthesis and Characterization of Self-Assembled h-WO3 Nanowires/Nanorods Using EDTA Salts. J. Alloys Compd. 2009, 475, 446–451. [Google Scholar] [CrossRef]
  48. de Castro, I.A.; Avansi, W.; Ribeiro, C. WO3/TiO2 Heterostructures Tailored by the Oriented Attachment Mechanism: Insights from Their Photocatalytic Properties. CrystEngComm 2014, 16, 1514–1524. [Google Scholar] [CrossRef]
  49. Helal, A.; Yu, J.; Ghanem, M.A.; Labib, A.A.; El-Sheikh, S.M. Boosting the Photocatalytic Activity of Bismuth Vanadate (BiVO4) via Optimization of the Internal Polarization. J. Mol. Struct. 2024, 1312, 138553. [Google Scholar] [CrossRef]
  50. Lai, C.W.; Sreekantan, S. Incorporation of WO3 Species into TiO2 Nanotubes via Wet Impregnation and Their Water-Splitting Performance. Electrochim. Acta 2013, 87, 294–302. [Google Scholar] [CrossRef]
  51. Khan, S.B.; Hou, M.; Shuang, S.; Zhang, Z. Morphological Influence of TiO2 Nanostructures (Nanozigzag, Nanohelics and Nanorod) on Photocatalytic Degradation of Organic Dyes. Appl. Surf. Sci. 2017, 400, 184–193. [Google Scholar] [CrossRef]
  52. Mohamed, M.M.; Ghanem, M.A.; Khairy, M.; Naguib, E.; Alotaibi, N.H. Zinc Oxide Incorporated Carbon Nanotubes or Graphene Oxide Nanohybrids for Enhanced Sonophotocatalytic Degradation of Methylene Blue Dye. Appl. Surf. Sci. 2019, 487, 539–549. [Google Scholar] [CrossRef]
  53. Widiyandari, H.; Nashir, M.; Parasdila, H.; Almas, K.F.; Suryana, R. Ag-TiO2 for Efficient Methylene Blue Photodegradation Under Visible Light Irradiation. Bull. Chem. React. Eng. Catal. 2023, 18, 593–603. [Google Scholar] [CrossRef]
  54. Dong, P.; Yang, B.; Liu, C.; Xu, F.; Xi, X.; Hou, G.; Shao, R. Highly Enhanced Photocatalytic Activity of WO3 Thin Films Loaded with Pt-Ag Bimetallic Alloy Nanoparticles. RSC Adv. 2017, 7, 947–956. [Google Scholar] [CrossRef]
  55. Liu, Q.; Zhou, B.; Xu, M.; Mao, G. Integration of Nanosized ZIF-8 Particles onto Mesoporous TiO2 Nanobeads for Enhanced Photocatalytic Activity. RSC Adv. 2017, 7, 8004–8010. [Google Scholar] [CrossRef]
  56. Helal, A.; Salem, A.M.S.; El-Hout, S.I. Highly Efficient Visible Light Photoreduction of Cr(VI) via PANI/Bi2S3 Z-Scheme Behavior. J. Photochem. Photobiol. A Chem. 2024, 447, 115232. [Google Scholar] [CrossRef]
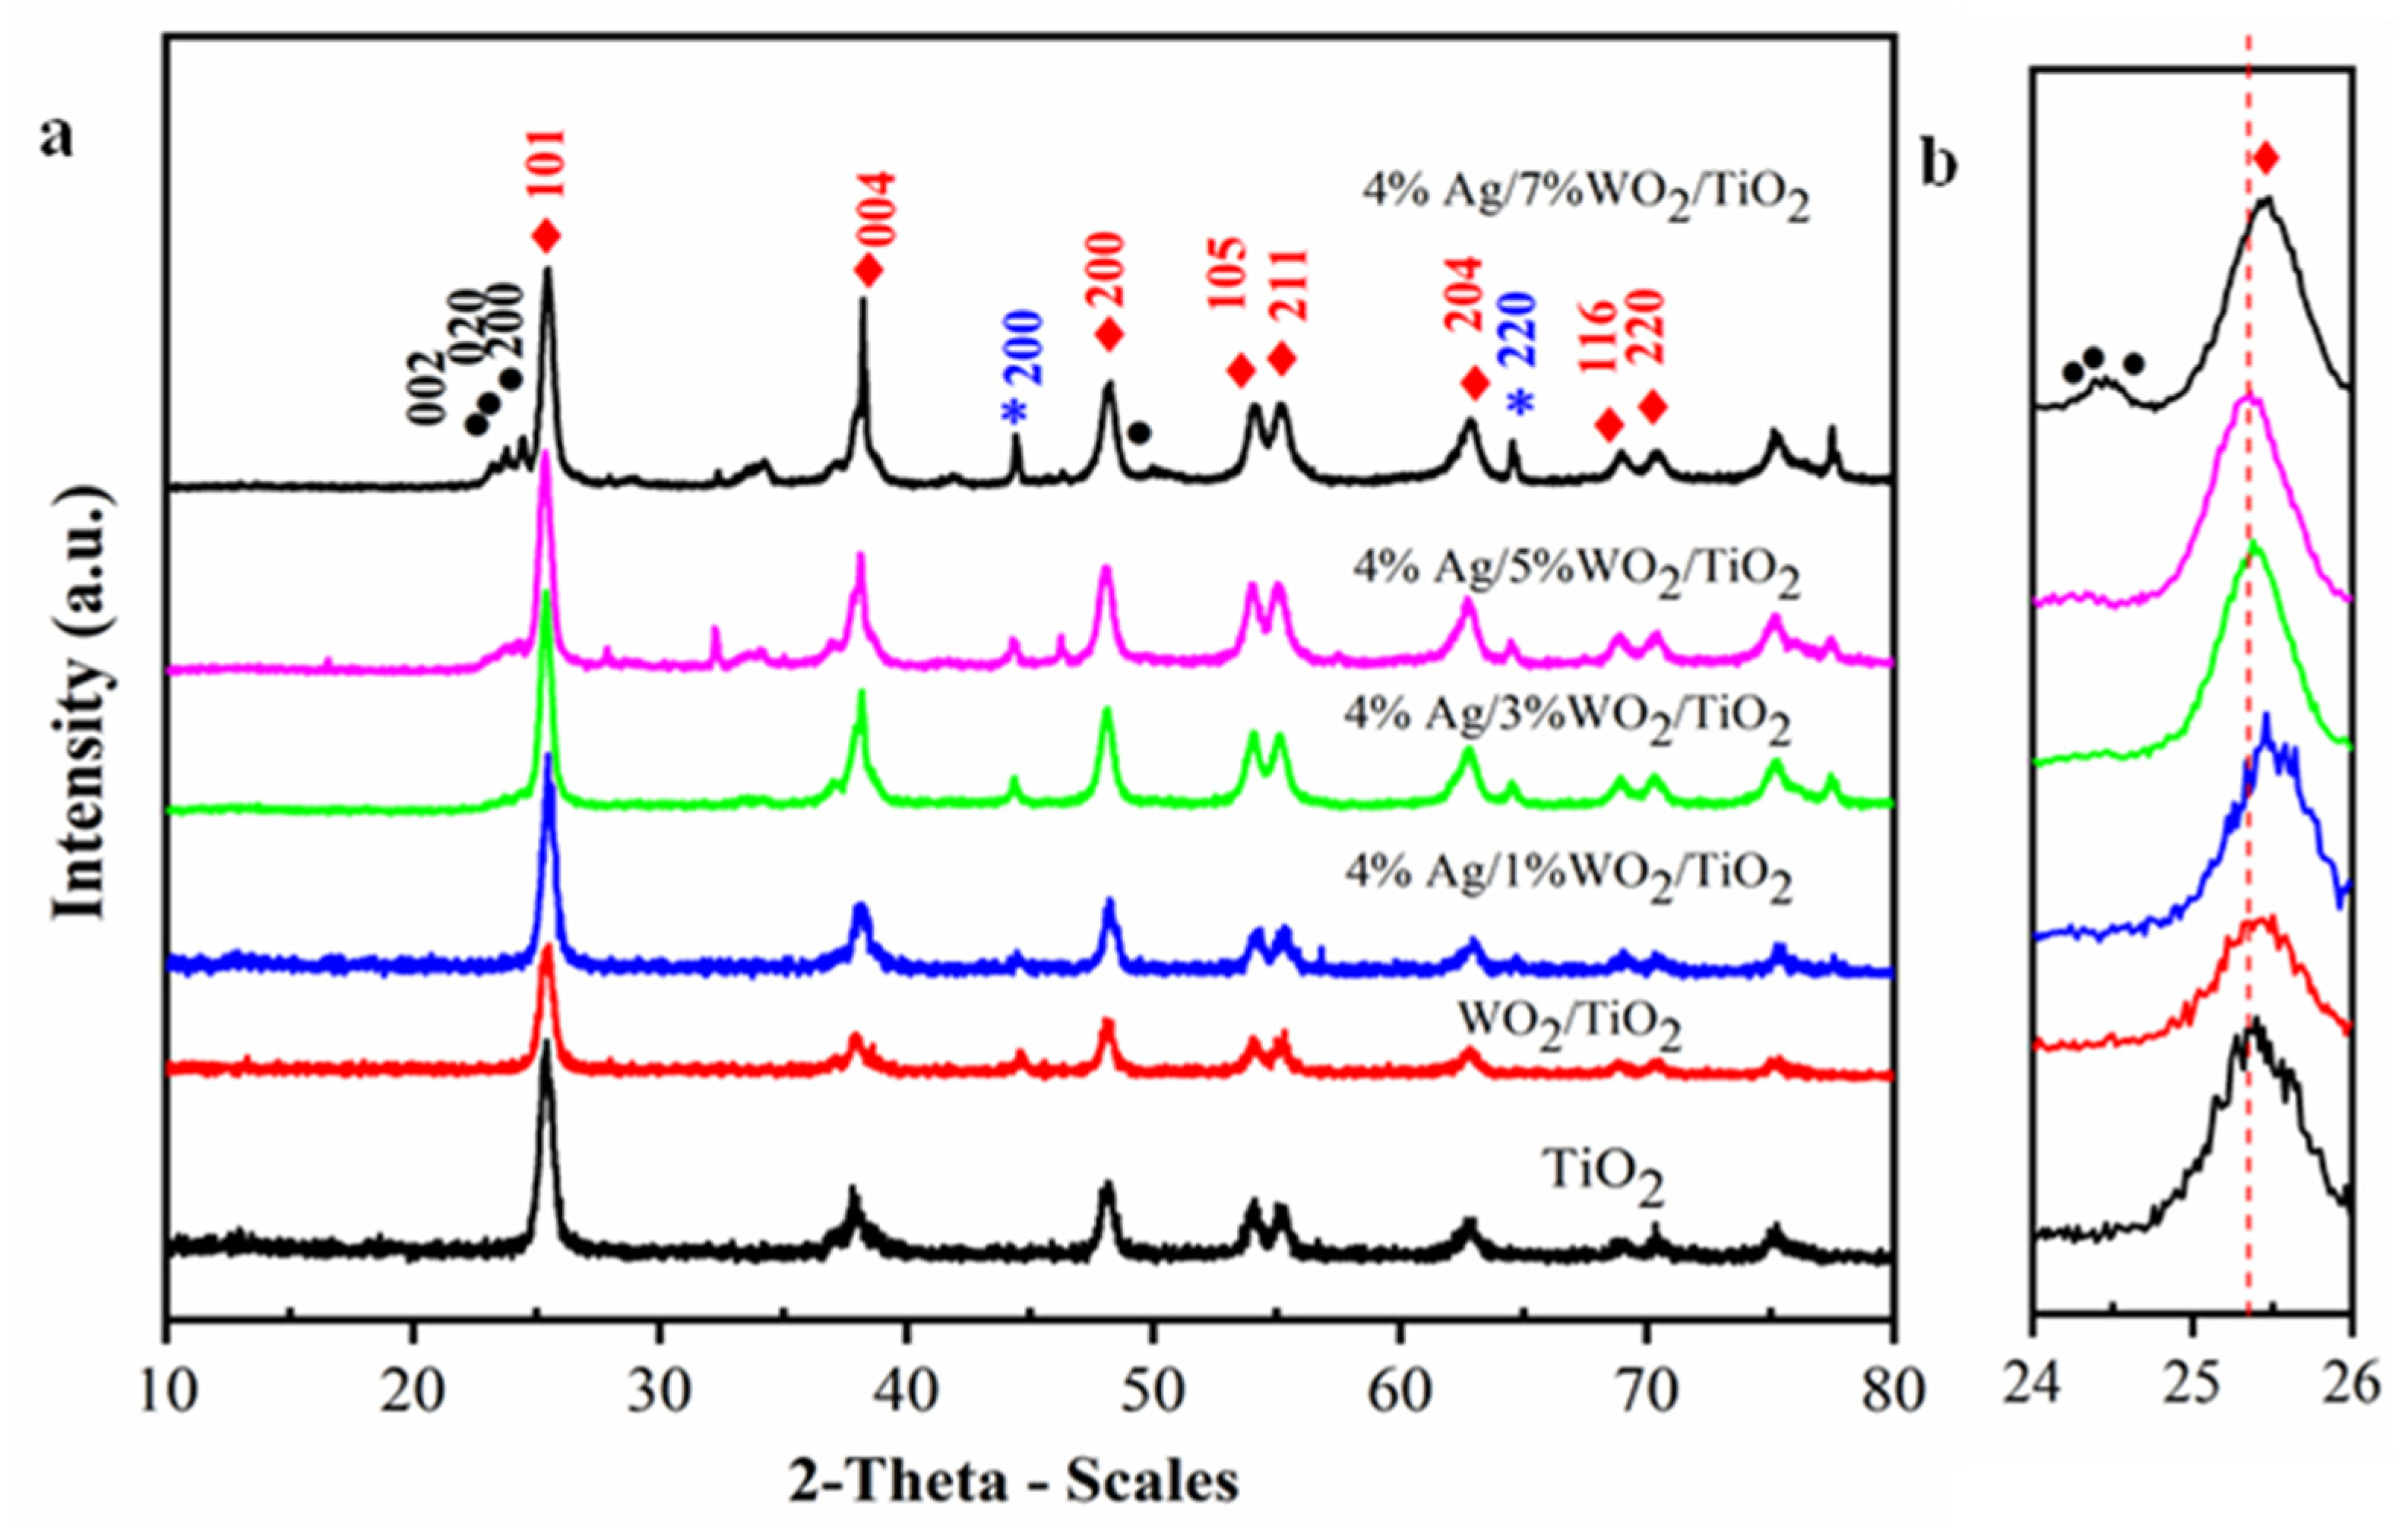
Figure 1. (a) The XRD patterns of the synthesized pure TiO2 and 4% Ag/x%WO3/TiO2 (x = 1, 3, 5, and 7%) nanocomposites; (b) magnification in rang 2θ (25–26).
Catalysts 14 00633 g001
Figure 2. Raman spectra of 1 pure TiO2 and 4% Ag/x%WO3/TiO2 (x = 1, 3, 5, and 7%) nanocomposites.
Catalysts 14 00633 g002
Figure 3. (a,b) TEM images of pure TiO2 and 3%Ag/WO3/TiO2 nanocomposites; (c,d) particle size distributionss (e,f) HRTEM images of interplanar distances; (g,h) selected area electron diffraction (SAED).
Catalysts 14 00633 g003aCatalysts 14 00633 g003b
Figure 4. (a) The adsorption/desorption of BET isotherms, and (b) BJH of pure TiO2 and 4% Ag/x%WO3/TiO2 (x = 1, 3, 5, and 7%) nanocomposites.
Catalysts 14 00633 g004
Figure 5. (a) The relationship among the absorbance and the wavelengths; (b) the relation among the direct (F®E) nanocomposites’ bandgap values with the photon energy (hυ) for pure TiO2 and 4% Ag/x%WO3/TiO2 (x = 1, 3, 5, and 7%) nanocomposites.
Catalysts 14 00633 g005
Figure 6. Photoluminescence spectra of pure TiO2 and 4% Ag/x%WO3/TiO2 (x = 1, 3, 5, and 7%) nanocomposites.
Catalysts 14 00633 g006
Figure 7. (a) Degradation curves of Cr(VI) solution; (b) plots of ln (Co/C) versus irradiation time of pure TiO2 and 4% Ag/x%WO3/TiO2 (x = 1, 3, 5, and 7%) nanocomposites.
Catalysts 14 00633 g007
Figure 8. (a) Degradation curves of MB dye solution; (b) plots of ln (Co/C) versus irradiation time of pure TiO2 and 4% Ag/x%WO3/TiO2 (x = 1, 3, 5, and 7%) nanocomposites.
Catalysts 14 00633 g008
Table 1. The estimated values of D, δ, and ε.
SampleD (nm)δε
Pure TiO217.013.45 × 10−39.27 × 10⁻³
WO3/TiO215.773.50 × 10−39.14 × 10⁻³
4%Ag/1%WO3/TiO215.943.93 × 10−39.90 × 10⁻³
4%Ag/3%WO3/TiO215.913.94 × 10−39.89 × 10⁻³
4%Ag/5%WO3/TiO214.504.75 × 10−310.8 × 10⁻³
4%Ag/7%WO3/TiO213.985.11 × 10−311.2 × 10⁻³
Table 2. The estimated values of the bandgap, SA, PV and Pd.
Bandgap
(eV)
SA
(m2/g)
PV
[cm3 g−1]
Pd
[nm]
Pure TiO23.266.210.262418.983
4%Ag/1%WO3/TiO22.7262.560.260415.854
4%Ag/3%WO3/TiO22.4048.980.07955.9162
4%Ag/5%WO3/TiO22.6959.930.180612.003
4%Ag/7%WO3/TiO22.8263.080.185211.475
Disclaimer/Publisher’s Note: The statements, opinions and data contained in all publications are solely those of the individual author(s) and contributor(s) and not of MDPI and/or the editor(s). MDPI and/or the editor(s) disclaim responsibility for any injury to people or property resulting from any ideas, methods, instructions or products referred to in the content.