
Fused Filament Fabrication of Bio-Based Polyether-Block-Amide Polymers (PEBAX) and Their Related Properties
 ,
,
Abstract
:
1. Introduction
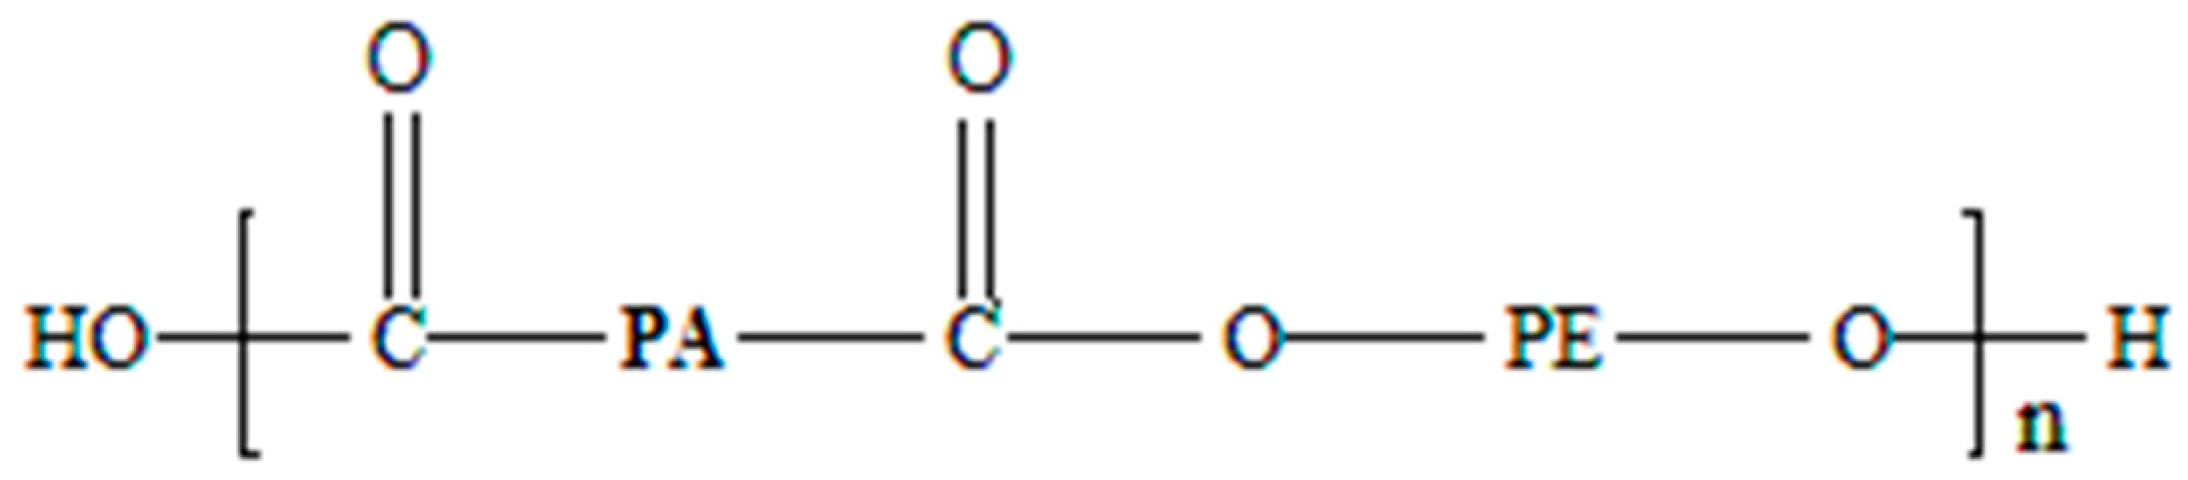
2. Material Characterisation
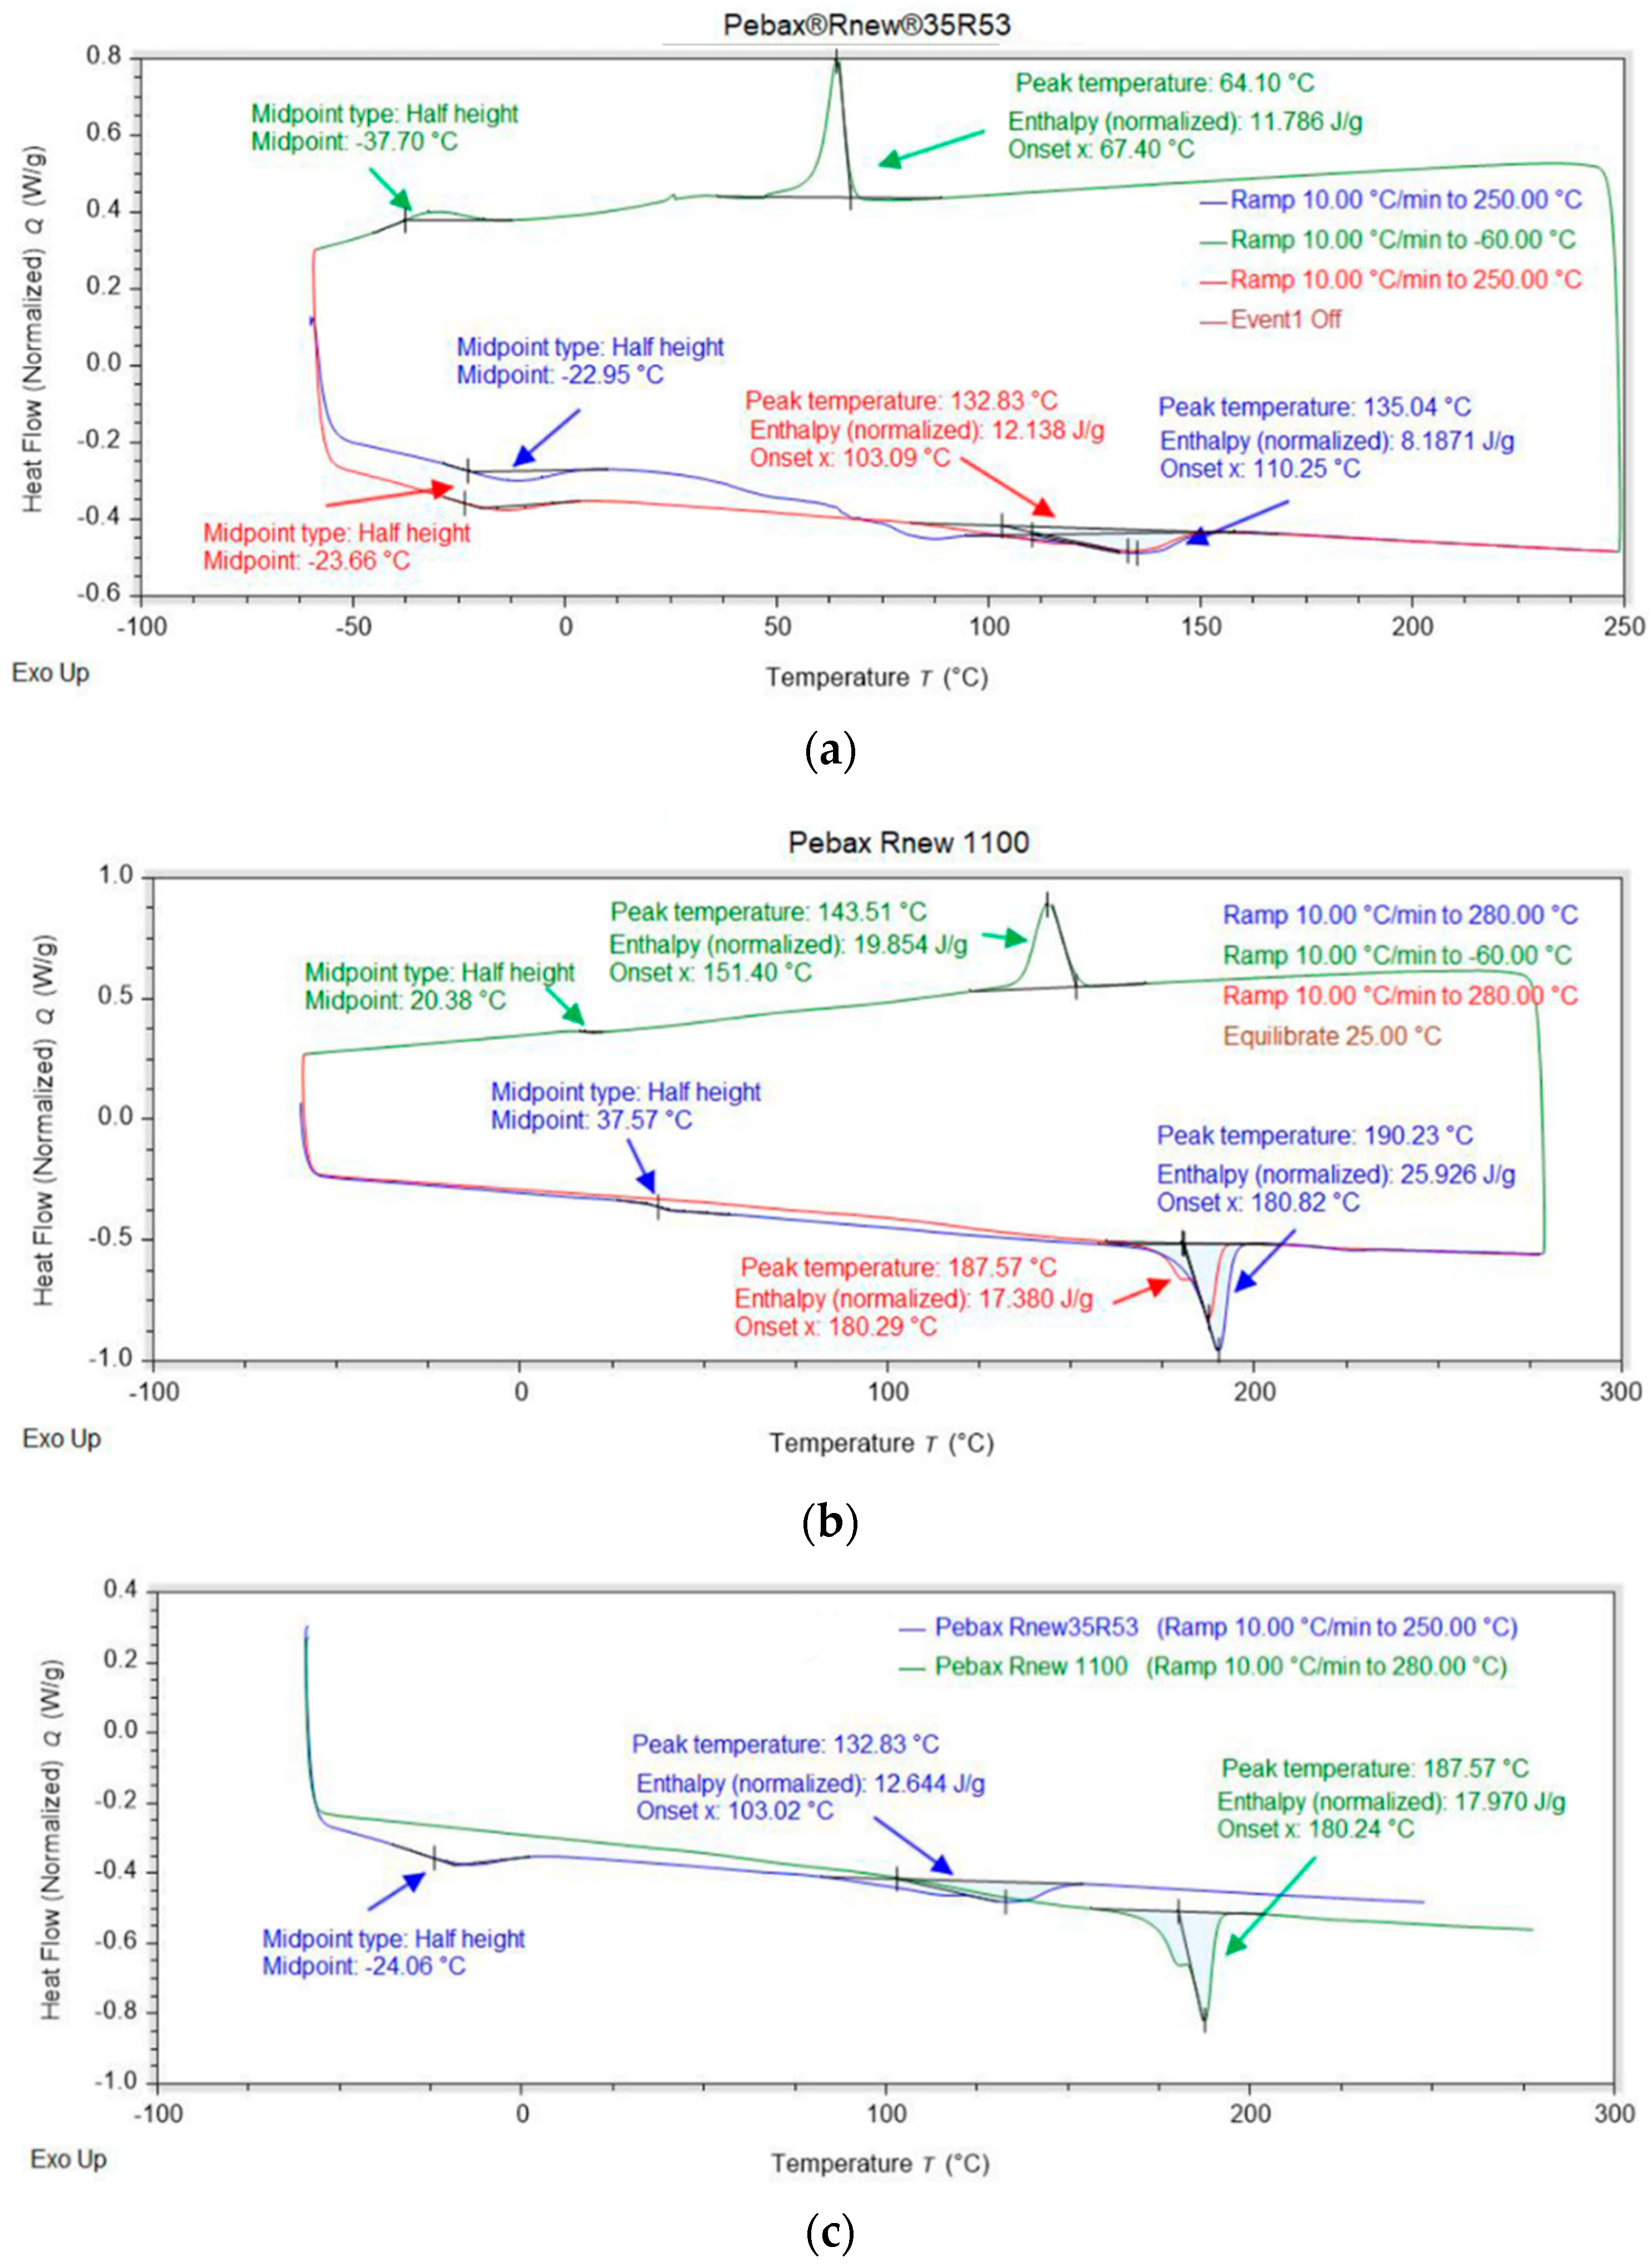
2.1. Analysis of Glass Transition Temperature with Differential Scanning Calorimetry (DSC)
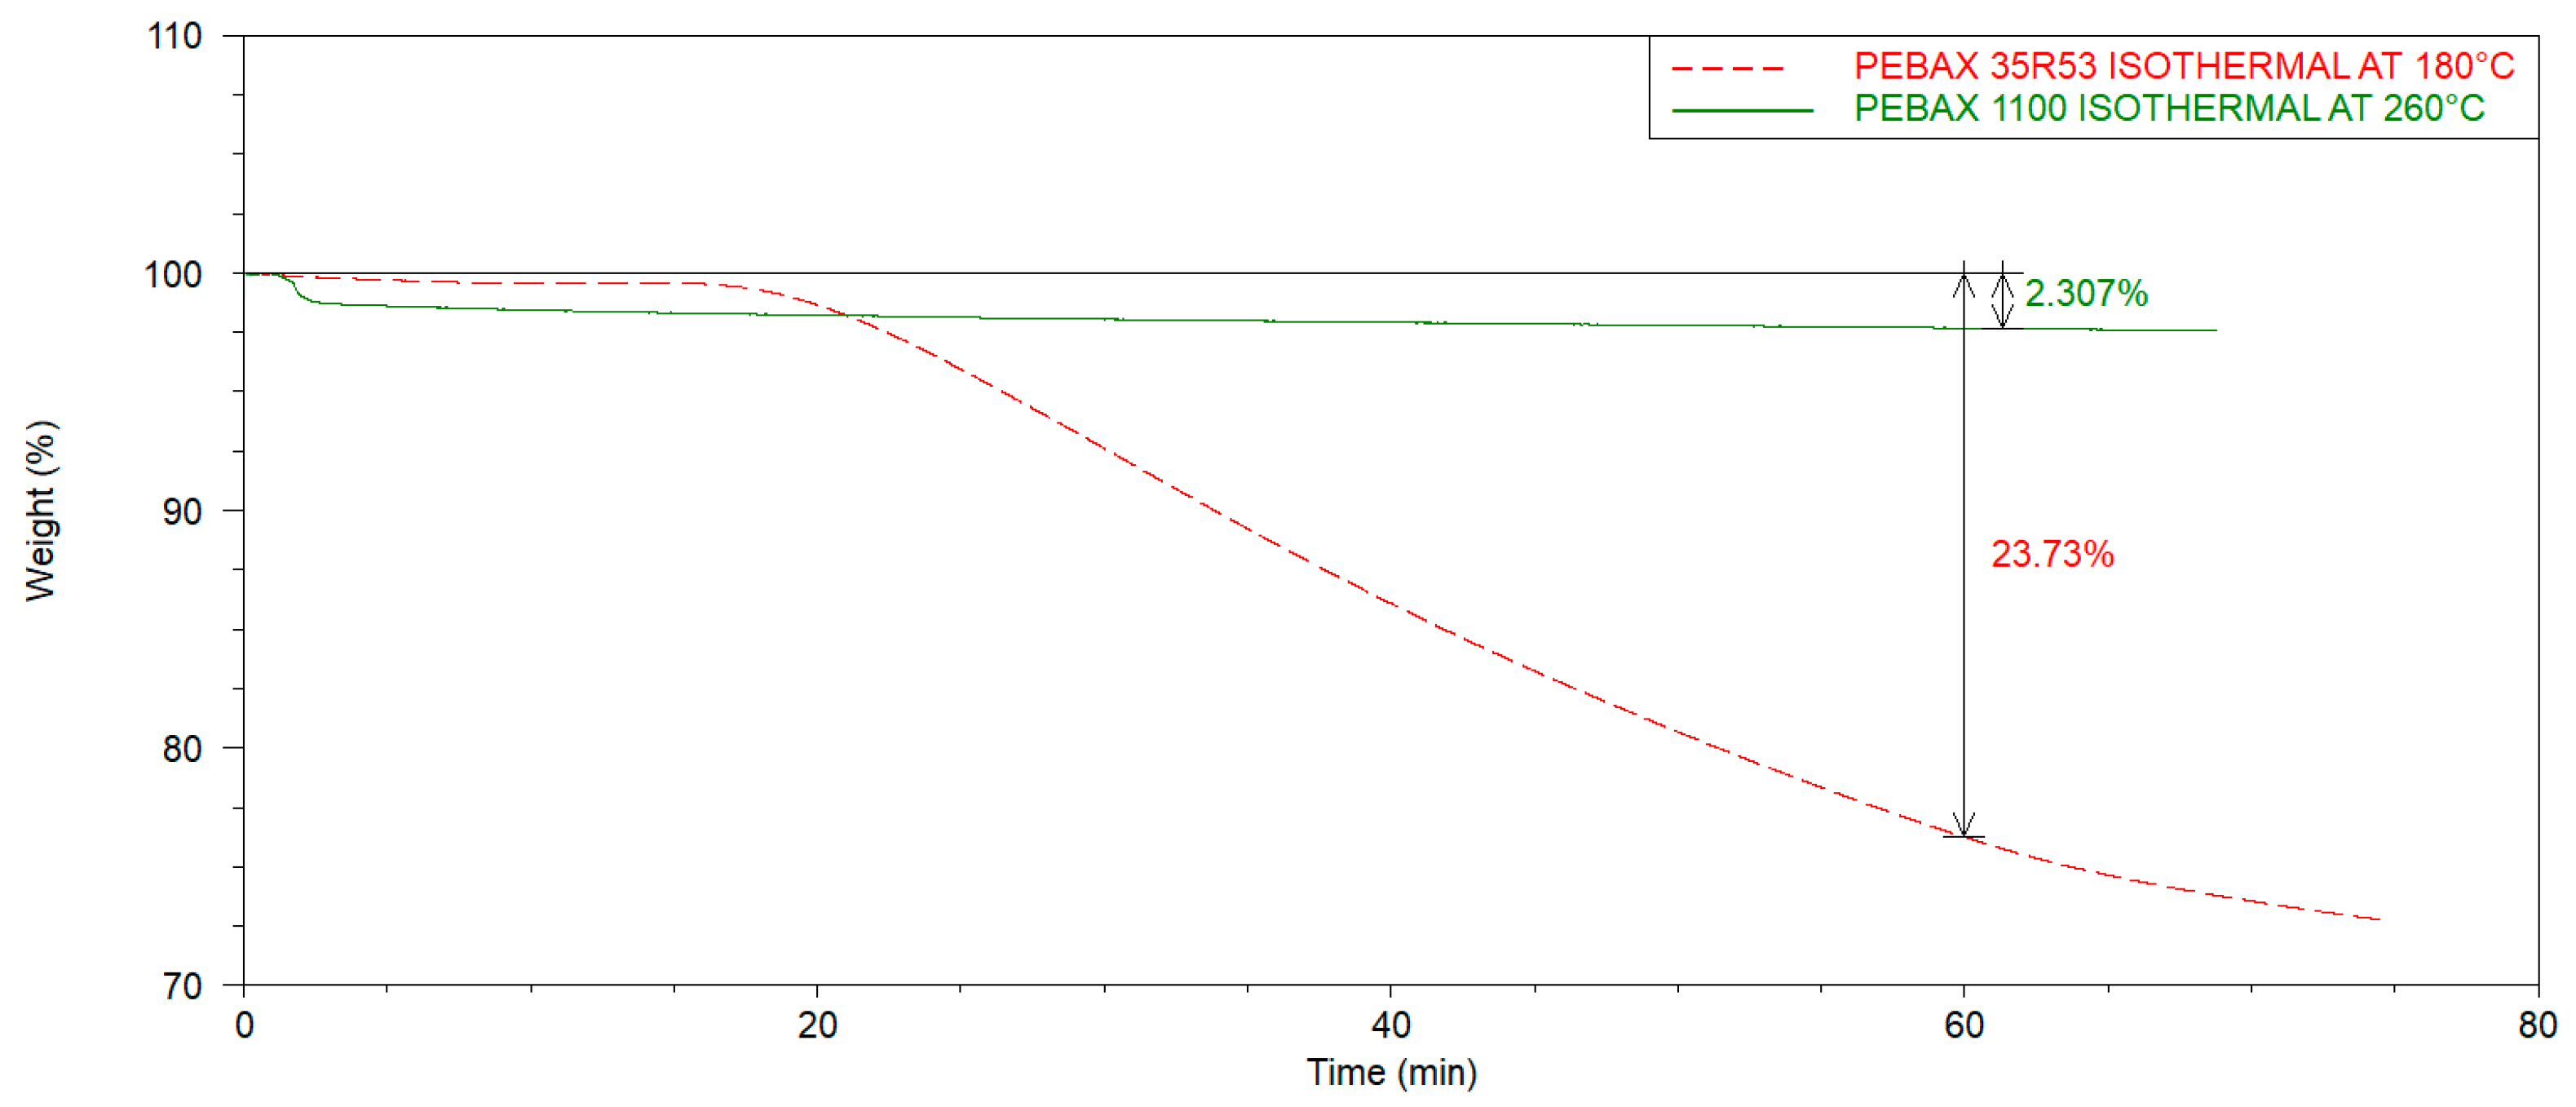
2.2. Thermo-Gravimetric Analysis (TGA)
2.3. Analysis of the Temperature-Dependent Flow Behaviour through Rheometric Studies
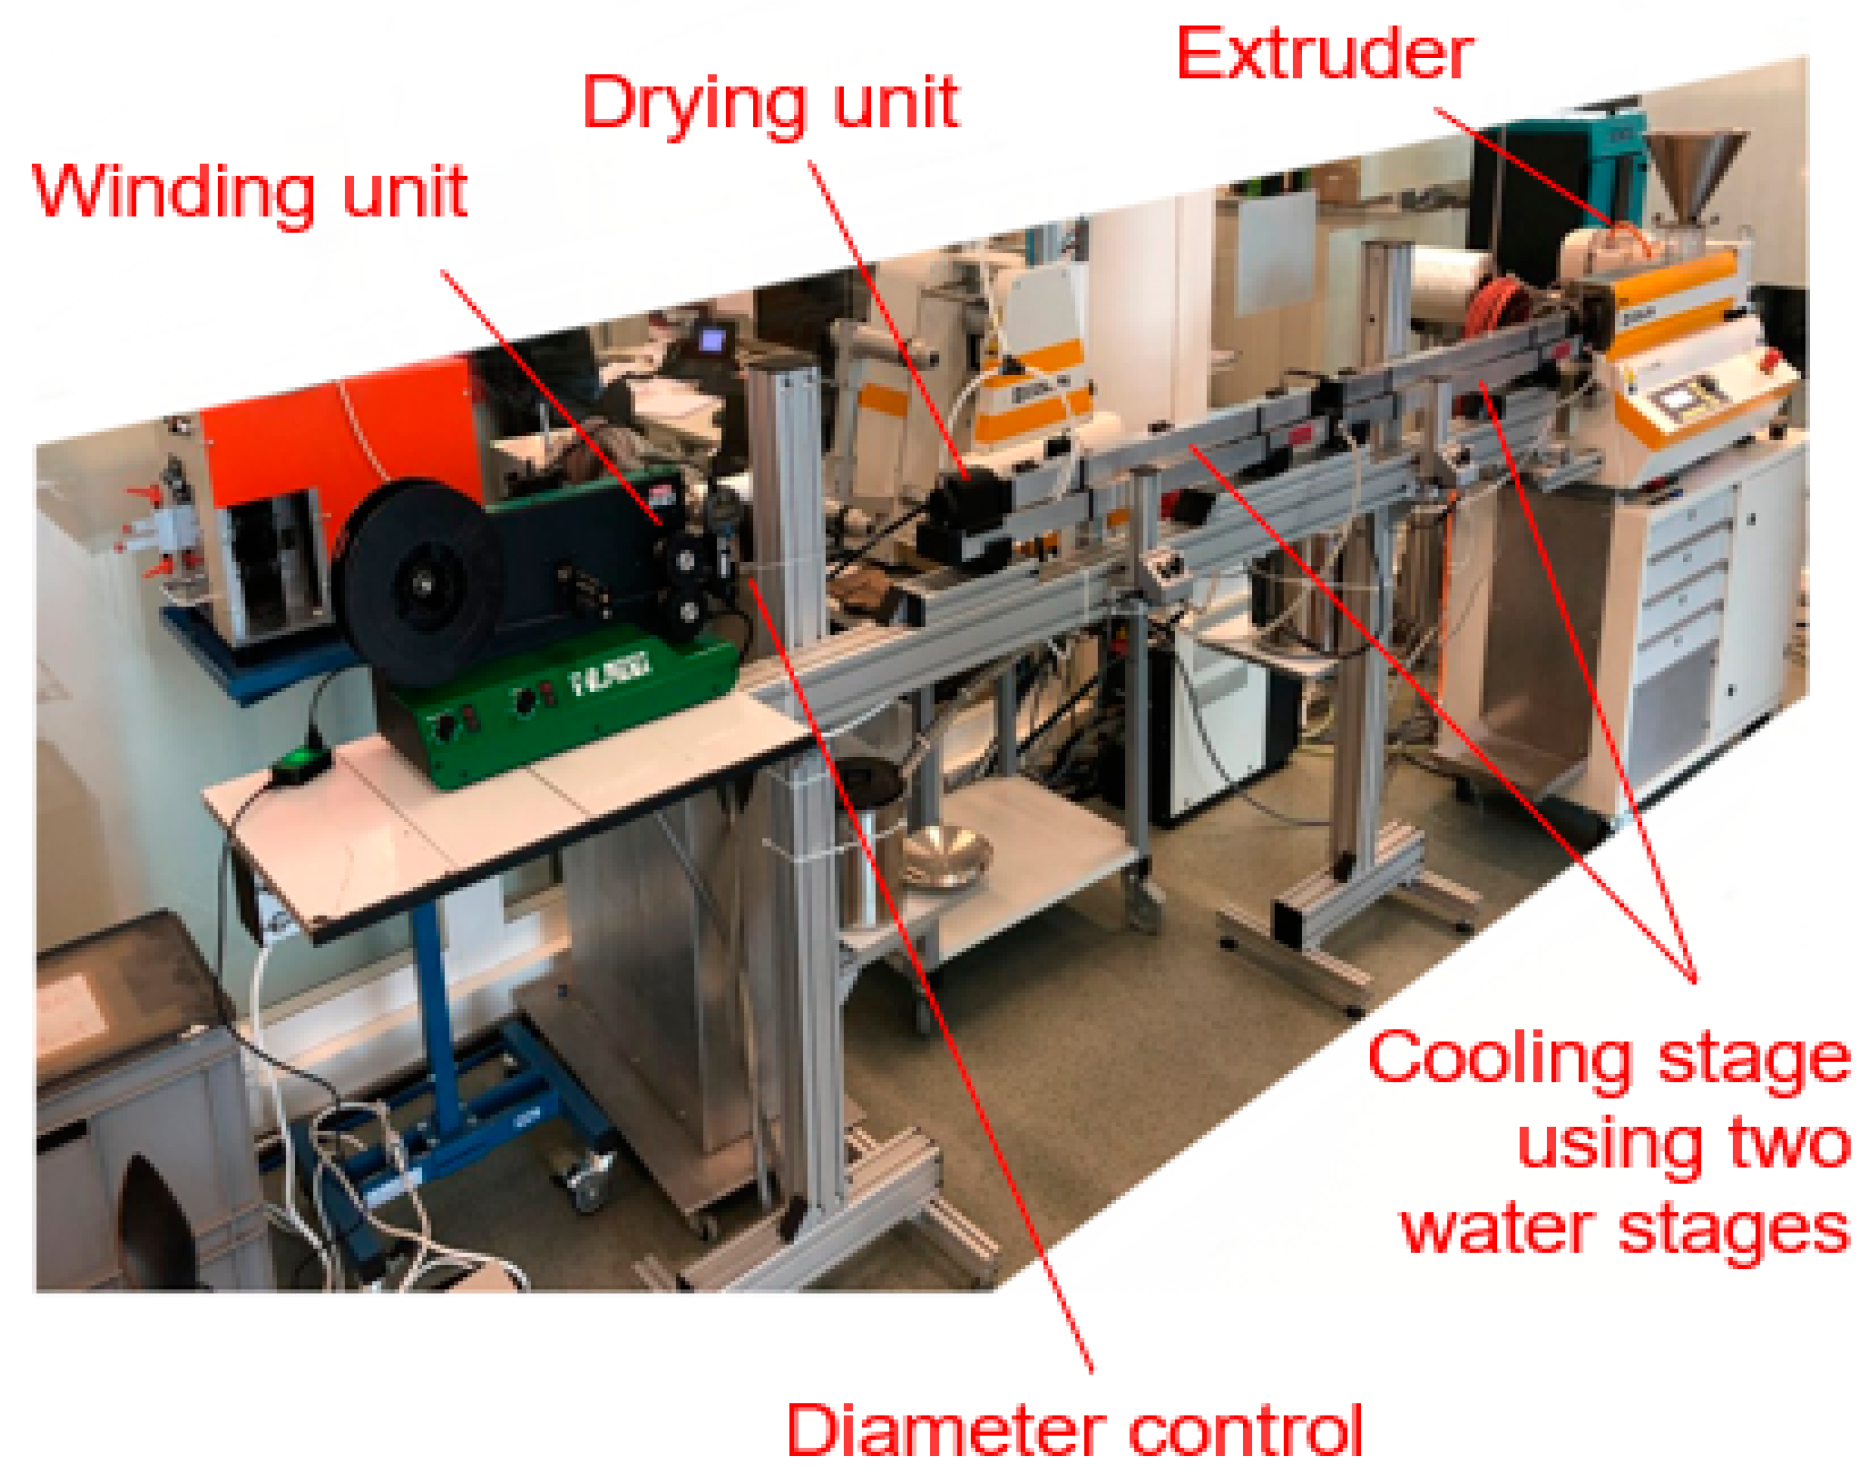
3. Filament Production
4. Specimen Manufacturing and Characterisation
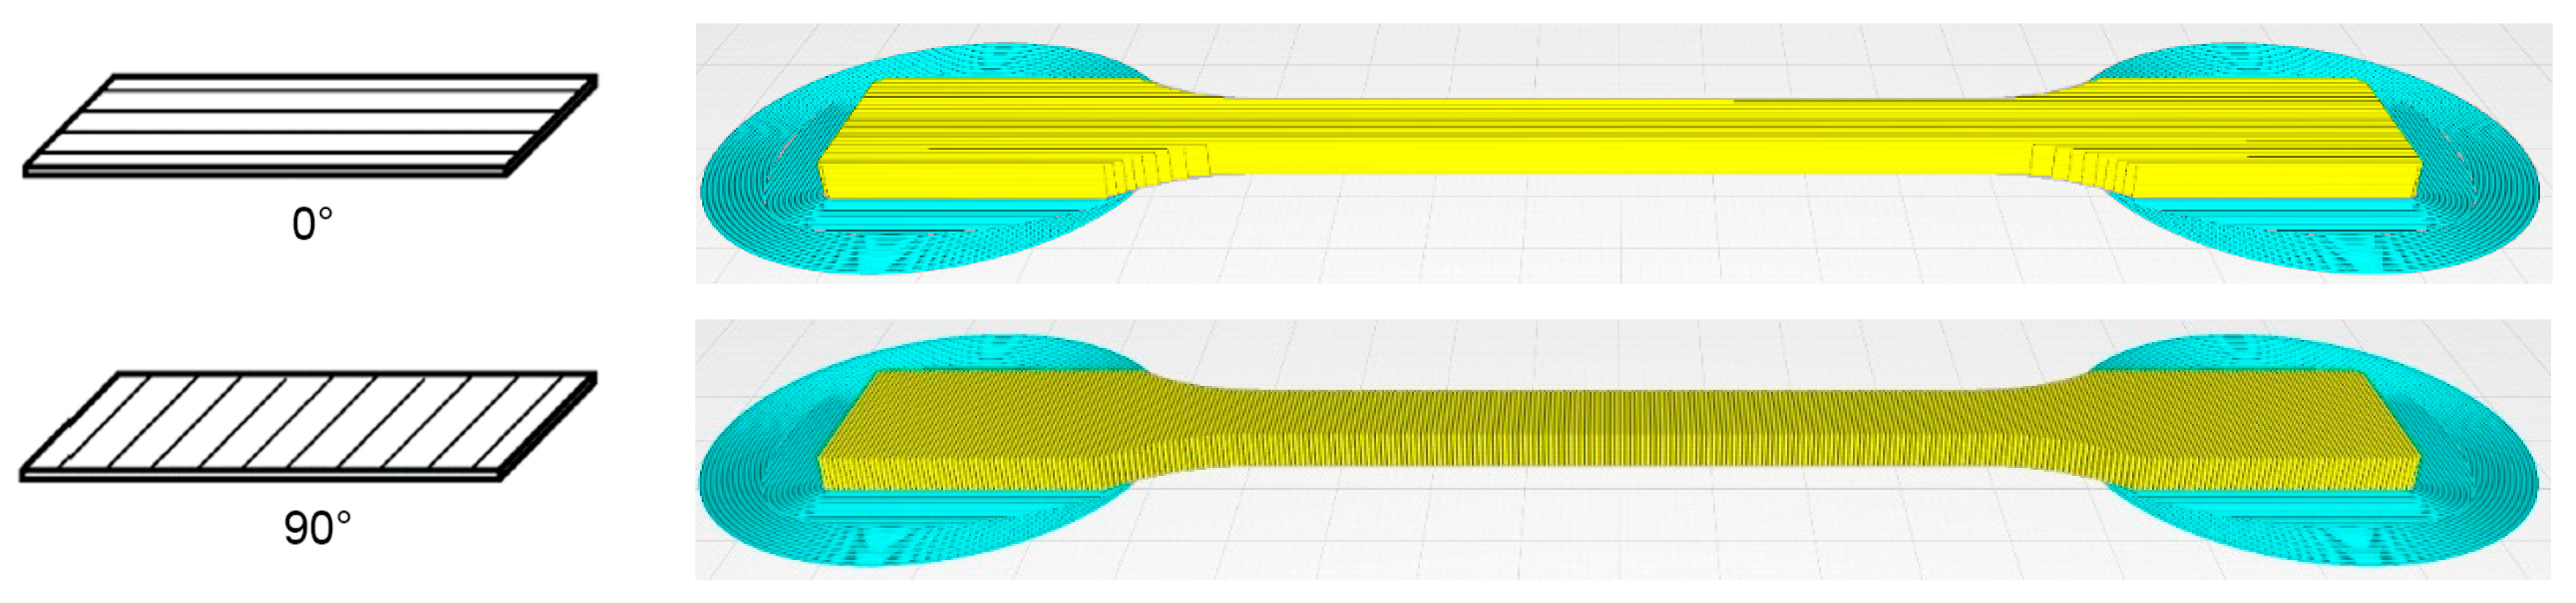
- Structure parameters: infill, construction orientation, grid orientation, layer height, layer width, air gap, and part geometry;
- Manufacturing parameters: temperature gradient, nozzle temperature, printing speed, nozzle diameter, and humidity;
- Material: material properties.
Multi-Material Tensile Testing
5. Conclusions
Author Contributions
Funding
Institutional Review Board Statement
Data Availability Statement
Acknowledgments
Conflicts of Interest
References
- Srivastava, M.; Rathee, S. Additive manufacturing: Recent trends, applications and future outlooks. Prog. Addit. Manuf. 2022, 7, 261–287. [Google Scholar] [CrossRef]
- Meier, M.; Tan, K.H.; Lim, M.K.; Chung, L. Unlocking innovation in the sport industry through additive manufacturing. Bus. Process Manag. J. 2019, 25, 456–475. [Google Scholar] [CrossRef]
- Jenner, F.; Dharmani, S. How the Future of 3D Printing is Taking Shape. Available online: https://www.ey.com/en_gl/advanced-manufacturing/how-the-future-of-3d-printing-is-taking-shape (accessed on 27 September 2022).
- Grieder, S.; Zhilyaev, I.; Küng, M.; Brauner, C.; Akermann, M.; Bosshard, J.; Inderkum, P.; Francisco, J.; Willemin, Y.; Eichenhofer, M. Consolidation of Additive Manufactured Continuous Carbon Fiber Reinforced Polyamide 12 Composites and the Development of Process-Related Numerical Simulation Methods. Polymers 2022, 14, 3429. [Google Scholar] [CrossRef] [PubMed]
- Kurzynowski, T.; Pawlak, A.; Smolina, I. The potential of SLM technology for processing magnesium alloys in aerospace industry. Arch. Civ. Mech. Eng. 2020, 20, 23. [Google Scholar] [CrossRef] [Green Version]
- Auricchio, F.; Marconi, S. 3D printing: Clinical applications in orthopaedics and traumatology. EFORT Open Rev. 2016, 1, 121–127. [Google Scholar] [CrossRef] [PubMed]
- Karevska, S.; Steinberg, G.; Müller, A.; Wienken, R.; Kilger, C.; Krauss, D. 3D Printing: Hype or Game Changer? Available online: https://assets.ey.com/content/dam/ey-sites/ey-com/en_gl/topics/advisory/ey-3d-printing-game-changer.pdf (accessed on 27 September 2022).
- Kamalpreet, S.; Sunpreet, S.; Chander, P.; Karupppasamy, S.S.R. Sustainability for 3D Printing; Springer: Cham, Switzerland, 2022; ISBN 978-3-030-752347. [Google Scholar]
- Pal, A.K.; Mohanty, A.K.; Misra, M. Additive manufacturing technology of polymeric materials for customised products: Recent developments and future prospective. RSC Adv. 2021, 11, 36398–36438. [Google Scholar] [CrossRef] [PubMed]
- Arkema a Very Special Kind of Polymer Chemistry. Available online: https://pebaxpowered.arkema.com/en/pebax-technology/ (accessed on 27 September 2022).
- Lligadas, G.; Ronda, J.C.; Galià, M.; Cádiz, V. Renewable polymeric materials from vegetable oils: A perspective. Mater. Today 2013, 16, 337–343. [Google Scholar] [CrossRef]
- Koh, M.H.; Kim, H.; Shin, N.; Kim, H.S.; Yoo, D.; Kim, Y.G. Divergent process for C 10, C 11 and C 12 ω-amino acid and α,ω-dicarboxylic acid monomers of polyamides from castor oil as a renewable resource. Bull. Korean Chem. Soc. 2012, 33, 1873–1878. [Google Scholar] [CrossRef] [Green Version]
- Tuhin, M.O.; Ryan, J.J.; Sadler, J.D.; Han, Z.; Lee, B.; Smith, S.D.; Pasquinelli, M.A.; Spontak, R.J. Microphase-Separated Morphologies and Molecular Network Topologies in Multiblock Copolymer Gels. Macromolecules 2018, 51, 5173–5181. [Google Scholar] [CrossRef]
- Bates, F.S. Polymer-polymer phase behavior. Science 1991, 4996, 898–905. [Google Scholar] [CrossRef] [PubMed]
- Car, A. Polyether Block Amide (PEBAX). In Encyclopedia of Membranes; Drioli, E., Giorno, L., Eds.; Springer: Berlin/Heidelberg, Germany, 2014. [Google Scholar]
- Datasheet Pebax® Rnew® 35R53 SP 01. Available online: https://www.materialdatacenter.com/ms/en/Pebax/Arkema/Pebax%C2%AE+Rnew%C2%AE+35R53+SP+01/2e6a1621/264 (accessed on 28 September 2022).
- Filaflex 70A. Available online: https://recreus.com/de/filamente/6-filaflex-70a.html (accessed on 24 October 2022).
- FIBERFLEX 30D. Available online: https://fiberlogy.com/de/filamente/fiberflex-30d/ (accessed on 24 October 2022).
- Filaflex Purifier. Available online: https://recreus.com/de/filamente/14-filaflex-purifier.html (accessed on 24 October 2022).
- Arnitel® ID 2045 Natural. Available online: https://www.3djake.ch/de-CH/formfutura/arnitelr-id-2045-natural (accessed on 24 October 2022).
- Kimya TPU-92A. Available online: https://www.kimya.fr/de/produkt/tpu-92a-kimya-3d-filament/ (accessed on 24 October 2022).
- TPU 95A. Available online: https://ultimaker.com/de/materials/tpu-95a (accessed on 24 October 2022).
- Datasheet PEBAX®RNEW®1100. Available online: https://www.arkema.com/global/en/products/product-finder/product-range/technicalpolymers/pebax-product-family/ (accessed on 25 October 2022).
- Kaiser, W. Kunststoffchemie für Ingenieure; 3. Auflage.; Carl Hanser Verlag GmbH & Co. KG: Munich, Germany, 2021. [Google Scholar]
- Mark, J.E. Polymer Data Handbook, 2nd ed.; Oxford University Press: New York, NY, USA, 2009; ISBN 9780195181012. [Google Scholar]
- Brauner, C.; Küng, M.; Arslan, D.; Maurer, C. Fused filament fabrication based on polyhydroxy ether (Phenoxy) polymers and related properties. Polymers 2021, 13, 1549. [Google Scholar] [CrossRef] [PubMed]
- Cuan-Urquizo, E.; Barocio, E.; Tejada-Ortigoza, V.; Pipes, R.B.; Rodriguez, C.A.; Roman-Flores, A. Characterization of the mechanical properties of FFF structures and materials: A review on the experimental, computational and theoretical approaches. Materials 2019, 12, 895. [Google Scholar] [CrossRef] [PubMed] [Green Version]
- DIN EN ISO 527-1:2019-12. Available online: https://www.beuth.de/de/norm/din-en-iso-527-1/306958894 (accessed on 29 September 2022).
- Luo, C.; Mrinal, M.; Wang, X.; Hong, Y. Bonding widths of deposited polymer strands in additive manufacturing. Materials 2021, 14, 871. [Google Scholar] [CrossRef] [PubMed]
- Floor, J.; Van Deursen, B.; Tempelman, E. Tensile strength of 3D printed materials: Review and reassessment of test parameters. Mater. Test. 2018, 60, 679–686. [Google Scholar] [CrossRef]
- Ahlers, D.; Wasserfall, F.; Hendrich, N.; Zhang, J. 3D printing of nonplanar layers for smooth surface generation. In Proceedings of the IEEE International Conference on Automation Science and Engineering, Vancouver, BC, Canada, 22–26 August 2019; Volume 2019. [Google Scholar]


| Material | References | Manufacturer | Shore-Hardness | Young’s Modulus | Density |
|---|---|---|---|---|---|
| Pebax®Rnew®35R53 | [16] | Arkema (Colombes, France) | 25 D | 40 MPa | 1.02 g/cm3 |
| 70A Filaflex Ultra-Soft | [17] | Recreus (Elda, Spain) | 22 D/70 A | 32 MPa | 1.08 g/cm3 |
| FiberFlex 30D | [18] | Fiberlogy (Brzezie, Poland) | 30 D | - | 1.07 g/cm3 |
| Filaflex Purifier | [19] | Recreus (Elda, Spain) | 31 D | 20 MPa | 1.17 g/cm3 |
| Arnitel® ID 2045 TPC | [20] | Formfutura (Nijmegen, Netherlands) | 34 D | 29 MPa | 1.10 g/cm3 |
| Kimya TPU-92A | [21] | Kimya (Nantes, France) | 40 D/92 A | 90 MPa | 1.16 g/cm3 |
| TPU 95A | [22] | Ultimaker (Utrecht, Netherlands) | 95 A | 26 MPa | 1.22 g/cm3 |
| Property | Pebax®Rnew®35R53 [16] | Pebax®Rnew®1100 [23] |
|---|---|---|
| Amount of PA11 | 29 % (ASTM D6866) | 65% (-) |
| Melting temperature | 135 °C (ISO 11357-1/-3) | 188 °C (ISO 11357) |
| Density | 1020 kg/m3 (ISO 1183) | 980 kg/m3 (ISO 1183) |
| Young’s Modulus | 40 MPa (ISO 527-1/-2) | 1160 MPa (ISO 178) |
| Shore D Hardness | 25 (ISO 7619-1) | 68 (ISO 868) |
| Property | Pebax®Rnew®35R53 [16] | Pebax®Rnew®1100 [23] | PA11 [25] |
|---|---|---|---|
| (datasheet) | - | - | 42 °C |
| (DSC) | −23 °C | 37.57 °C | - |
| (datasheet) | 135 °C | 188 °C | 188 °C |
| (DSC) | 132.83 °C | 187.57 °C | - |
| Parameter | Pebax®Rnew®35R53 | Pebax®Rnew®1100 |
|---|---|---|
| Extruder zone 1 (Feed) | 40 °C | 40 °C |
| Extruder zone 2 | 205 °C | 230 °C |
| Extruder zone 3 | 200 °C | 245 °C |
| Extruder zone 4 | 190 °C | 250 °C |
| Extruder zone 7 (nozzle) | 190 °C | 250 °C |
| Water reservoir 1 | 45 °C | 35 °C |
| Water reservoir 2 | 25 °C | 25 °C |
| Extruder speed | 60 U/min | 19.2 U/min |
| Pressure | 15 bar | 70 bar |
| Haul-off speed | 156 mm/s | 163 mm/s |
| Feed rate | 1.36 kg/h | 1.42 kg/h |
| Parameter | ISO 527-1 | ISO 37 |
|---|---|---|
| Specimens |  | 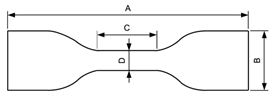 |
| Test speed | 1–500 mm/min | 200–500 mm/min |
| Results | Yield stress Breaking stress Tensile strength Elongation at yield Elongation at break (Tensile) modulus of elasticity | Tensile strength at break Elongation at break Tensile stress at 100% elongation Tensile stress at 200% elongation Tensile stress at 300% elongation |
| Parameter | Pebax®Rnew®35R53 | Pebax®Rnew®1100 |
|---|---|---|
| Layer height | 0.15 mm | 0.15 mm |
| Line width (0.6 Nozzle) | 0.55 mm | 0.55 mm |
| Material flow | 100% | 100% |
| Nozzle temperature | 230 °C | 260 °C |
| Print bed temperature | 50 °C | 100 °C |
| Print speed | 20 mm/s | 25 mm/s |
| Cooling | 0% | 0% |
| Parameter | Pebax®Rnew®35R53 | Pebax®Rnew®1100 |
|---|---|---|
| Layer height | 0.15 mm | 0.15 mm |
| Line width (0.6 Nozzle) | 0.55 mm | 0.55 mm |
| Material flow | 100% | 100% |
| Nozzle temperature | 230 °C | 270 °C |
| Print bed temperature | 50 °C | 100 °C |
| Print speed | 15 mm/s | 15 mm/s |
| Cooling | 100% | 100% |
| Retraction | 0.85 mm | 3 mm |
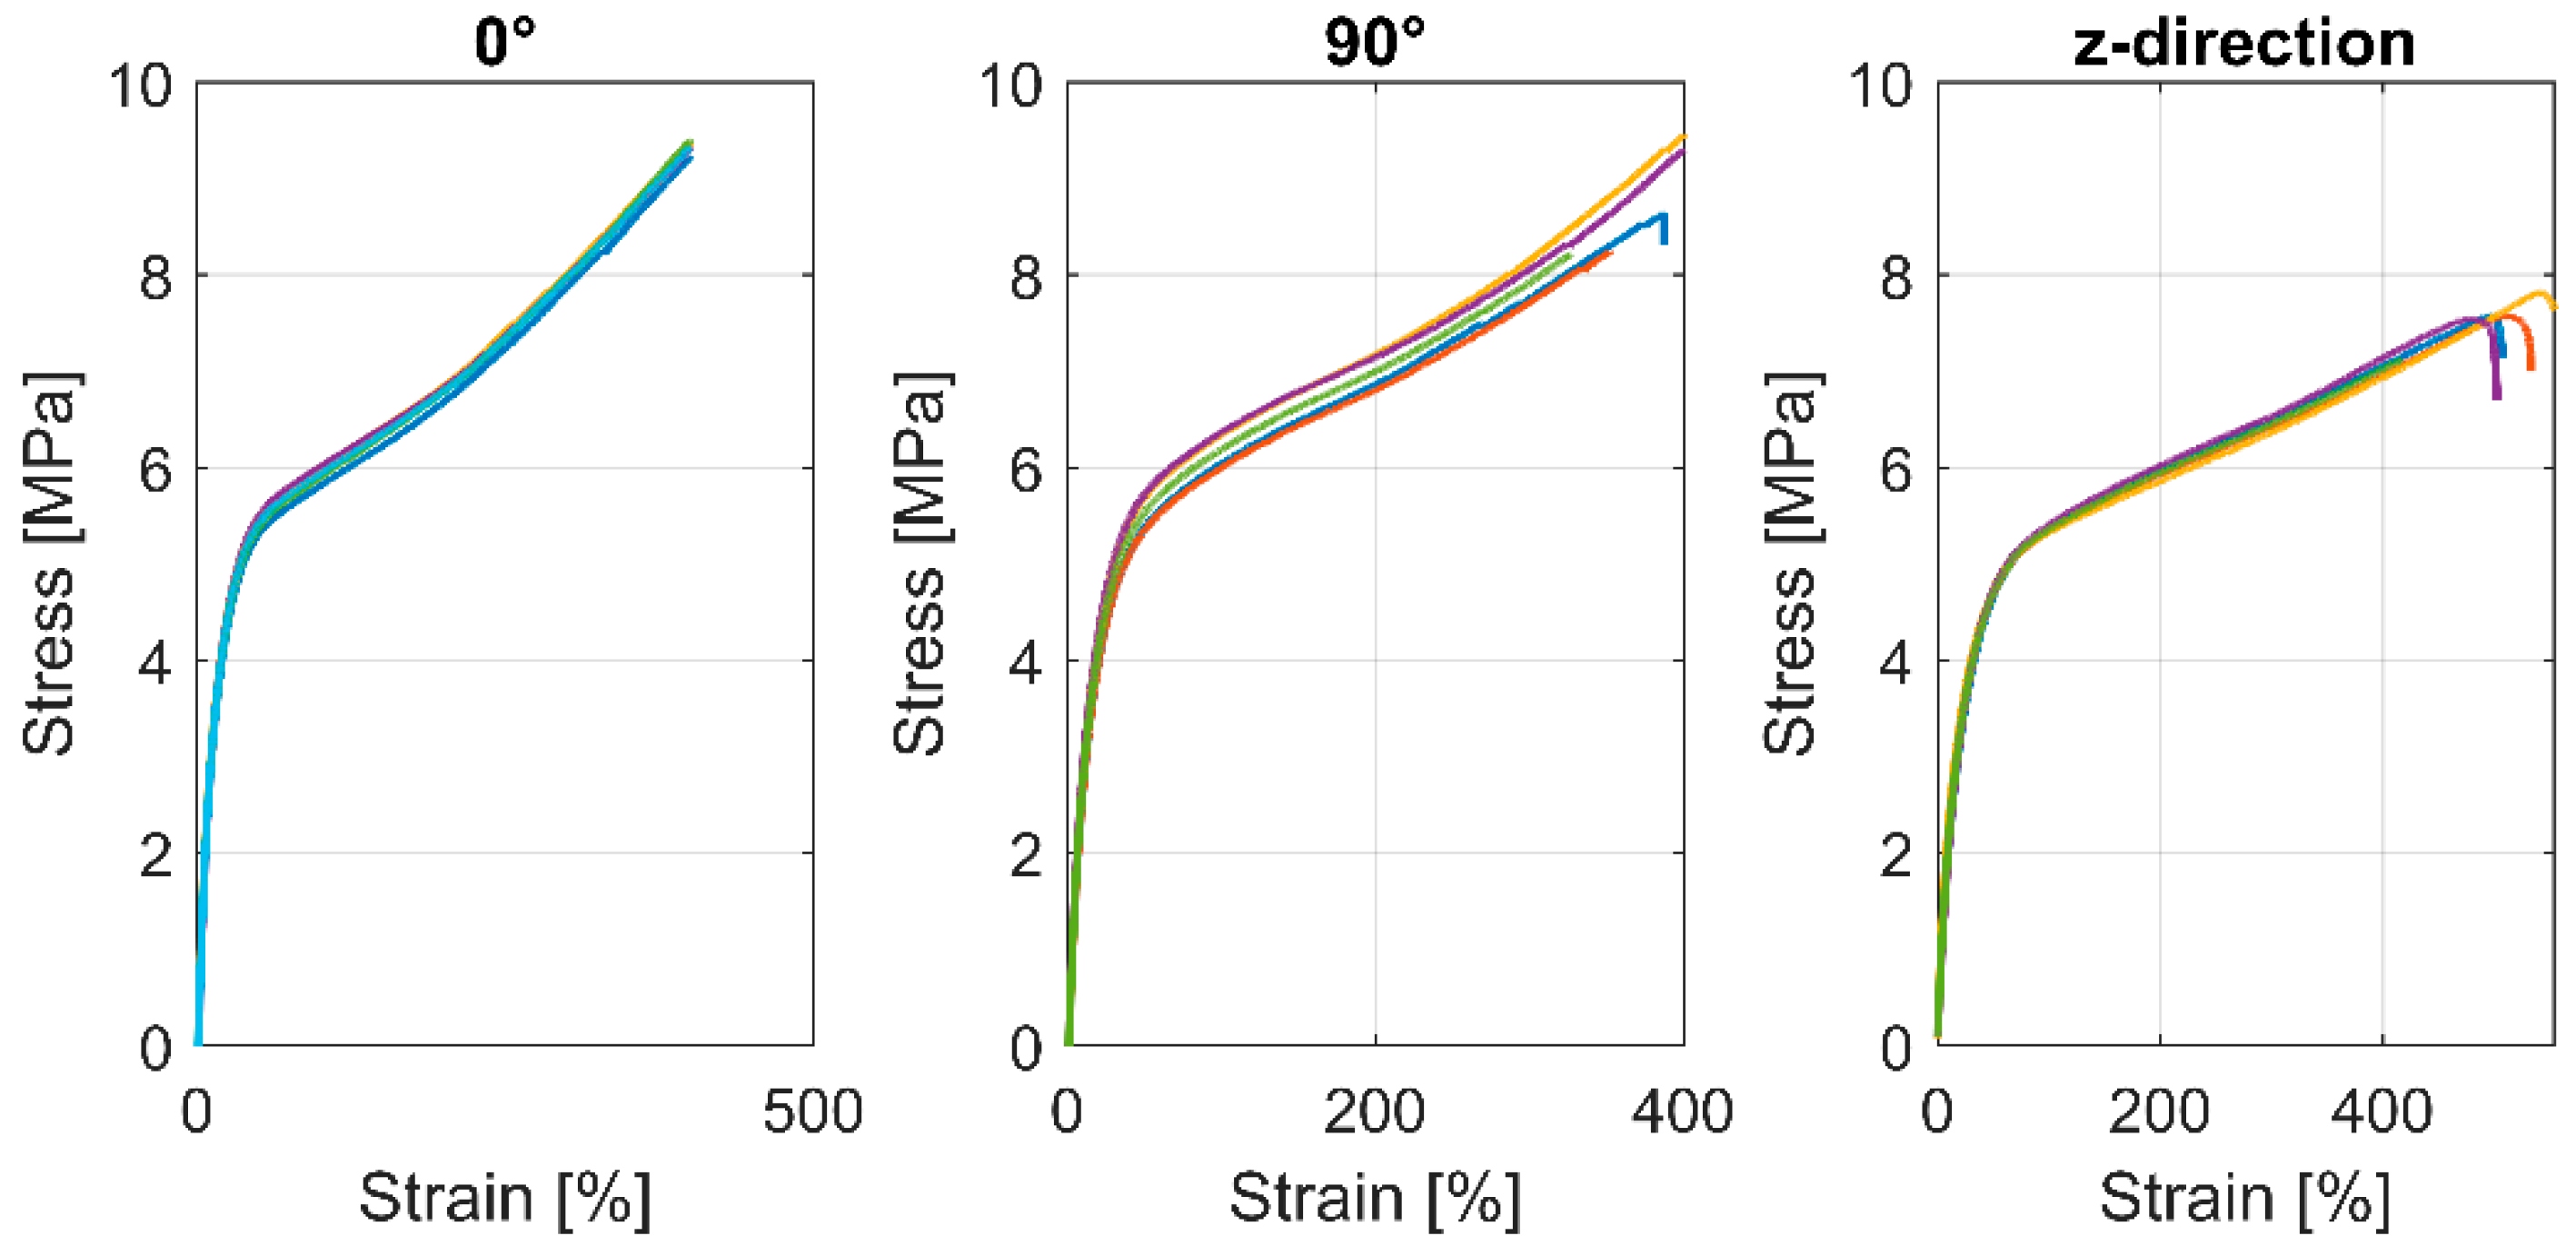
| Direction | Young’s Modulus | Tensile Stress at 100% Elongation | Tensile Stress at 200% Elongation | Tensile Strength at Break |
|---|---|---|---|---|
| 0° | 3.83 ± 1.6 MPa | 5.93 ± 0.1 MPa | 6.79 ± 0.1 MPa | 9.61 ± 0.1 MPa |
| 90° | 6.49 ± 5.8 MPa | 6.19 ± 0.2 MPa | 7.00 ± 0.2 MPa | 7.98 ± 2.2 MPa |
| Z-direction | 16.12 ± 3.2 MPa | 5.36 ± 0.0 MPa | 5.94 ± 0.1 MPa | 7.07 ± 1.1 MPa |
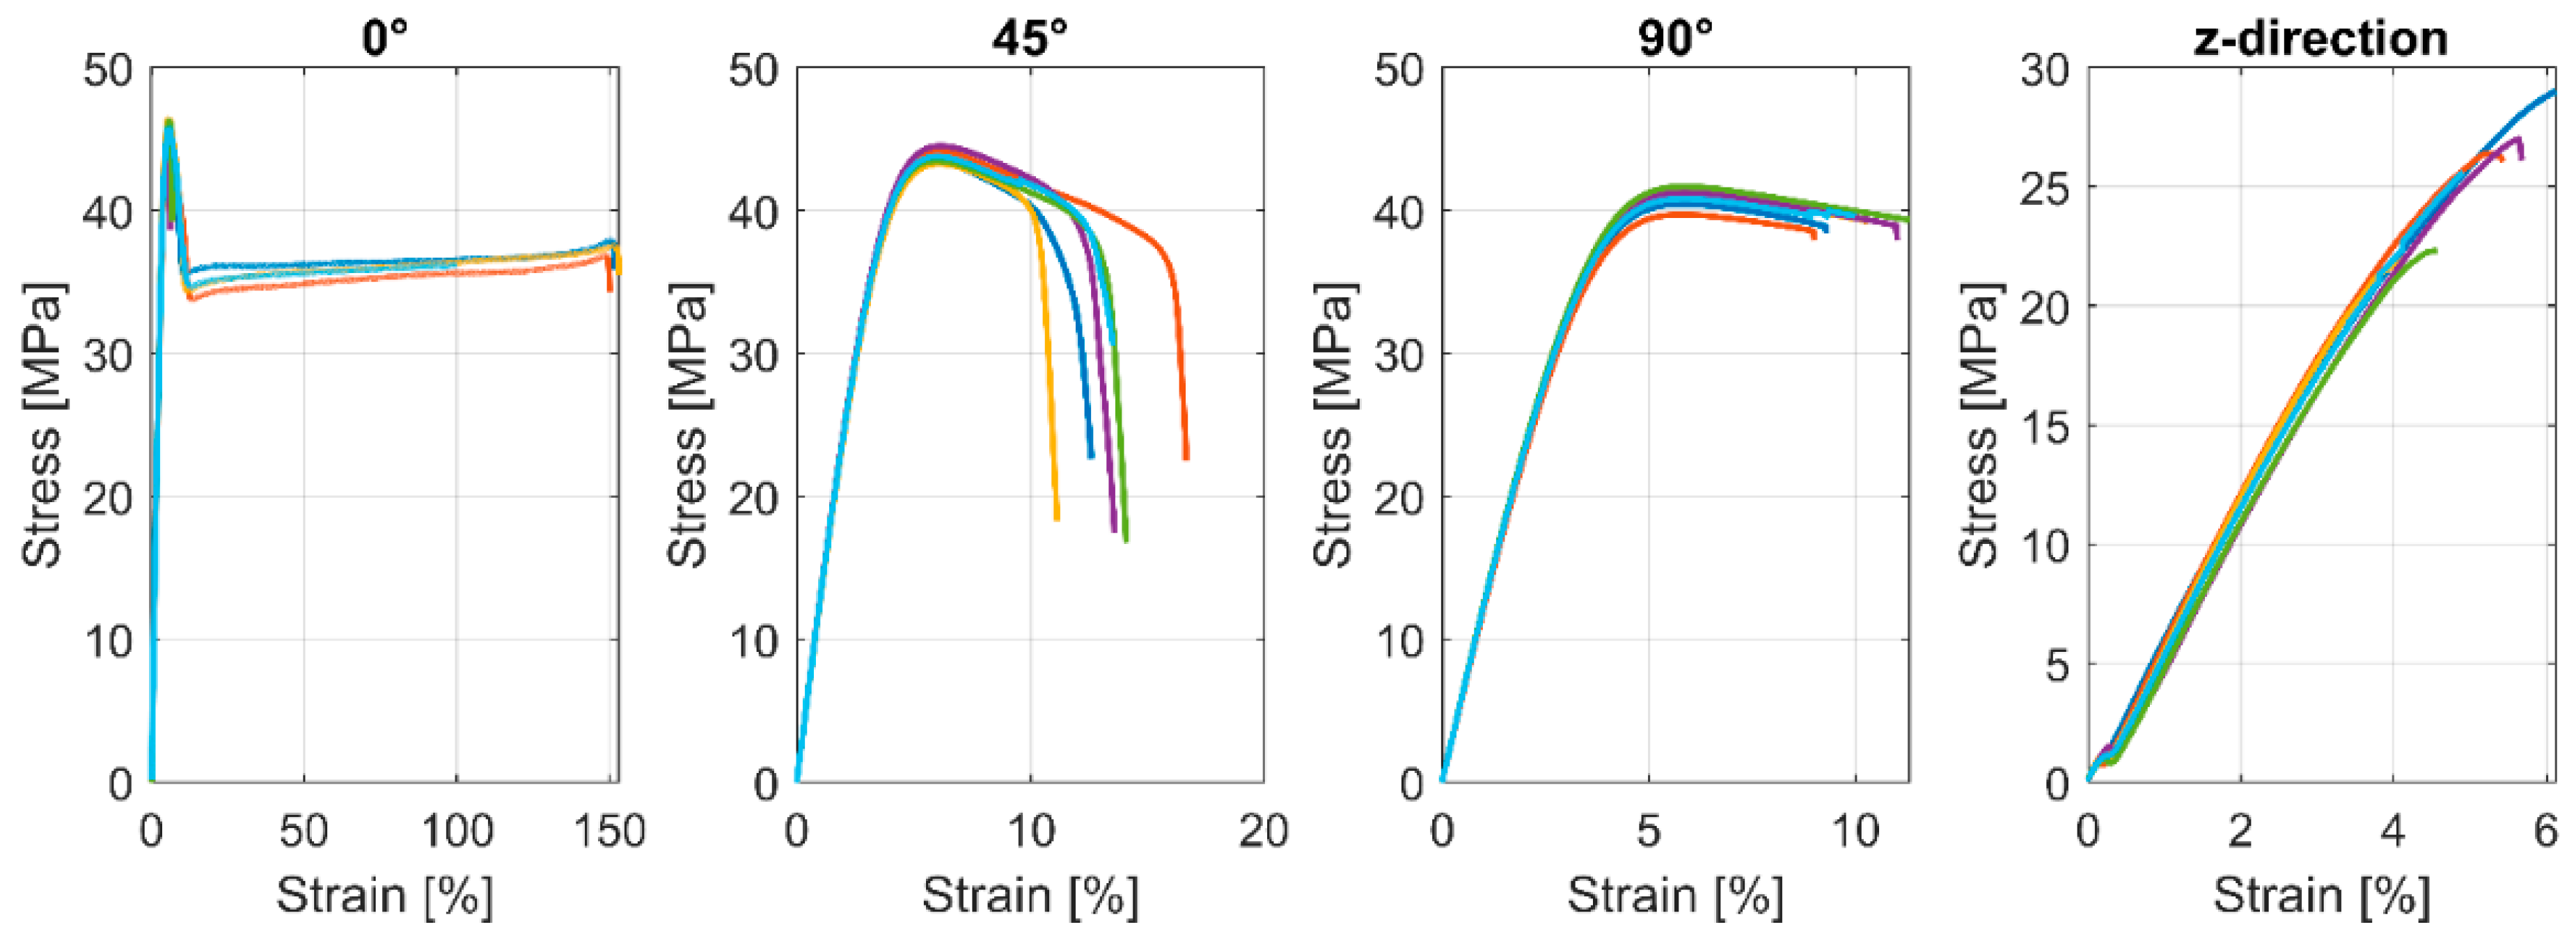
| Direction | Young’s Modulus | Tensile Strength Max σm | Max Strain at Failure εm |
|---|---|---|---|
| 0° | 1287.74 ± 13.9 MPa | 45.85 ± 0.6 MPa | 5.67 ± 0.1% |
| 90° | 1215.34 ± 11.8 MPa | 40.83 ± 0.7 MPa | 5.83 ± 0.15% |
| 45°/−45° | 1270.41 ± 9.8 MPa | 43.78 ± 0.5 MPa | 6.02 ± 0.1% |
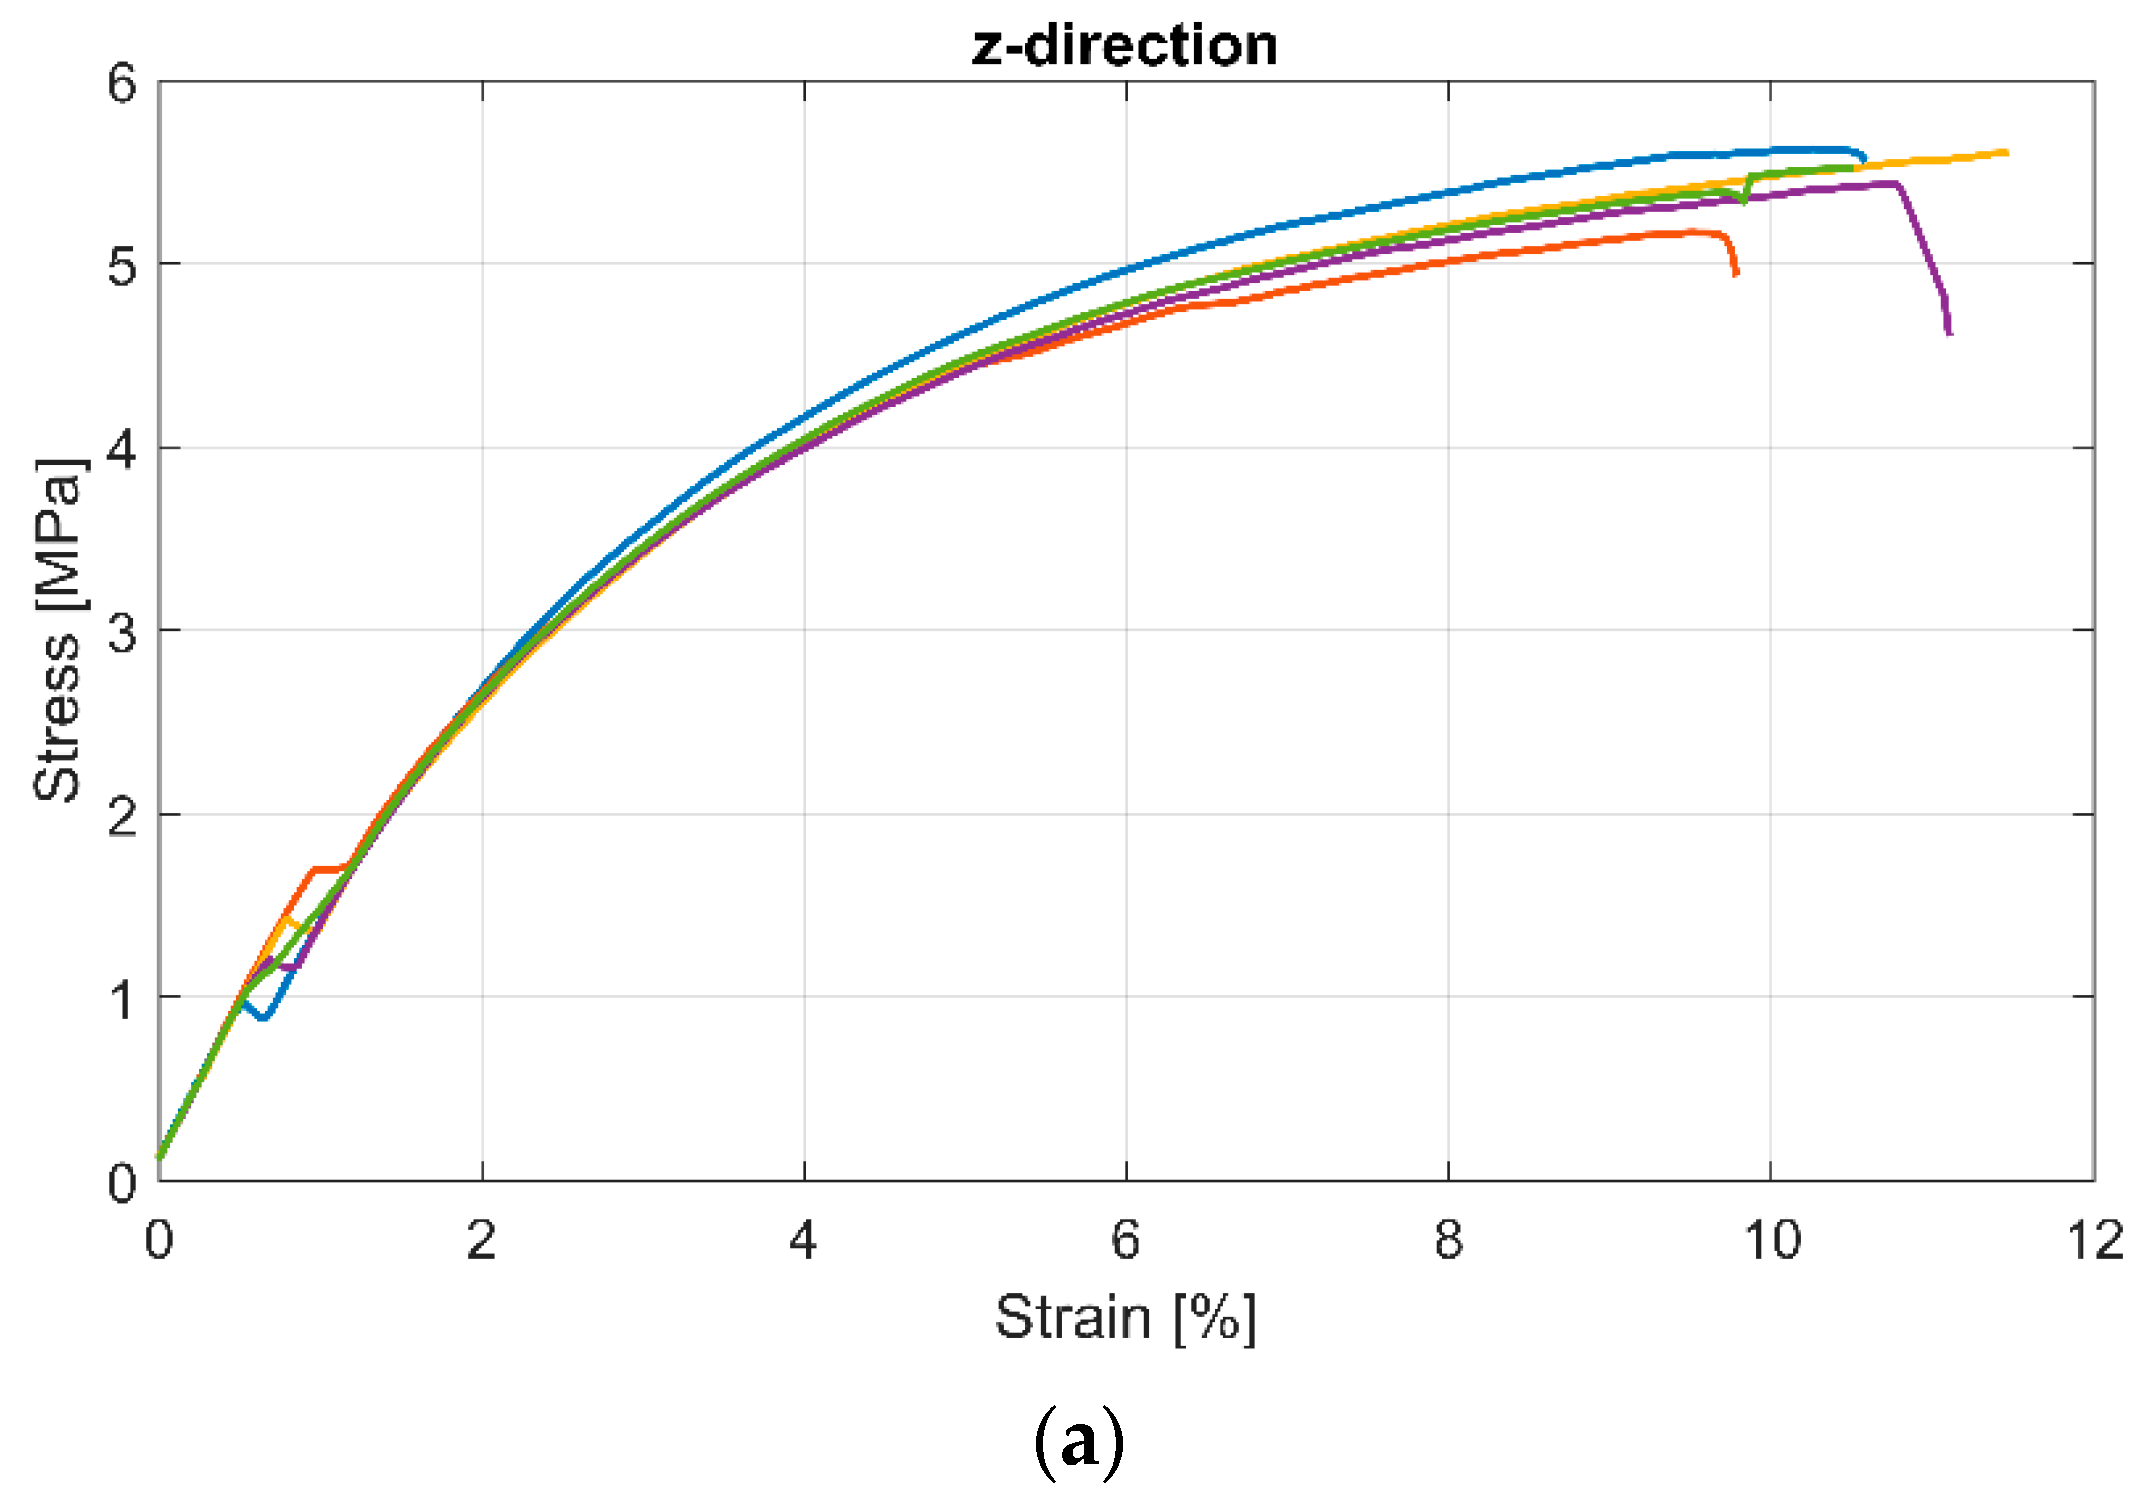
| Z-direction | 322.54 ± 132.8 MPa | 25.36 ± 2.7 MPa | 5.15 ± 0.7% |
| Direction | Young’s Modulus of Pebax®Rnew®35R53 | Young’s Modulus of Pebax®Rnew®1100 |
|---|---|---|
| 0° | 3.83 ± 1.6 MPa | 1287.74 ± 13.9 MPa |
| 90° | 6.49 ± 5.8 MPa | 1215.34 ± 11.8 MPa |
| 45°/−45° | - | 1270.41 ± 9.8 MPa |
| Z-direction | 16.12 ± 3.2 MPa | 322.54 ± 132.8 MPa |
| Data sheet | 25 MPa [16] | 1160 MPa [23] |
Publisher’s Note: MDPI stays neutral with regard to jurisdictional claims in published maps and institutional affiliations. |
© 2022 by the authors. Licensee MDPI, Basel, Switzerland. This article is an open access article distributed under the terms and conditions of the Creative Commons Attribution (CC BY) license (https://creativecommons.org/licenses/by/4.0/).
Share and Cite
Schär, M.; Zweifel, L.; Arslan, D.; Grieder, S.; Maurer, C.; Brauner, C. Fused Filament Fabrication of Bio-Based Polyether-Block-Amide Polymers (PEBAX) and Their Related Properties. Polymers 2022, 14, 5092. https://doi.org/10.3390/polym14235092
Schär M, Zweifel L, Arslan D, Grieder S, Maurer C, Brauner C. Fused Filament Fabrication of Bio-Based Polyether-Block-Amide Polymers (PEBAX) and Their Related Properties. Polymers. 2022; 14(23):5092. https://doi.org/10.3390/polym14235092
Chicago/Turabian StyleSchär, Matthias, Lucian Zweifel, Delal Arslan, Stefan Grieder, Christoph Maurer, and Christian Brauner. 2022. "Fused Filament Fabrication of Bio-Based Polyether-Block-Amide Polymers (PEBAX) and Their Related Properties" Polymers 14, no. 23: 5092. https://doi.org/10.3390/polym14235092