
Integration of Material Characterization, Thermoforming Simulation, and As-Formed Structural Analysis for Thermoplastic Composites


Abstract
1. Introduction
2. Experimental Characterization Methods
2.1. Shear Modulus
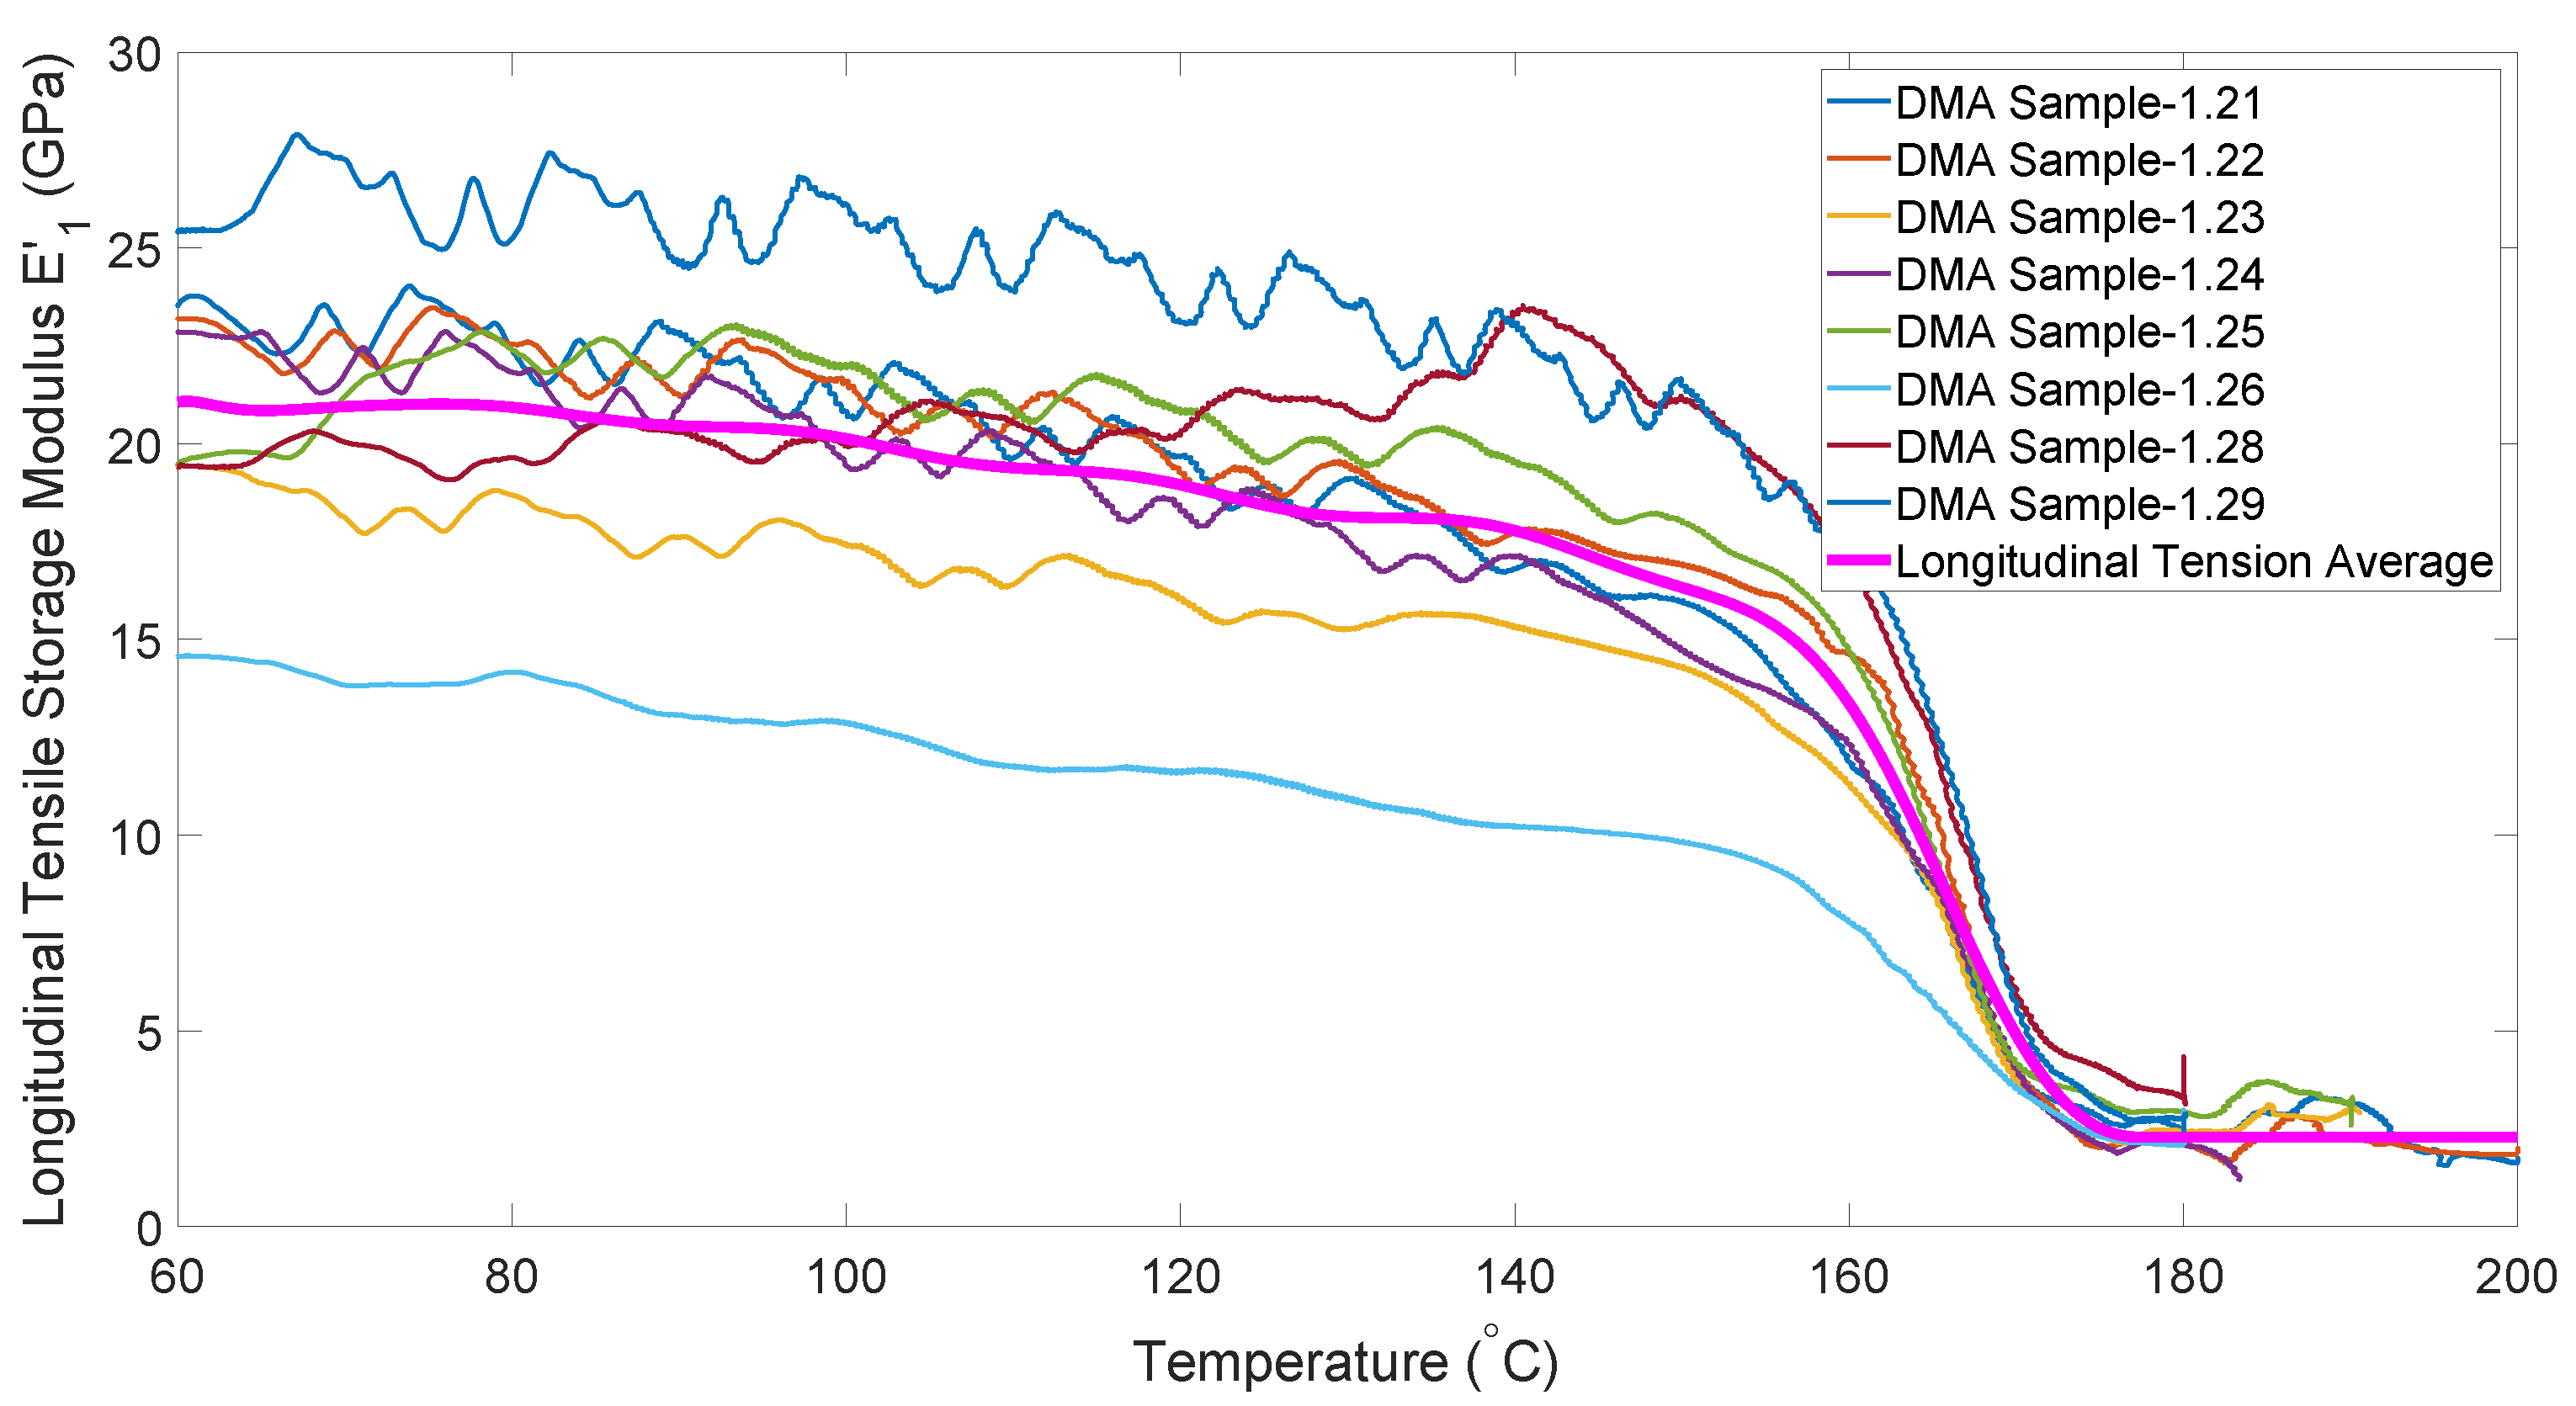
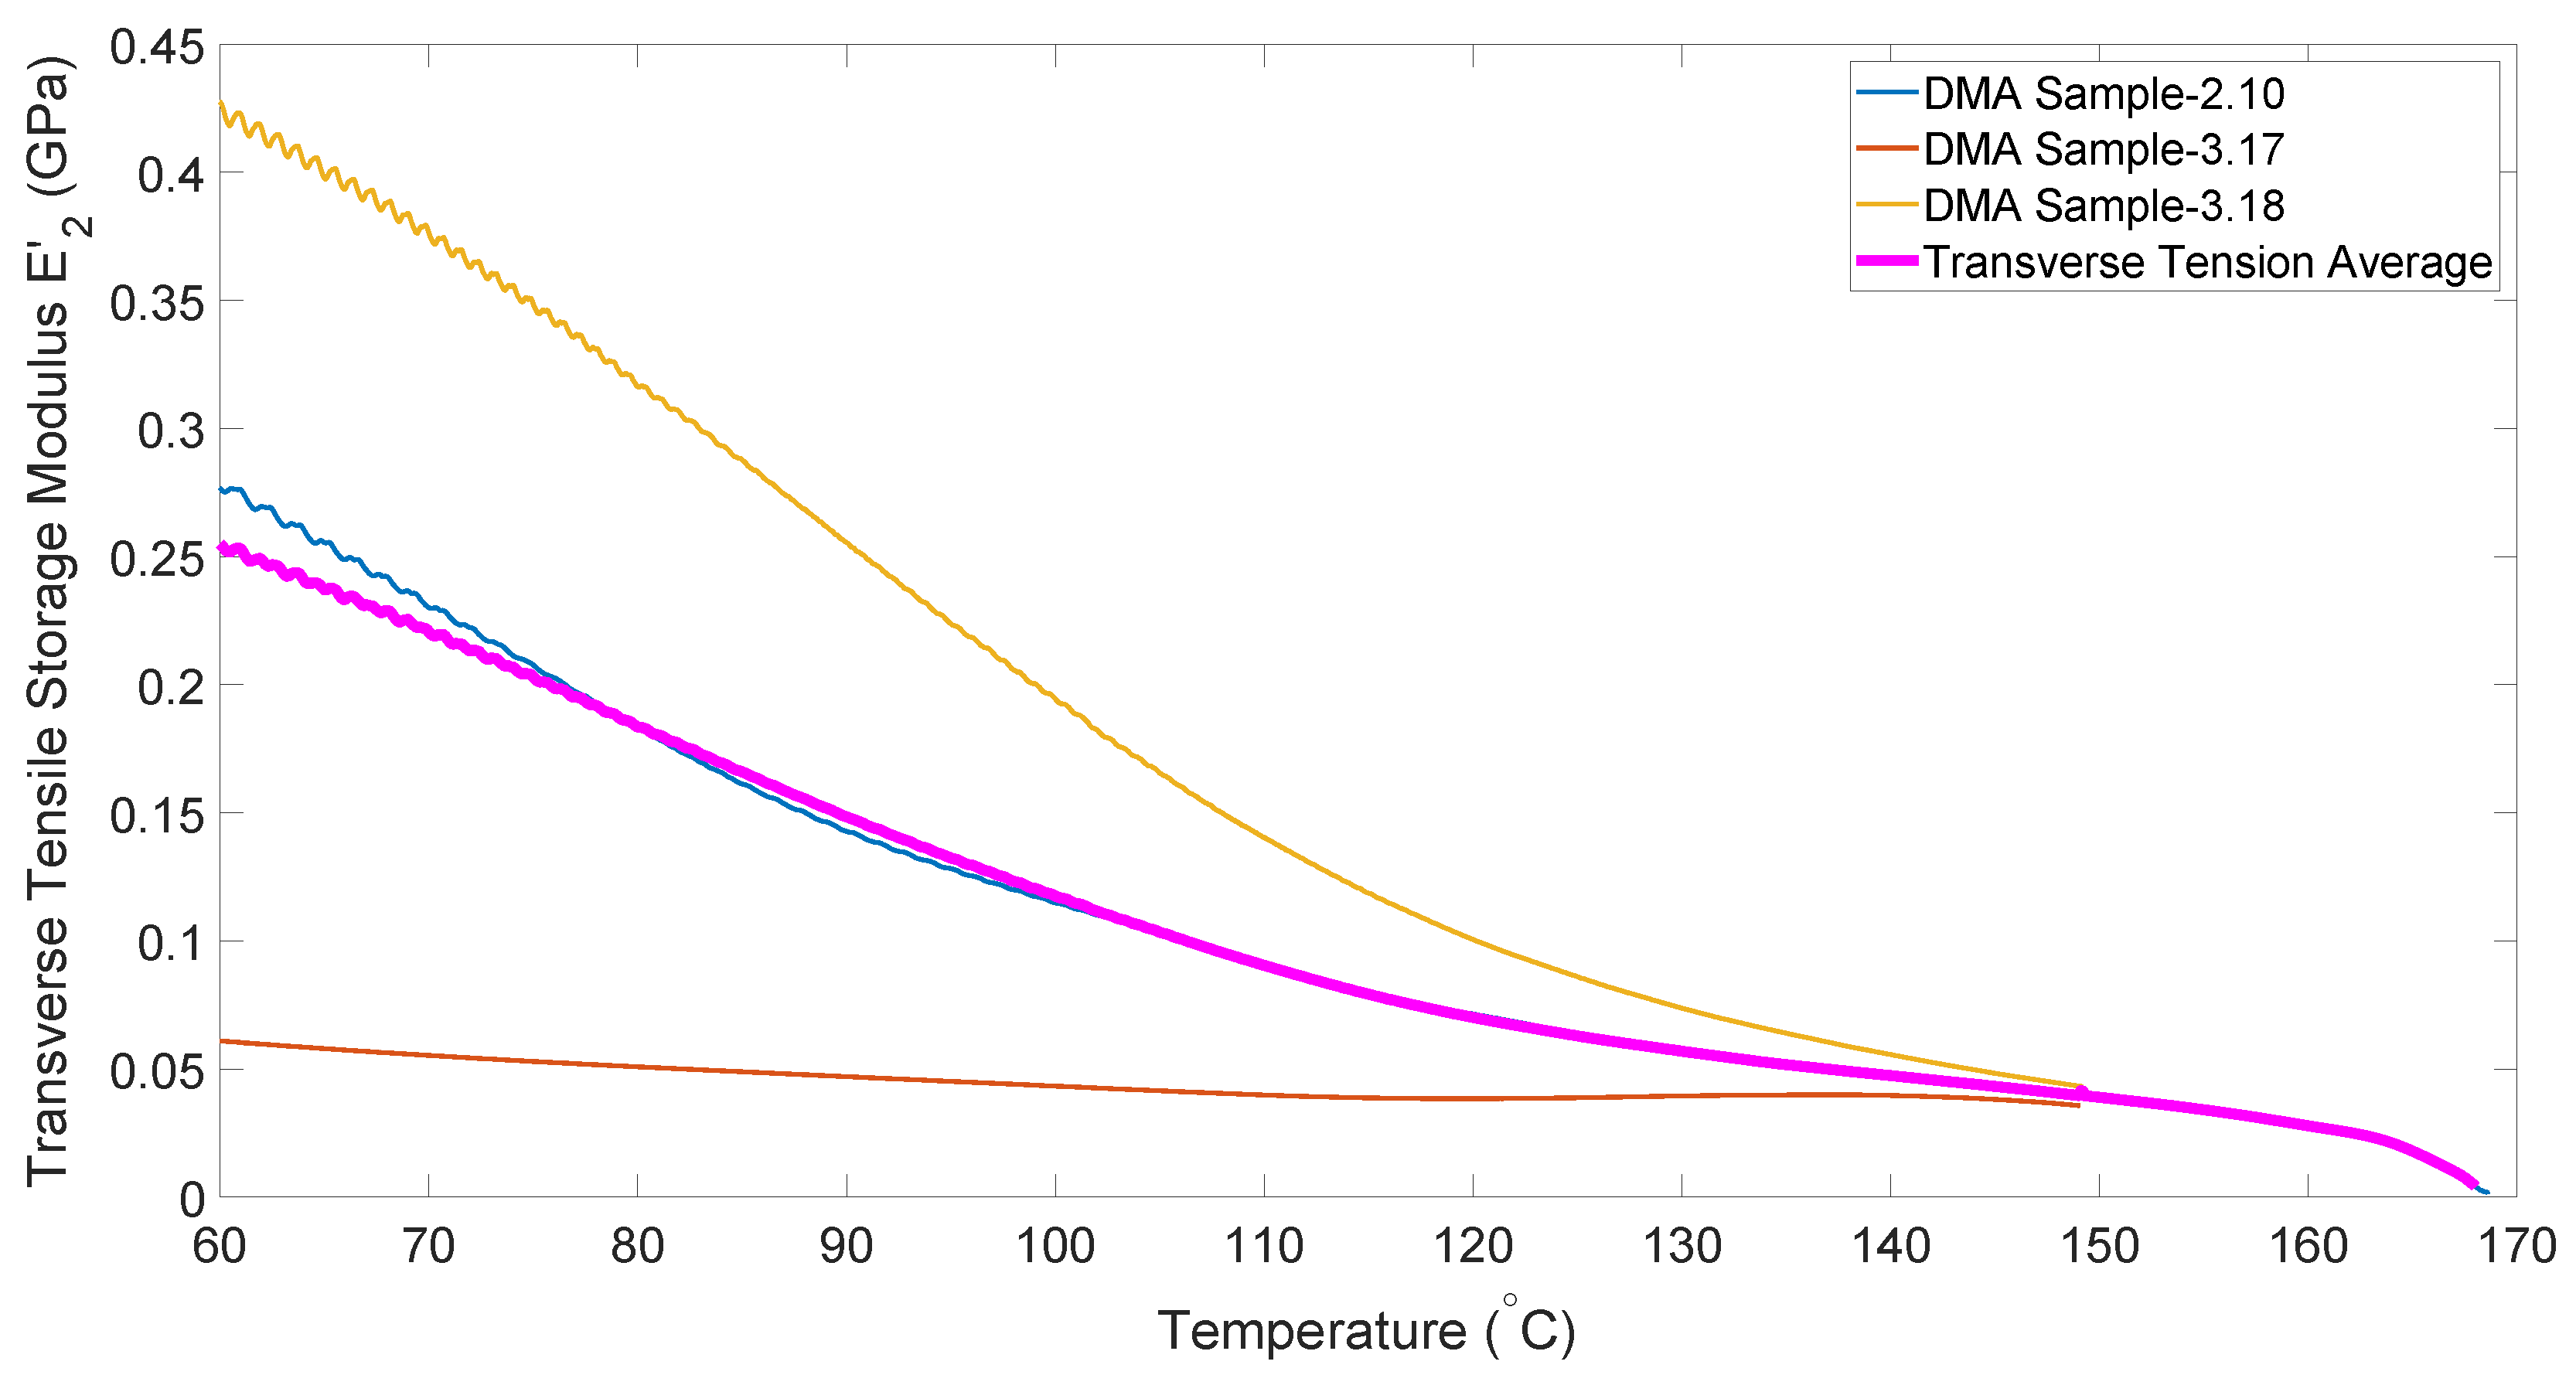
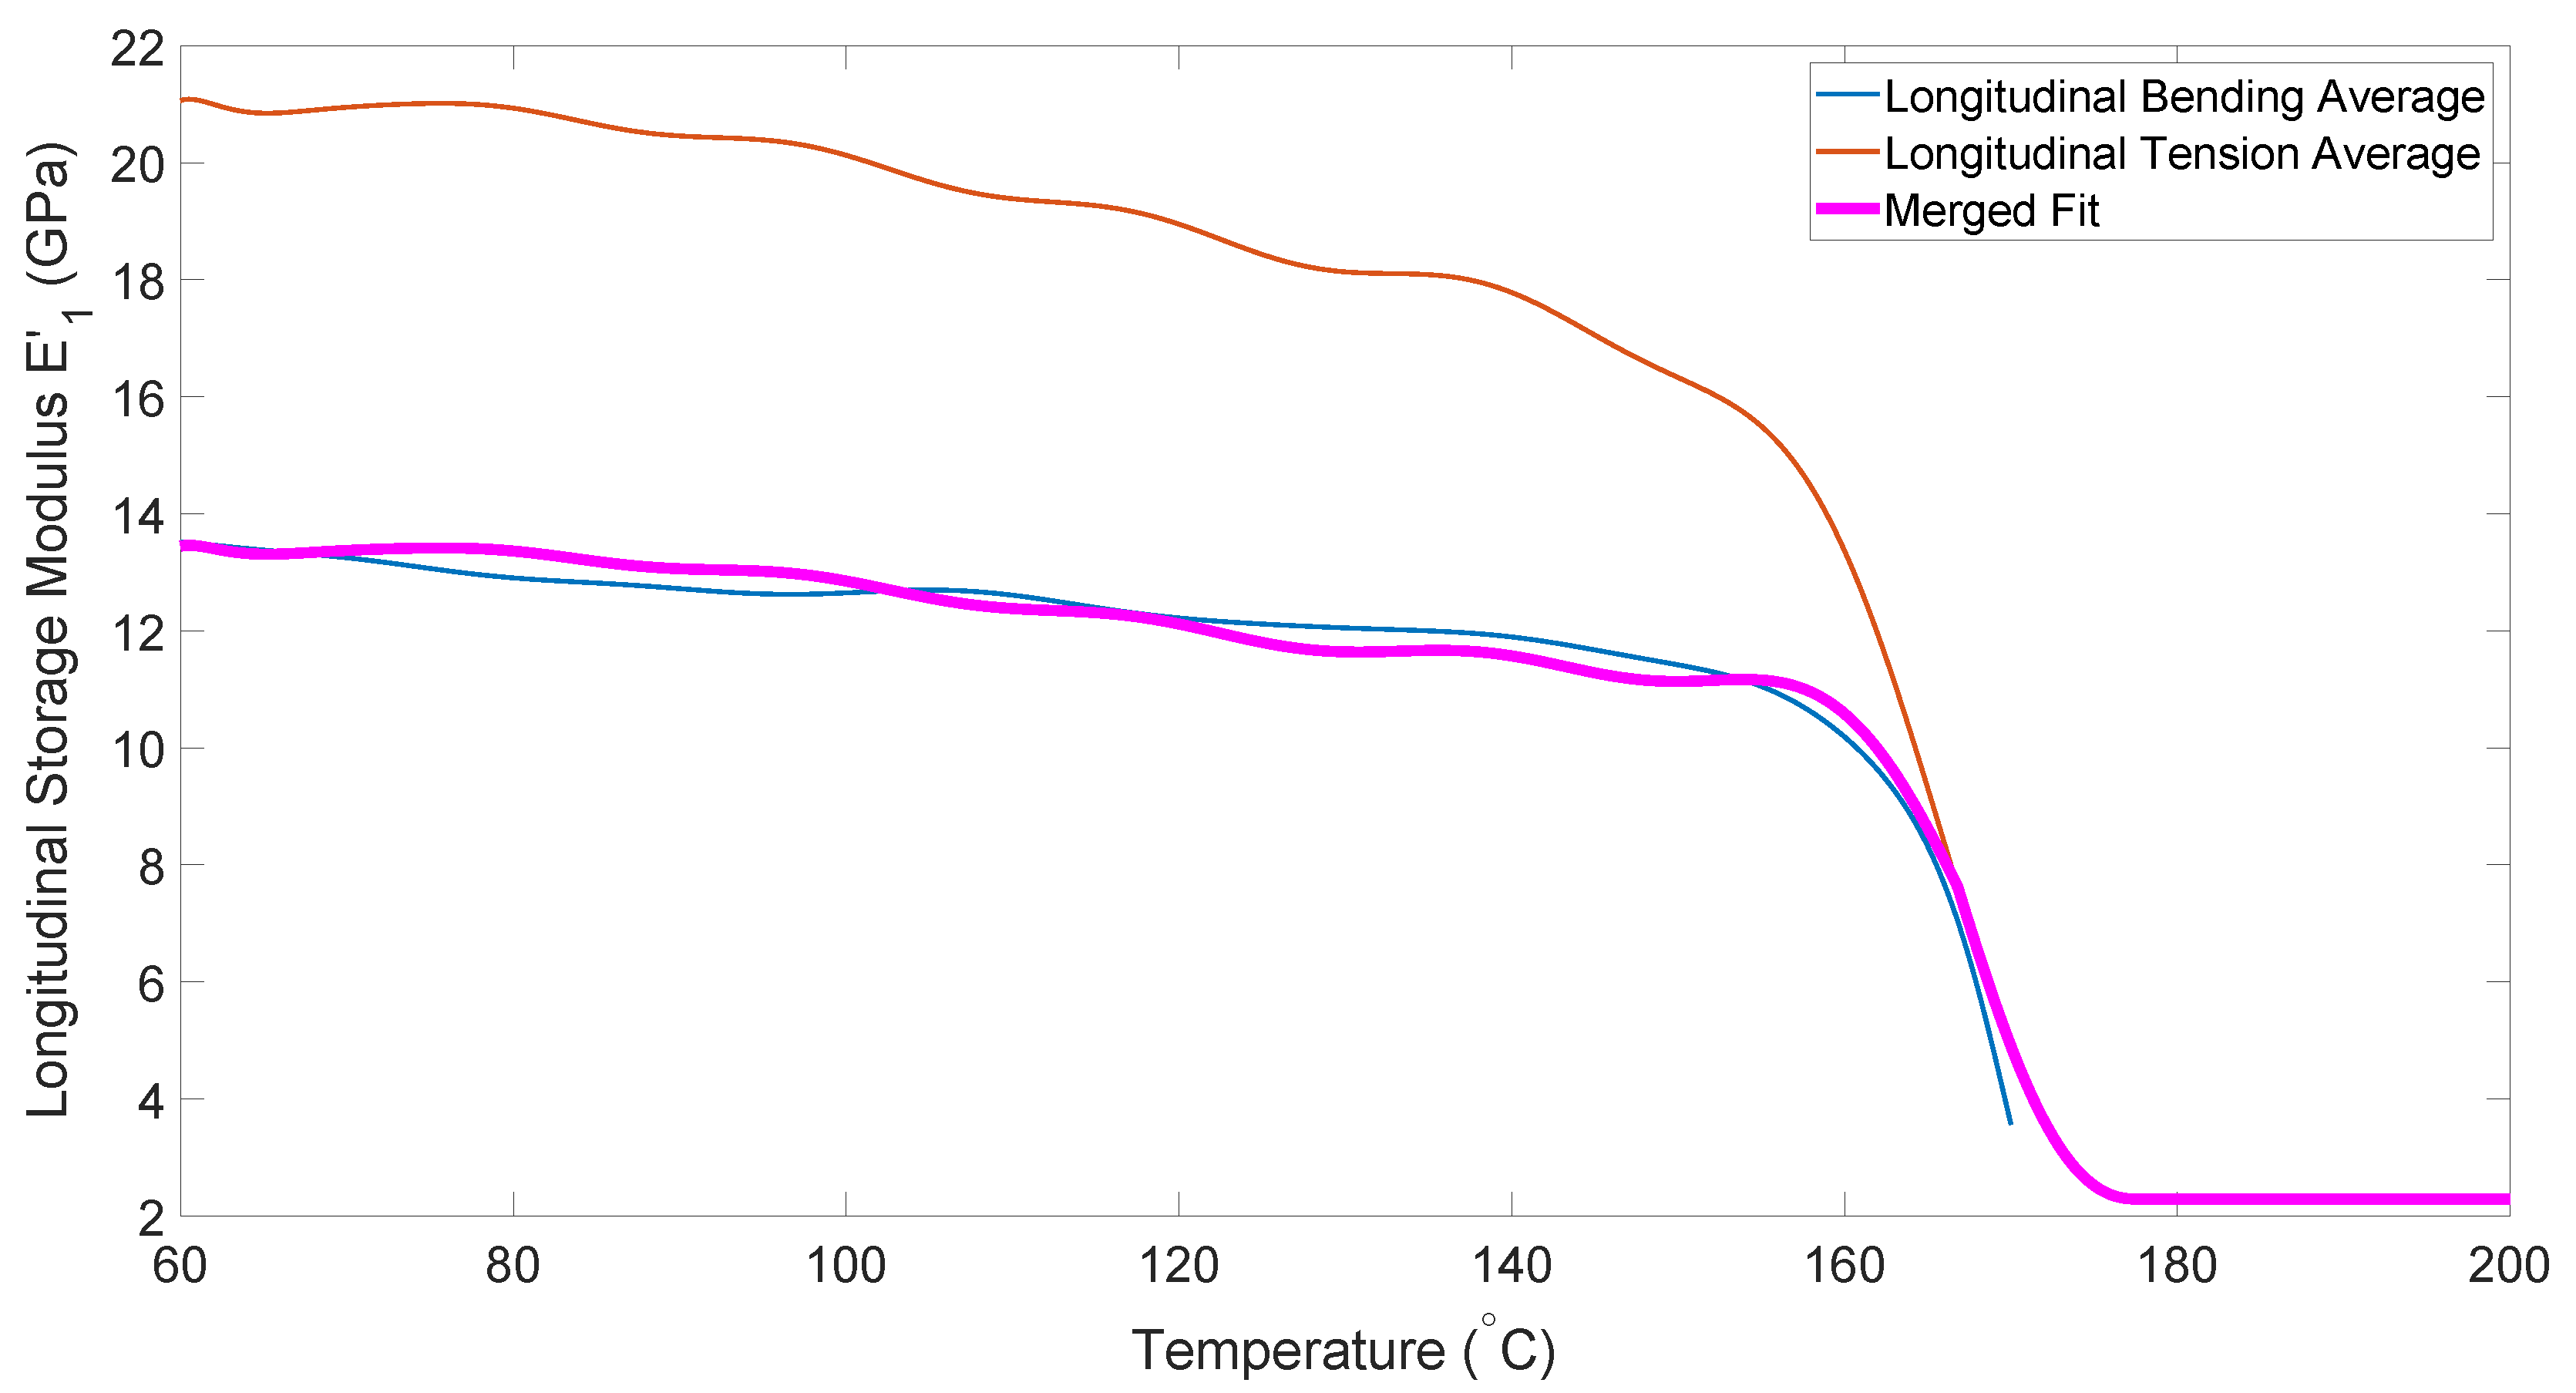
2.2. Tensile Modulus
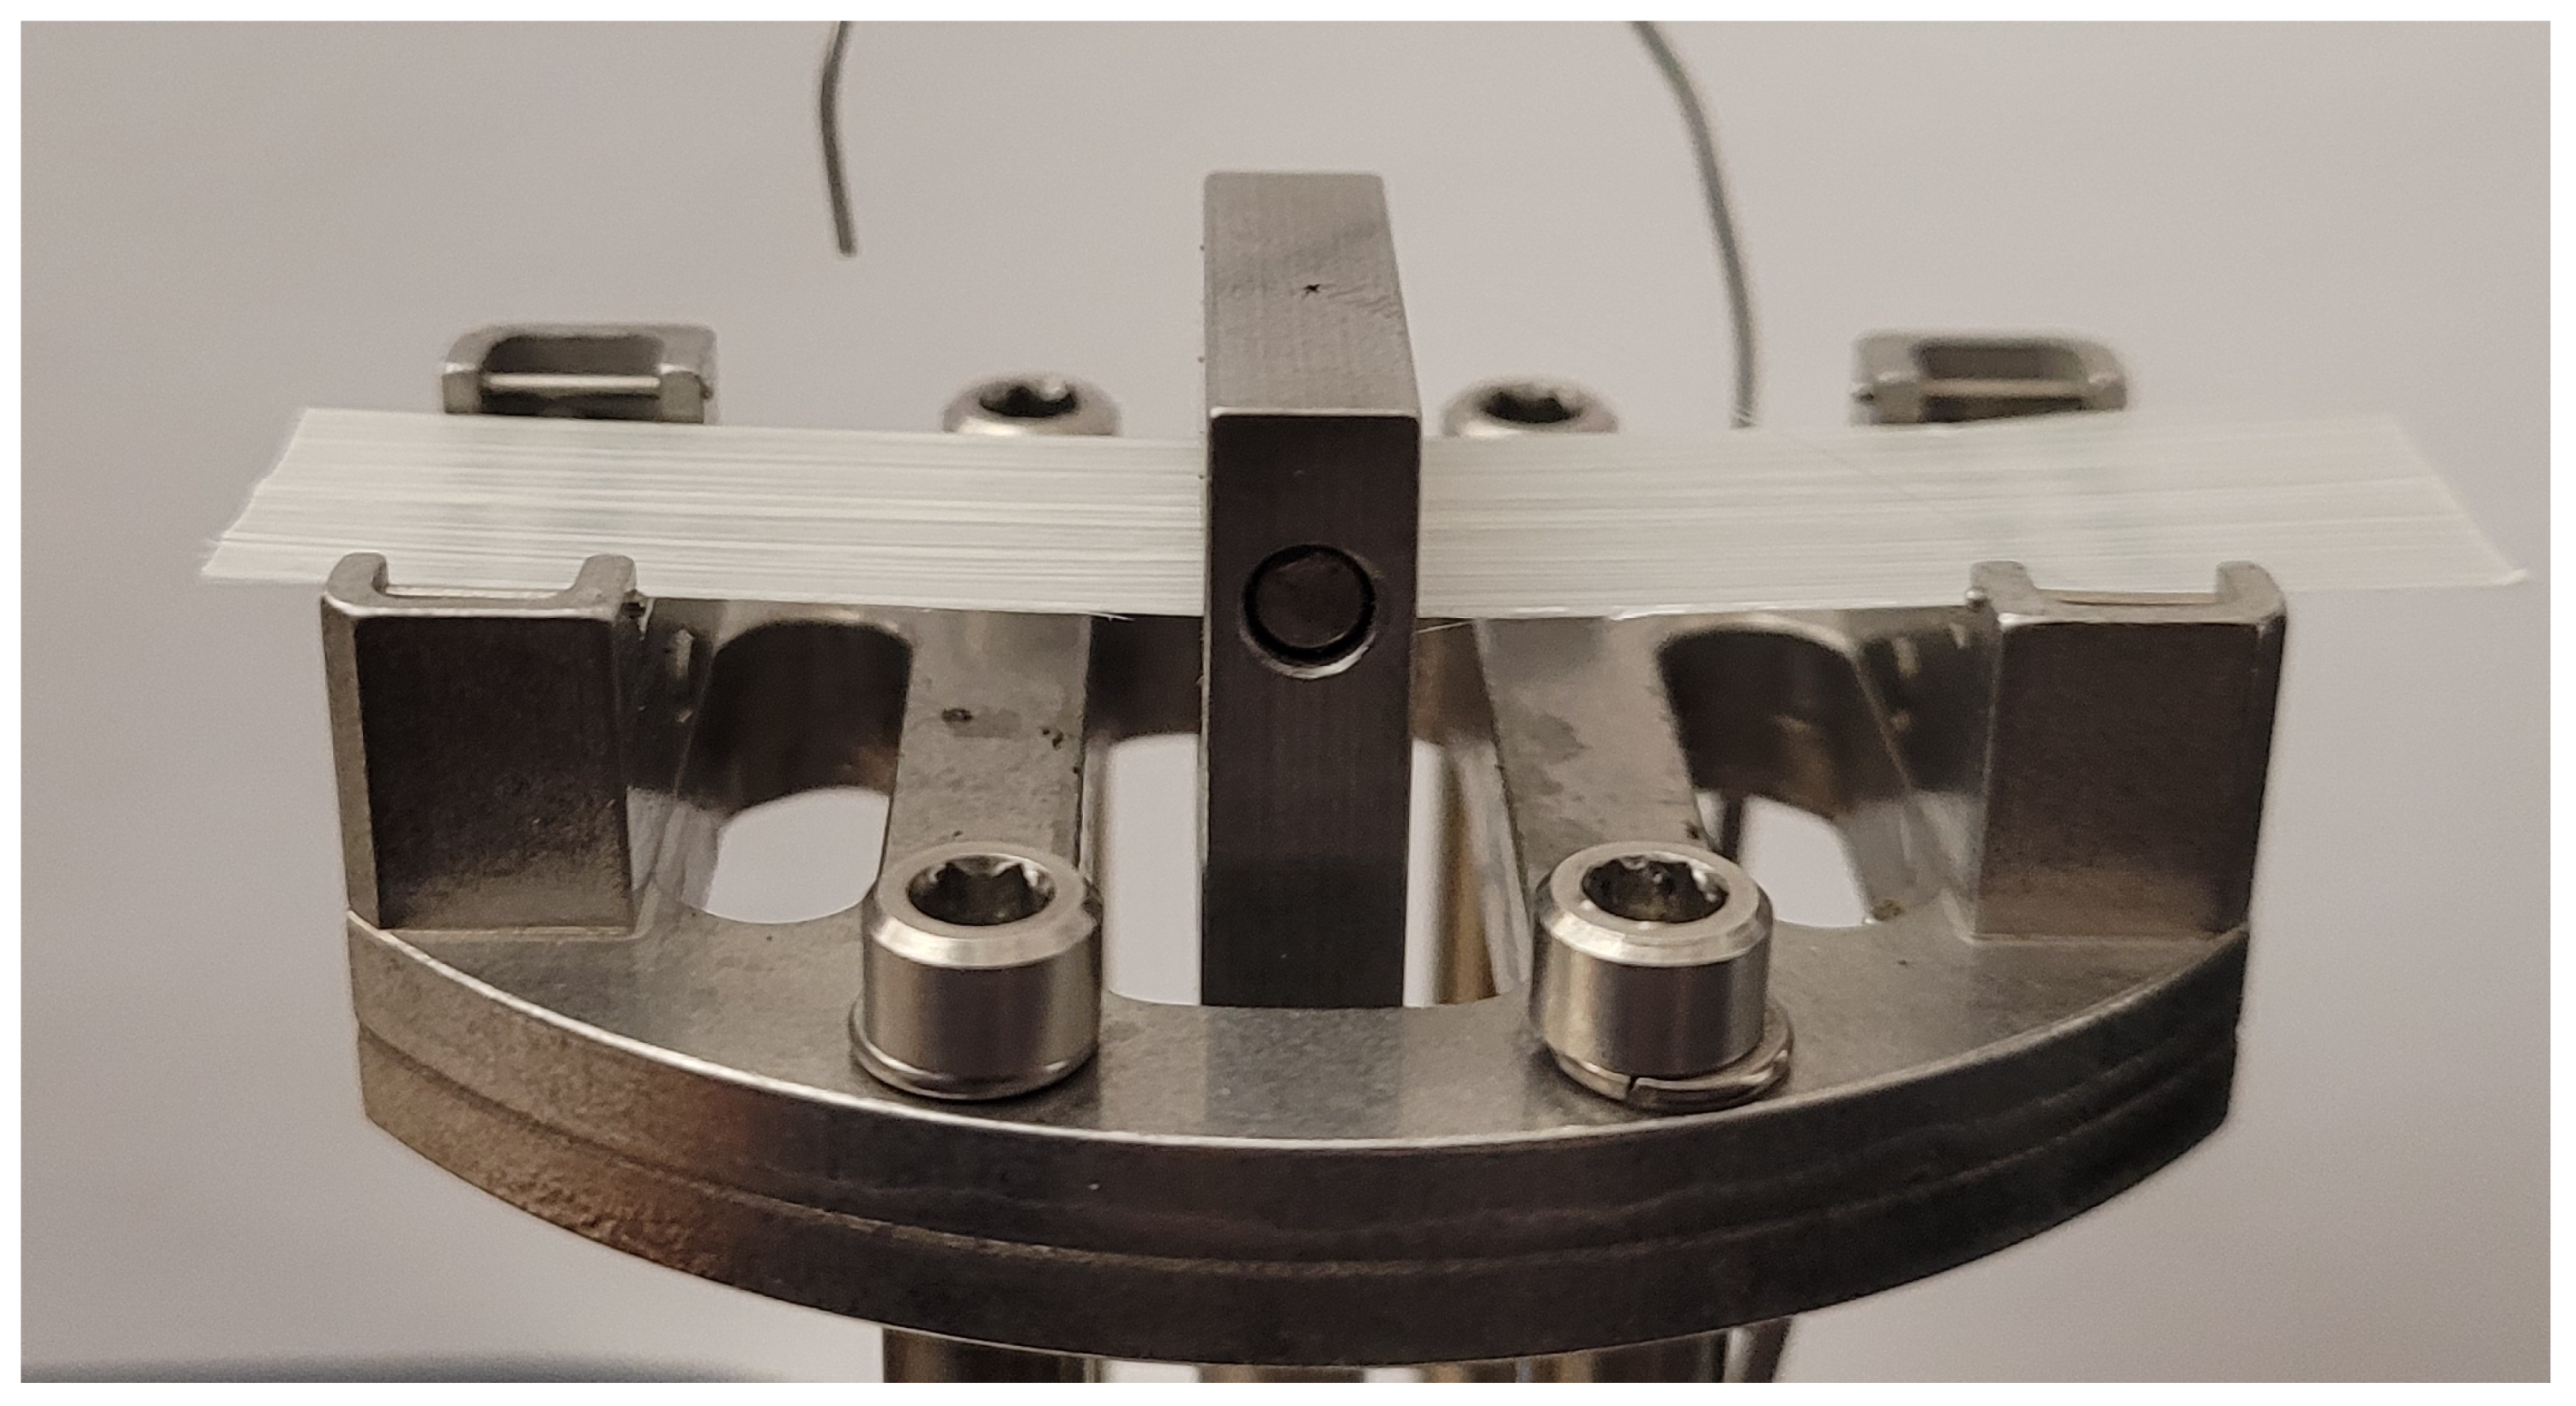
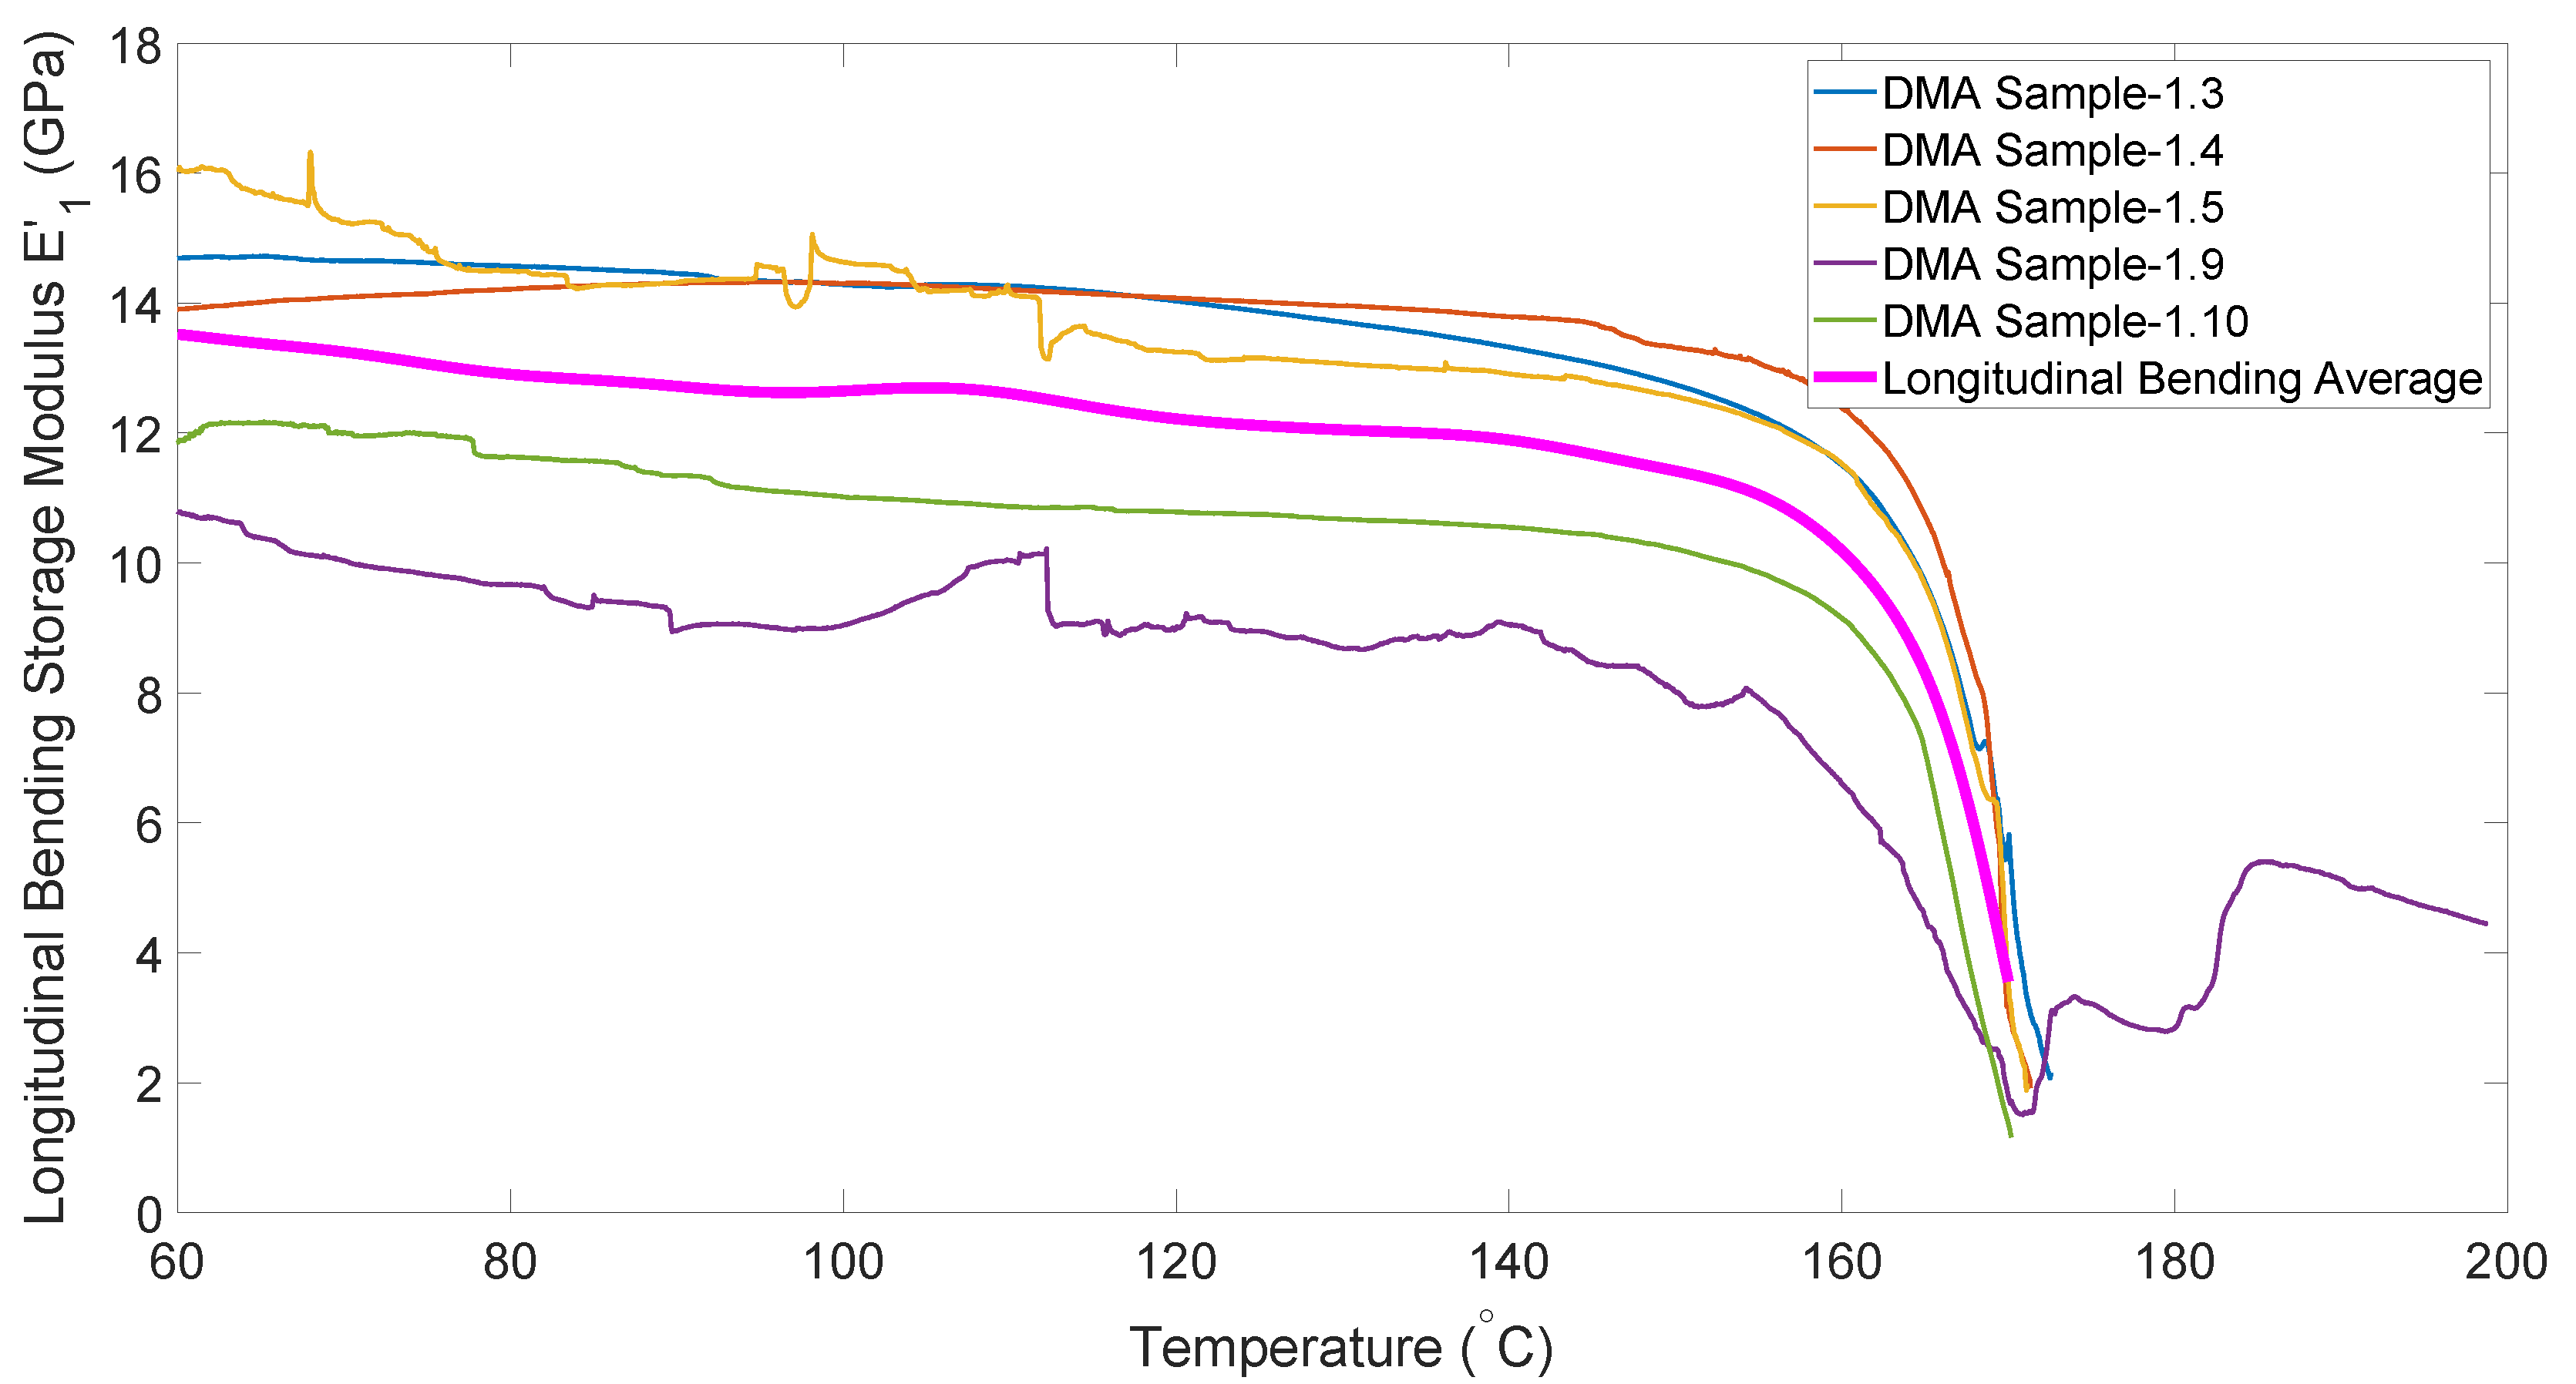
2.3. Bending Modulus
3. Thermoforming Simulations
3.1. Simulation Framework
3.2. Simulation Case Studies
- Generic Material had an average error of 60%;
- Panel-5 Material had an average error of 51%;
- Panel-3 Material had an average error of 43%.
4. Structural Analysis of the As-Formed Part Model
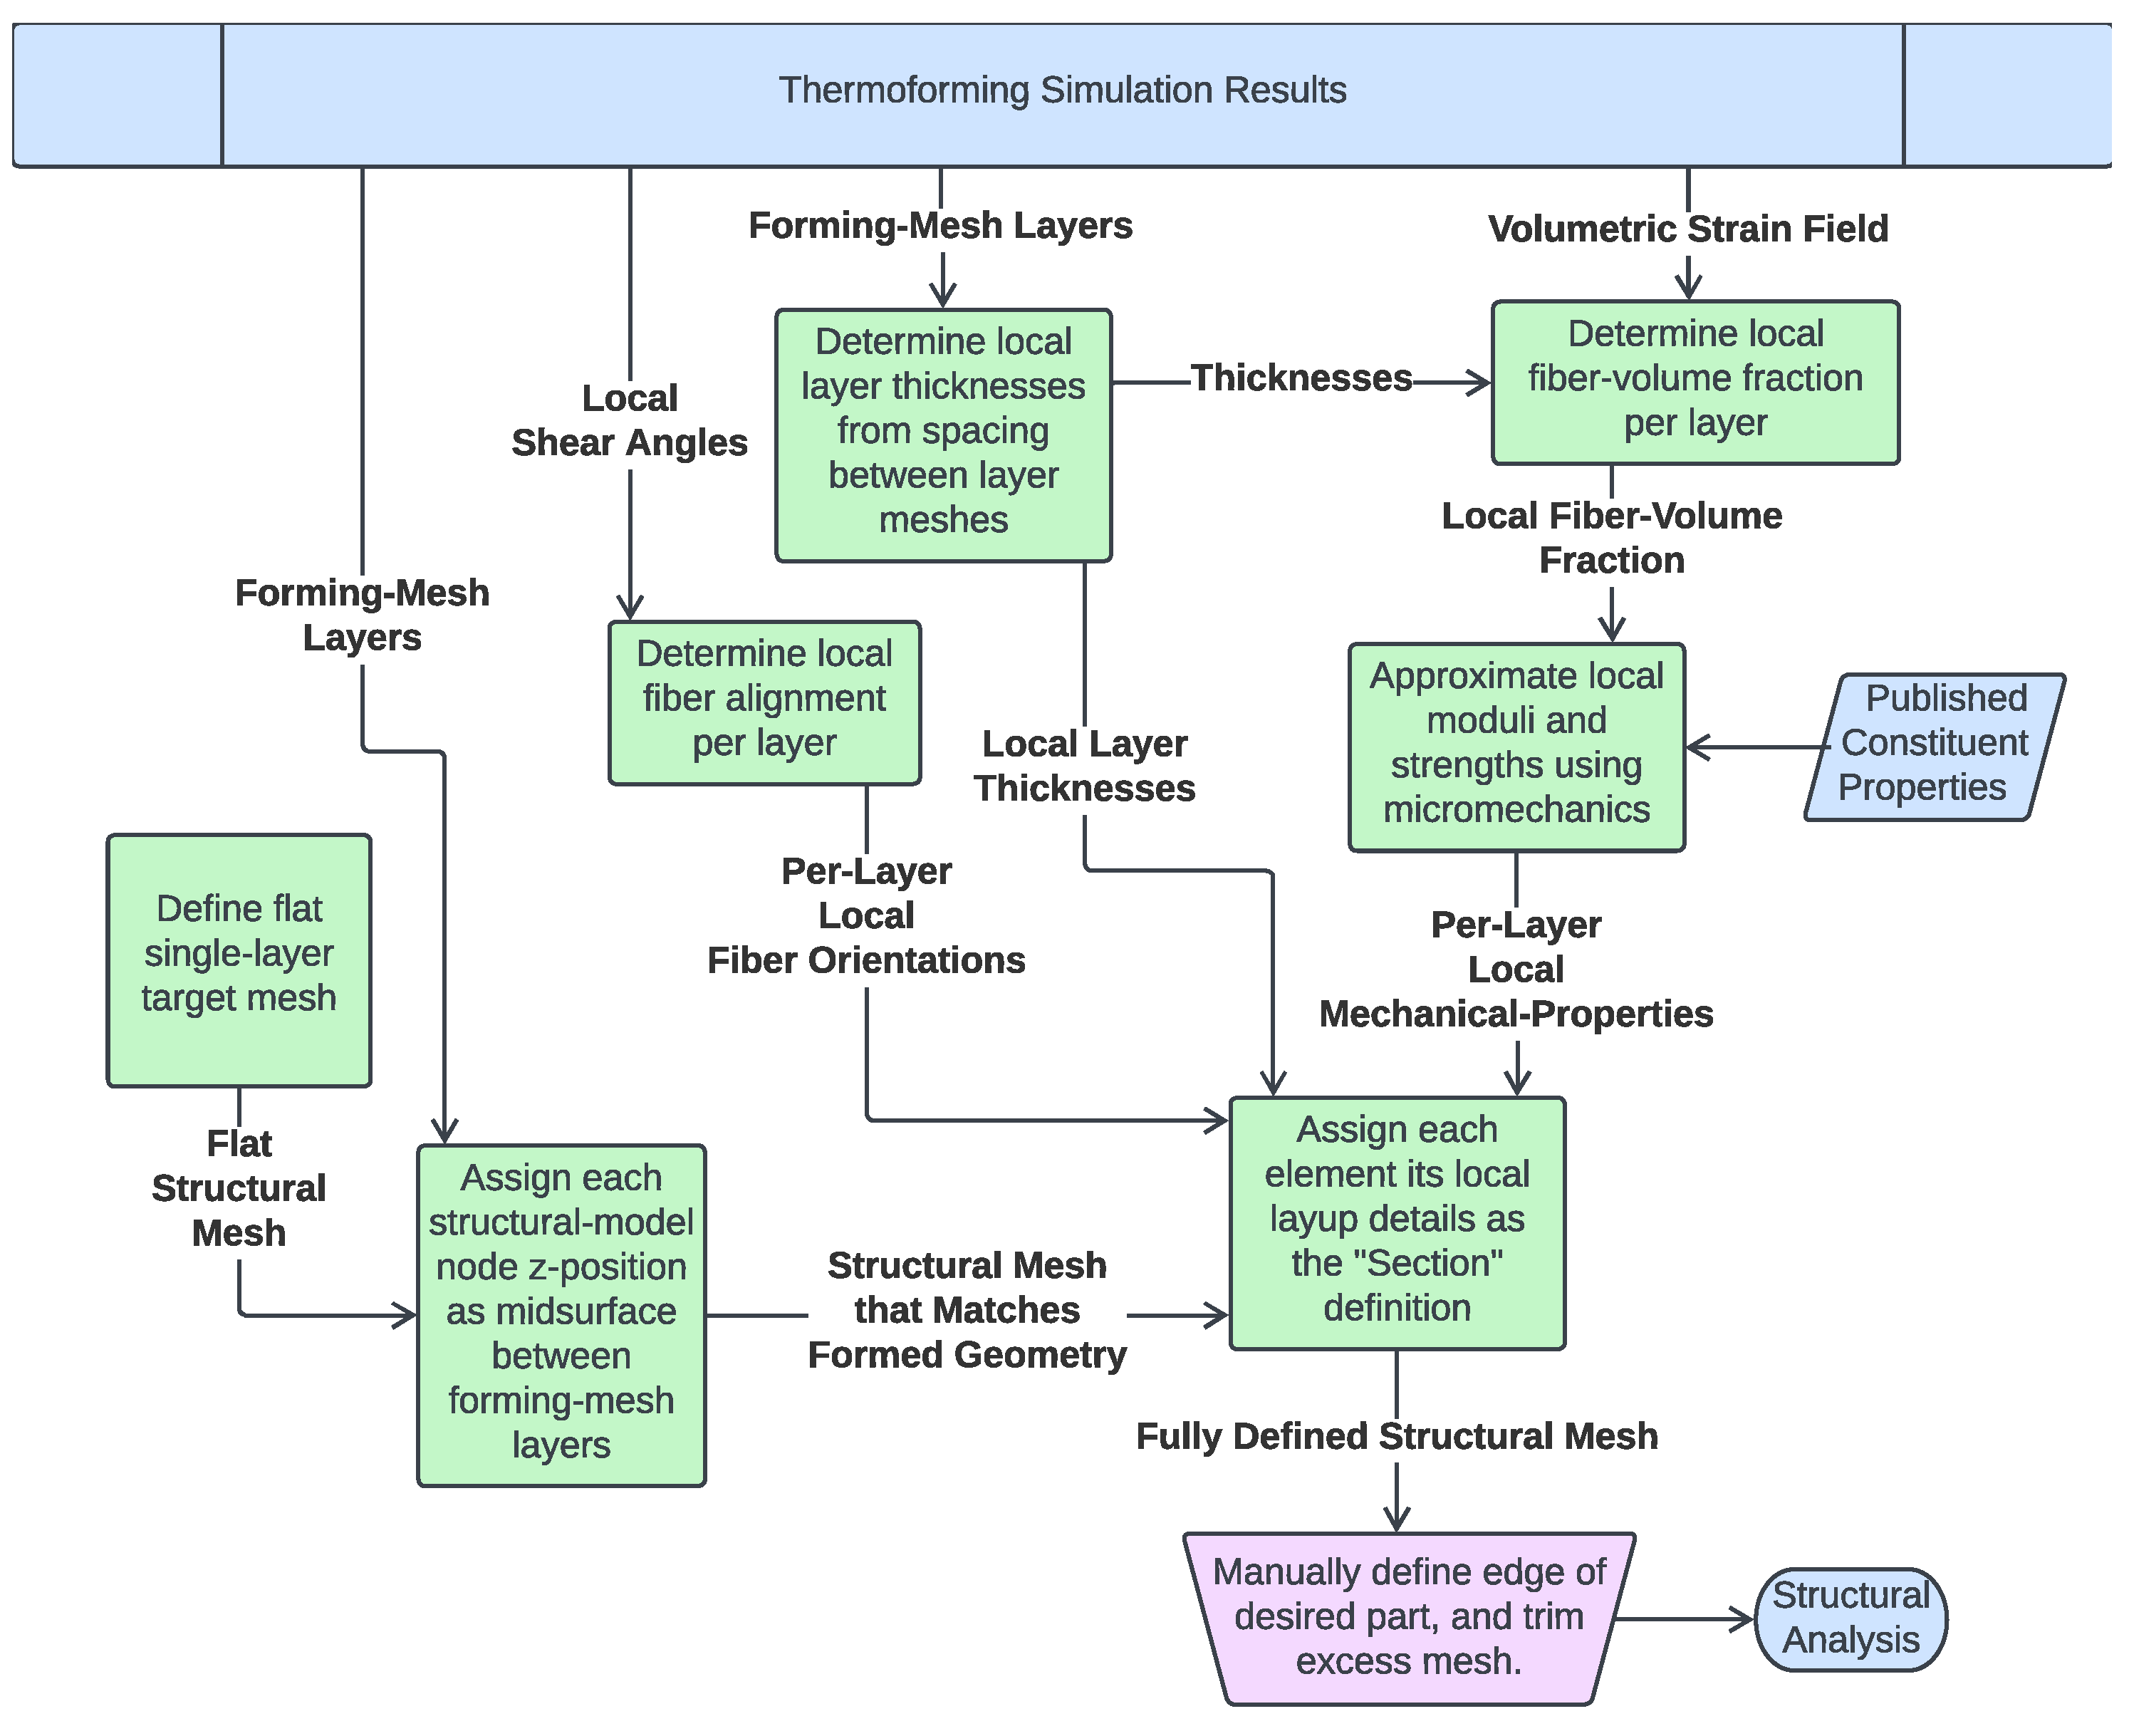
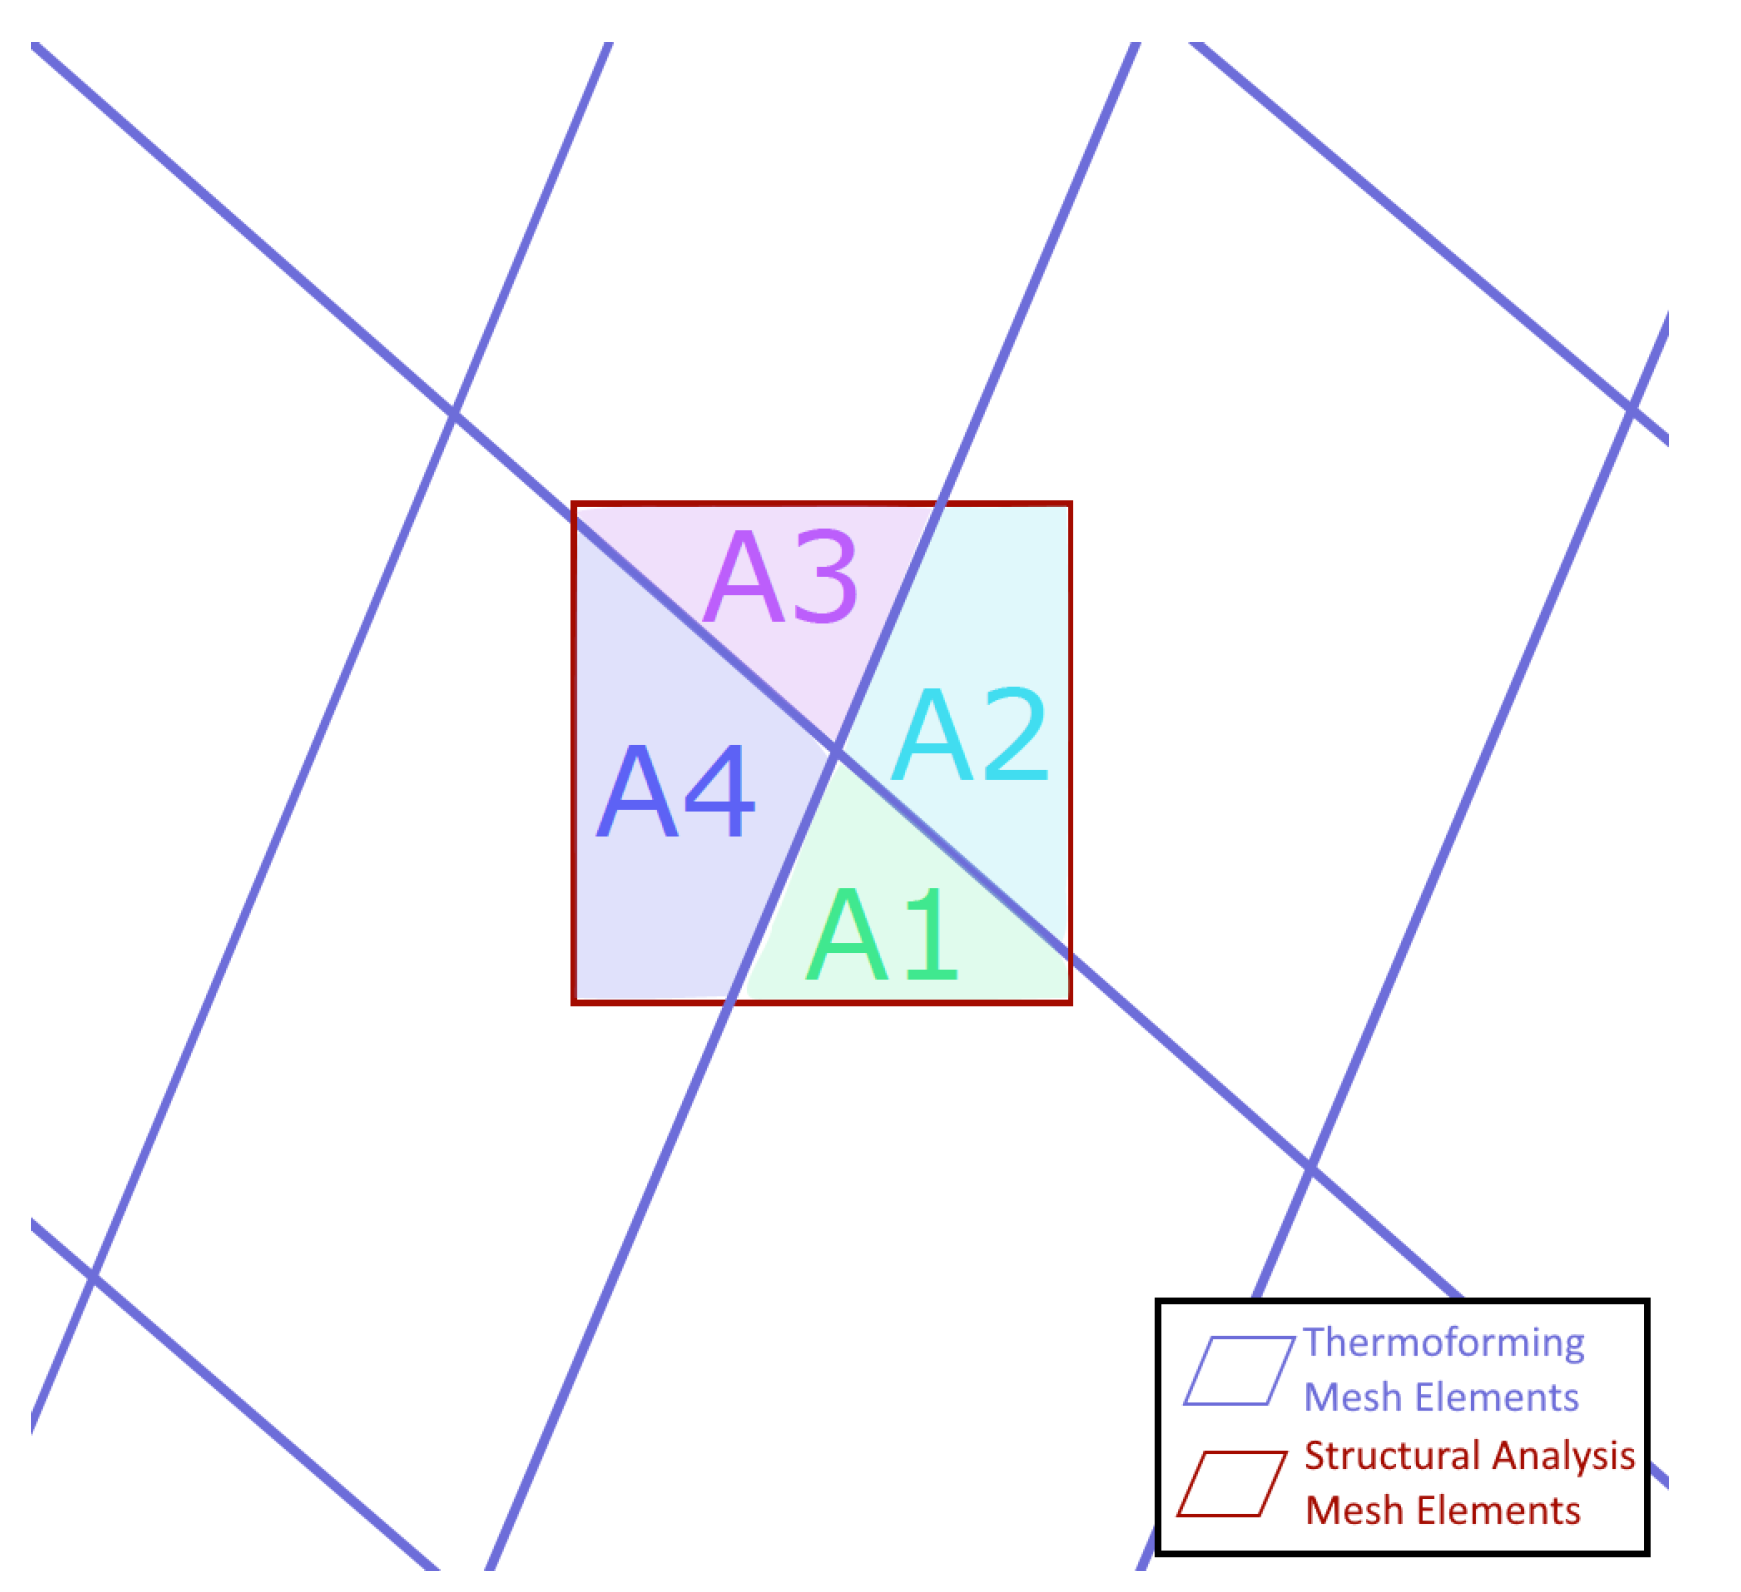
4.1. Mesh Conversion Process
4.2. Case Study for Implementing As-Formed Analysis
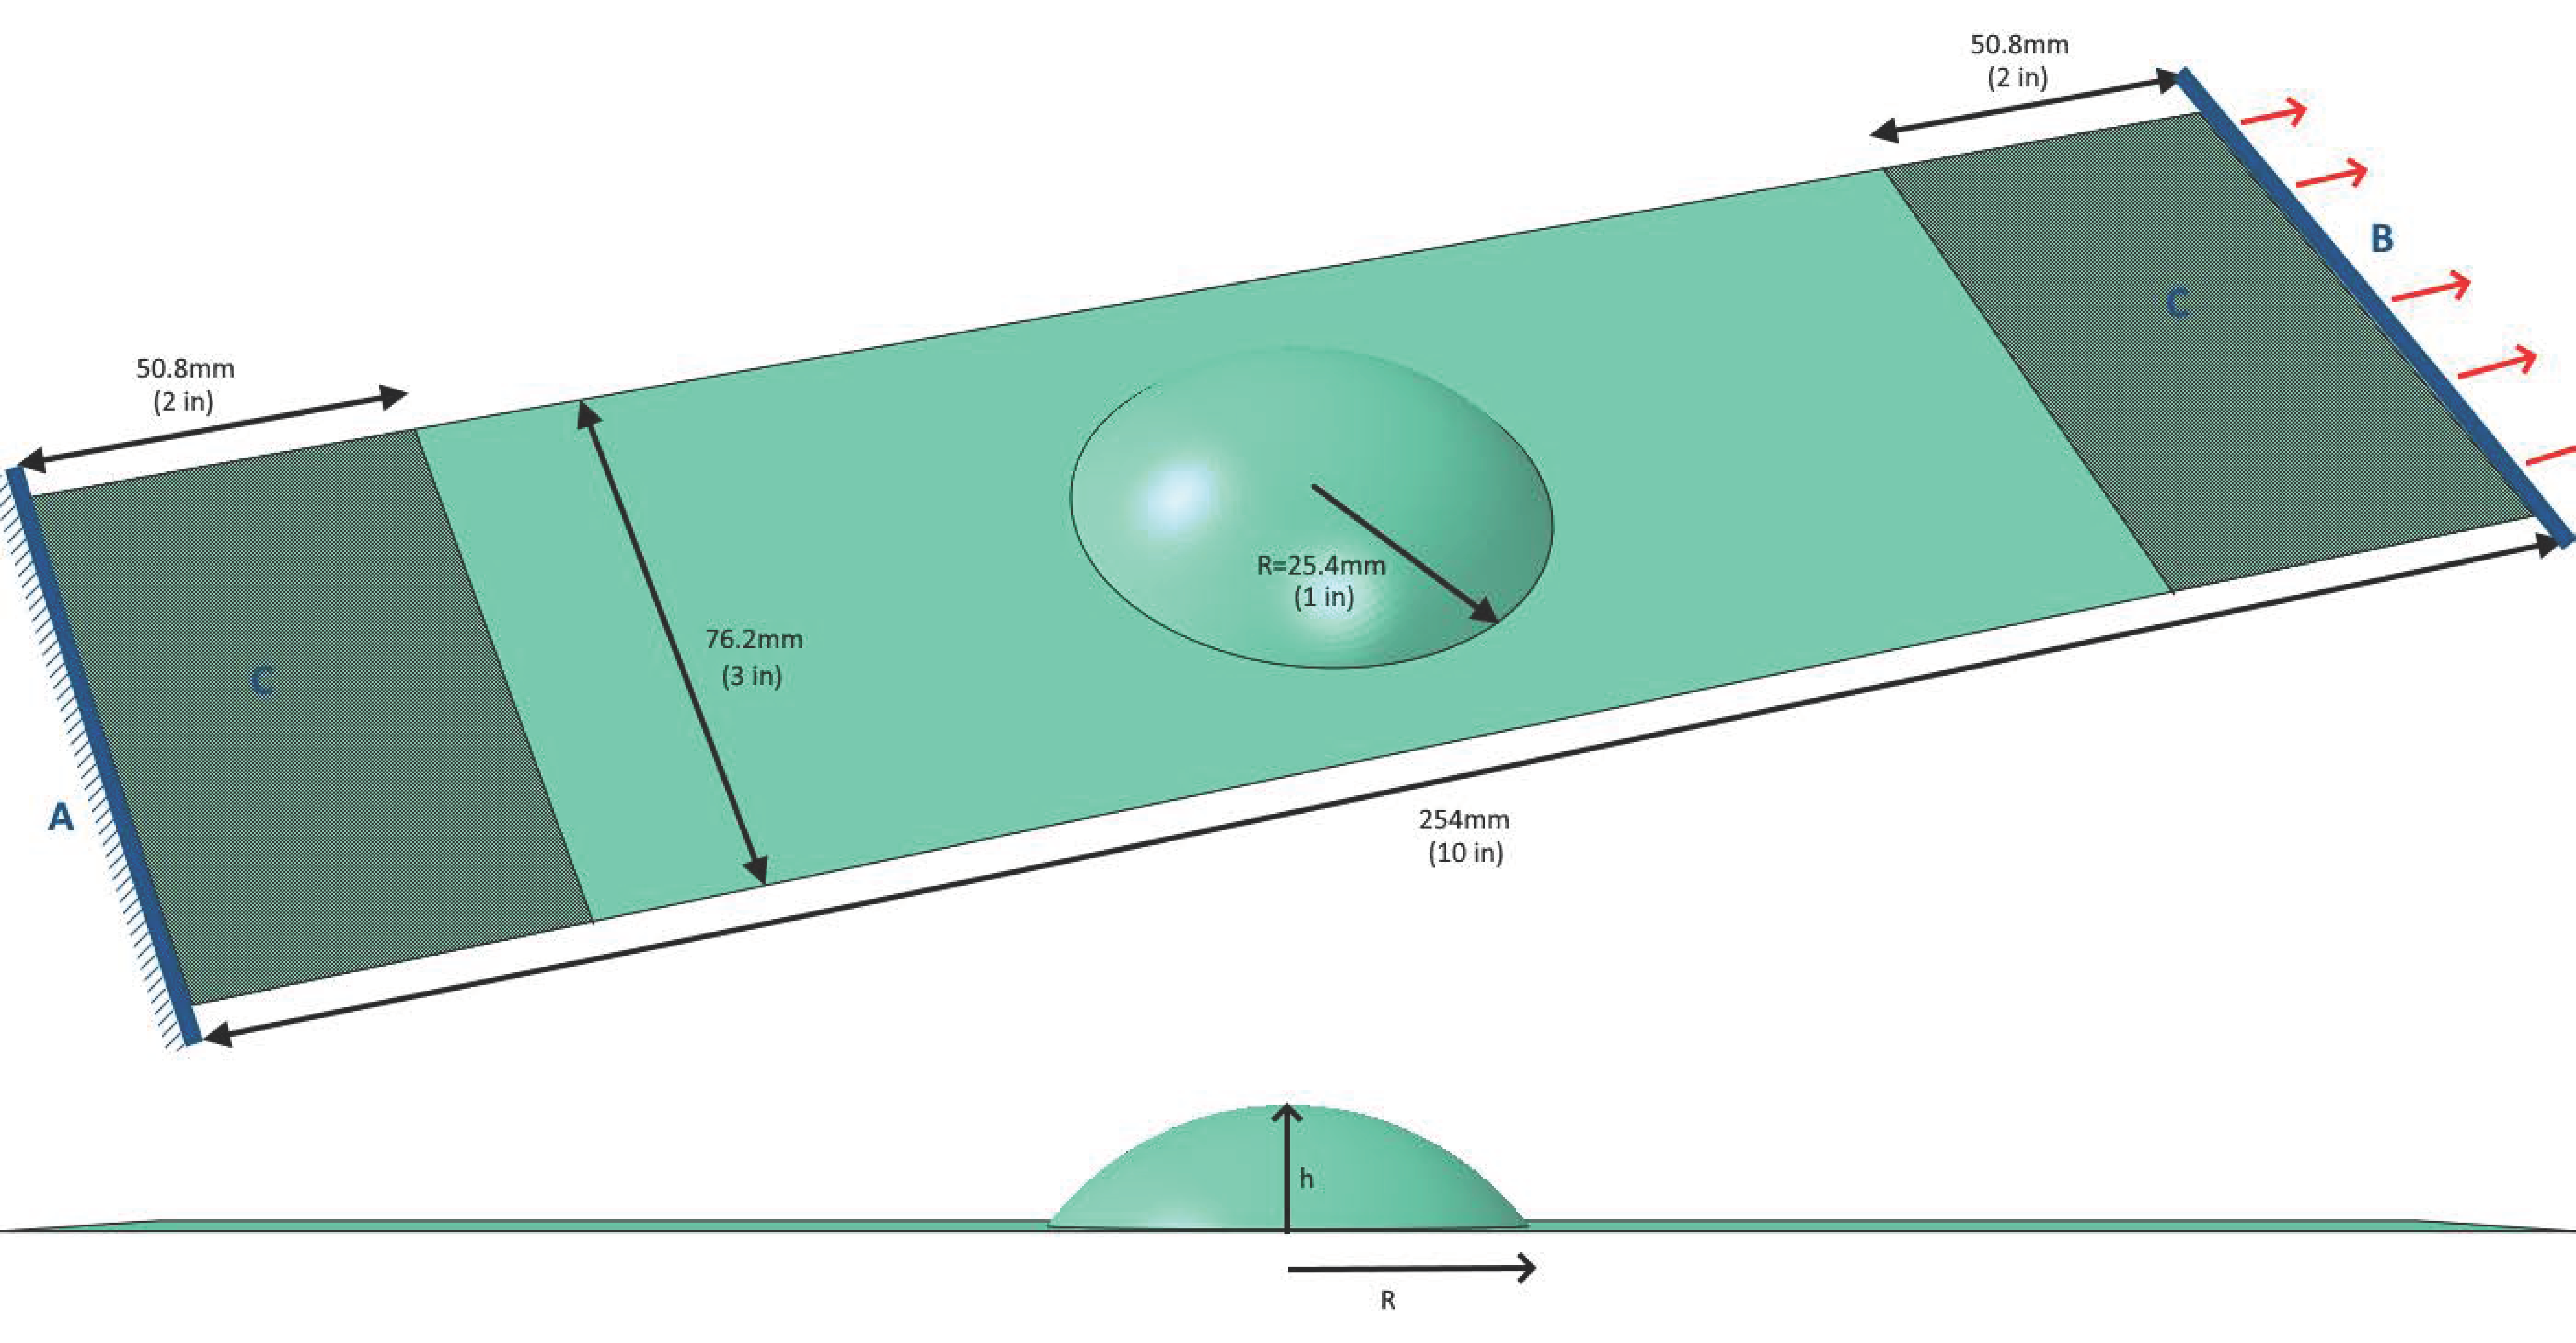
4.2.1. Model Specifications
- A
- Displacements and rotations of nodes along one end of the model were fixed.
- B
- Displacements and rotations of nodes along the opposite end, were fixed except for displacement in the direction of the plate’s longitudinal axis. The longitudinal displacement was set to 0.5 mm. This corresponds with a tensile strain of 0.2% in the equivalent flat plate. Note also that this is an elastic quasi-static analysis, so all dynamic effects are considered negligible, and no velocity is defined.
- C
- A region 50.8 mm (2) from either end was fixed to all out-of-plane motion to approximate the restriction caused by a tension tester’s grips.
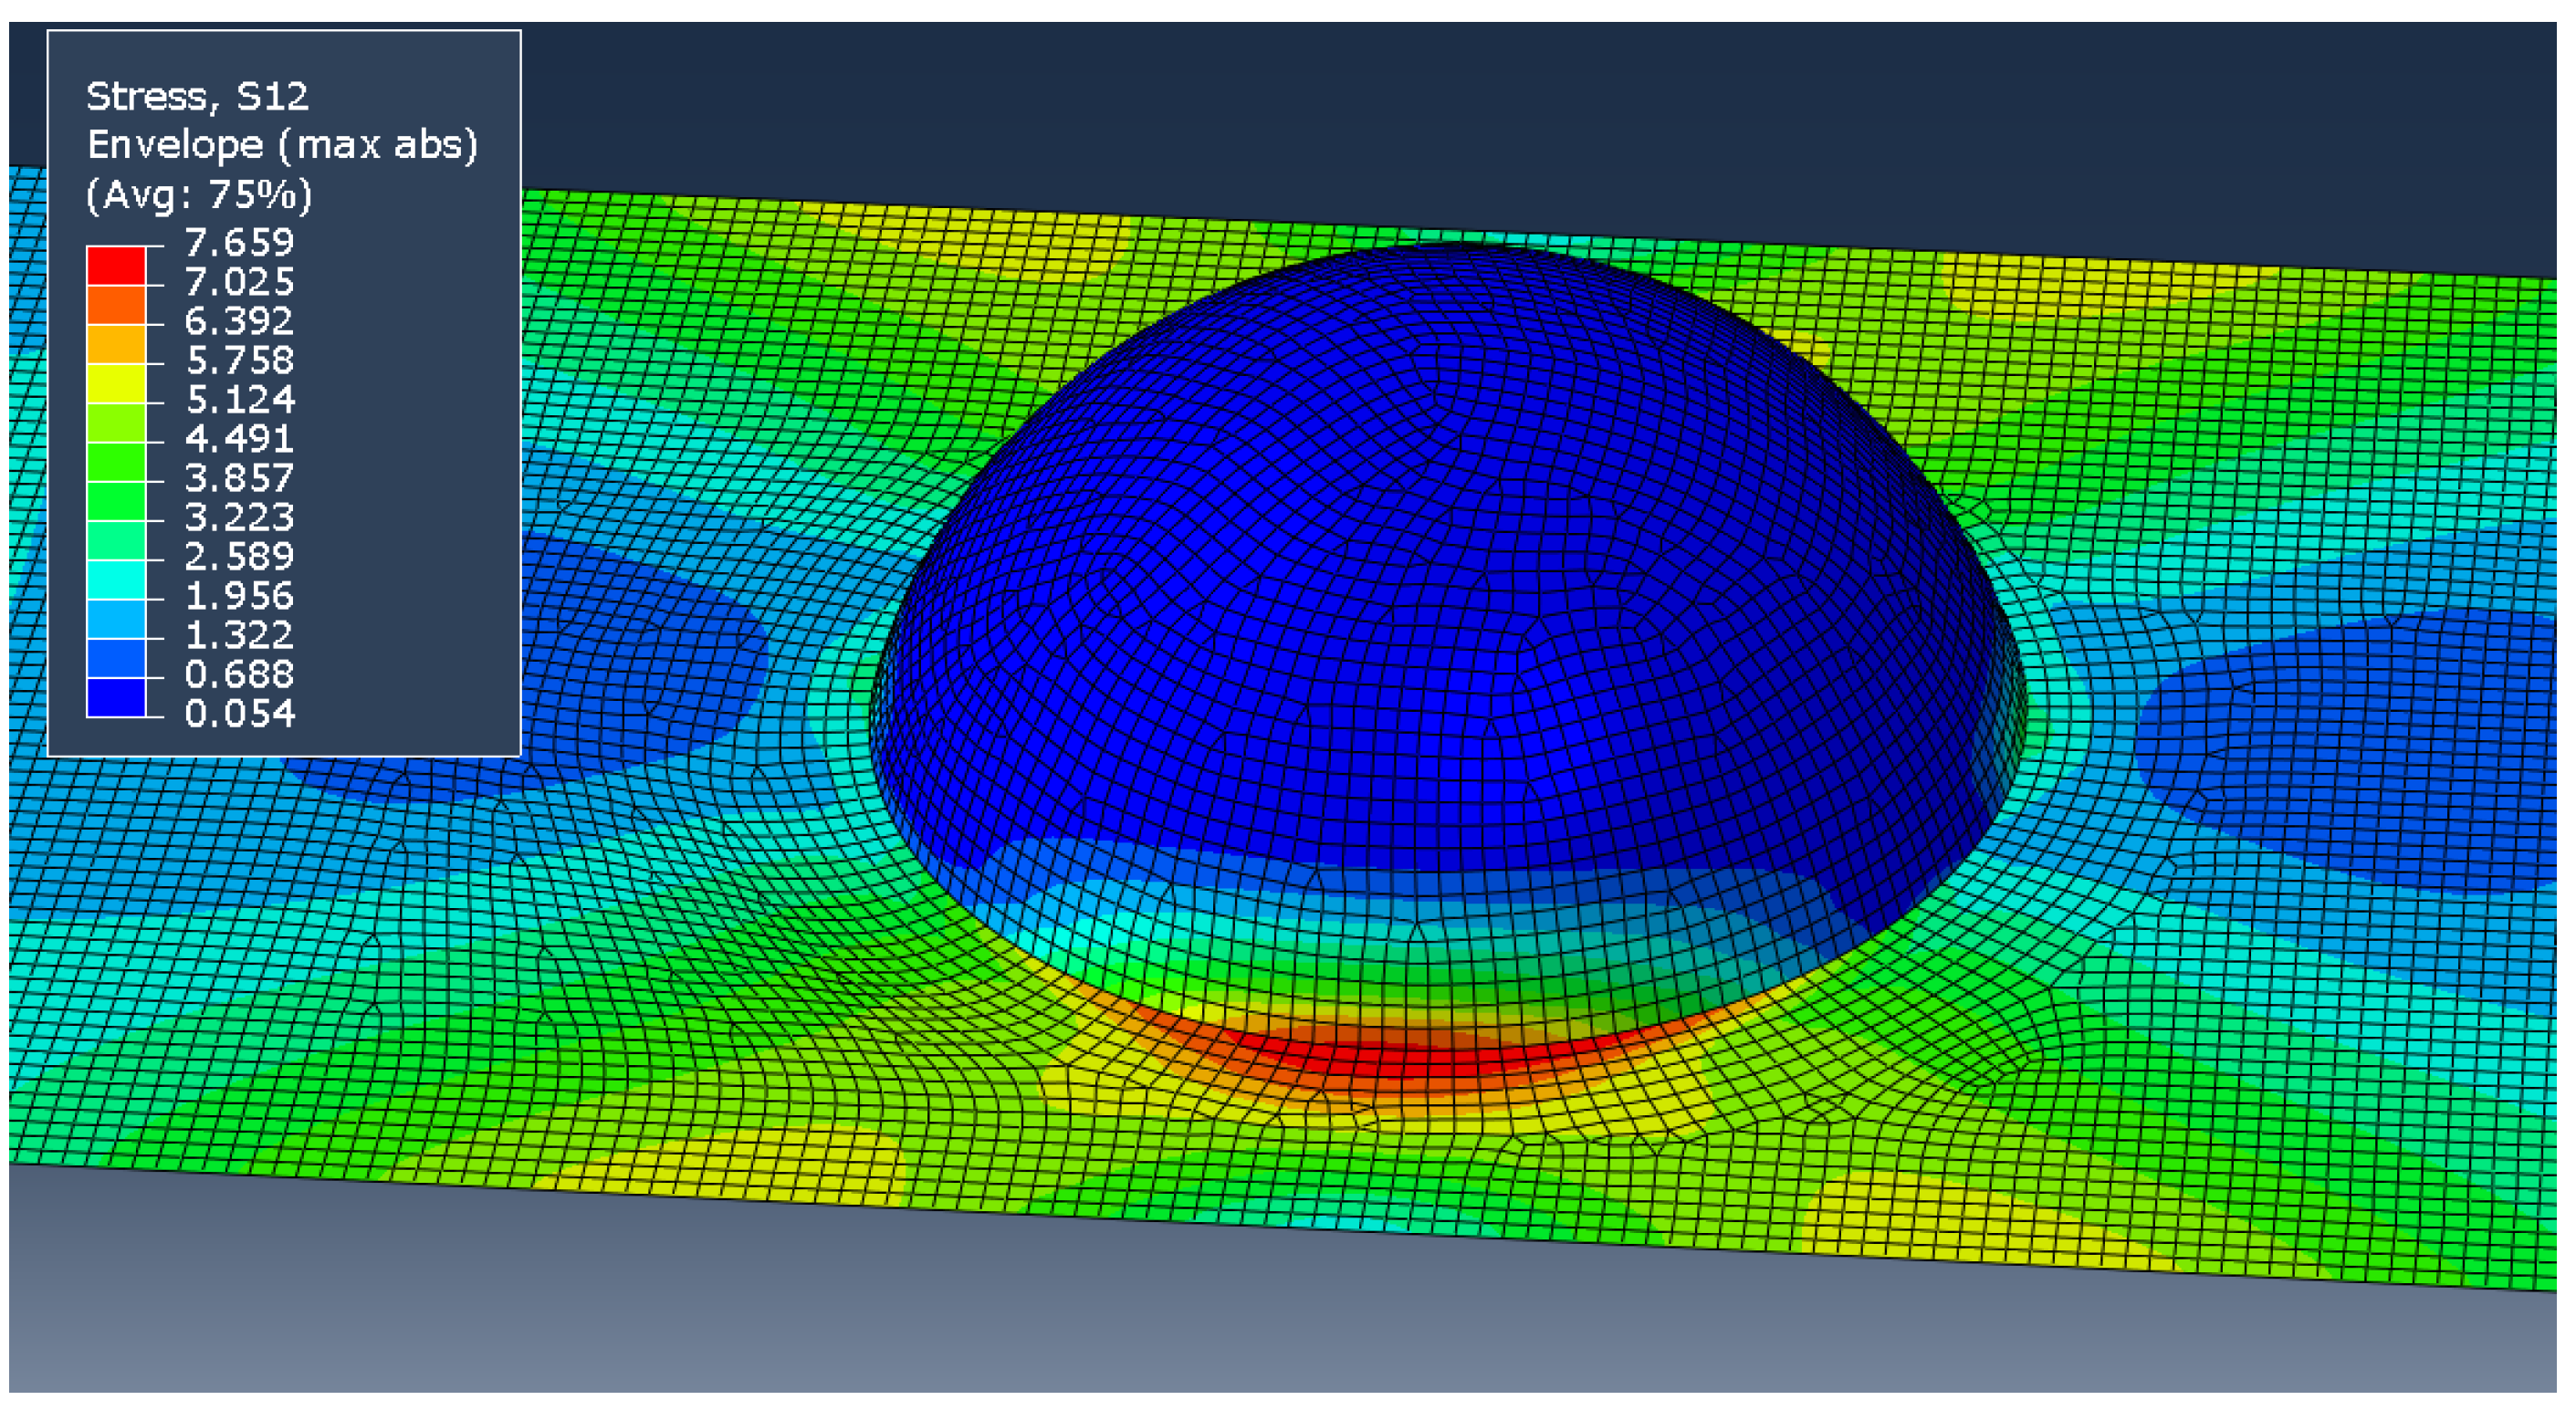
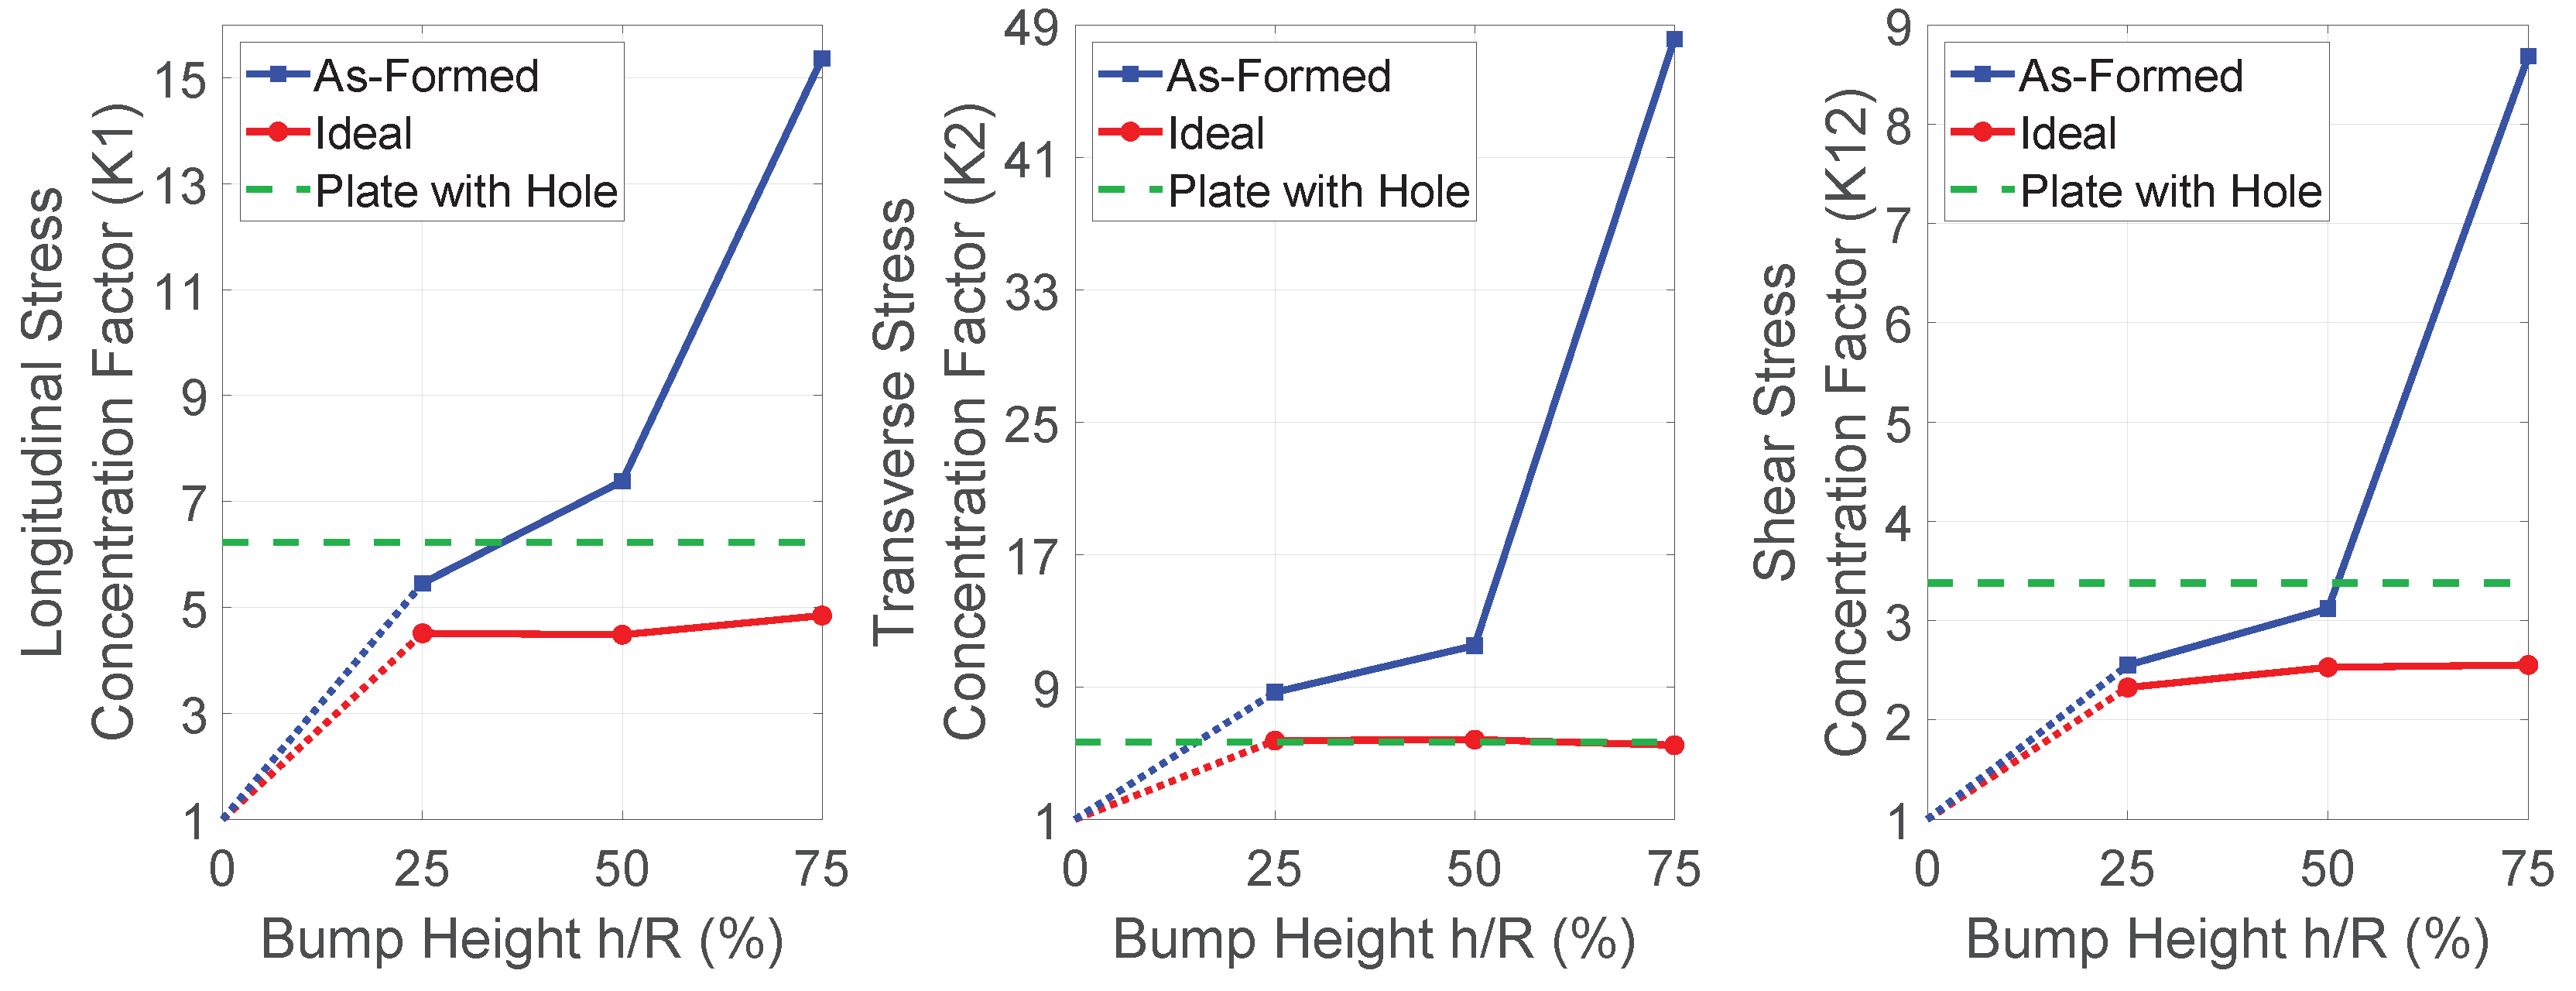
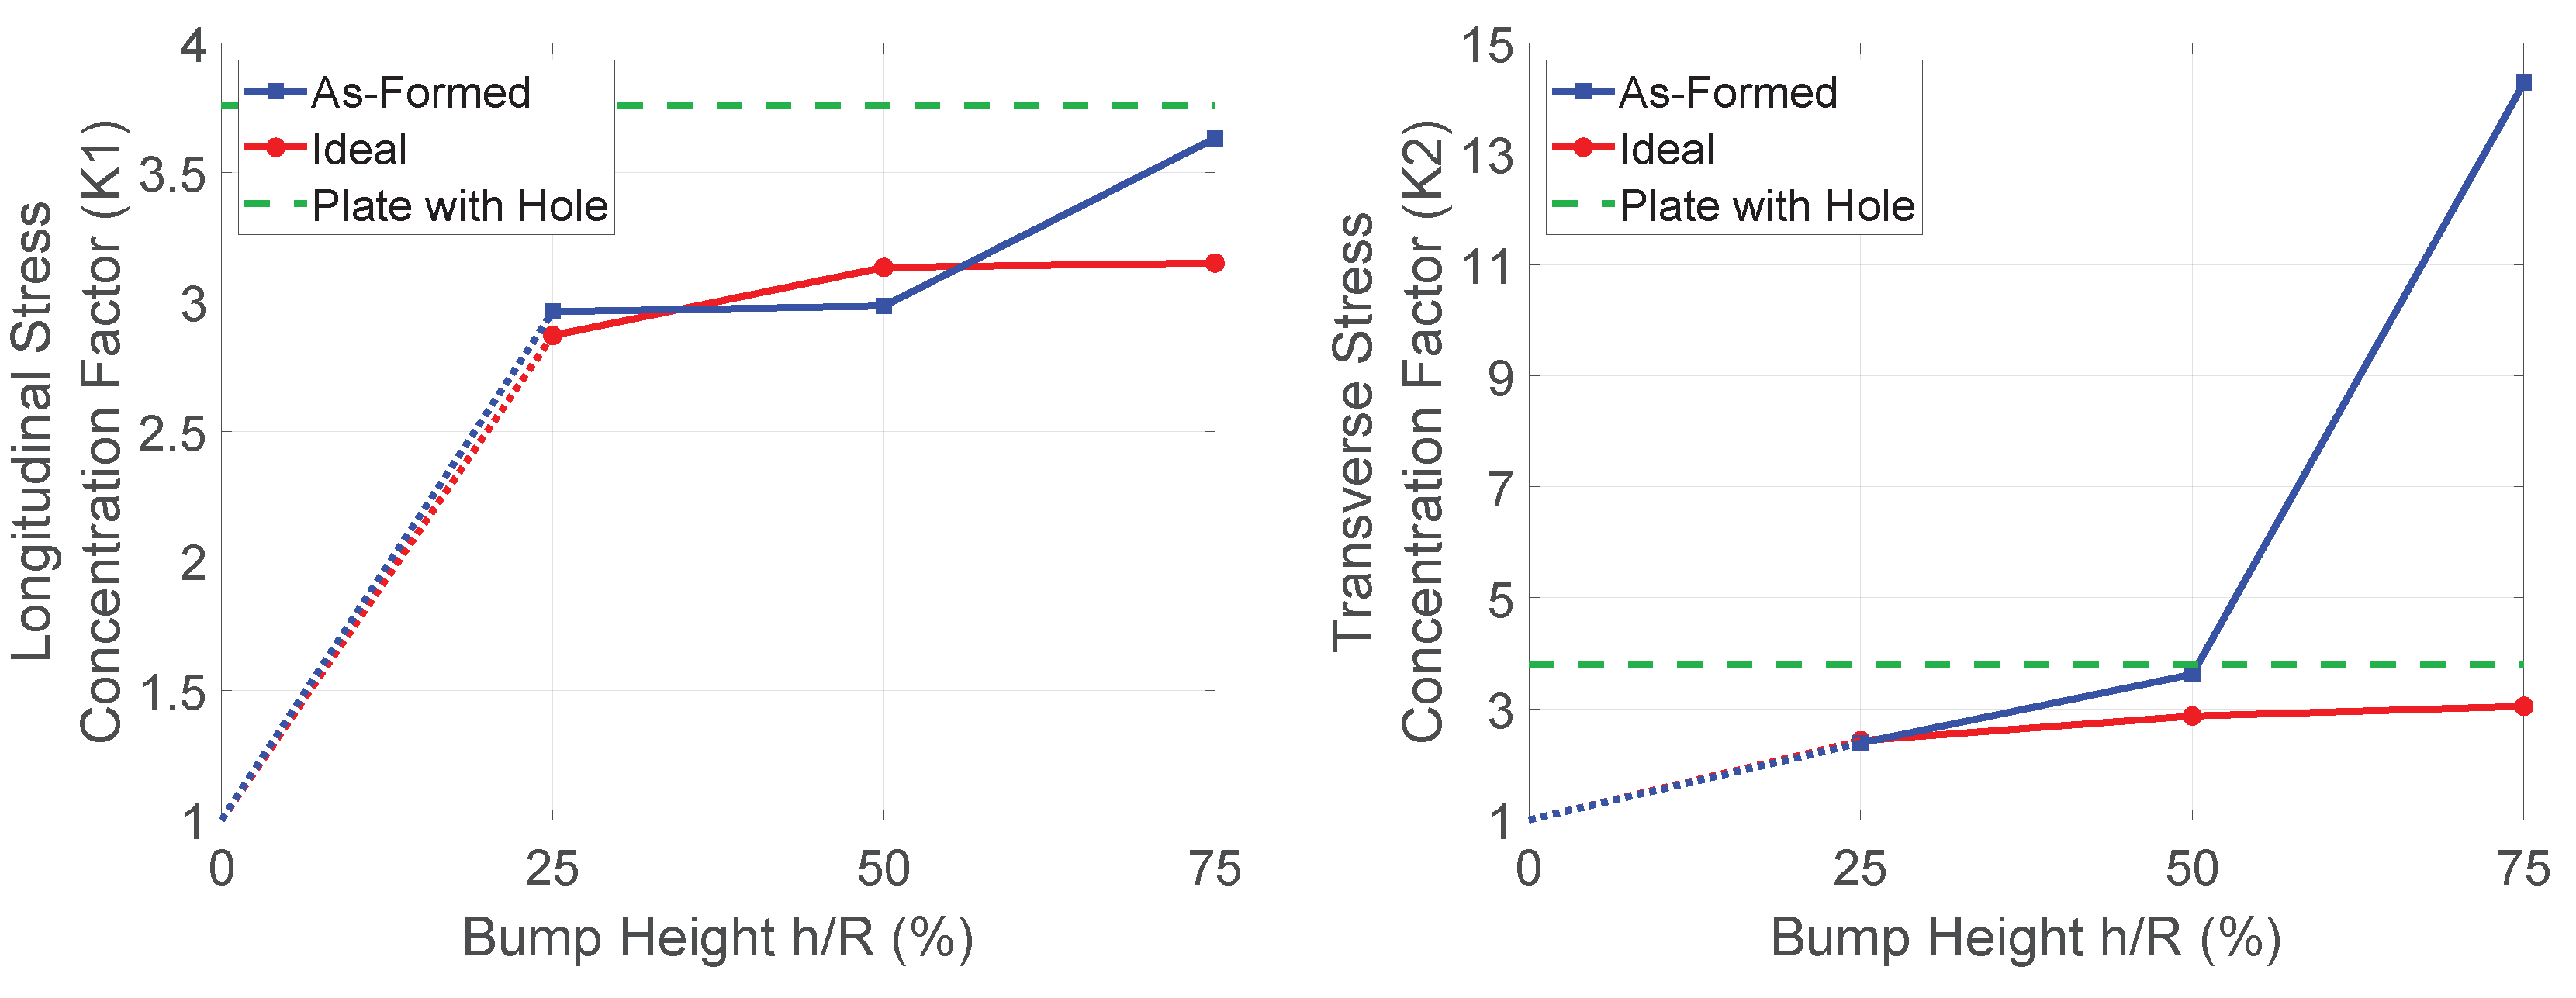
4.2.2. Comparison of Stress Concentrations
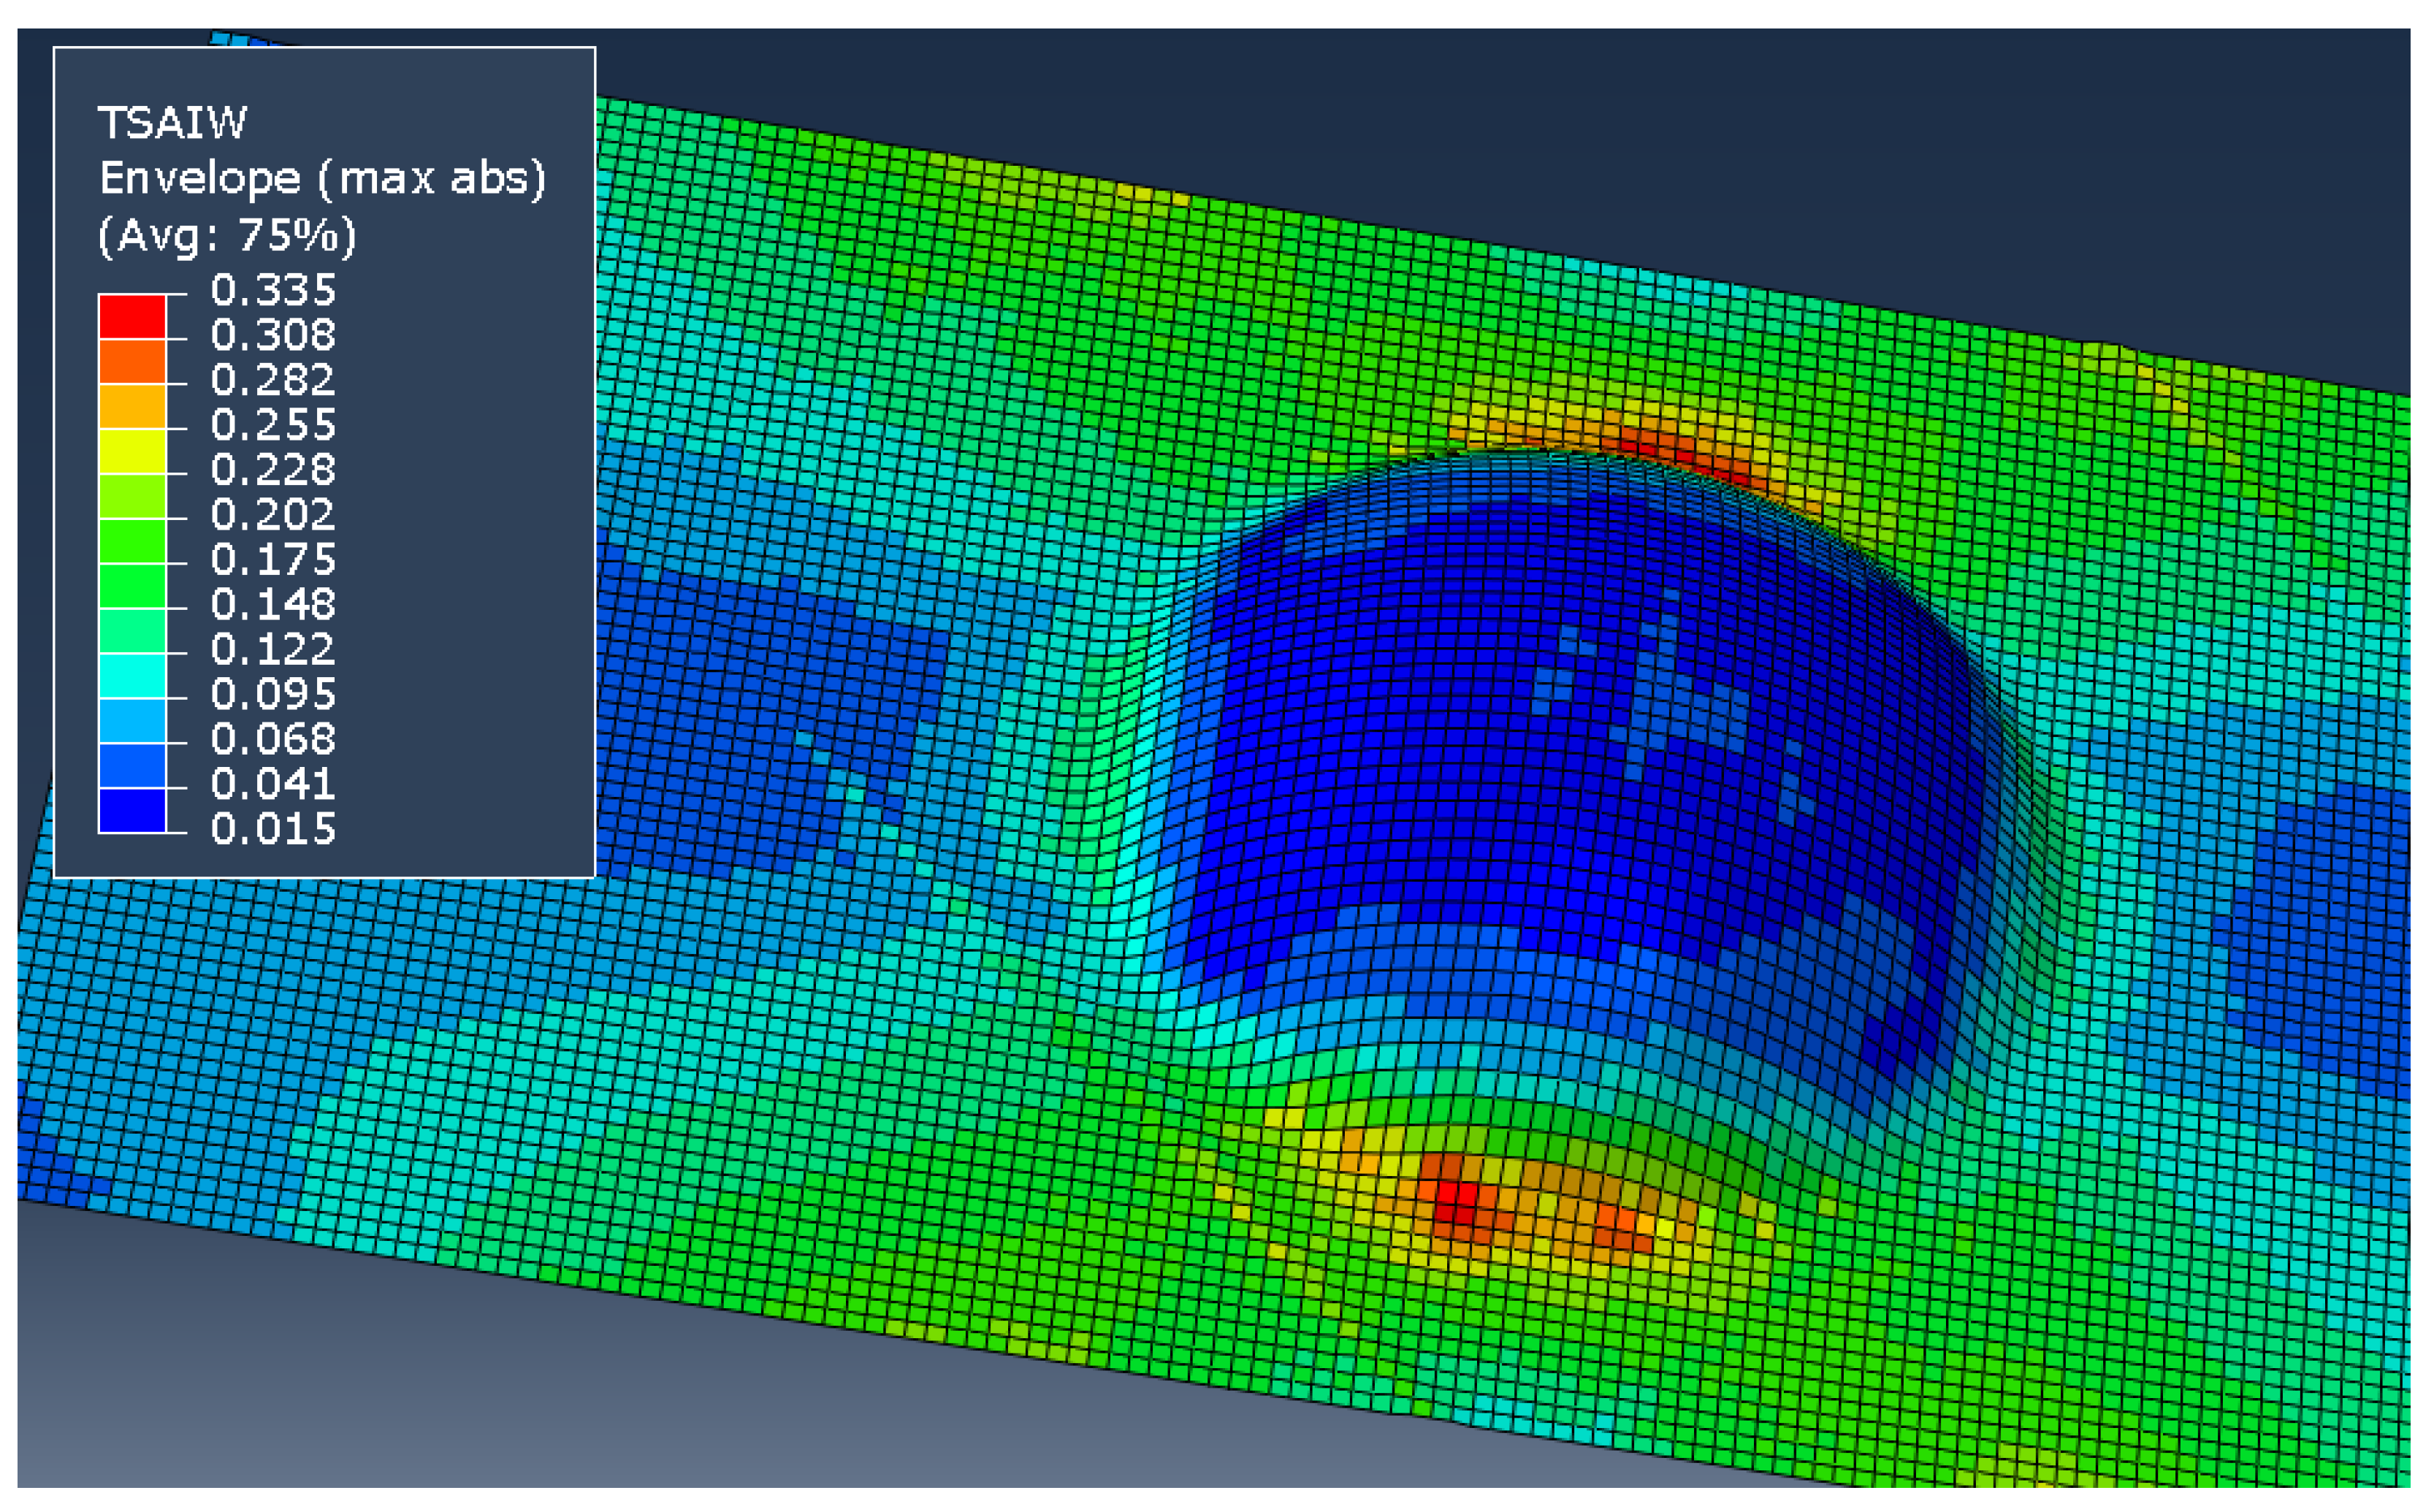
4.2.3. Tsai-Wu First Ply Failure
4.3. Discussion
5. Conclusions and Recommendations
Author Contributions
Funding
Data Availability Statement
Acknowledgments
Conflicts of Interest
References
- Chang, I.Y.; Lees, J.K. Recent Development in Thermoplastic Composites: A Review of Matrix Systems and Processing Methods. J. Thermoplast. Compos. Mater. 1988, 1, 277–296. [Google Scholar] [CrossRef]
- Chabin, M.; Gerard, P.; Clerc, P. Simulation boosts the use of thermoplastic composites in mass production. JEC Compos. Mag. 2017, 54, 32–33. [Google Scholar]
- Warren, K.C. Resistance Welding of Thermoplastic Composites for Industrial Scale Wind Turbine Blades. Master’s Thesis, University of Maine, Orono, ME, USA, November 2012. [Google Scholar]
- Diaz, J.; Rubio, L. Developments to manufacture structural aeronautical parts in carbon fibre reinforced thermoplastic materials. J. Mater. Process. Technol. 2003, 143–144, 342–346. [Google Scholar] [CrossRef]
- Kropka, M.; Muehlbacher, M.; Neumeyer, T.; Altstaedt, V. From UD-tape to Final Part—A Comprehensive Approach Towards Thermoplastic Composites. Procedia CIRP 2017, 66, 96–100. [Google Scholar] [CrossRef]
- McGuinness, G.; ÓBrádaigh, C. Characterisation of thermoplastic composite melts in rhombus-shear: The picture-frame experiment. Compos. Part A Appl. Sci. Manuf. 1998, 29, 115–132. [Google Scholar] [CrossRef]
- McGuinness, G.B.; ÓBrádaigh, C.M. Development of rheological models for forming flows and picture-frame shear testing of fabric reinforced thermoplastic sheets. J. Non-Newton. Fluid Mech. 1997, 73, 1–28. [Google Scholar] [CrossRef]
- Roberts, R.W.; Jones, R.S. Rheological characterization of continuous fibre composites in oscillatory shear flow. Compos. Manuf. 1995, 6, 161–167. [Google Scholar] [CrossRef]
- Sunderland, P.; Yu, W.; Mnson, J.A. A thermoviscoelastic analysis of process-induced internal stresses in thermoplastic matrix composites. Polym. Compos. 2001, 22, 579–592. [Google Scholar] [CrossRef]
- Sjölander, J.; Hallander, P.; Åkermo, M. Forming induced wrinkling of composite laminates: A numerical study on wrinkling mechanisms. Compos. Part A Appl. Sci. Manuf. 2016, 81, 41–54. [Google Scholar] [CrossRef]
- Haanappel, S.P.; Ten Thije, R.; Sachs, U.; Rietman, B.; Akkerman, R. Formability analyses of uni-directional and textile reinforced thermoplastics. Compos. Part A Appl. Sci. Manuf. 2014, 56, 80–92. [Google Scholar] [CrossRef]
- Yin, H.; Peng, X.; Du, T.; Chen, J. Forming of thermoplastic plain woven carbon composites: An experimental investigation. J. Thermoplast. Compos. Mater. 2015, 28, 730–742. [Google Scholar] [CrossRef]
- Pickett, A.K.; Queckbörner, T.; De Luca, P.; Haug, E. An explicit finite element solution for the forming prediction of continuous fibre-reinforced thermoplastic sheets. Compos. Manuf. 1995, 6, 237–243. [Google Scholar] [CrossRef]
- Okine, R.K. Analysis of Forming Parts from Advanced Thermoplastic Composite Sheet Materials. J. Thermoplast. Compos. Mater. 1989, 2, 50–76. [Google Scholar] [CrossRef]
- Liu, L.; Chen, J.; Li, X.; Sherwood, J. Two-dimensional macro-mechanics shear models of woven fabrics. Compos. Part A Appl. Sci. Manuf. 2005, 36, 105–114. [Google Scholar] [CrossRef]
- Wehrle, M. CMIST Structural Thermoplastics Roadmapping Report. 2017. Available online: https://composites.umaine.edu/wp-content/uploads/sites/20/2017/11/v5CMIST-Roadmapping-November-Report-Full.pdf (accessed on 16 March 2022).
- Milani, A.S.; Nemes, J.A.; Abeyaratne, R.C.; Holzapfel, G.A. A method for the approximation of non-uniform fiber misalignment in textile composites using picture frame test. Compos. Part A Appl. Sci. Manuf. 2007, 38, 1493–1501. [Google Scholar] [CrossRef]
- Dangora, L.M.; Hansen, C.J.; Mitchell, C.J.; Sherwood, J.A.; Parker, J.C. Challenges associated with shear characterization of a cross-ply thermoplastic lamina using picture frame tests. Compos. Part A Appl. Sci. Manuf. 2015, 78, 181–190. [Google Scholar] [CrossRef]
- Peng, X.Q.; Cao, J.; Chen, J.; Xue, P.; Lussier, D.S.; Liu, L. Experimental and numerical analysis on normalization of picture frame tests for composite materials. Compos. Sci. Technol. 2004, 64, 11–21. [Google Scholar] [CrossRef]
- Glaser, R.; Caccese, V. Experimental determination of shear properties, buckling resistance and diagonal tension field of polyurethane coated nylon fabric. J. Text. Inst. 2014, 105, 980–997. [Google Scholar] [CrossRef]
- Stanley, W.F.; Mallon, P.J. Intraply shear characterisation of a fibre reinforced thermoplastic composite. Compos. Part A Appl. Sci. Manuf. 2006, 37, 939–948. [Google Scholar] [CrossRef]
- Willems, A.; Lomov, S.V.; Verpoest, I.; Vandepitte, D. Picture frame shear tests on woven textile composite reinforcements with controlled pretension. In AIP Conference Proceedings; American Institute of Physics: College Park, MD, USA, 2007; Volume 907. [Google Scholar] [CrossRef]
- Cao, J.; Akkerman, R.; Boisse, P.; Chen, J.; Cheng, H.S.; de Graaf, E.F.; Gorczyca, J.L.; Harrison, P.; Hivet, G.; Launay, J.; et al. Characterization of mechanical behavior of woven fabrics: Experimental methods and benchmark results. Compos. Part A Appl. Sci. Manuf. 2008, 39, 1037–1053. [Google Scholar] [CrossRef]
- Lebrun, G.; Bureau, M.N.; Denault, J. Evaluation of bias-extension and picture-frame test methods for the measurement of intraply shear properties of PP/glass commingled fabrics. Compos. Struct. 2003, 61, 341–352. [Google Scholar] [CrossRef]
- Lomov, S.V.; Boisse, P.; Deluycker, E.; Morestin, F.; Vanclooster, K.; Vandepitte, D.; Verpoest, I.; Willems, A. Full-field strain measurements in textile deformability studies. Compos. Part A Appl. Sci. Manuf. 2008, 39, 1232–1244. [Google Scholar] [CrossRef]
- Larberg, Y.; Åkermo, M. In-plane deformation of multi-layered unidirectional thermoset prepreg—Modelling and experimental verification. Compos. Part A Appl. Sci. Manuf. 2014, 56, 203–212. [Google Scholar] [CrossRef]
- Aridhi, A.; Arfaoui, M.; Mabrouki, T.; Naouar, N.; Denis, Y.; Zarroug, M.; Boisse, P. Textile composite structural analysis taking into account the forming process. Compos. Part B Eng. 2019, 166, 773–784. [Google Scholar] [CrossRef]
- Cartwright, B.K.; Lex Mulcahy, N.; Chhor, A.O.; Thomas, S.G.F.; Suryanarayana, M.; Sandlin, J.D.; Crouch, I.G.; Naebe, M. Thermoforming and Structural Analysis of Combat Helmets. J. Manuf. Sci. Eng. 2015, 137, 277–279. [Google Scholar] [CrossRef]
- Sisca, L.; Locatelli Quacchia, P.T.; Messana, A.; Airale, A.G.; Ferraris, A.; Carello, M.; Monti, M.; Palenzona, M.; Romeo, A.; Liebold, C.; et al. Validation of a Simulation Methodology for Thermoplastic and Thermosetting Composite Materials Considering the Effect of Forming Process on the Structural Performance. Polymers 2020, 12, 2801. [Google Scholar] [CrossRef]
- Hineno, S.; Yoneyama, T.; Tatsuno, D.; Kimura, M.; Shiozaki, K.; Moriyasu, T.; Okamoto, M.; Nagashima, S. Fiber deformation behavior during press forming of rectangle cup by using plane weave carbon fiber reinforced thermoplastic sheet. Procedia Eng. 2014, 81, 1614–1619. [Google Scholar] [CrossRef][Green Version]
- Duhovic, M. Deformation Characteristics of Knitted Fabric Composites. Ph.D. Thesis, University of Auckland New Zealand, Auckland, New Zealand, 2004. [Google Scholar]
- Wang, P.; Hamila, N.; Boisse, P.; Chaudet, P.; Lesueur, D. Thermo-mechanical behavior of stretch-broken carbon fiber and thermoplastic resin composites during manufacturing. Polym. Compos. 2015, 36, 694–703. [Google Scholar] [CrossRef]
- Black, S. Aligned discontinuous fibers come of age. High-Perform. Compos. 2008, 16, 42–47. [Google Scholar]
- Willems, A. Forming Simulation of Textile Reinforced Composite Shell Structures. Ph.D. Thesis, University of Leuven, Leuven, Belgium, 2008. [Google Scholar]
- Haanappel, S.P. Forming of UD Fibre Reinforced Thermoplastics. Ph.D. Thesis, University of Twente, Enschede, The Netherlands, 2013. [Google Scholar]
- Haanappel, S.P.; Akkerman, R. Shear characterisation of uni-directional fibre reinforced thermoplastic melts by means of torsion. Compos. Part A Appl. Sci. Manuf. 2014, 56, 8–26. [Google Scholar] [CrossRef]
- ASTM D618-13; Standard Practice for Conditioning Plastics for Testing. American Society for Testing and Materials: West Conshohocken, PA, USA, 2013.
- Liang, B.; Hamila, N.; Peillon, M.; Boisse, P. Analysis of thermoplastic prepreg bending stiffness during manufacturing and of its influence on wrinkling simulations. Compos. Part A Appl. Sci. Manuf. 2014, 67, 111–122. [Google Scholar] [CrossRef]
- Boisse, P.; Hamila, N.; Vidal-Salle, E.; Dumont, F. Simulation of wrinkling during textile composite reinforcement forming. Influence of tensile, in-plane shear and bending stiffnesses. Compos. Sci. Technol. 2011, 71, 683–692. [Google Scholar] [CrossRef]
- Barbero, E.J. Introduction to Composite Materials Design, 2nd ed.; CRC Press: Boca Raton, FL, USA, 2011. [Google Scholar]
- Chen, Q.; Boisse, P.; Park, C.H.; Saouab, A.; Breard, J. Intra/inter-ply shear behaviors of continuous fiber reinforced thermoplastic composites in thermoforming processes. Compos. Struct. 2011, 93, 1692–1703. [Google Scholar] [CrossRef]
- Lightfoot, J.S.; Wisnom, M.R.; Potter, K. A new mechanism for the formation of ply wrinkles due to shear between plies. Compos. Part A Appl. Sci. Manuf. 2013, 49, 139–147. [Google Scholar] [CrossRef]
- Larberg, Y.R.; Åkermo, M. On the interply friction of different generations of carbon/epoxy prepreg systems. Compos. Part A Appl. Sci. Manuf. 2011, 42, 1067–1074. [Google Scholar] [CrossRef]
- Isogawa, S.; Aoki, H.; Tejima, M. Isothermal forming of CFRTP sheet by penetration of hemispherical punch. Procedia Eng. 2014, 81, 1620–1626. [Google Scholar] [CrossRef]
- Potluri, P.; Sharma, S.; Ramgulam, R. Comprehensive drape modelling for moulding 3D textile preforms. Compos. Part A Appl. Sci. Manuf. 2001, 32, 1415–1424. [Google Scholar] [CrossRef]
- Wang, J.; Paton, R.; Page, J. The draping of woven fabric preforms and prepregs for production of polymer composite components. Compos. Part A Appl. Sci. Manuf. 1999, 30, 757–765. [Google Scholar] [CrossRef]
- Cherouat, A.; Billoët, J.L. Mechanical and numerical modelling of composite manufacturing processes deep-drawing and laying-up of thin pre-impregnated woven fabrics. J. Mater. Process. Technol. 2001, 118, 460–471. [Google Scholar] [CrossRef]
- Margossian, A.; Bel, S.; Hinterhoelzl, R. On the characterisation of transverse tensile properties of molten unidirectional thermoplastic composite tapes for thermoforming simulations. Compos. Part A Appl. Sci. Manuf. 2016, 88, 48–58. [Google Scholar] [CrossRef]
- Thagard, J.; Liu, Q.; Liang, Z.; Okoli, O.; Wang, H. Simulation of the Resin Infusion Between Double Flexible Tooling Process and Experimental Validation. In Proceedings of the AmeriPAM Conference, Troy, MI, USA, 3–4 November 2003. [Google Scholar]
- ESI-Group. PAM-Form User Guide; ESI-Group: Rungis, France, 2015. [Google Scholar]
- Yu, W.R.; Pourboghrat, F.; Chung, K.; Zampaloni, M.; Kang, T.J. Non-orthogonal constitutive equation for woven fabric reinforced thermoplastic composites. Compos. Part A Appl. Sci. Manuf. 2002, 33, 1095–1105. [Google Scholar] [CrossRef]
- GOM GmbH. GOM Testing—Technical Documentation as of V8 SR1, Digital Image Correlation and Strain Computation Basics; GOM mbH: Braunschweig, Germany, 2016. [Google Scholar]
- Nishi, M.; Kaburagi, T.; Kurose, M.; Hirashima, T.; Kurasiki, T. Forming simulation of thermoplastic pre-impregnated textile composite. Int. J. Mater. Text Eng. 2014, 8, 779–787. [Google Scholar]
- Dassault System. ABAQUS User Guide; Version 6.14; Dassault System: Velizy-Villacoublay, France, 2014. [Google Scholar]
- Ineos Olefins & Polymers USA. Typcal Engineering Properties of Polypropylene; Ineos Olefins & Polymers USA: Fort Worth, TX, USA, 2014. [Google Scholar]
- Boedeker Plastics Inc. Specifications for Polypropylene-Natural. Available online: https://www.boedeker.com/Product/Polypropylene-Natural (accessed on 16 March 2022).
- Daniel, I.M.; Ishai, O. Engineering Mechanics of Composite Materials, 2nd ed.; Oxford University Press Inc.: New York, NY, USA, 2006. [Google Scholar]
- Chen, T.; Dvorak, G.J.; Benveniste, Y. Mori-Tanaka Estimates of the Overall Elastic Moduli of Certain Composite Materials. J. Appl. Mech. 1992, 59, 539. [Google Scholar] [CrossRef]
- Seigars, C. Feasibility of Hybrid Thermoplastic Composite-Concrete Load Bearing System. Master’s Thesis, University of Maine, Orono, ME, USA, 2018. [Google Scholar]
- ESI Group PAM Composites Software Catalog. Available online: https://www.esi-group.com/products/composites (accessed on 16 March 2022).
- Ansys Inc. Connecting Composite Forming Simulations in AniForm with Ansys Structural Simulation. Available online: https://www.ansys.com/de-de/resource-center/webinar/connecting-composite-forming-simulations-in-aniform-with-ansys-structural-simulation (accessed on 16 March 2022).


| Experiment | Target Properties | Specimen Dimensions | Swept Temperatures | Repeats |
|---|---|---|---|---|
| Dynamic Torsion (Prismatic) | Shear Modulus | 10 × 4 × 35 mm | 80–200 C | 9 |
| Dynamic Torsion (Dogbone) | Shear Modulus | 4 × 4 × 35 mm | 80–200 C | 3 |
| Dynamic Tension (Fiber) | Longitudinal Modulus | 8 × 0.3 × 30 mm | 40–200 C | 8 |
| Dynamic Tension (Transverse) | Transverse Modulus | 8 × 0.3 × 30 mm | 40–200 C | 3 |
| Dynamic Bending (Fiber) | Longitudinal Bending Modulus | 15 × 0.3 × 50 mm | 40–200 C | 8 |
| Measured Material (Panel-3) | Measured Material (Panel-4) | Measured Material (Panel-5) | ||
|---|---|---|---|---|
| In-plane shear modulus | 21.14 MPa | 0.922 MPa | 45.19 MPa | |
| Fiber-direction tensile modulus | 2.288 GPa | |||
| Fiber-bending modulus | 2.288 GPa | |||
| Transverse tensile modulus | 4.13 MPa | |||
| Transverse-bending modulus | 4.13 MPa | |||
| Density | 1.41 g/cm | |||
| Initial Fiber Volume Fraction | 0.36 | |||
| a Top Surface | ||||
|---|---|---|---|---|
| Region | Measured Angle (Experiments) | Predicted Angle (Generic Material) | Predicted Angle (Measured Material) (Panel 3) | Predicted Angle (Measured Material) (Panel 5) |
| T | ||||
| FR | ||||
| FL | ||||
| RR | ||||
| RL | ||||
| bBottom Surface | ||||
| Region | Measured Angle (Experiments) | Predicted Angle (Generic Material) | Predicted Angle (Measured Material) (Panel 3) | Predicted Angle (Measured Material) (Panel 5) |
| Region | ||||
| T | ||||
| FR | ||||
| FL | ||||
| RR | ||||
| RL | ||||
| Measured Angle (Experiments) | Predicted Angle (Generic Material) | Predicted Angle (Measured Material) (Panel 3) | Predicted Angle (Measured Material) (Panel 4) | |
|---|---|---|---|---|
| Angle |
| Idealized Model | As-Formed Model | |||
|---|---|---|---|---|
| h/R | Ply | Ply | ||
| 0.25 | 4.01 | 1 | 3.61 | 1 |
| 0.50 | 3.62 | 1 | 2.98 | 1 |
| 0.75 | 3.51 | 1 | 1.02 | 2 |
| Idealized Model | As-Formed Model | |||
|---|---|---|---|---|
| h/R | Ply | Ply | ||
| 0.25 | 2.55 | 2 | 2.62 | 2 |
| 0.50 | 2.12 | 2 | 1.82 | 4 |
| 0.75 | 1.96 | 2 | 0.65 | 3 |
Publisher’s Note: MDPI stays neutral with regard to jurisdictional claims in published maps and institutional affiliations. |
© 2022 by the authors. Licensee MDPI, Basel, Switzerland. This article is an open access article distributed under the terms and conditions of the Creative Commons Attribution (CC BY) license (https://creativecommons.org/licenses/by/4.0/).
Share and Cite
Bean, P.; Lopez-Anido, R.A.; Vel, S. Integration of Material Characterization, Thermoforming Simulation, and As-Formed Structural Analysis for Thermoplastic Composites. Polymers 2022, 14, 1877. https://doi.org/10.3390/polym14091877
Bean P, Lopez-Anido RA, Vel S. Integration of Material Characterization, Thermoforming Simulation, and As-Formed Structural Analysis for Thermoplastic Composites. Polymers. 2022; 14(9):1877. https://doi.org/10.3390/polym14091877
Chicago/Turabian StyleBean, Philip, Roberto A. Lopez-Anido, and Senthil Vel. 2022. "Integration of Material Characterization, Thermoforming Simulation, and As-Formed Structural Analysis for Thermoplastic Composites" Polymers 14, no. 9: 1877. https://doi.org/10.3390/polym14091877
APA StyleBean, P., Lopez-Anido, R. A., & Vel, S. (2022). Integration of Material Characterization, Thermoforming Simulation, and As-Formed Structural Analysis for Thermoplastic Composites. Polymers, 14(9), 1877. https://doi.org/10.3390/polym14091877