

Influence of the Heat Transfer Process on the Electrical and Mechanical Properties of Flexible Silver Conductors on Textiles


 , ,
, , 
Abstract
:1. Introduction
2. Materials and Methods
2.1. Materials
2.2. Preparations
2.3. Methods
3. Results and Discussion
4. Conclusions
Author Contributions
Funding
Institutional Review Board Statement
Data Availability Statement
Conflicts of Interest
Appendix A

| Composite | Temperature [°C] | Resistance before Heat Transfer [mΩ] | Resistance after Heat Transfer [mΩ] | Change in Resistance [%] |
|---|---|---|---|---|
| EDAG 725A | 150 | 369 | 372 | 0.81 |
| 160 | 366 | 332 | −9.29 | |
| 170 | 396 | 335 | −15.40 | |
| 180 | 393 | 321 | −18.32 | |
| 190 | 409 | 342 | −16.38 | |
| 200 | 390 | 334 | −14.36 | |
| 210 | 412 | 340 | −17.48 | |
| 220 | 405 | 340 | −16.05 | |
| TPU-Ag | 150 | 139 | 388 | 179.14 |
| 160 | 190 | 362 | 90.53 | |
| 170 | 125 | 210 | 68.00 | |
| 180 | 152 | 209 | 37.50 | |
| 190 | 192 | 183 | −4.69 | |
| 200 | 197 | 207 | 5.08 | |
| 210 | 162 | 145 | −10.49 | |
| 220 | 177 | 152 | −14.12 | |
| Novel-Ag | 170 | 159 | 1100 | 591.82 |
| 180 | 155 | 363 | 134.19 | |
| 190 | 148 | 271 | 83.11 | |
| 200 | 157 | 178 | 13.38 | |
| 210 | 151 | 165 | 9.27 | |
| 220 | 157 | 141 | −10.19 |
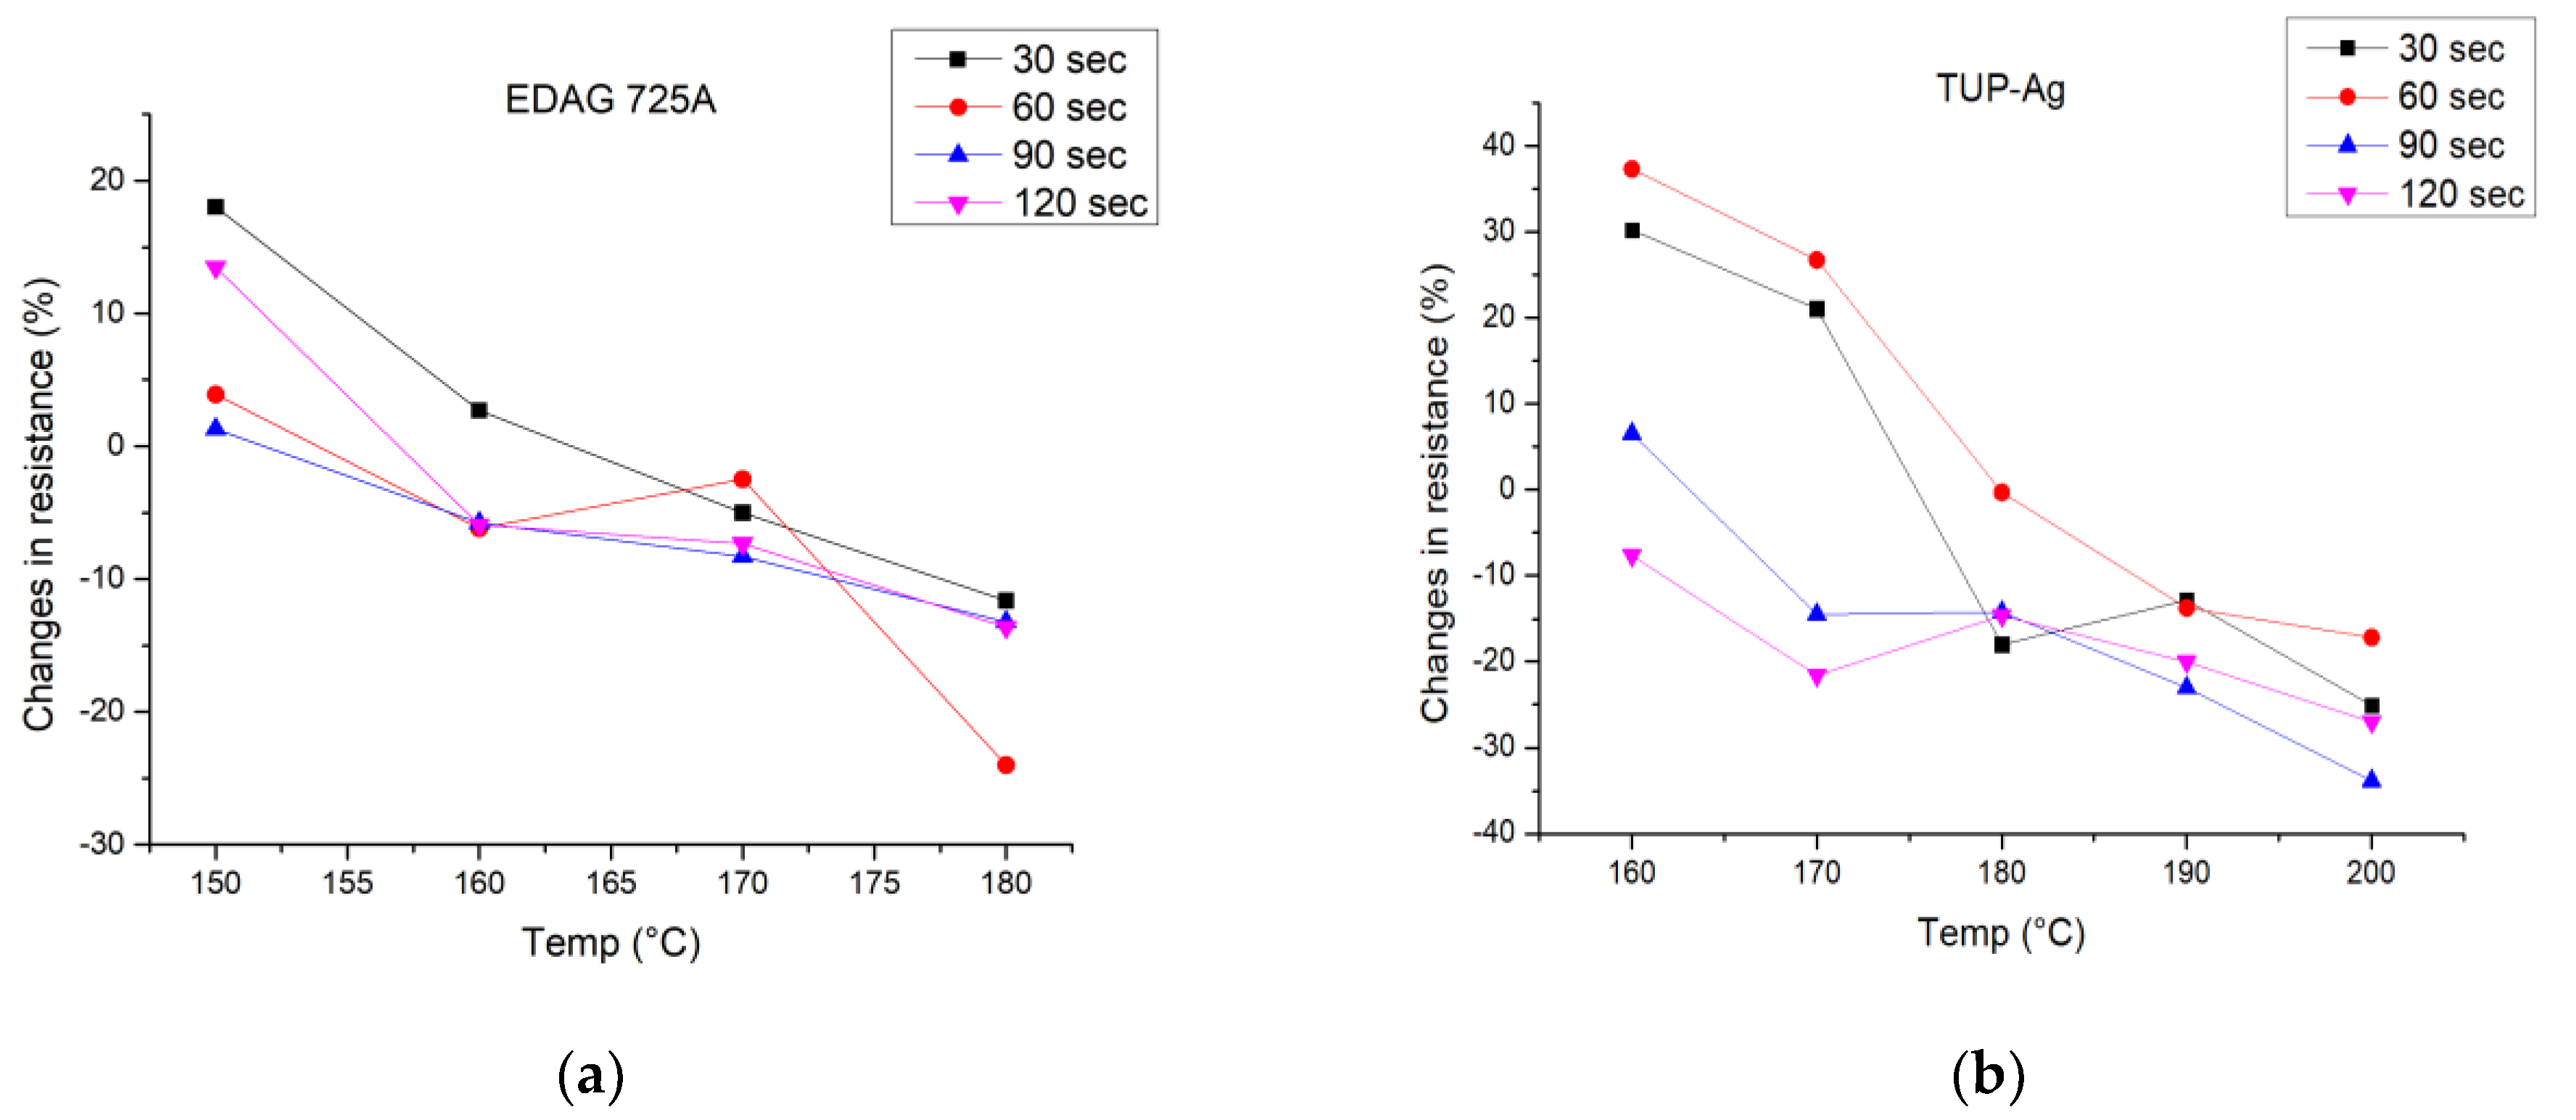
| Composite | Temperature [°C] | Time [s] | Average Resistance before Heat Transfer [mΩ] | Average Resistance after Heat Transfer [mΩ] | Change in Resistance [%] |
|---|---|---|---|---|---|
| EDAG 725A | 150 | 30 | 401.67 ± 15.28 | 475.333 ± 83.39 | 18.02 |
| 150 | 60 | 394.00 ± 23.26 | 409.67 ± 32.65 | 3.90 | |
| 150 | 90 | 425.00 ± 23.43 | 429.67 ± 8.50 | 1.29 | |
| 150 | 120 | 404.33 ± 10.69 | 458.67 ± 8.50 | 13.47 | |
| 160 | 30 | 397.67 ± 14.74 | 409.00 ± 56.40 | 2.70 | |
| 160 | 60 | 395.33 ± 25.58 | 371.33 ± 34.59 | −6.19 | |
| 160 | 90 | 389.33 ± 35.35 | 365.67 ± 13.01 | −5.76 | |
| 160 | 120 | 381.00 ± 13.45 | 358.00 ± 7.81 | −5.91 | |
| 170 | 30 | 358.67 ± 77.57 | 313.50 ± 54.22 | −5.01 | |
| 170 | 60 | 314.67 ± 70.55 | 301.67 ± 29.96 | −2.47 | |
| 170 | 90 | 353.67 ± 6.66 | 324.33 ± 5.51 | −8.29 | |
| 170 | 120 | 368.33 ± 23.07 | 341.00 ± 14.18 | −7.34 | |
| 180 | 30 | 398.67 ± 19.86 | 352.00 ± 9.17 | −11.63 | |
| 180 | 60 | 410.00 ± 16.09 | 311.67 ± 59.55 | −24.00 | |
| 180 | 90 | 416.67 ± 7.57 | 361.67 ± 25.42 | −13.22 | |
| 180 | 120 | 421.33 ± 27.59 | 363.67 ± 18.01 | −13.62 | |
| TPU-Ag | 160 | 30 | 193.00 ± 15.12 | 251.3319.75 | 30.22 |
| 160 | 60 | 201.33 ± 8.99 | 273.33 ± 62.74 | 37.33 | |
| 160 | 90 | 219.33 ± 23.13 | 230.33 ± 20.95 | 6.55 | |
| 160 | 120 | 207.33 ± 16.11 | 190.67 ± 6.34 | −7.65 | |
| 170 | 30 | 183.33 ± 16.76 | 222.33 ± 25.38 | 21.06 | |
| 170 | 60 | 172.33 ± 40.53 | 204.67 ± 10.50 | 26.73 | |
| 170 | 90 | 208.33 ± 9.18 | 178.33 ± 15.33 | −14.48 | |
| 170 | 120 | 198.00 ± 9.90 | 155.33 ± 25.82 | −21.59 | |
| 180 | 30 | 229.67 ± 5.56 | 188.00 ± 14.45 | −18.00 | |
| 180 | 60 | 198.33 ± 35.42 | 188.33 ± 14.61 | −0.29 | |
| 180 | 90 | 227.33 ± 16.50 | 193.33 ± 16.82 | −14.25 | |
| 180 | 120 | 206.67 ± 5.79 | 176.33 ± 3.40 | −14.64 | |
| 190 | 30 | 201.33 ± 8.34 | 175.33 ± 10.78 | −12.84 | |
| 190 | 60 | 217.00 ± 17.80 | 186.00 ± 6.48 | −13.73 | |
| 190 | 90 | 233.67 ± 6.60 | 179.67 ± 8.99 | −23.02 | |
| 190 | 120 | 214.00 ± 9.42 | 171.00 ± 4.55 | −20.00 | |
| 200 | 30 | 228.67 ± 1.70 | 171.33 ± 3.30 | −25.06 | |
| 200 | 60 | 220.00 ± 16.87 | 179.67 ± 19.75 | −17.18 | |
| 200 | 90 | 235.67 ± 8.96 | 155.67 ± 4.92 | −33.86 | |
| 200 | 120 | 228.00 ± 3.74 | 166.33 ± 1.25 | −27.019 | |
| Novel-Ag | 180 | 30 | 146.33 ± 1.25 | 1535.00 ± 1495.04 | 228.68 |
| 180 | 60 | 149.67 ± 3.86 | 264.00 ± 70.27 | 75.37 | |
| 180 | 90 | 148.67 ± 8.18 | 308.67 ± 44.68 | 109.72 | |
| 180 | 120 | 163.33 ± 6.24 | 234.33 ± 12.66 | 43.67 | |
| 190 | 30 | 151.25 ± 12.03 | 240.75 ± 41.48 | 49.31 | |
| 190 | 60 | 150.00 ± 2.16 | 224.00 ± 33.24 | 49.57 | |
| 190 | 90 | 151.33 ± 10.50 | 211.33 ± 28.55 | 39.12 | |
| 190 | 120 | 163.00 ± 13.14 | 198.67 ± 19.69 | 23.19 | |
| 200 | 30 | 149.67 ± 7.85 | 175.67 ± 9.98 | 17.62 | |
| 200 | 60 | 156.67 ± 0.47 | 158.00 ± 14.24 | 0.84 | |
| 200 | 90 | 144.33 ± 3.30 | 158.33 ± 7.85 | 9.88 | |
| 200 | 120 | 152.33 ± 1.70 | 167.33 ± 18.12 | 9.79 | |
| 210 | 30 | 158.33 ± 2.87 | 160.00 ± 7.12 | 1.01 | |
| 210 | 60 | 144.33 ± 4.19 | 146.67 ± 12.97 | 1.45 | |
| 210 | 90 | 152.33 ± 7.13 | 143.33 ± 14.08 | −6.13 | |
| 210 | 120 | 157.67 ± 5.79 | 146.67 ± 3.68 | −7.55 |
References
- Wearable Technology Market Size, Trends, Growth, Report 2030. Available online: https://www.precedenceresearch.com/wearable-technology-market (accessed on 6 January 2023).
- Gong, X.; Huang, K.; Wu, Y.H.; Zhang, X.S. Recent Progress on Screen-Printed Flexible Sensors for Human Health Monitoring. Sens. Actuators A Phys. 2022, 345, 113821. [Google Scholar] [CrossRef]
- Wen, D.L.; Pang, Y.X.; Huang, P.; Wang, Y.L.; Zhang, X.R.; Deng, H.T.; Zhang, X.S. Silk Fibroin-Based Wearable All-Fiber Multifunctional Sensor for Smart Clothing. Adv. Fiber Mater. 2022, 4, 873–884. [Google Scholar] [CrossRef]
- Yokus, M.A.; Jur, J.S. Fabric-Based Wearable Dry Electrodes for Body Surface Biopotential Recording. IEEE Trans. Biomed. Eng. 2016, 63, 423–430. [Google Scholar] [CrossRef] [PubMed]
- Jose, M.; Lemmens, M.; Bormans, S.; Thoelen, R.; Deferme, W. Fully Printed, Stretchable and Wearable Bioimpedance Sensor on Textiles for Tomography. Flex. Print. Electron. 2021, 6, 015010. [Google Scholar] [CrossRef]
- Yin, L.; Lv, J.; Wang, J. Structural Innovations in Printed, Flexible, and Stretchable Electronics. Adv. Mater. Technol. 2020, 5, 2000694. [Google Scholar] [CrossRef]
- Lin, S.Y.; Zhang, T.Y.; Lu, Q.; Wang, D.Y.; Yang, Y.; Wu, X.M.; Ren, T.L. High-Performance Graphene-Based Flexible Heater for Wearable Applications. RSC Adv. 2017, 7, 27001–27006. [Google Scholar] [CrossRef] [Green Version]
- Maheshwari, N.; Abd-Ellah, M.; Goldthorpe, I.A. Transfer Printing of Silver Nanowire Conductive Ink for E-Textile Applications. Flex. Print. Electron. 2019, 4, 025005. [Google Scholar] [CrossRef]
- de Vos, M.; Torah, R.; Beeby, S.; Tudor, J. Functional Electronic Screen-Printing—Electroluminescent Lamps on Fabric. Procedia Eng. 2014, 87, 1513–1516. [Google Scholar] [CrossRef] [Green Version]
- Soe, H.M.; Abd Manaf, A.; Matsuda, A.; Jaafar, M. Performance of a Silver Nanoparticles-Based Polydimethylsiloxane Composite Strain Sensor Produced Using Different Fabrication Methods. Sens. Actuators A Phys. 2021, 329, 112793. [Google Scholar] [CrossRef]
- Cinti, S.; Arduini, F. Graphene-Based Screen-Printed Electrochemical (Bio)Sensors and Their Applications: Efforts and Criticisms. Biosens. Bioelectron. 2017, 89, 107–122. [Google Scholar] [CrossRef] [PubMed]
- Ferri, J.; Llinares Llopis, R.; Moreno, J.; Vicente Lidón-Roger, J.; Garcia-Breijo, E. An Investigation into the Fabrication Parameters of Screen-Printed Capacitive Sensors on e-Textiles. Text. Res. J. 2020, 90, 1749–1769. [Google Scholar] [CrossRef]
- Zeng, P.; Tian, B.; Tian, Q.; Yao, W.; Li, M.; Wang, H.; Feng, Y.; Liu, L.; Wu, W. Screen-Printed, Low-Cost, and Patterned Flexible Heater Based on Ag Fractal Dendrites for Human Wearable Application. Adv. Mater. Technol. 2019, 4, 1800453. [Google Scholar] [CrossRef]
- Ibanez Labiano, I.; Arslan, D.; Ozden Yenigun, E.; Asadi, A.; Cebeci, H.; Alomainy, A. Screen Printing Carbon Nanotubes Textiles Antennas for Smart Wearables. Sensors 2021, 21, 4934. [Google Scholar] [CrossRef] [PubMed]
- Qu, J.; He, N.; Patil, S.V.; Wang, Y.; Banerjee, D.; Gao, W. Screen Printing of Graphene Oxide Patterns onto Viscose Nonwovens with Tunable Penetration Depth and Electrical Conductivity. ACS Appl. Mater. Interfaces 2019, 11, 14944–14951. [Google Scholar] [CrossRef] [PubMed]
- Janczak, D.; Zych, M.; Raczyński, T.; Dybowska-Sarapuk, Ł.; Pepłowski, A.; Krzemiński, J.; Sosna-Glłȩbska, A.; Znajdek, K.; Sibiński, M.; Jakubowska, M. Stretchable and Washable Electroluminescent Display Screen-Printed on Textile. Nanomaterials 2019, 9, 1276. [Google Scholar] [CrossRef] [PubMed] [Green Version]
- Xu, X.; Luo, M.; He, P.; Yang, J. Washable and Flexible Screen Printed Graphene Electrode on Textiles for Wearable Healthcare Monitoring. J. Phys. D Appl. Phys. 2020, 53, 125402. [Google Scholar] [CrossRef]
- Salam, B.; Cen, Z.; Shan, X.C.; Lok, B.K. Printing Process of Electrically Conductive Silver on Heat Transfer Polymer Substrates for Wearable Electronics Applications. In Proceedings of the 2019 IEEE 21st Electronics Packaging Technology Conference (EPTC), Singapore, 4–6 December 2019; pp. 645–648. [Google Scholar] [CrossRef]
- Ding, C.; Wang, J.; Yuan, W.; Zhou, X.; Lin, Y.; Zhu, G.; Li, J.; Zhong, T.; Su, W.; Cui, Z. Durability Study of Thermal Transfer Printed Textile Electrodes for Wearable Electronic Applications. ACS Appl. Mater. Interfaces 2022, 14, 29144–29155. [Google Scholar] [CrossRef] [PubMed]
- Raczyński, T.; Janczak, D.; Szałapak, J.; Walter, P.; Jakubowska, M. Investigation of Carbon-Based Composites for Elastic Heaters and Effects of Hot Pressing in Thermal Transfer Process on Thermal and Electrical Properties. Materials 2021, 14, 7606. [Google Scholar] [CrossRef] [PubMed]
- Kopyt, P.; Salski, B.; Olszewska-Placha, M.; Janczak, D.; Sloma, M.; Kurkus, T.; Jakubowska, M.; Gwarek, W. Graphene-Based Dipole Antenna for a UHF RFID Tag. IEEE Trans. Antennas Propag. 2016, 64, 2862–2868. [Google Scholar] [CrossRef]


| Composite | Temperature [°C] | Time [s] | Thickness [µm] |
|---|---|---|---|
| EDAG 725A | 150 | 60 | 6.07 |
| 170 | 30 | 7.09 | |
| 180 | 60 | 7.42 | |
| TPU-Ag | 160 | 30 | 3.84 |
| 180 | 30 | 6.83 | |
| 200 | 30 | 8.88 | |
| Novel-Ag | 180 | 60 | 11.3 |
| 200 | 60 | 11.08 | |
| 210 | 90 | 11.88 |
| Composite | Temperature [°C] | Time [s] | Average Resistance before Bend Test [mΩ] | Average Resistance after Bend Test [mΩ] | Change in Resistance [%] |
|---|---|---|---|---|---|
| EDAG 725A | 150 | 60 | 167.17 ± 14.60 | 388.00 ± 66.70 | 130.97 ± 26.98 |
| 170 | 30 | 153.17 ± 7.95 | 574.83 ± 77.60 | 276.89 ± 57.34 | |
| 180 | 60 | 121.33 ± 5.99 | 506.83 ± 91.77 | 318.11 ± 77.98 | |
| TPU-Ag | 160 | 30 | 148.50 ± 16.89 | 153.50 ± 15.50 | 3.59 ± 3.92 |
| 180 | 30 | 104.00 ± 5.94 | 105.33 ± 5.47 | 1.34 ± 2,45 | |
| 200 | 30 | 94.67 ± 4.46 | 96.17 ± 6.64 | 1.59 ± 5.13 | |
| Novel-Ag | 180 | 60 | 84.34 ± 7.50 | 89.00 ± 10.78 | 5.96 ± 13.01 |
| 200 | 60 | 70.84 ± 3.44 | 71.00 ± 5.23 | 0.14 ± 3.34 | |
| 210 | 90 | 70.62 ± 6.20 | 70.83 ± 5.70 | 0.36 ± 3.23 |
| Composite | Temperature [°C] | Time [s] | Average Number of Cycles |
|---|---|---|---|
| EDAG 725A | 150 | 60 | 166.67 ± 23.57 |
| 170 | 30 | 716.67 ± 84.98 | |
| 180 | 60 | 2466.67 ± 124.72 | |
| TPU-Ag | 160 | 30 | 216.67 ± 6236 |
| 180 | 30 | 1250.00 ± 70.71 | |
| 200 | 30 | 2066.67 ± 94.28 | |
| Novel-Ag | 180 | 60 | 250.00 ± 40.82 |
| 200 | 60 | 566.67 ± 62.36 | |
| 210 | 90 | 2100.00 ± 81.65 |
Disclaimer/Publisher’s Note: The statements, opinions and data contained in all publications are solely those of the individual author(s) and contributor(s) and not of MDPI and/or the editor(s). MDPI and/or the editor(s) disclaim responsibility for any injury to people or property resulting from any ideas, methods, instructions or products referred to in the content. |
© 2023 by the authors. Licensee MDPI, Basel, Switzerland. This article is an open access article distributed under the terms and conditions of the Creative Commons Attribution (CC BY) license (https://creativecommons.org/licenses/by/4.0/).
Share and Cite
Raczyński, T.; Janczak, D.; Szałapak, J.; Lepak-Kuc, S.; Baraniecki, D.; Muszyńska, M.; Kądziela, A.; Wójkowska, K.; Krzemiński, J.; Jakubowska, M. Influence of the Heat Transfer Process on the Electrical and Mechanical Properties of Flexible Silver Conductors on Textiles. Polymers 2023, 15, 2892. https://doi.org/10.3390/polym15132892
Raczyński T, Janczak D, Szałapak J, Lepak-Kuc S, Baraniecki D, Muszyńska M, Kądziela A, Wójkowska K, Krzemiński J, Jakubowska M. Influence of the Heat Transfer Process on the Electrical and Mechanical Properties of Flexible Silver Conductors on Textiles. Polymers. 2023; 15(13):2892. https://doi.org/10.3390/polym15132892
Chicago/Turabian StyleRaczyński, Tomasz, Daniel Janczak, Jerzy Szałapak, Sandra Lepak-Kuc, Dominik Baraniecki, Maria Muszyńska, Aleksandra Kądziela, Katarzyna Wójkowska, Jakub Krzemiński, and Małgorzata Jakubowska. 2023. "Influence of the Heat Transfer Process on the Electrical and Mechanical Properties of Flexible Silver Conductors on Textiles" Polymers 15, no. 13: 2892. https://doi.org/10.3390/polym15132892
APA StyleRaczyński, T., Janczak, D., Szałapak, J., Lepak-Kuc, S., Baraniecki, D., Muszyńska, M., Kądziela, A., Wójkowska, K., Krzemiński, J., & Jakubowska, M. (2023). Influence of the Heat Transfer Process on the Electrical and Mechanical Properties of Flexible Silver Conductors on Textiles. Polymers, 15(13), 2892. https://doi.org/10.3390/polym15132892