
Upcycling Post-Consumer Paint Pail Plastic Waste

 , and
, and
Abstract

1. Introduction
2. Materials and Methods
2.1. Materials
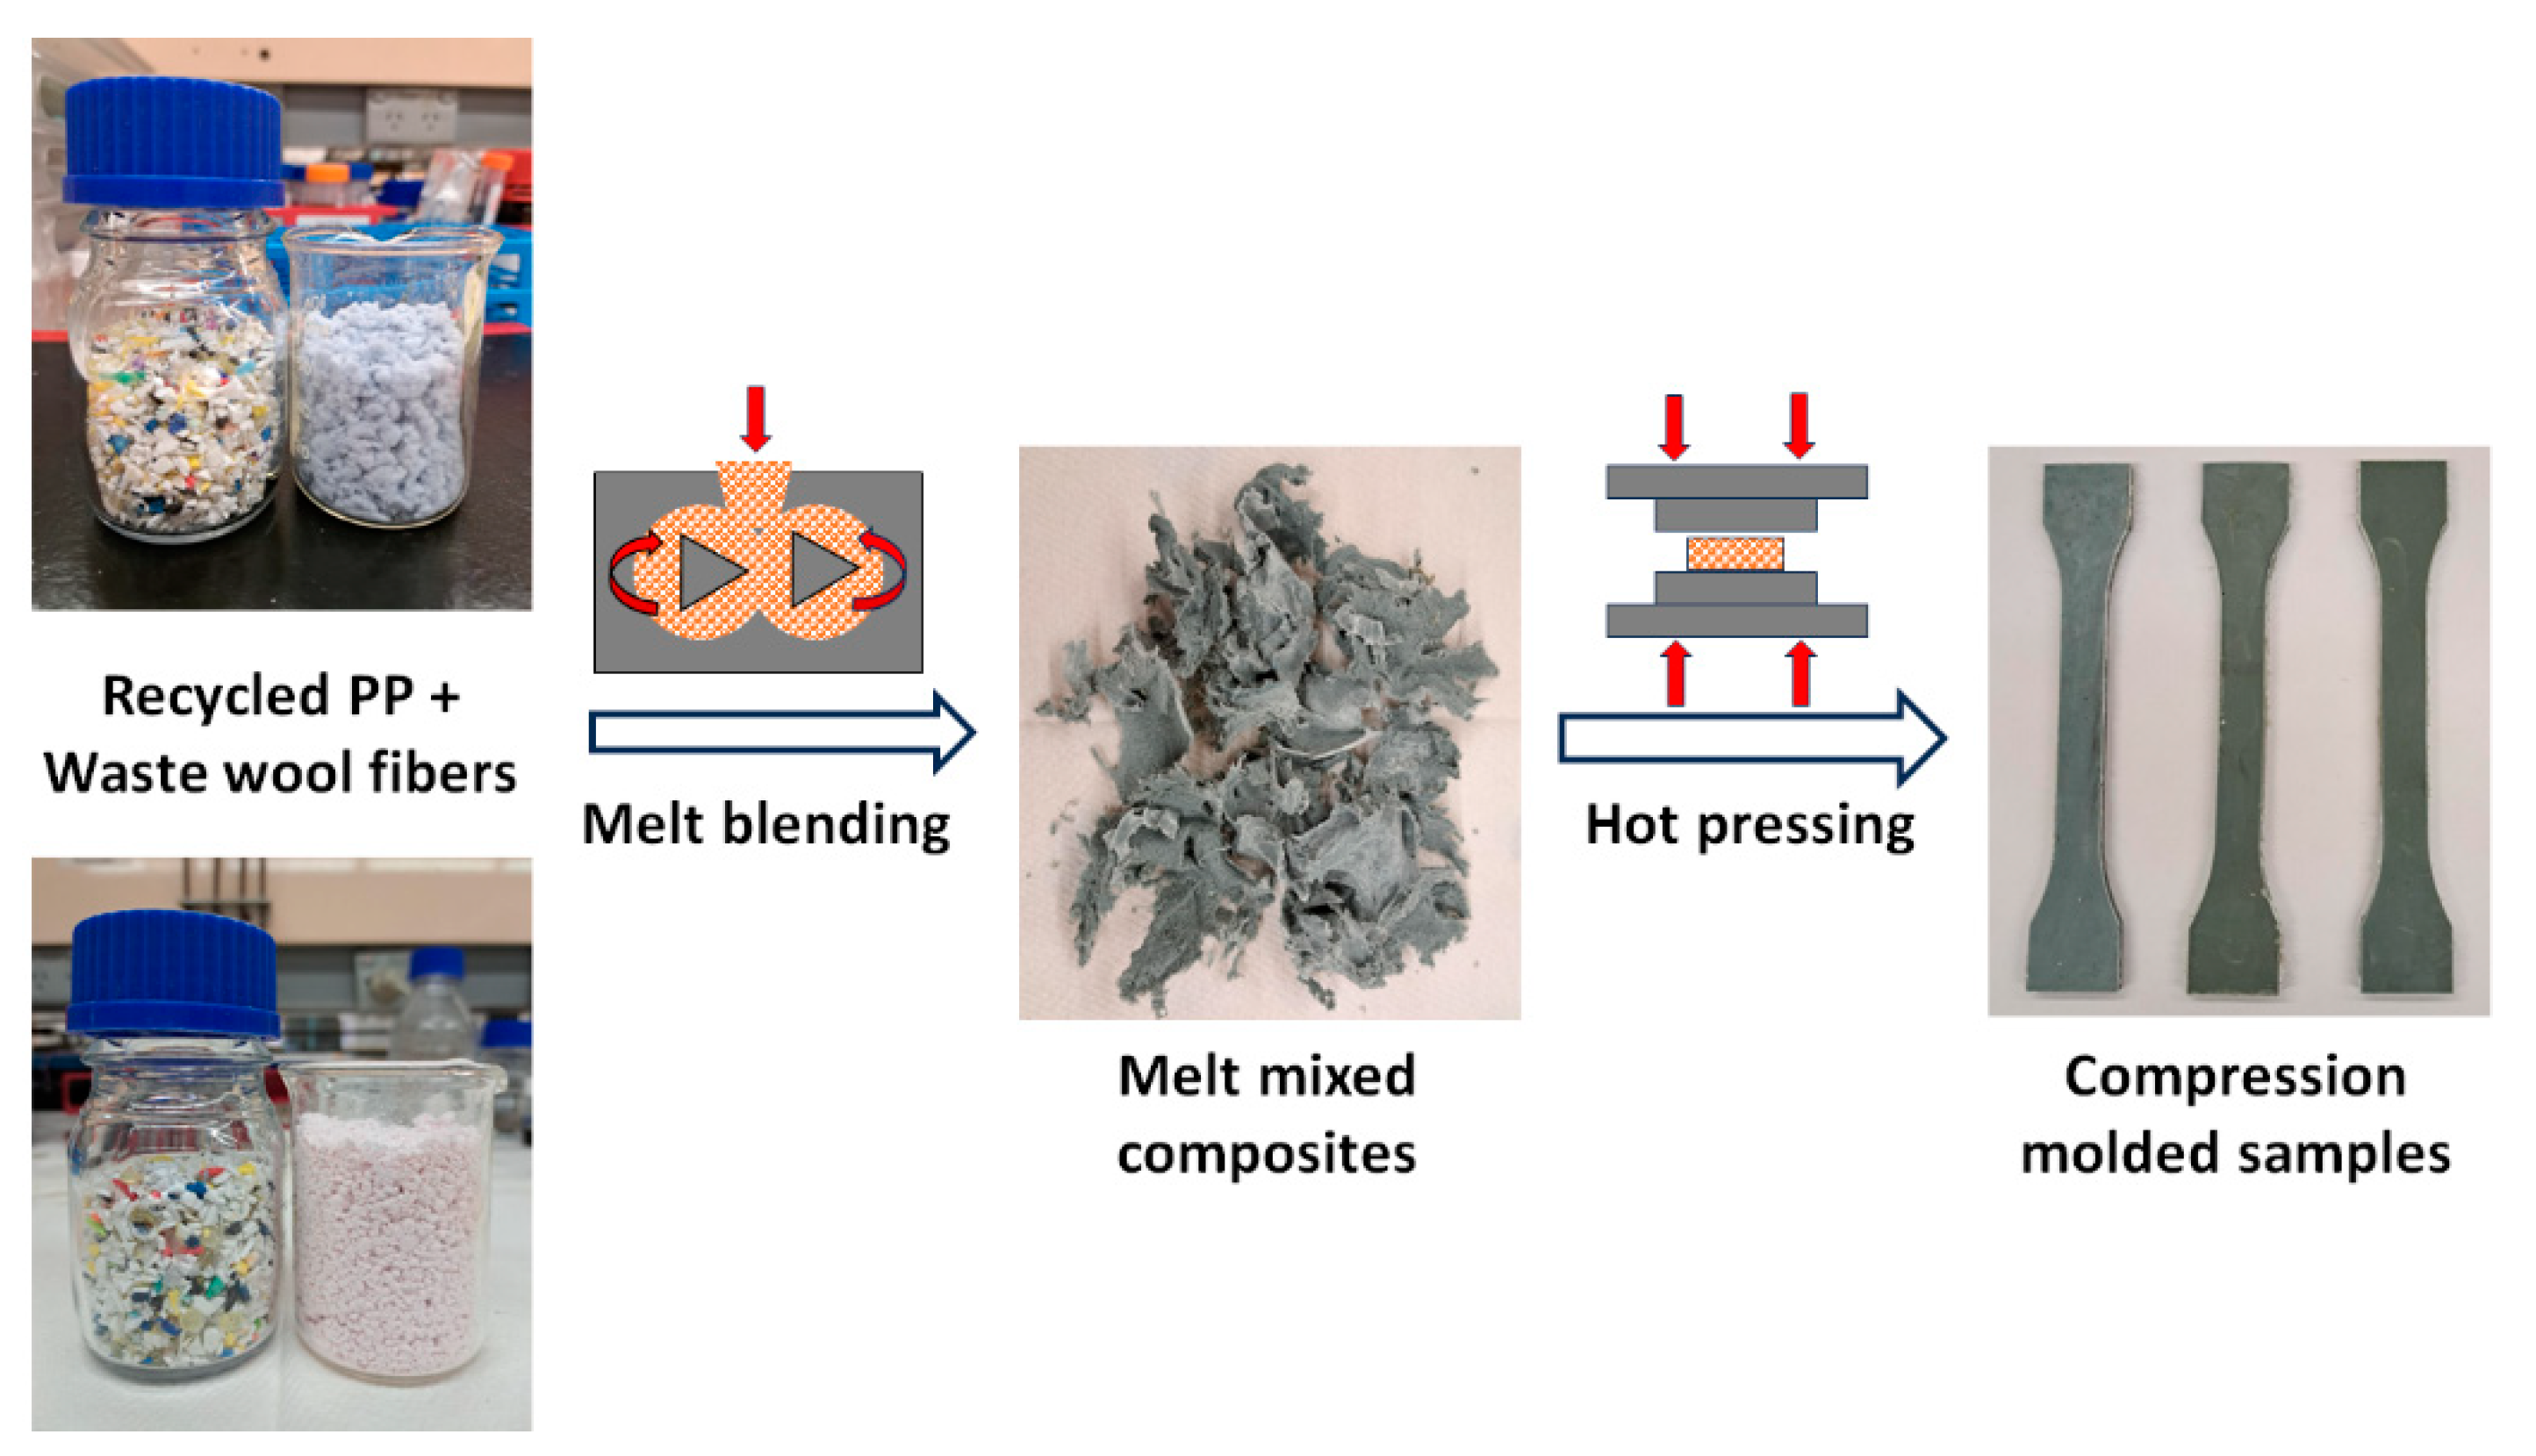
2.2. Fabrication of Composites
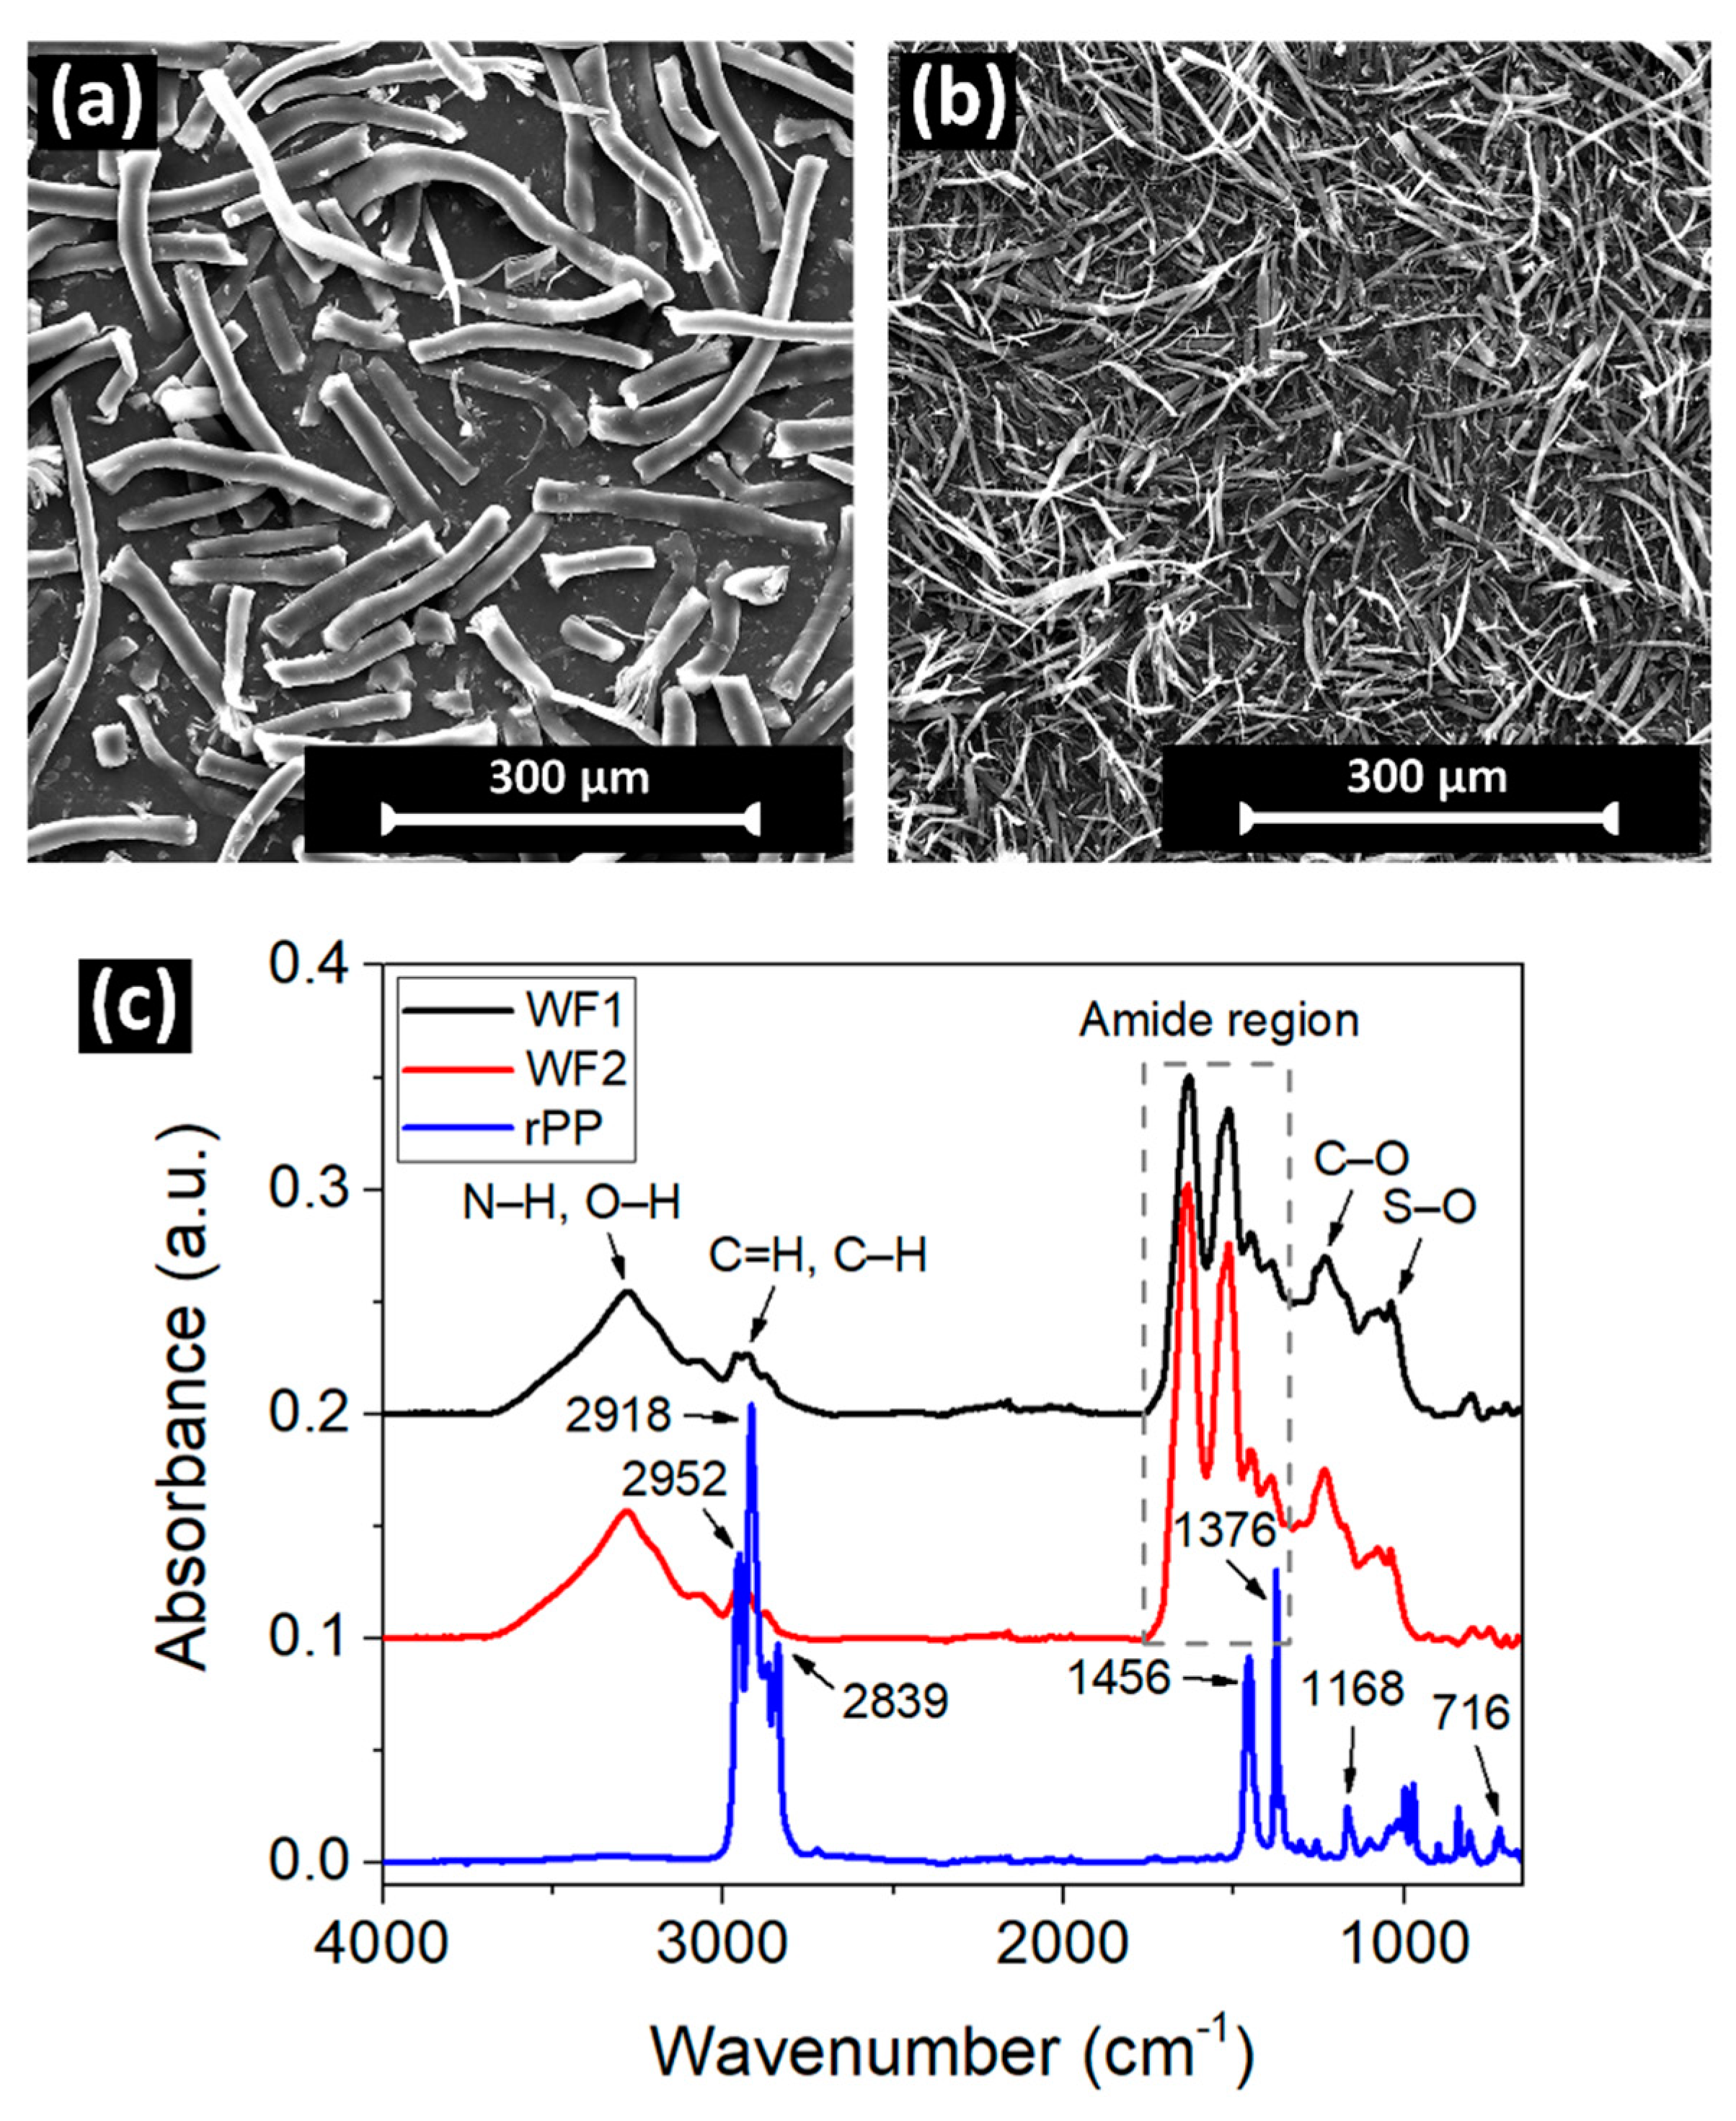
2.3. Characterization
3. Results and Discussion
4. Conclusions
Author Contributions
Funding
Data Availability Statement
Acknowledgments
Conflicts of Interest
References
- OECD. Global Plastics Outlook; OECD: Paris, France, 2022. [Google Scholar]
- Chen, X.; Memon, H.A.; Wang, Y.; Marriam, I.; Tebyetekerwa, M. Circular Economy and Sustainability of the Clothing and Textile Industry. Mater. Circ. Econ. 2021, 3, 12. [Google Scholar] [CrossRef]
- Balu, R.; Dutta, N.K.; Roy Choudhury, N. Plastic Waste Upcycling: A Sustainable Solution for Waste Management, Product Development, and Circular Economy. Polymers 2022, 14, 4788. [Google Scholar] [CrossRef]
- Mishra, P.K.; Izrayeel, A.M.D.; Mahur, B.K.; Ahuja, A.; Rastogi, V.K. A comprehensive review on textile waste valorization techniques and their applications. Environ. Sci. Pollut. Res. 2022, 29, 65962–65977. [Google Scholar] [CrossRef]
- Montie, P. Process for Removal of Paint from Plastic Substrates. U.S. Patent US7258750B1, 18 May 2006. [Google Scholar]
- Sover, A.; Zink, M.; Michalak, M. Paint removal from thermoplastic materials and its influence on the physical-mechanical properties for the recycling of the polymer. IOP Conf. Ser. Mater. Sci. Eng. 2021, 1037, 012032. [Google Scholar] [CrossRef]
- Alvarado Chacon, F.; Brouwer, M.T.; Thoden van Velzen, E.U.; Smeding, I.W. A First Assessment of the Impact of Impurities in PP and PE Recycled Plastics; Wageningen University & Research: Wageningen, The Netherlands, 2020; p. 95. [Google Scholar]
- Rajak, D.K.; Pagar, D.D.; Menezes, P.L.; Linul, E. Fiber-Reinforced Polymer Composites: Manufacturing, Properties, and Applications. Polymers 2019, 11, 1667. [Google Scholar] [CrossRef]
- Khalid, M.Y.; Al Rashid, A.; Arif, Z.U.; Ahmed, W.; Arshad, H.; Zaidi, A.A. Natural fiber reinforced composites: Sustainable materials for emerging applications. Results Eng. 2021, 11, 100263. [Google Scholar] [CrossRef]
- Zhao, X.; Copenhaver, K.; Wang, L.; Korey, M.; Gardner, D.J.; Li, K.; Lamm, M.E.; Kishore, V.; Bhagia, S.; Tajvidi, M.; et al. Recycling of natural fiber composites: Challenges and opportunities. Resour. Conserv. Recycl. 2022, 177, 105962. [Google Scholar] [CrossRef]
- Quynh Truong Hoang, T.; Lagattu, F.; Brillaud, J. Natural Fiber-Reinforced Recycled Polypropylene: Microstructural and Mechanical Properties. J. Reinf. Plast. Compos. 2010, 29, 209–217. [Google Scholar] [CrossRef]
- Srebrenkoska, V.; Gaceva, G.B.; Avella, M.; Ericco, M.E.; Gentile, G. Utilization of Recycled Polypropylene for Production of Eco-Composites. Polym.-Plast. Technol. Eng. 2009, 48, 1113–1120. [Google Scholar] [CrossRef]
- Stoof, D.; Pickering, K. Sustainable composite fused deposition modelling filament using recycled pre-consumer polypropylene. Compos. Part B Eng. 2018, 135, 110–118. [Google Scholar] [CrossRef]
- Zander, N.E.; Park, J.H.; Boelter, Z.R.; Gillan, M.A. Recycled Cellulose Polypropylene Composite Feedstocks for Material Extrusion Additive Manufacturing. ACS Omega 2019, 4, 13879–13888. [Google Scholar] [CrossRef]
- Reichert, A.-A.; Sá, M.-R.-d.; Silva, G.-E.-H.-d.; Beatrice, C.-A.-G.; Fajardo, A.-R.; Oliveira, A.-D.-d. Utilization of Pineapple Crown Fiber and Recycled Polypropylene for Production of Sustainable Composites. J. Renew. Mater. 2020, 8, 1327–1341. [Google Scholar] [CrossRef]
- Gideon, R.; Atalie, D. Mechanical and Water Absorption Properties of Jute/Palm Leaf Fiber-Reinforced Recycled Polypropylene Hybrid Composites. Int. J. Polym. Sci. 2022, 2022, 4408455. [Google Scholar] [CrossRef]
- Shubhra, Q.T.H.; Saha, M.; Alam, A.K.M.M.; Beg, M.D.H.; Khan, M.A. Effect of matrix modification by natural rubber on the performance of silk-reinforced polypropylene composites. J. Reinf. Plast. Compos. 2010, 29, 3338–3344. [Google Scholar] [CrossRef]
- Conzatti, L.; Giunco, F.; Stagnaro, P.; Patrucco, A.; Marano, C.; Rink, M.; Marsano, E. Composites based on polypropylene and short wool fibres. Compos. Part A Appl. Sci. Manuf. 2013, 47, 165–171. [Google Scholar] [CrossRef]
- Rajkumar, G. Chapter 14–Silk and wool hybrid fiber-reinforced polypropylene composites. In Wool Fiber Reinforced Polymer Composites; Thomas, S., Jose, S., Eds.; Woodhead Publishing: Cambridge, UK, 2022; pp. 273–299. [Google Scholar]
- Conzatti, L.; Giunco, F.; Stagnaro, P.; Patrucco, A.; Tonin, C.; Marano, C.; Rink, M.; Marsano, E. Wool fibres functionalised with a silane-based coupling agent for reinforced polypropylene composites. Compos. Part A Appl. Sci. Manuf. 2014, 61, 51–59. [Google Scholar] [CrossRef]
- Govindaraju, R.; Jagannathan, S. Optimization of mechanical properties of silk fiber-reinforced polypropylene composite using Box–Behnken experimental design. J. Ind. Text. 2016, 47, 602–621. [Google Scholar] [CrossRef]
- Candido, R.G. 17—Recycling of textiles and its economic aspects. In Fundamentals of Natural Fibres and Textiles; Mondal, M.I.H., Ed.; Woodhead Publishing: Cambridge, UK, 2021; pp. 599–624. [Google Scholar]
- Wiedemann, S.G.; Biggs, L.; Clarke, S.J.; Russell, S.J. Reducing the Environmental Impacts of Garments through Industrially Scalable Closed-Loop Recycling: Life Cycle Assessment of a Recycled Wool Blend Sweater. Sustainability 2022, 14, 1081. [Google Scholar] [CrossRef]
- Popescu, C.; Wortmann, F.-J. Wool—Structure, Mechanical Properties and Technical Products based on Animal Fibres. In Industrial Applications of Natural Fibres; John Wiley & Sons, Ltd.: Hoboken, NJ, USA, 2010; pp. 255–266. [Google Scholar]
- Le, C.V.; Ly, N.G.; Stevens, M.G. Measuring the Contact Angles of Liquid Droplets on Wool Fibers and Determining Surface Energy Components. Text. Res. J. 1996, 66, 389–397. [Google Scholar] [CrossRef]
- Navik, R.; Shafiq, F.; Khan, A.; Datta, M.; Peng, X.; Kamruzzaman, M.; Cai, Y. Preparation and characterizations of polypyrrole on liquid ammonia pre-treated wool fabric. Fibers Polym. 2017, 18, 1115–1123. [Google Scholar] [CrossRef]
- Cheung, H.-y.; Ho, M.-p.; Lau, K.-t.; Cardona, F.; Hui, D. Natural fibre-reinforced composites for bioengineering and environmental engineering applications. Compos. Part B Eng. 2009, 40, 655–663. [Google Scholar] [CrossRef]
- Vallejos, M.E.; Vilaseca, F.; Méndez, J.A.; Espinach, F.X.; Aguado, R.J.; Delgado-Aguilar, M.; Mutjé, P. Response of Polypropylene Composites Reinforced with Natural Fibers: Impact Strength and Water-Uptake Behaviors. Polymers 2023, 15, 900. [Google Scholar] [CrossRef] [PubMed]
- Alghamdi, S.S.; Balu, R.; Vongsvivut, J.; Truong, V.K.; Mettu, S.; John, S.; Choudhury, N.R.; Dutta, N.K. Exploring the Role of Compatibilizers in Modulating the Interfacial Phenomena and Improving the Properties of Cork–Nylon Composites. ACS Appl. Polym. Mater. 2023, 5, 6990–7008. [Google Scholar] [CrossRef]
- Vongsvivut, J.; Pérez-Guaita, D.; Wood, B.R.; Heraud, P.; Khambatta, K.; Hartnell, D.; Hackett, M.J.; Tobin, M.J. Synchrotron macro ATR-FTIR microspectroscopy for high-resolution chemical mapping of single cells. Analyst 2019, 144, 3226–3238. [Google Scholar] [CrossRef]
- van der Wal, A.; Mulder, J.J.; Gaymans, R.J. Fracture of polypropylene: The effect of crystallinity. Polymer 1998, 39, 5477–5481. [Google Scholar] [CrossRef]
- Bhagat, A.B.; Ghosh, A.K. Performance Properties of PP/Sisal Fibre Composites having Near Critical Fibre Length and Prediction of Their Properties. Fibers Polym. 2022, 23, 1983–1994. [Google Scholar] [CrossRef]
- Gowayed, Y. 1—Types of fiber and fiber arrangement in fiber-reinforced polymer (FRP) composites. In Developments in Fiber-Reinforced Polymer (FRP) Composites for Civil Engineering; Uddin, N., Ed.; Woodhead Publishing: Cambridge, UK, 2013; pp. 3–17. [Google Scholar]
- McGregor, B.A.; Liu, X.; Wang, X.G. Comparisons of the Fourier Transform Infrared Spectra of cashmere, guard hair, wool and other animal fibres. J. Text. Inst. 2018, 109, 813–822. [Google Scholar] [CrossRef]
- Fang, J.; Zhang, L.; Sutton, D.; Wang, X.; Lin, T. Needleless Melt-Electrospinning of Polypropylene Nanofibres. J. Nanomater. 2012, 2012, 382639. [Google Scholar] [CrossRef]
- Larsen, Å.G.; Olafsen, K.; Alcock, B. Determining the PE fraction in recycled PP. Polym. Test. 2021, 96, 107058. [Google Scholar] [CrossRef]
- Charfeddine, I.; Majesté, J.C.; Carrot, C.; Lhost, O. A model for the prediction of the morphology of immiscible blends of polymers. Polymer 2020, 193, 122334. [Google Scholar] [CrossRef]
- Graziano, A.; Jaffer, S.; Sain, M. Review on modification strategies of polyethylene/polypropylene immiscible thermoplastic polymer blends for enhancing their mechanical behavior. J. Elastomers Plast. 2019, 51, 291–336. [Google Scholar] [CrossRef]
- Ng, H.M.; Saidi, N.M.; Omar, F.S.; Ramesh, K.; Ramesh, S.; Bashir, S. Thermogravimetric Analysis of Polymers. In Encyclopedia of Polymer Science and Technology; John Wiley & Sons, Inc.: Hoboken, NJ, USA, 2002; pp. 1–29. [Google Scholar]
- Pawlak, A.; Galeski, A. Crystallization of Polypropylene. In Polypropylene Handbook: Morphology, Blends and Composites; Karger-Kocsis, J., Bárány, T., Eds.; Springer International Publishing: Cham, Switzerland, 2019; pp. 185–242. [Google Scholar]
- Li, D.; Zhou, L.; Wang, X.; He, L.; Yang, X. Effect of Crystallinity of Polyethylene with Different Densities on Breakdown Strength and Conductance Property. Materials 2019, 12, 1746. [Google Scholar] [CrossRef] [PubMed]
- Bashirgonbadi, A.; Ureel, Y.; Delva, L.; Fiorio, R.; Van Geem, K.M.; Ragaert, K. Accurate determination of polyethylene (PE) and polypropylene (PP) content in polyolefin blends using machine learning-assisted differential scanning calorimetry (DSC) analysis. Polym. Test. 2024, 131, 108353. [Google Scholar] [CrossRef]
- Sun, Y.; Matsumoto, M.; Haruki, M.; Kihara, S.-i.; Takishima, S. Molecular weight dependence of the crystallization of the polycarbonate induced by supercritical CO2. J. Supercrit. Fluids 2016, 113, 144–149. [Google Scholar] [CrossRef]
- Coleman, L.; Bork, J.; Dunn, H. Notes. Reaction of Primary Aliphatic Amines with Maleic Anhydride. J. Org. Chem. 1959, 24, 135–136. [Google Scholar] [CrossRef]
- Morris, B.A. Chapter 5—Rheology of polymer melts. In The Science and Technology of Flexible Packaging (Second Edition); Morris, B.A., Ed.; William Andrew Publishing: Oxford, UK, 2022; pp. 139–166. [Google Scholar]
- Berzin, F.; Vergnes, B. Time/Molecular Weight Superposition to Describe the Behavior of Controlled-Rheology Polypropylenes. Polymers 2022, 14, 3398. [Google Scholar] [CrossRef]
- Durmus, A.; Ozcan, M.; Aydin, I. Quantifying effects of compositional variations on microstructural properties of polypropylene-wood fiber composites by melt rheology and tensile test data. J. Compos. Mater. 2019, 53, 503–514. [Google Scholar] [CrossRef]
- Marschik, C.; Roland, W.; Osswald, T.A. Melt Conveying in Single-Screw Extruders: Modeling and Simulation. Polymers 2022, 14, 875. [Google Scholar] [CrossRef]
- Colón Quintana, J.L.; Hiemer, S.; Granda Duarte, N.; Osswald, T. Implementation of shear thinning behavior in the fused filament fabrication melting model: Analytical solution and experimental validation. Addit. Manuf. 2021, 37, 101687. [Google Scholar] [CrossRef]
- Li, C.; Zhang, J.; Han, J.; Yao, B. A numerical solution to the effects of surface roughness on water–coal contact angle. Sci. Rep. 2021, 11, 459. [Google Scholar] [CrossRef]
- Szewczyk, P.K.; Ura, D.P.; Metwally, S.; Knapczyk-Korczak, J.; Gajek, M.; Marzec, M.M.; Bernasik, A.; Stachewicz, U. Roughness and Fiber Fraction Dominated Wetting of Electrospun Fiber-Based Porous Meshes. Polymers 2019, 11, 34. [Google Scholar] [CrossRef] [PubMed]
- Hyie, K.M.; Budin, S.; Martinus, N.; Salleh, Z.; Mohd Masdek, N.R.N. Tensile and flexural investigation on polypropylene recycling. J. Phys. Conf. Ser. 2019, 1174, 012005. [Google Scholar] [CrossRef]
- Handayani, S.U.; Fahrudin, M.; Mangestiyono, W.; Hadi Muhamad, A.F. Mechanical Properties of Commercial Recycled Polypropylene from Plastic Waste. J. Vocat. Stud. Appl. Res. 2021, 3, 1–4. [Google Scholar] [CrossRef]
- Kim, N.K.; Lin, R.J.T.; Bhattacharyya, D. Extruded short wool fibre composites: Mechanical and fire retardant properties. Compos. Part B Eng. 2014, 67, 472–480. [Google Scholar] [CrossRef]
- Kim, N.K.; Lin, R.J.T.; Bhattacharyya, D. Effects of wool fibres, ammonium polyphosphate and polymer viscosity on the flammability and mechanical performance of PP/wool composites. Polym. Degrad. Stab. 2015, 119, 167–177. [Google Scholar] [CrossRef]
- Kim, N.K.; Bhattacharyya, D. Development of fire resistant wool polymer composites: Mechanical performance and fire simulation with design perspectives. Mater. Des. 2016, 106, 391–403. [Google Scholar] [CrossRef]
- Fitri, M.; Mahzan, S.; Anggara, F. The mechanical properties requirement for polymer composite automotive parts—A review. Int. J. Adv. Technol. Mech. Mechatron. Mater. 2021, 1, 125–133. [Google Scholar] [CrossRef]
- Evren Meltem, T.; Ahmet, G. Failure Modes in Fiber Reinforced Composites and Fracture Toughness Testing of FRP. In Advances in Fatigue and Fracture Testing and Modelling; Zak, A., Nada, A., Eds.; IntechOpen: Rijeka, Croatia, 2022; pp. 17–33. [Google Scholar]
- Vongsvivut, J.; Truong, V.K.; Al Kobaisi, M.; Maclaughlin, S.; Tobin, M.J.; Crawford, R.J.; Ivanova, E.P. Synchrotron macro ATR-FTIR microspectroscopic analysis of silica nanoparticle-embedded polyester coated steel surfaces subjected to prolonged UV and humidity exposure. PLoS ONE 2017, 12, e0188345. [Google Scholar] [CrossRef]


| Samples | Composition (wt.%) | |||
|---|---|---|---|---|
| rPP | WF1 | WF2 | PP-g-MA | |
| rPP | 100 | - | - | - |
| rPP-C | 95 | - | - | 5 |
| rPP-C-10WF1 | 85 | 10 | - | 5 |
| rPP-C-20WF1 | 75 | 20 | - | 5 |
| rPP-C-10WF2 | 85 | - | 10 | 5 |
| rPP-C-20WF2 | 75 | - | 20 | 5 |
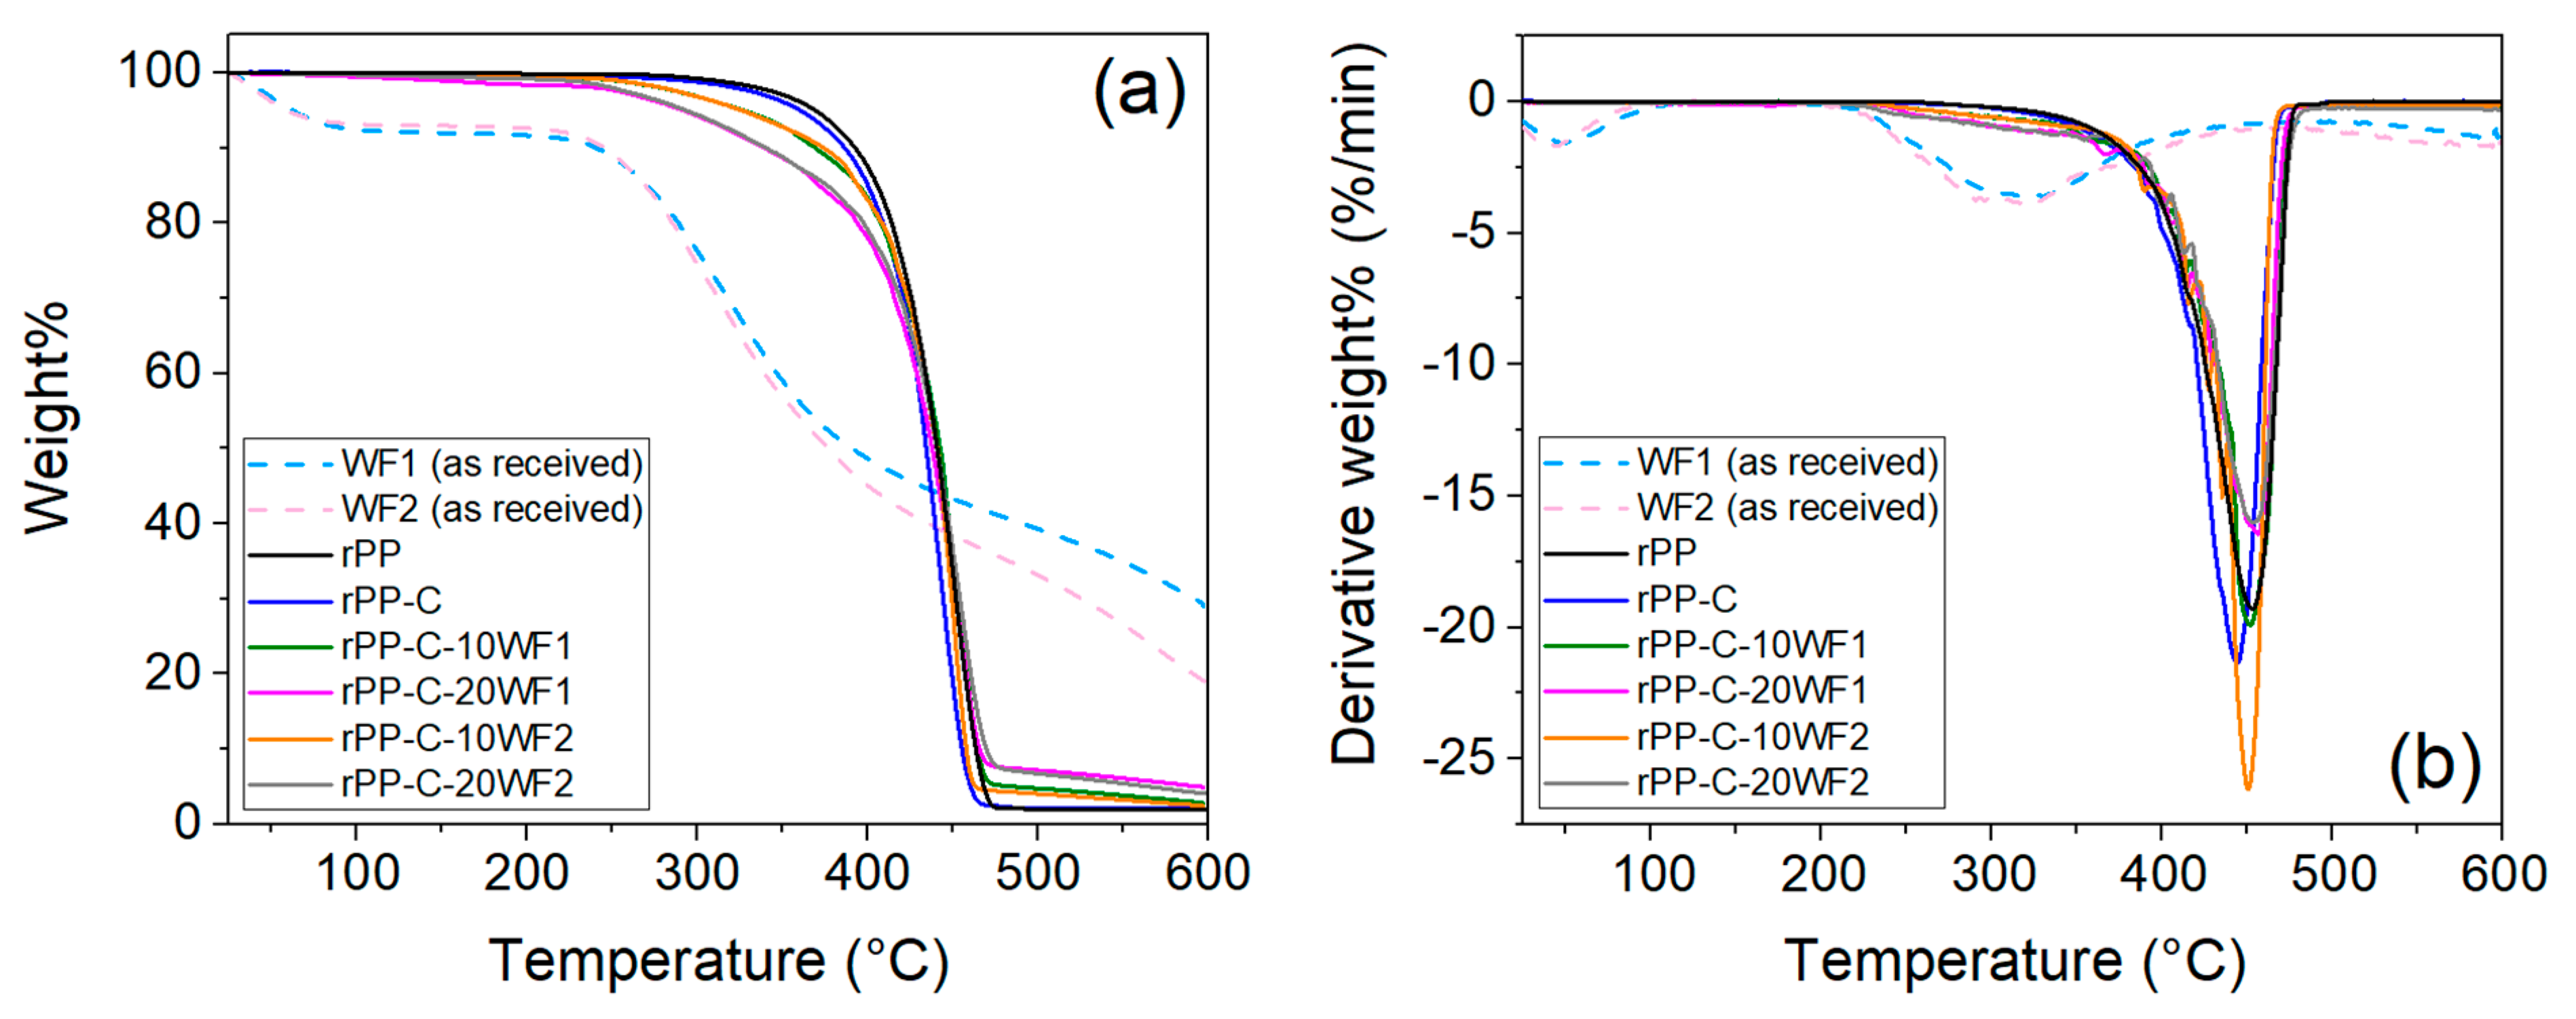
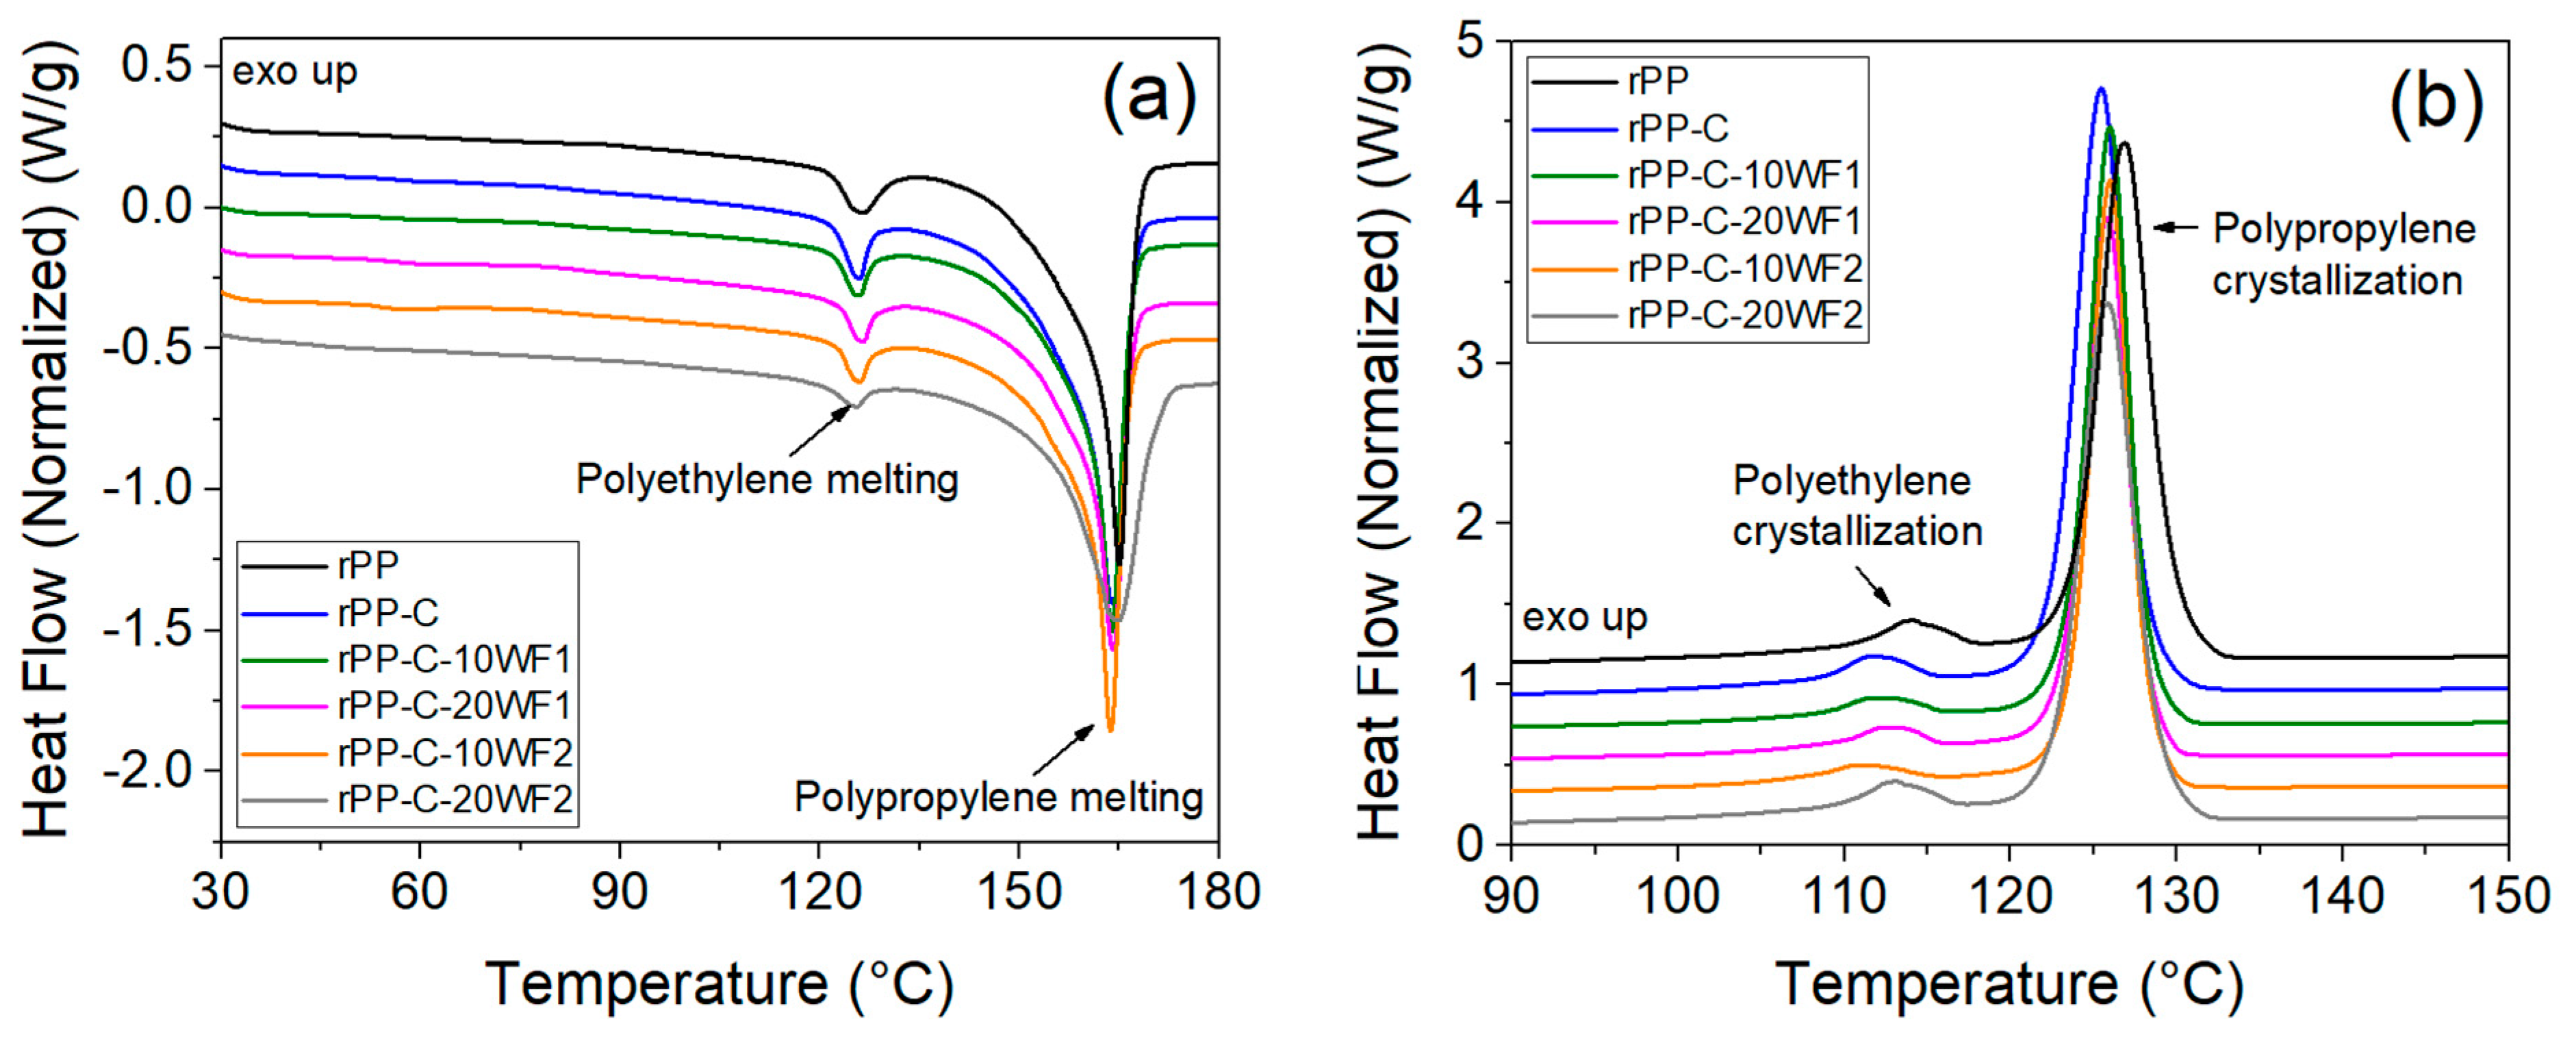
| Samples | TGA Data | DSC Data | ||||||
|---|---|---|---|---|---|---|---|---|
| Onset of Degradation (°C) | First Derivative Peak Temperature (°C) | Char at 600 °C (wt.%) | Heating | Cooling | ||||
| Melting Temperature of PP (°C) | Enthalpy of PP Melting (J/g) | Crystallinity of PP (%) | Crystallization Temperature of PP (°C) | Enthalpy of PP Crystallization (J/g) | ||||
| rPP | 364.21 | 452.58 | 1.99 | 165.02 | 66.75 | 32.25 | 126.88 | 68.31 |
| rPP-C | 359.56 | 444.26 | 2.03 | 164.03 | 70.87 | 34.41 | 125.47 | 76.24 |
| rPP-C-10WF1 | 257.59 | 451.85 | 2.76 | 163.98 | 67.34 | 36.35 | 125.98 | 72.96 |
| rPP-C-20WF1 | 223.25 | 453.51 | 4.82 | 163.85 | 61.42 | 37.32 | 125.84 | 68.47 |
| rPP-C-10WF2 | 257.58 | 451.01 | 2.44 | 163.74 | 63.79 | 34.43 | 125.97 | 71.53 |
| rPP-C-20WF2 | 223.23 | 454.36 | 4.09 | 164.31 | 62.79 | 38.16 | 125.86 | 62.01 |
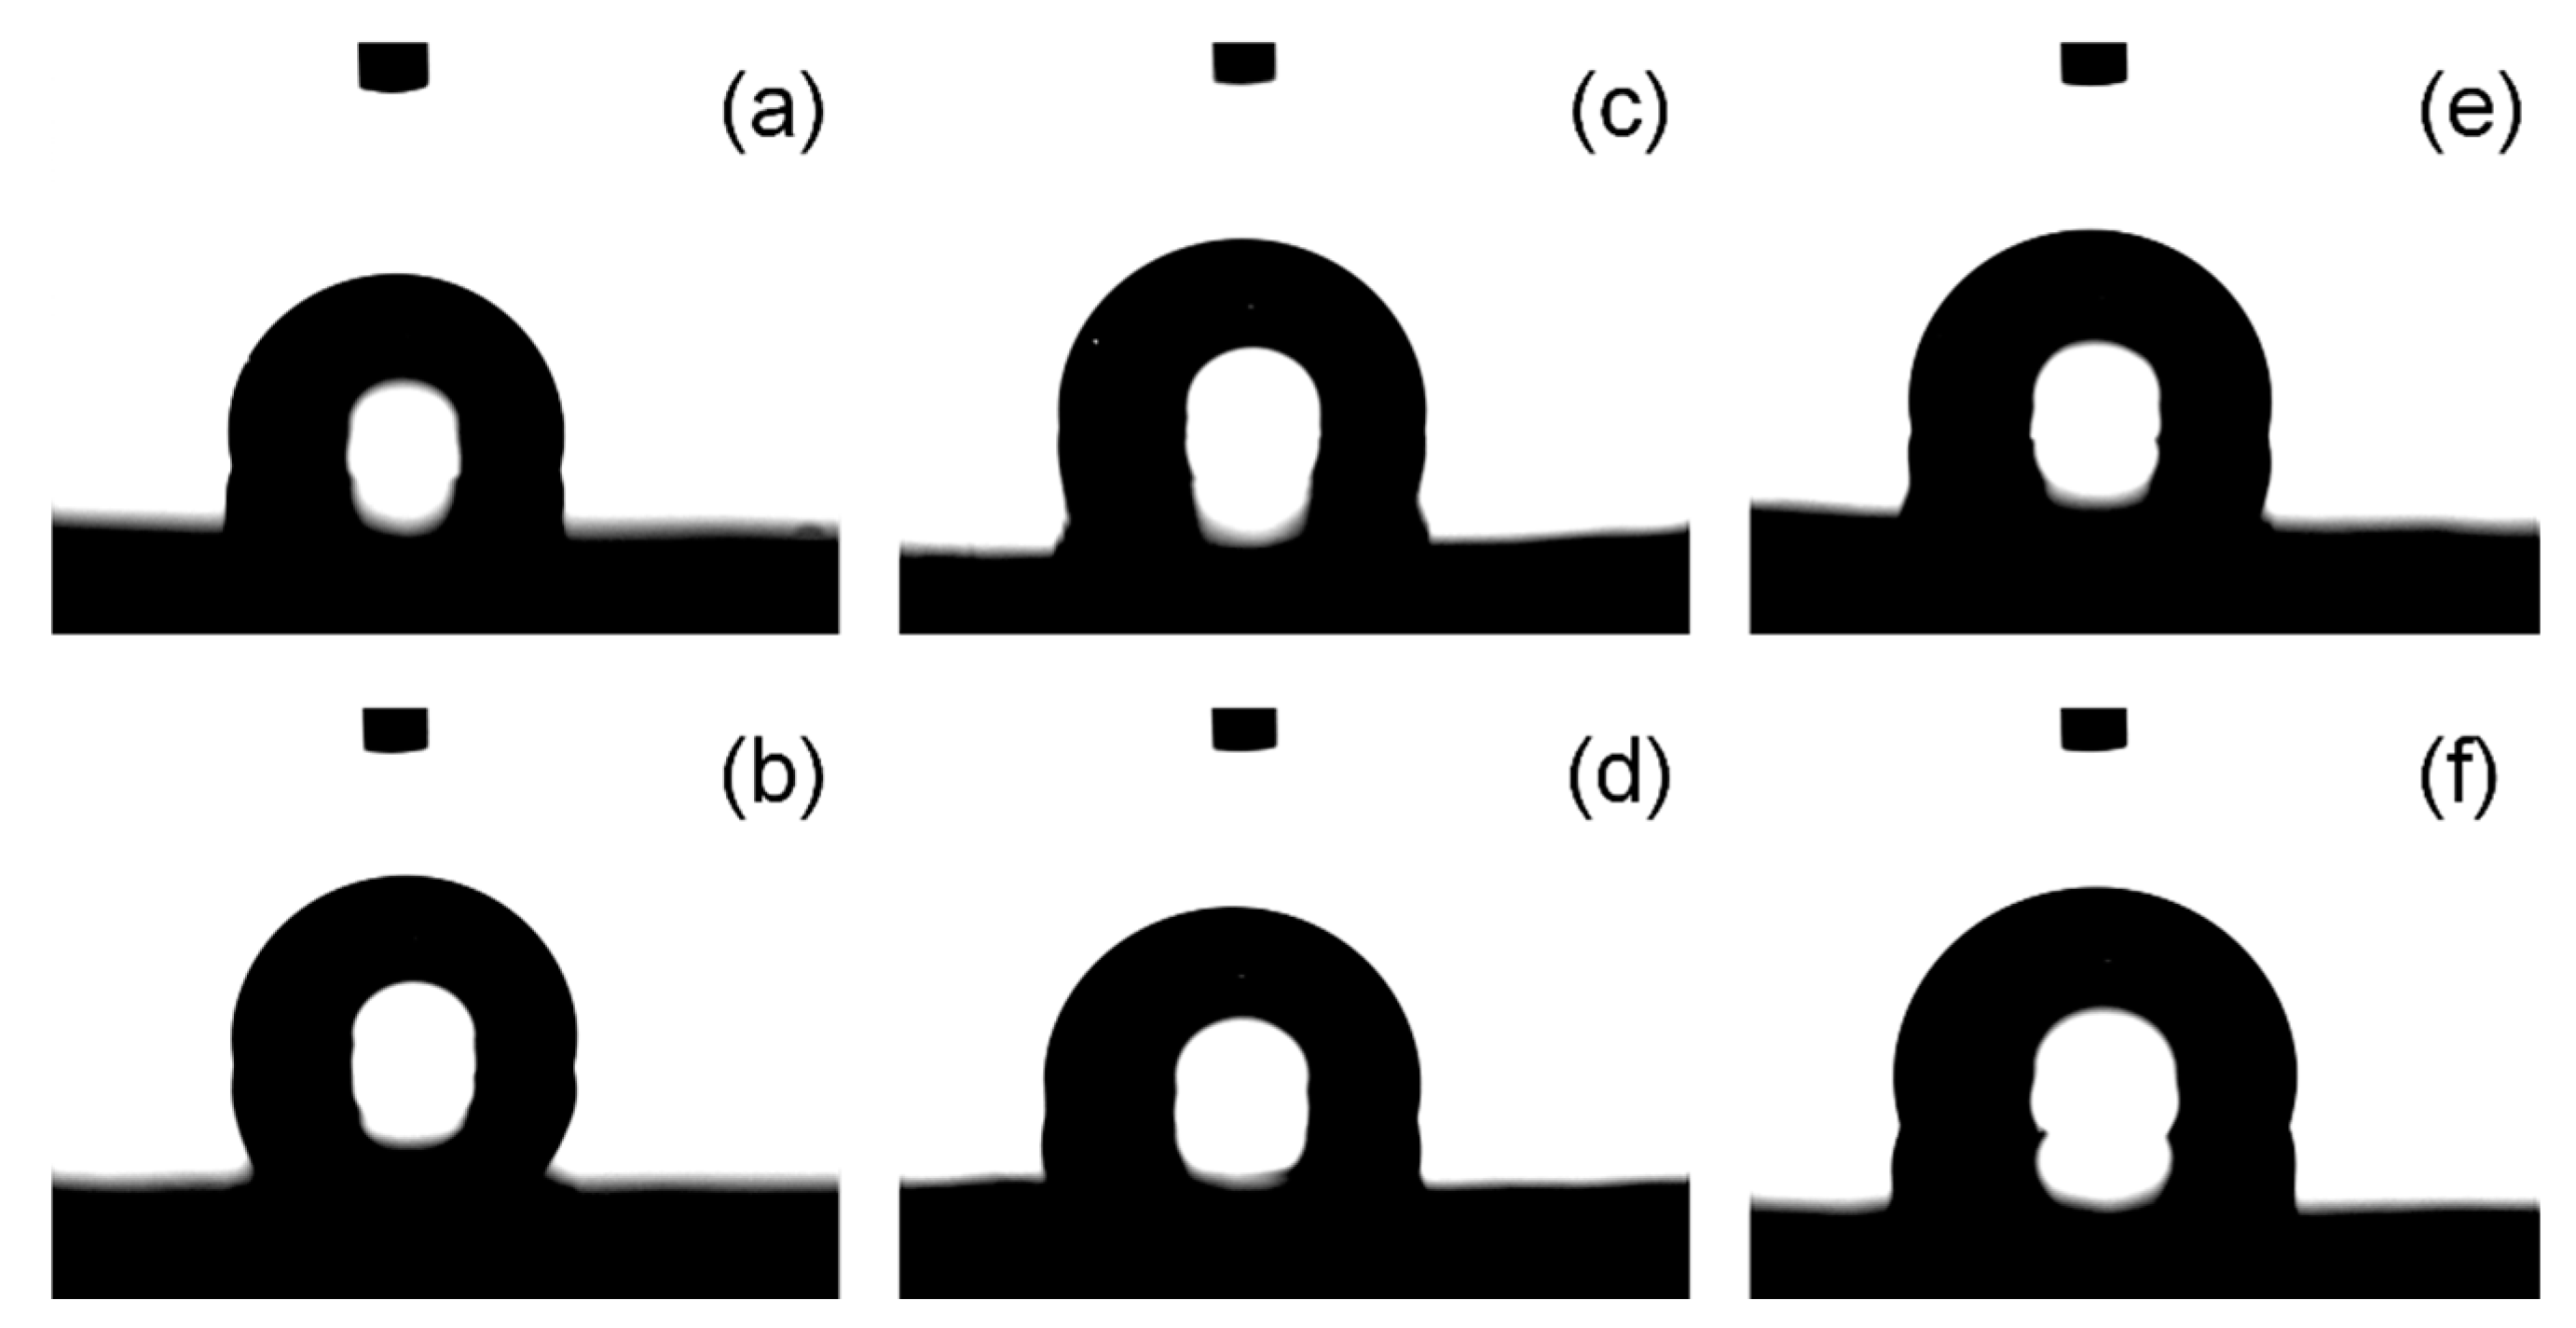
| Samples | Water Contact Angle (°) | RMS (nm) |
|---|---|---|
| rPP | 103.5 ± 0.4 | 46.8 ± 3.7 |
| rPP-C | 100.1 ± 0.5 | 35.5 ± 4.5 |
| rPP-C-10WF1 | 90.4 ± 2.1 | 31.1 ± 6.6 |
| rPP-C-20WF1 | 101.2 ± 0.3 | 73.6 ± 7.5 |
| rPP-C-10WF2 | 95.1 ± 0.6 | 49.8 ± 3.5 |
| rPP-C-20WF2 | 107.4 ± 0.2 | 74.8 ± 7.9 |
| Samples | Tensile Properties | Flexural Properties | ||||
|---|---|---|---|---|---|---|
| Young’s Modulus (GPa) | Tensile Strength (MPa) | Break Strain (%) | Young’s Modulus (GPa) | Flexural Strength (MPa) | Strain (%) at Maximum Strength | |
| rPP | 1.4 ± 0.02 | 15.31 ± 0.18 | 5.41 ± 0.11 | 1.22 ± 0.02 | 26.20 ± 0.04 | 4.70 ± 0.10 |
| rPP-C | 1.5 ± 0.06 | 16.26 ± 0.24 | 3.58 ± 0.10 | 1.88 ± 0.01 | 34.11 ± 0.18 | 6.58 ± 0.30 |
| rPP-C-10WF1 | 1.6 ± 0.04 | 16.75 ± 0.81 | 2.87 ± 0.17 | 2.08 ± 0.06 | 32.28 ± 0.72 | 4.34 ± 0.20 |
| rPP-C-20WF1 | 1.6 ± 0.03 | 16.34 ± 0.72 | 2.00 ± 0.13 | 2.05 ± 0.14 | 28.41 ± 0.93 | 3.06 ± 0.21 |
| rPP-C-10WF2 | 1.6 ± 0.05 | 18.02 ± 1.06 | 2.98 ± 0.14 | 2.03 ± 0.05 | 36.54 ± 1.11 | 5.31 ± 0.25 |
| rPP-C-20WF2 | 1.6 ± 0.06 | 17.59 ± 1.03 | 2.14 ± 0.16 | 2.05 ± 0.09 | 33.35 ± 1.43 | 4.58 ± 0.12 |
Disclaimer/Publisher’s Note: The statements, opinions and data contained in all publications are solely those of the individual author(s) and contributor(s) and not of MDPI and/or the editor(s). MDPI and/or the editor(s) disclaim responsibility for any injury to people or property resulting from any ideas, methods, instructions or products referred to in the content. |
© 2024 by the authors. Licensee MDPI, Basel, Switzerland. This article is an open access article distributed under the terms and conditions of the Creative Commons Attribution (CC BY) license (https://creativecommons.org/licenses/by/4.0/).
Share and Cite
Balu, R.; Sharma, S.; Roberts, R.; Vongsvivut, J.; Choudhury, N.R. Upcycling Post-Consumer Paint Pail Plastic Waste. Polymers 2024, 16, 2631. https://doi.org/10.3390/polym16182631
Balu R, Sharma S, Roberts R, Vongsvivut J, Choudhury NR. Upcycling Post-Consumer Paint Pail Plastic Waste. Polymers. 2024; 16(18):2631. https://doi.org/10.3390/polym16182631
Chicago/Turabian StyleBalu, Rajkamal, Swati Sharma, Rachael Roberts, Jitraporn Vongsvivut, and Namita Roy Choudhury. 2024. "Upcycling Post-Consumer Paint Pail Plastic Waste" Polymers 16, no. 18: 2631. https://doi.org/10.3390/polym16182631
APA StyleBalu, R., Sharma, S., Roberts, R., Vongsvivut, J., & Choudhury, N. R. (2024). Upcycling Post-Consumer Paint Pail Plastic Waste. Polymers, 16(18), 2631. https://doi.org/10.3390/polym16182631