
Color and Chemical Stability of 3D-Printed and Thermoformed Polyurethane-Based Aligners
 , , ,
, , , 
Abstract
1. Introduction
2. Materials and Methods
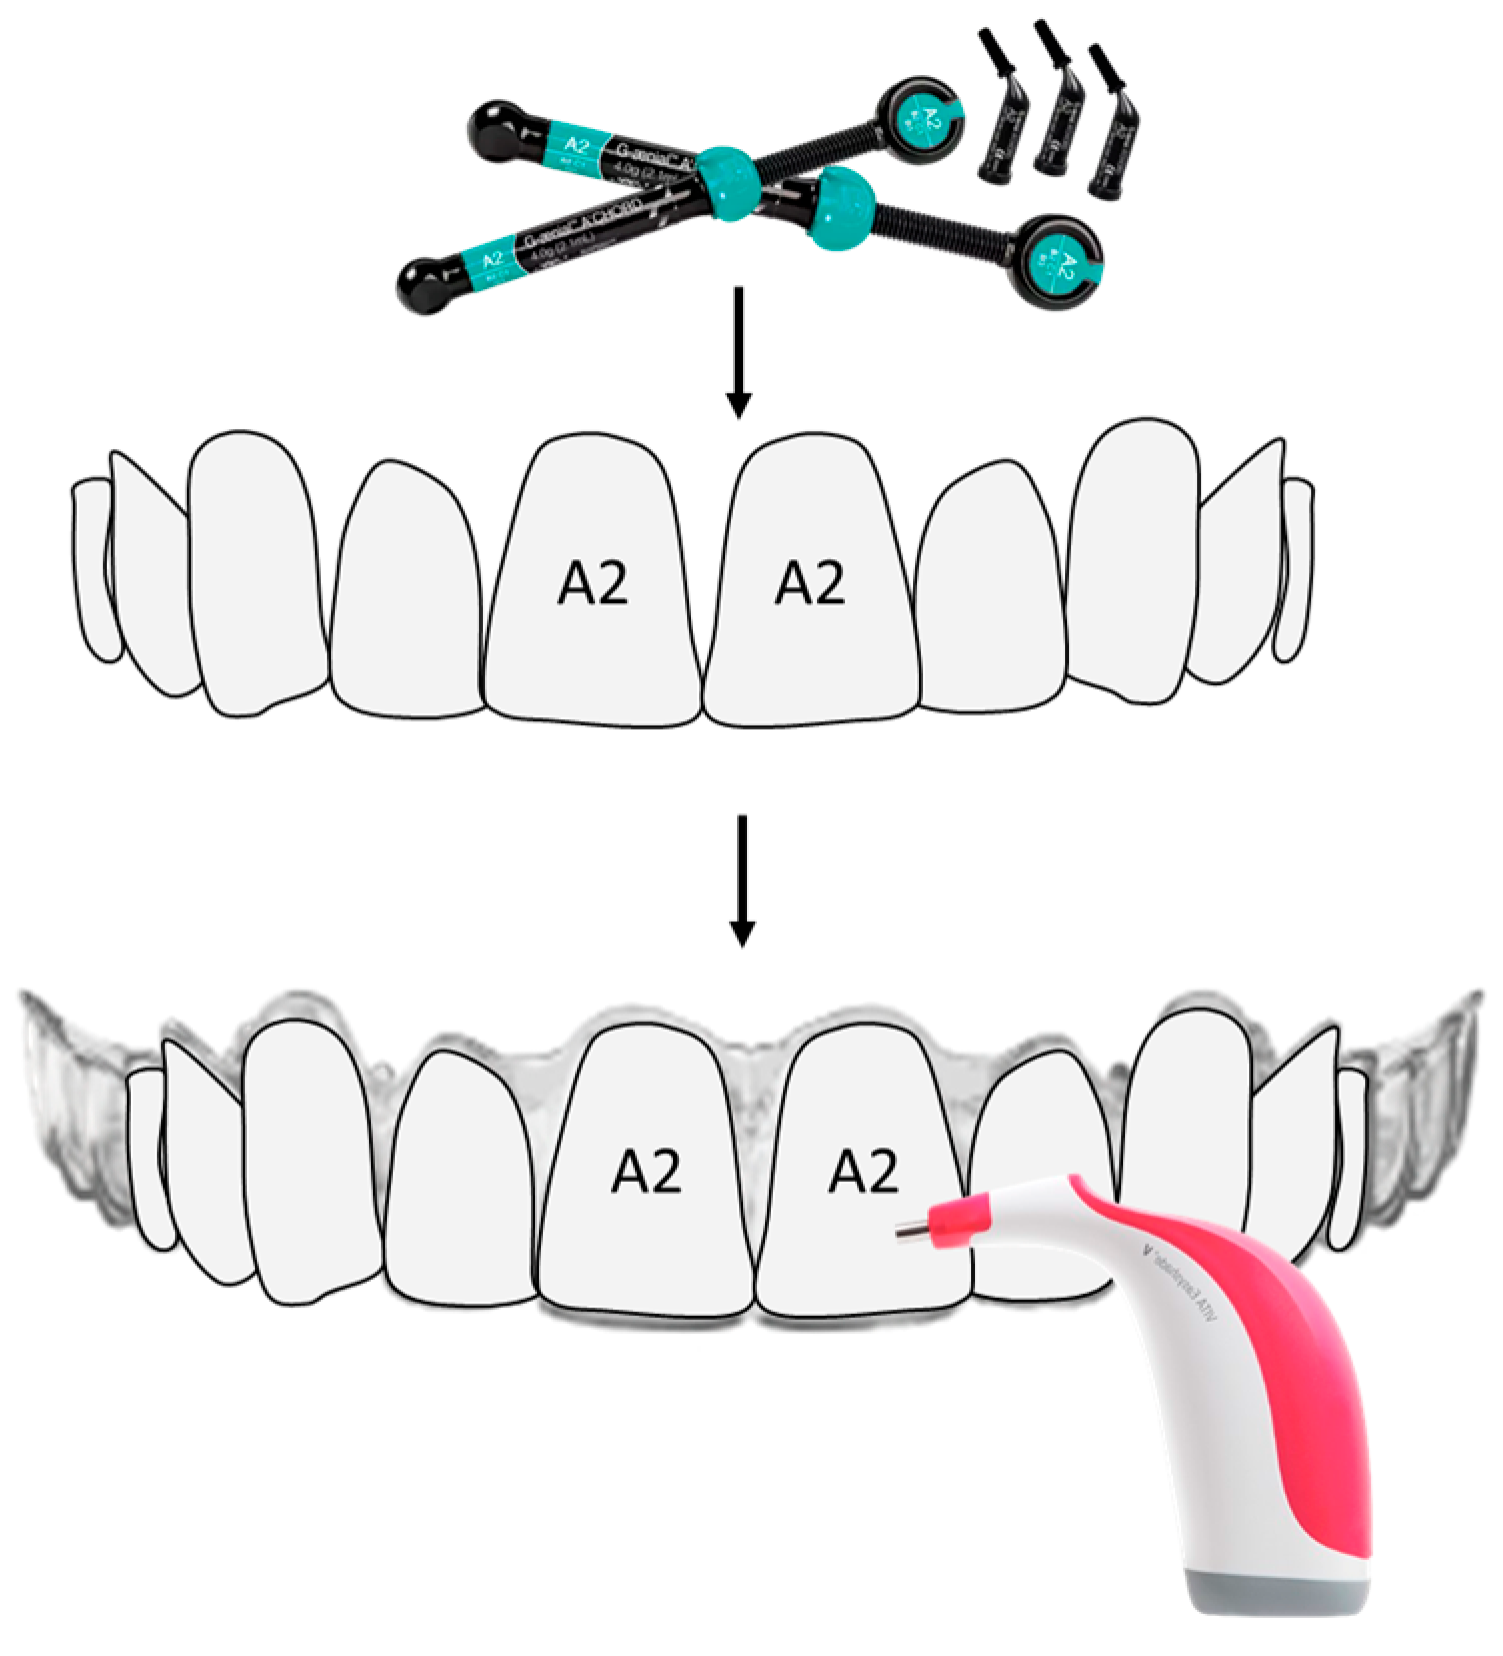
2.1. Sample Preparation
2.2. Beverage Preparation
2.3. Color Change Evaluation
2.4. Color Change Rating
2.5. ATR-FTIR
2.6. Sample Size
2.7. Statistical Analysis
3. Results
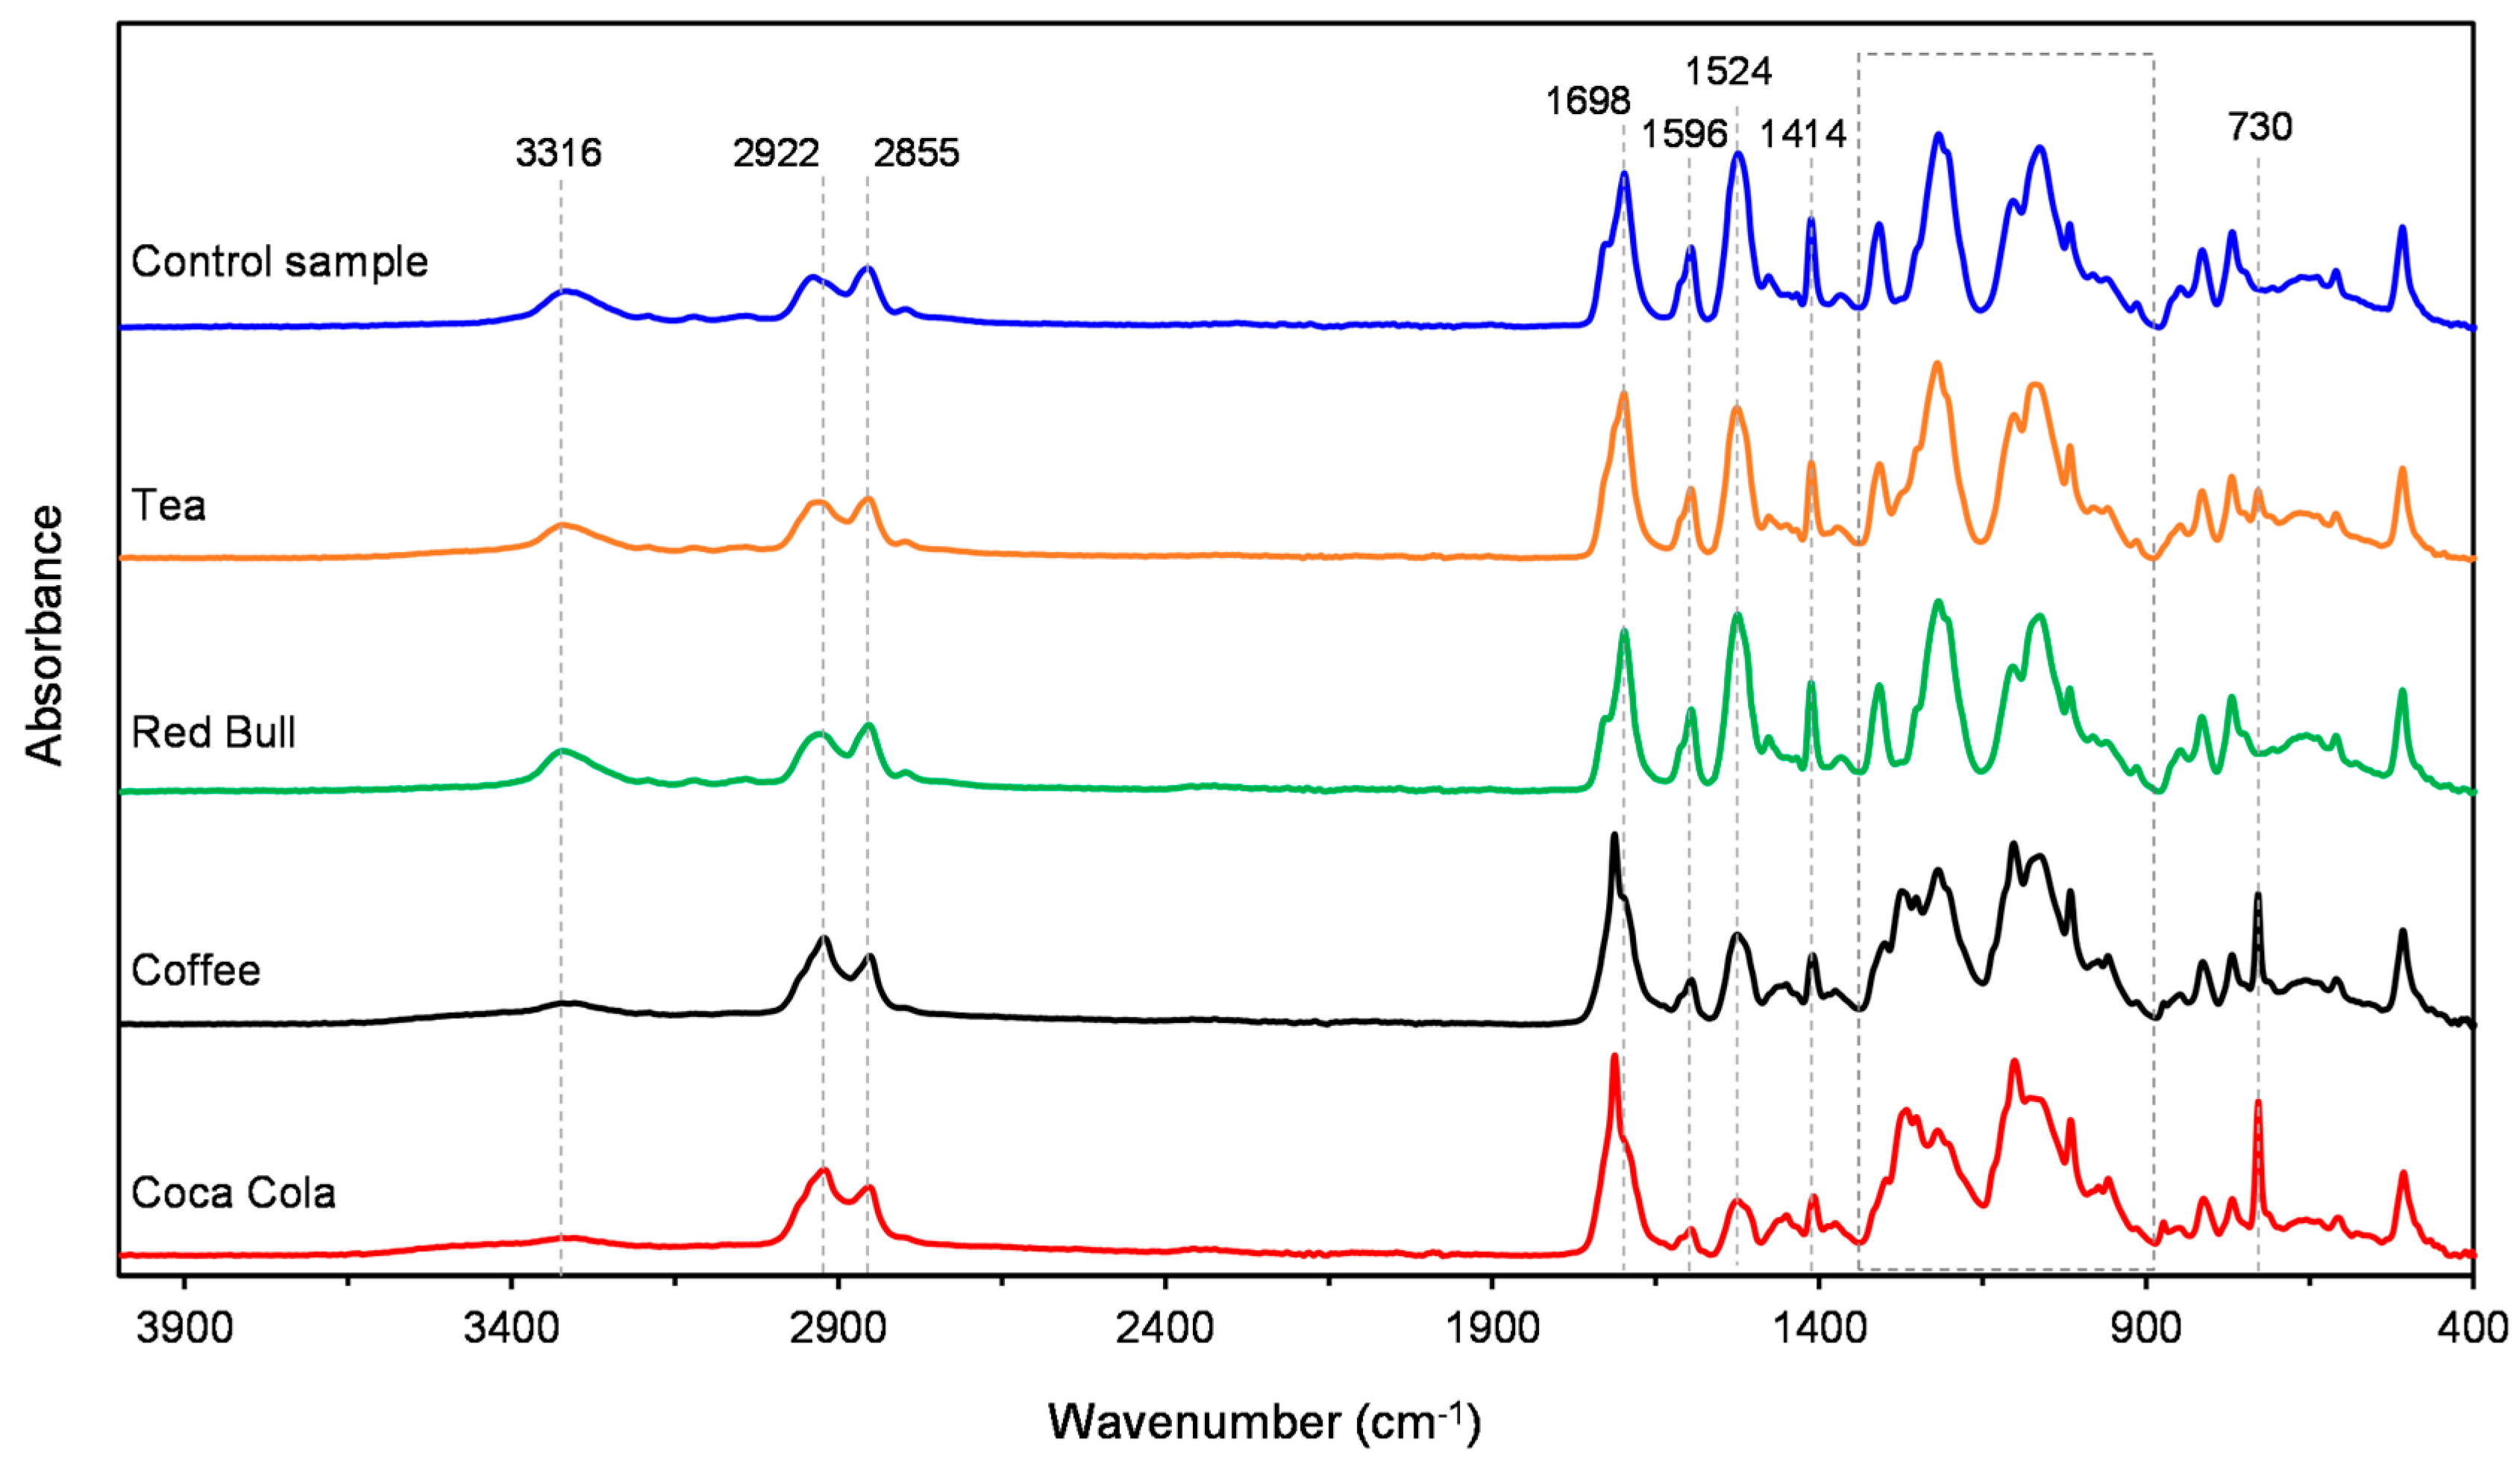
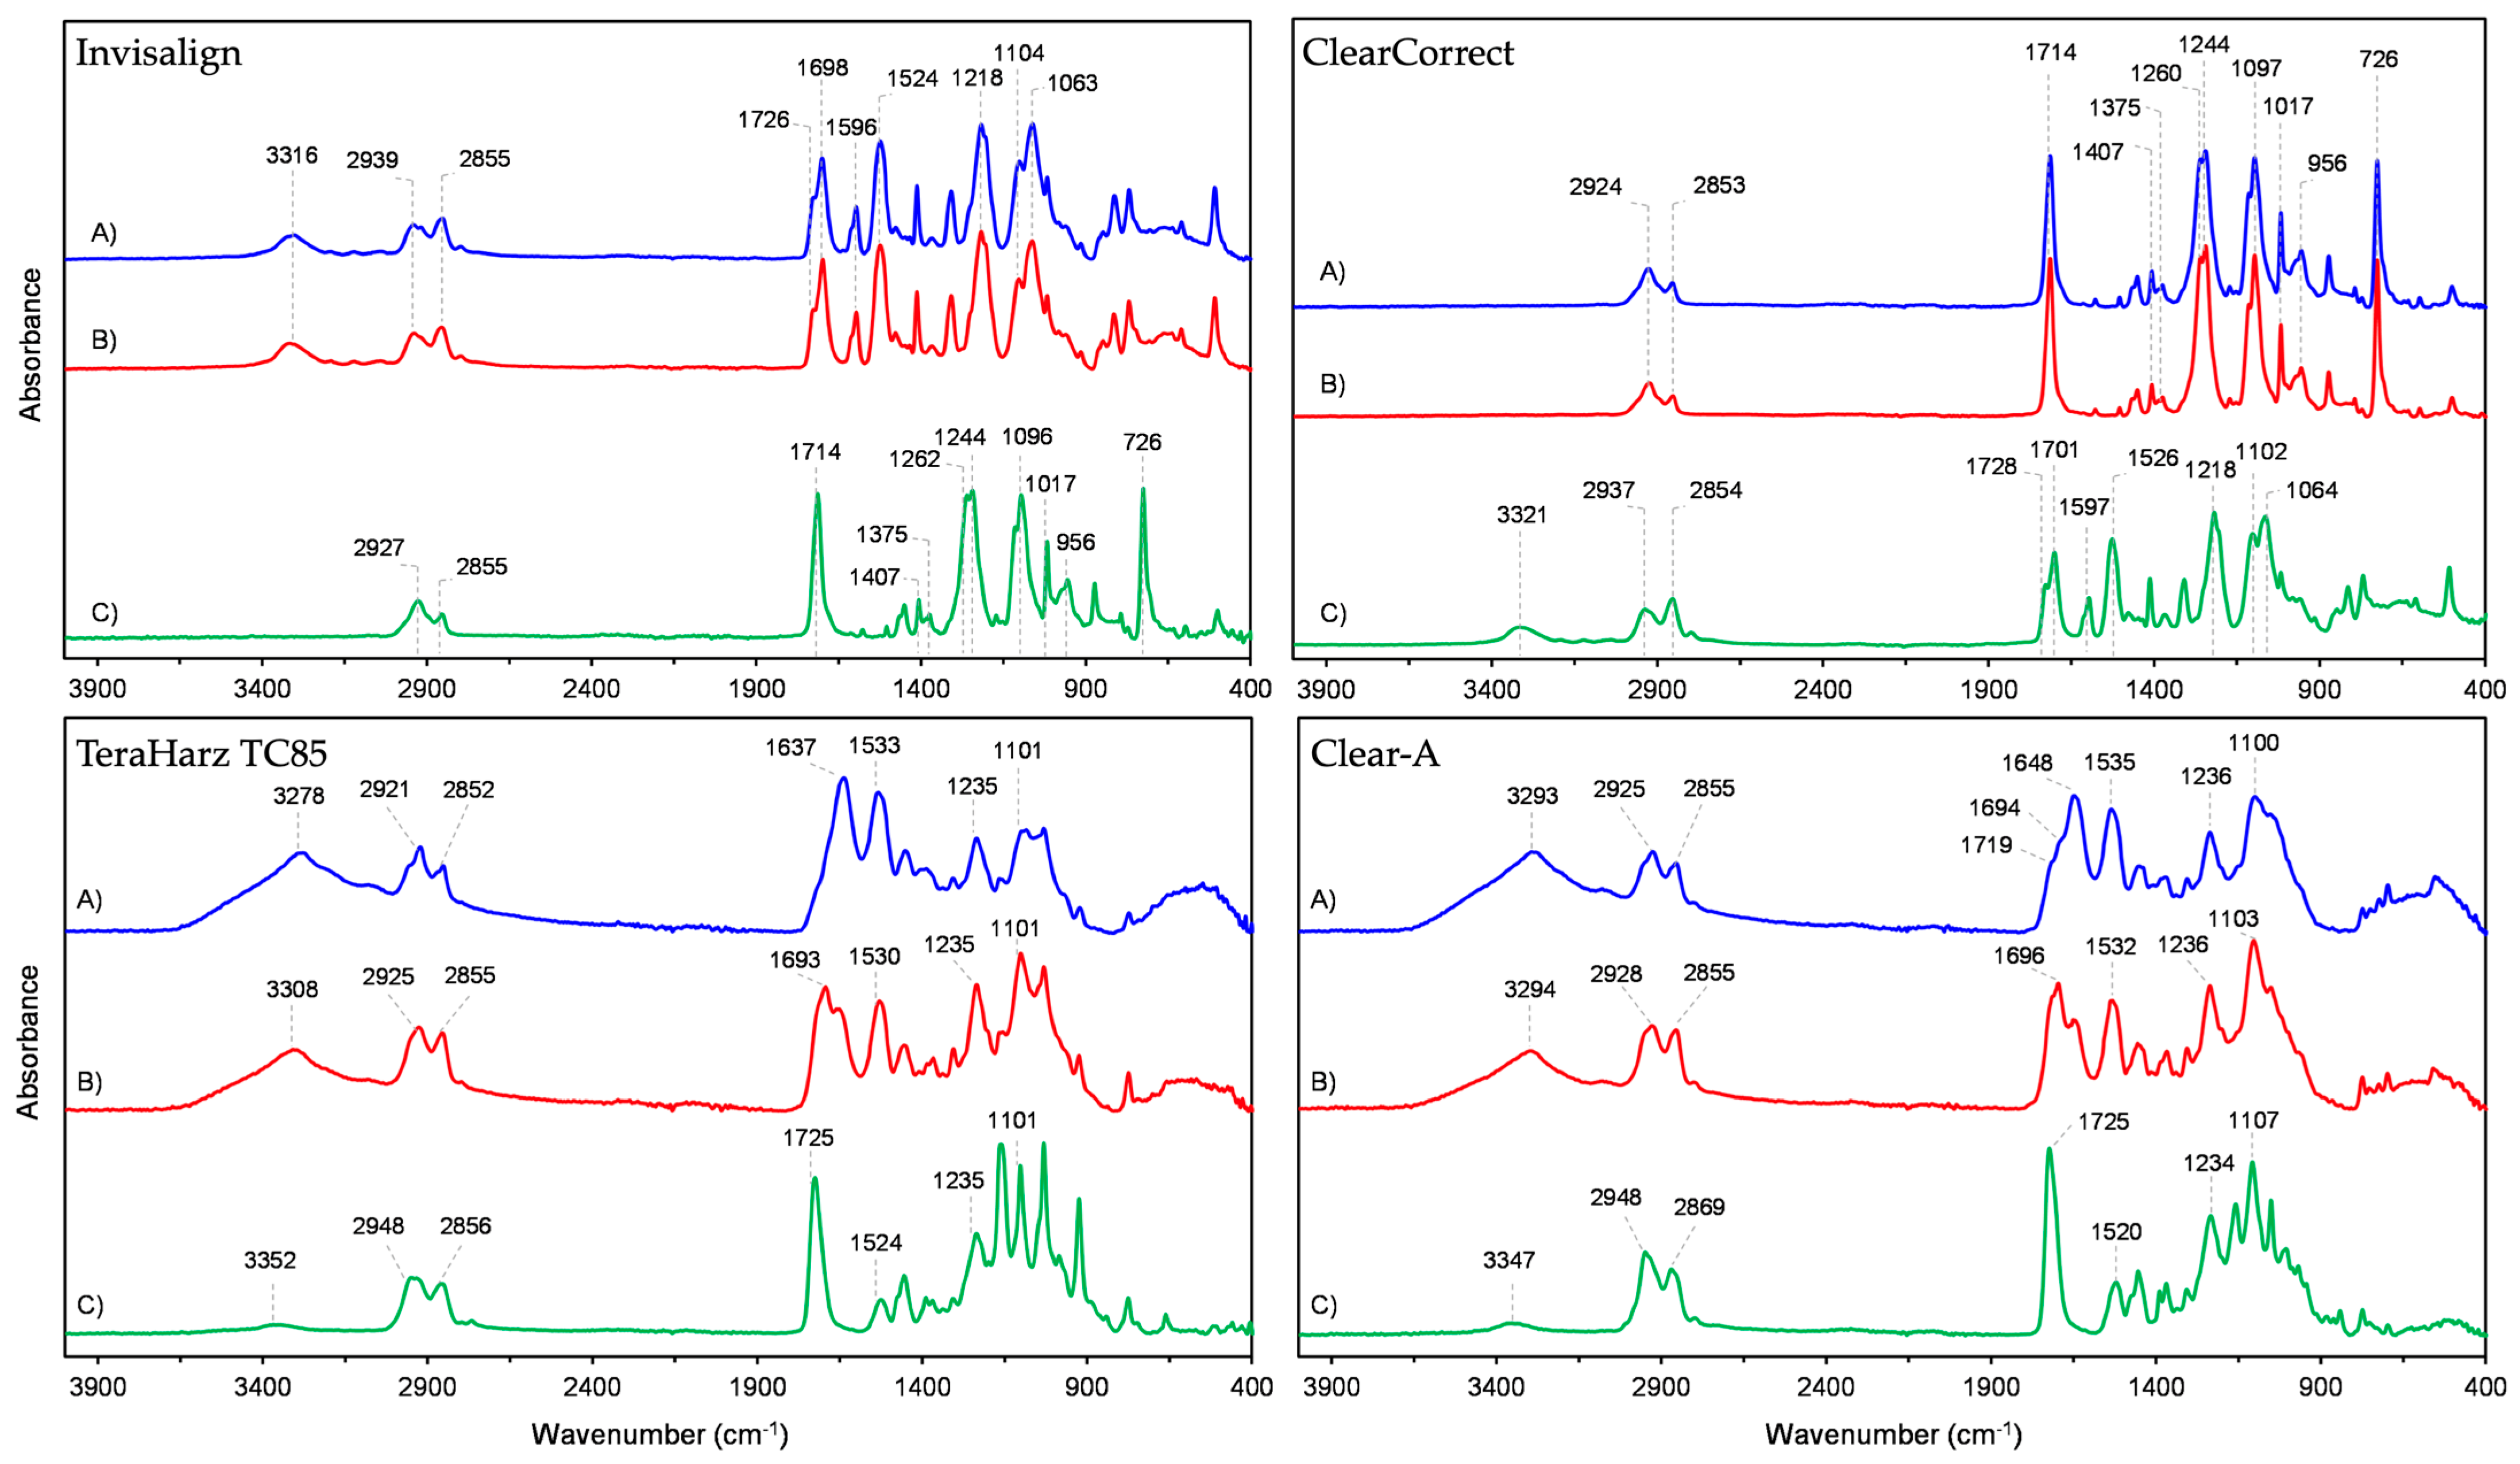
3.1. ATR-FTIR
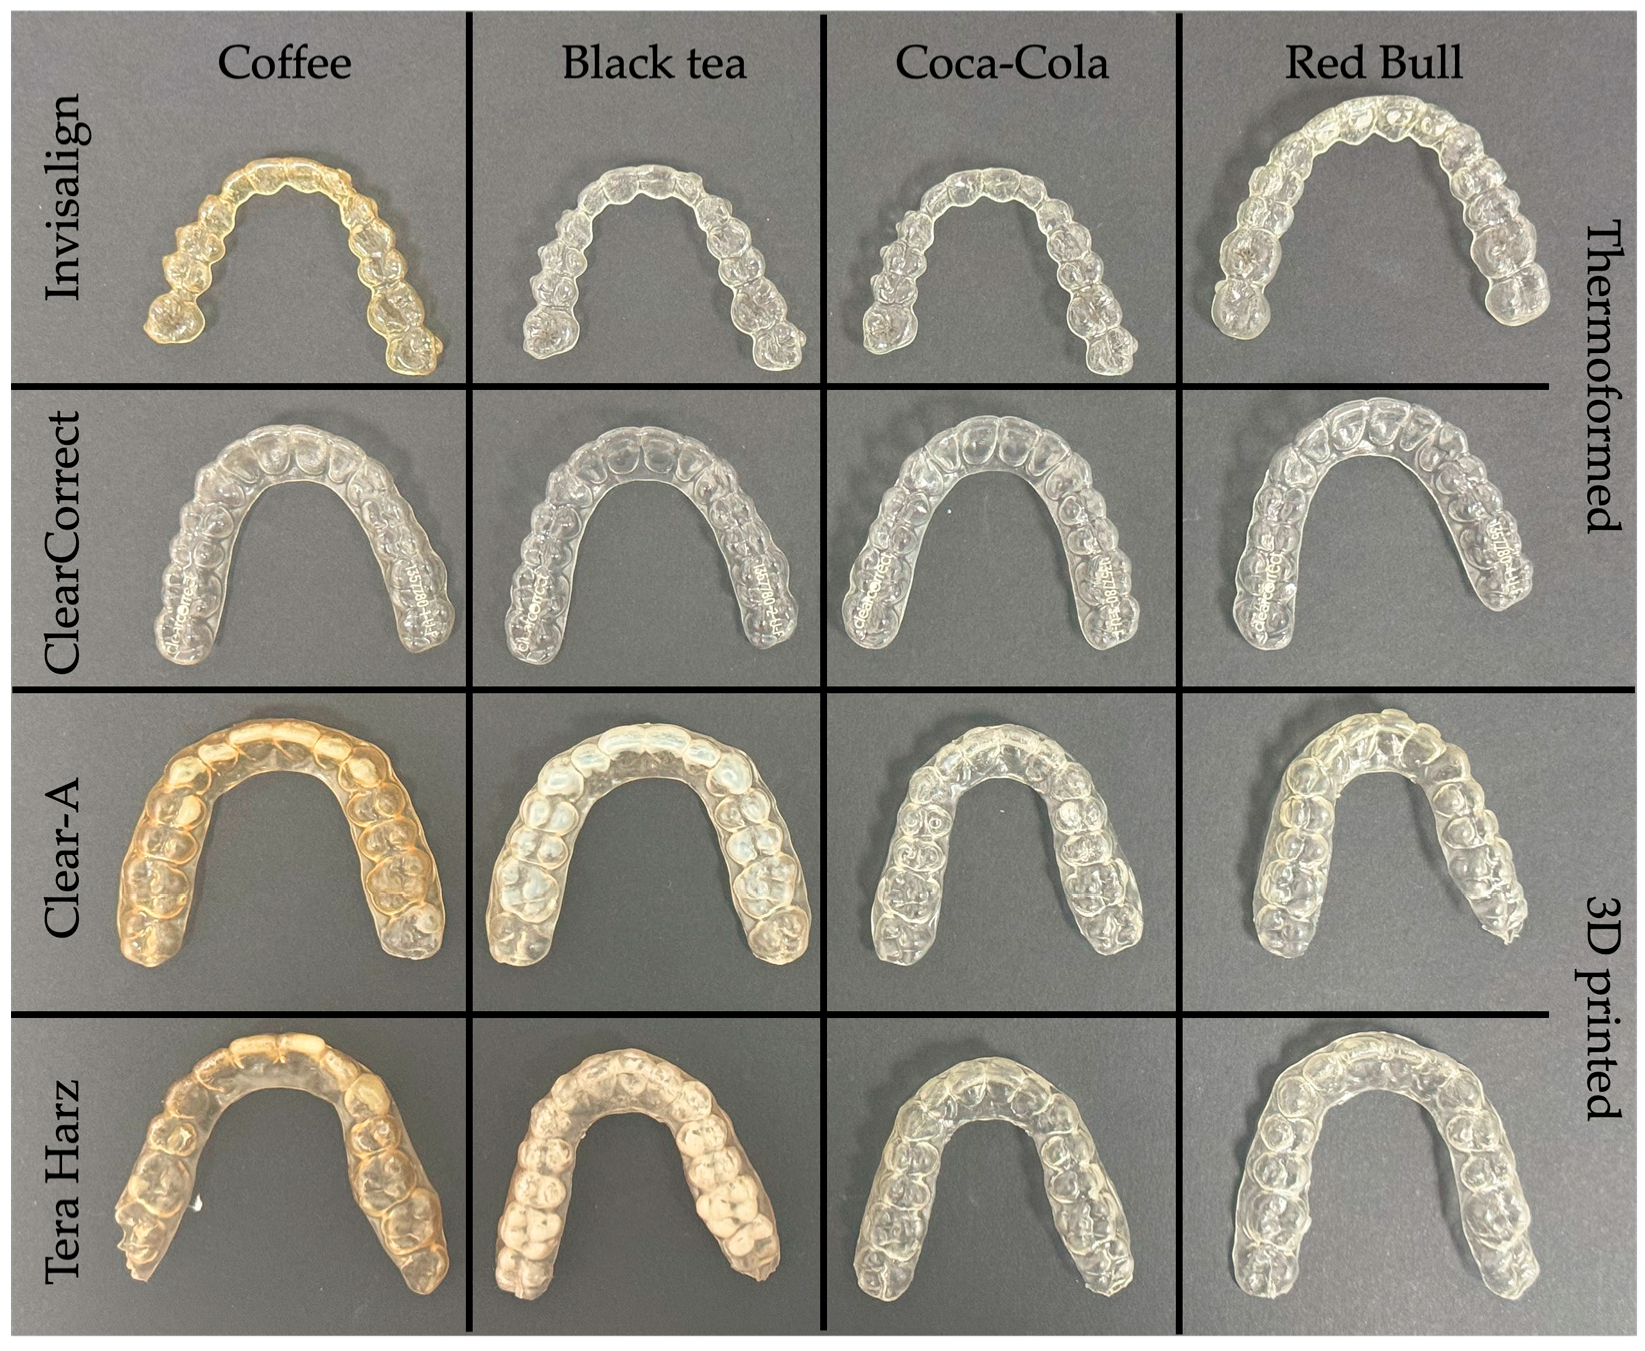
3.2. Color Change
3.2.1. Manufacturing Method
3.2.2. Brand
3.2.3. Beverage
3.2.4. Repeated Measures of Color Change ΔE*
3.2.5. L*a*b Ratios in Color Change
3.2.6. Color Change Rating
4. Discussion
5. Conclusions
Author Contributions
Funding
Institutional Review Board Statement
Data Availability Statement
Conflicts of Interest
References
- Weir, T. Clear Aligners in Orthodontic Treatment. Aust. Dent. J. 2017, 62 (Suppl. S1), 58–62. [Google Scholar] [CrossRef] [PubMed]
- Zheng, M.; Liu, R.; Ni, Z.; Yu, Z. Efficiency, Effectiveness and Treatment Stability of Clear Aligners: A Systematic Review and Meta-Analysis. Orthod. Craniofac. Res. 2017, 20, 127–133. [Google Scholar] [CrossRef]
- Meade, M.J.; Millett, D.T.; Cronin, M. Social perceptions of orthodontic retainer wear. Eur. J. Orthod. 2014, 36, 649–656. [Google Scholar] [CrossRef]
- Ganta, G.K.; Cheruvu, K.; Ravi, R.K.; Reddy, R.P. Clear Aligners, the Aesthetic Solution: A Review. Int. J. Dent. Mater. 2021, 3, 90–95. [Google Scholar] [CrossRef]
- Pithon, M.M.; Baião, F.C.S.; Sant’ Anna, L.I.D.D.A.; Paranhos, L.R.; Cople Maia, L. Assessment of the Effectiveness of Invisible Aligners Compared with Conventional Appliance in Aesthetic and Functional Orthodontic Treatment: A Systematic Review. J. Investig. Clin. Dent. 2019, 10, e12455. [Google Scholar] [CrossRef] [PubMed]
- Kumar Haridasan, A.; Srinivasan, I.; Setty, J.V.; Srinivasan, S.; Shilpa, S. Clear Aligners—Knowledge and Preference among Parents of Children Aged 10–17 Years. Int. J. Contemp. Pediatr. 2023, 10, 1088–1094. [Google Scholar] [CrossRef]
- Staderini, E.; Chiusolo, G.; Guglielmi, F.; Papi, M.; Perini, G.; Tepedino, M.; Gallenzi, P. Effects of Thermoforming on the Mechanical, Optical, Chemical, and Morphological Properties of PET-G: In Vitro Study. Polymers 2024, 16, 203. [Google Scholar] [CrossRef]
- Jindal, P.; Juneja, M.; Siena, F.L.; Bajaj, D.; Breedon, P. Mechanical and Geometric Properties of Thermoformed and 3D-printed Clear Dental Aligners. Am. J. Orthod. Dentofac. Orthop. 2019, 156, 694–701. [Google Scholar] [CrossRef]
- Yu, X.; Li, G.; Zheng, Y.; Gao, J.; Fu, Y.; Wang, Q.; Huang, L.; Pan, X.; Ding, J. “Invisible” Orthodontics by Polymeric “Clear” Aligners Molded on 3D-Printed Personalized Dental Models. Regen. Biomater. 2022, 9, rbac007. [Google Scholar] [CrossRef]
- Narongdej, P.; Hassanpour, M.; Alterman, N.; Rawlins-Buchanan, F.; Barjasteh, E. Advancements in Clear Aligner Fabrication: A Comprehensive Review of Direct-3D Printing Technologies. Polymers 2024, 16, 371. [Google Scholar] [CrossRef] [PubMed]
- Šimunović, L.; Jurela, A.; Sudarević, K.; Bačić, I.; Meštrović, S. Differential Stability of One-layer and Three-layer Orthodontic Aligner Blends under Thermocycling: Implications for Clinical Durability. Acta Stomatol. Croat. 2023, 57, 286–299. [Google Scholar] [CrossRef] [PubMed]
- Abogabal, A.; El-Sayed, S.A.; El-Ghafar, I.A.; Gaafar, M. Evaluation of Buccal Alveolar Bone after Orthodontic Treatment with Clear Aligner (Cone Beam Study). Al Azhar Assiut Dent. J. 2023, 6, 227–236. [Google Scholar] [CrossRef]
- Schimpf, V.; Asmacher, A.; Fuchs, A.; Bernd, B.; Mülhaupt, R. Polyfunctional Acrylic Non-Isocyanate Hydroxyurethanes as Photocurable Thermosets for 3D Printing. Macromolecules 2019, 52, 3288–3297. [Google Scholar] [CrossRef]
- Shi, Y.; Steier, W.H.; Chen, M.; Yu, L.; Dalton, L.R. Thermosetting Nonlinear Optical Polymer: Polyurethane with Disperse Red 19 Side Groups. Appl. Phys. Lett. 1992, 60, 2577–2579. [Google Scholar] [CrossRef]
- Mahmoudi, M.; Burlison, S.R.; Moreno, S.; Minary-Jolandan, M. Additive-Free and Support-Free 3D Printing of Thermosetting Polymers with Isotropic Mechanical Properties. ACS Appl. Mater. Interfaces 2021, 13, 5529–5538. [Google Scholar] [CrossRef] [PubMed]
- Liu, C.L.; Sun, W.T.; Liao, W.; Lu, W.X.; Li, Q.-W.; Jeong, Y.; Liu, J.; Zhao, Z.-H. Colour Stabilities of Three Types of Orthodontic Clear Aligners Exposed to Staining Agents. Int. J. Oral Sci. 2016, 8, 246–253. [Google Scholar] [CrossRef]
- Lai, Y.; Lui, H.; Lee, S. In Vitro Color Stability, Stain Resistance, and Water Sorption of Four Removable Gingival Flange Materials. J. Prosthet. Dent. 2003, 90, 293–300. [Google Scholar] [CrossRef] [PubMed]
- Timm, L.H.; Rößler, R.; Baxmann, M. Comparison of Clear Aligner Treatment in First-Treatment and Re-Treatment Patients: A Retrospective Cohort Study. Appl. Sci. 2023, 13, 4303. [Google Scholar] [CrossRef]
- Lu, H.; Roeder, L.B.; Lei, L.; Powers, J.M. Effect of Surface Roughness on Stain Resistance of Dental Resin Composites. J. Esthet. Restor. Dent. 2005, 17, 102–108. [Google Scholar] [CrossRef]
- Alharbi, N.; Alharbi, A.; Osman, R. Stain Susceptibility of 3D-Printed Nanohybrid Composite Restorative Material and the Efficacy of Different Stain Removal Techniques: An in Vitro Study. Materials 2021, 14, 5621. [Google Scholar] [CrossRef] [PubMed]
- Paolone, G.; Pavan, F.; Mandurino, M.; Baldani, S.; Guglielmi, P.C.; Scotti, N.; Cantatore, G.; Vichi, A. Color stability of resin-based composites exposed to smoke. A systematic review. J. Esthet. Restor. Dent. 2023, 35, 309–321. [Google Scholar] [CrossRef] [PubMed]
- Tartaglia, G.M.; Mapelli, A.; Maspero, C.; Santaniello, T.; Serafin, M.; Farronato, M.; Caprioglio, A. Direct 3D Printing of Clear Orthodontic Aligners: Current State and Future Possibilities. Materials 2021, 14, 1799. [Google Scholar] [CrossRef]
- Maspero, C.; Tartaglia, G.M. 3D Printing of Clear Orthodontic Aligners: Where We Are and Where We Are Going. Materials 2020, 13, 5204. [Google Scholar] [CrossRef] [PubMed]
- Šimunović, L.; Jurela, A.; Sudarević, K.; Bačić, I.; Haramina, T.; Meštrović, S. Influence of Post-Processing on the Degree of Conversion and Mechanical Properties of 3D-Printed Polyurethane Aligners. Polymers 2023, 16, 17. [Google Scholar] [CrossRef] [PubMed]
- Papageorgiou, S.N.; Koletsi, D.; Iliadi, A.; Peltomaki, T.; Eliades, T. Treatment Outcome with Orthodontic Aligners and Fixed Appliances: A Systematic Review with Meta-Analyses. Eur. J. Orthod. 2019, 42, 331–343. [Google Scholar] [CrossRef] [PubMed]
- Jindal, P.; Juneja, M.; Bajaj, D.; Siena, F.L.; Breedon, P. Effects of Post-Curing Conditions on Mechanical Properties of 3D-printed Clear Dental Aligners. Rapid Prototyp. J. 2020, 26, 1337–1344. [Google Scholar] [CrossRef]
- Elamin, H.O.; Abubakr, N.H.; Ibrahim, Y.E. Identifying the Tooth Shade in Group of Patients Using Vita Easyshade. Eur. J. Dent. 2015, 09, 213–217. [Google Scholar] [CrossRef] [PubMed]
- Jahangiri, L.; Reinhardt, S.B.; Mehra, R.V.; Matheson, P.B. Relationship between Tooth Shade Value and Skin Color: An Observational Study. J. Prosthet. Dent. 2002, 87, 149–152. [Google Scholar] [CrossRef]
- Nimeroff, I. Colorimetry; US National Bureau of Standards: Washington, DC, USA, 1968; Issue 104. [Google Scholar]
- Venkatasubramanian, P.; Jerome, M.S.; Ragunanthanan, L.; Maheshwari, U.; Vijayalakshmi, D. Color stability of aligner materials on exposure to indigenous food products: An in-vitro study. J. Dent. Res. Dent. Clin. Dent. Prospects. 2022, 16, 221–228. [Google Scholar] [CrossRef] [PubMed]
- Charles, P.; Giraudeau, B.; Dechartres, A.; Baron, G.; Ravaud, P. Reporting of Sample Size Calculation in Randomised Controlled Trials: Review. BMJ 2009, 338, b1732. [Google Scholar] [CrossRef]
- Alhendi, A.; Khounganian, R.; Ali, R.; Syed, S.A.; Almudhi, A. Structural Conformation Comparison of Different Clear Aligner Systems: An In Vitro Study. Dent. J. 2022, 10, 73. [Google Scholar] [CrossRef]
- Daniele, V.; Macera, L.; Taglieri, G.; Spera, L.; Marzo, G.; Quinzi, V. Color Stability, Chemico-Physical and Optical Features of the Most Common PETG and PU Based Orthodontic Aligners for Clear Aligner Therapy. Polymers 2021, 14, 14. [Google Scholar] [CrossRef] [PubMed]
- Bernard, G.P.; Rompré Tavares, J.R.; Montpetit, A. Colorimetric and spectrophotometric measurements of orthodontic thermoplastic aligners exposed to various staining sources and cleaning methods. Head Face Med. 2020, 16, 2. [Google Scholar] [CrossRef] [PubMed]
- Dalaie, K.; Fatemi, S.M.; Ghaffari, S. Dynamic mechanical and thermal properties of clear aligners after thermoforming and aging. Prog. Orthod. 2021, 22, 15. [Google Scholar] [CrossRef] [PubMed]
- Zafeiriadis, A.A.; Karamouzos, A.; Athanasiou, A.E.; Eliades, T.; Palaghias, G. An in vivo spectrophotometric evaluation of Vivera and Essix clear thermoplastic retainer discoloration. Aust. Orthod. J. 2018, 34, 3–10. [Google Scholar]
- Talic, N.F.; Almudhi, A.A. The effect of dietary pigmentation on the esthetic appearance of clear orthodontic elastomeric modules. J. Orthod. Sci. 2016, 5, 70–73. [Google Scholar]
- Ryu, J.H.; Kwon, J.S.; Jiang, H.B.; Cha, J.Y.; Kim, K.M. Effects of Thermoforming on the Physical and Mechanical Properties of Thermoplastic Materials for Transparent Orthodontic Aligners. Korean J. Orthod. 2018, 48, 316. [Google Scholar] [CrossRef]
- Tamburrino, F.; D’Antò, V.; Bucci, R.; Alessandri-Bonetti, G.; Barone, S.; Razionale, A.V. Mechanical Properties of Thermoplastic Polymers for Aligner Manufacturing: In Vitro Study. Dent. J. 2020, 8, 47. [Google Scholar] [CrossRef]
- Iftekar, S.F.; Aabid, A.; Amir, A.; Baig, M. Advancements and Limitations in 3D Printing Materials and Technologies: A Critical Review. Polymers 2023, 15, 2519. [Google Scholar] [CrossRef] [PubMed]
- Buj-Corral, I.; Bagheri, A.; Sivatte-Adroer, M. Effect of Printing Parameters on Dimensional Error, Surface Roughness and Porosity of FFF Printed Parts with Grid Structure. Polymers 2021, 13, 1213. [Google Scholar] [CrossRef]
- Pyo, S.H.; Wang, P.; Hwang, H.H.; Zhu, W.; Warner, J.O.; Chen, S. Continuous Optical 3D Printing of Green Aliphatic Polyurethanes. ACS Appl. Mater. Interfaces 2017, 9, 836–844. [Google Scholar] [CrossRef] [PubMed]
- Zheng, N.; Fang, Z.; Zou, W.; Zhao, Q.; Xie, T. Thermoset Shape-Memory Polyurethane with Intrinsic Plasticity Enabled by Transcarbamoylation. Angew. Chem. Int. Ed. 2016, 55, 11421–11425. [Google Scholar] [CrossRef] [PubMed]
- Mrówka, M.; Szymiczek, M.; Lenża, J. Thermoplastic polyurethanes for mining application processing by 3D printing. J. Achiev. Mater. Manuf. Eng. 2019, 95, 13–19. [Google Scholar] [CrossRef]
- Šimunović, L.; Blagec, T.; Vrankić, A.; Meštrović, S. Color Stability of Orthodontic Ceramic Brackets and Adhesives in Potentially Staining Beverages—In Vitro Study. Dent. J. 2022, 10, 115. [Google Scholar] [CrossRef]
- Rosu, D.; Rosu, L.; Cascaval, C.N. IR-Change and Yellowing of Polyurethane as a Result of UV Irradiation. Polym. Degrad. Stab. 2009, 94, 591–596. [Google Scholar] [CrossRef]
- Gönülol, N.; Yılmaz, F. The effects of finishing and polishing techniques on surface roughness and color stability of nanocomposites. J. Dent. 2012, 40, e64–e70. [Google Scholar] [CrossRef] [PubMed]
- Filho, H.L.; Maia, L.H.; Araújo, M.V.; Eliast, C.N.; Ruellas, A.C. Colour stability of aesthetic brackets: Ceramic and plastic. Aust. Orthod. J. 2013, 29, 13–20. [Google Scholar] [CrossRef] [PubMed]
- Selvaraj, M.; Mohaideen, K.; Sennimalai, K.; Gothankar, G.S.; Arora, G. Effect of oral environment on contemporary orthodontic materials and its clinical implications. J. Orthod. Sci. 2023, 12, 1. [Google Scholar] [CrossRef] [PubMed]
- Charavet, C.; Gourdain, Z.; Graveline, L.; Lupi, L. Cleaning and Disinfection Protocols for Clear Orthodontic Aligners: A Systematic Review. Healthcare 2022, 10, 340. [Google Scholar] [CrossRef]
- Azmuddin, I.; Mustapha, N.; Khan, H.; Sinniah, S. Physical effects of cleaning agents on orthodontic thermoplastic retainer polymer: A narrative review. J. Int. Oral Health 2022, 14, 349–356. [Google Scholar] [CrossRef]
- Šimunović, L.; Blagec, T.; Meštrović, S. The Influence of Different Cleaning Protocols on the Surface Roughness of Orthodontic Retainers. Appl. Sci. 2023, 13, 1319. [Google Scholar] [CrossRef]
- Šimunović, L.; Blagec, T.; Meštrović, S. Resistance of PETG Materials on Thermocycling and Brushing. Appl. Sci. 2023, 11, 135. [Google Scholar] [CrossRef] [PubMed]
- Chen, H.; Zhou, H.J.; Liu, D.J.; Li, Y.T. The Effect of Polyester Structures on the Damping Property of Polyurethane Elastomers. Adv. Mat. Res. 2012, 581–582, 710–714. [Google Scholar] [CrossRef]
- Lin, C.; Kuo, J.; Chen, C.; Fang, J. Investigation of bifurcated hydrogen bonds within the thermotropic liquid crystalline polyurethanes. Polymer 2012, 53, 254–258. [Google Scholar] [CrossRef]
- Kim, E.B.; Koo, S.J.; Jeong, S.G.; Kim, S.H. Study on the Mechanical Properties of Composite Materials of Polyurethane Resin and CuO. J. Power Syst. Eng. 2014, 18, 106–114. [Google Scholar] [CrossRef]
- Johlitz, M.; Diebels, S.; Batal, J.; Steeb, H.; Possart, W. Size effects in polyurethane bonds: Experiments, modelling and parameter identification. J. Mater. Sci. 2008, 43, 4768–4779. [Google Scholar] [CrossRef]
- Qin, C.; Jin, Z.; Bai, X.; Jiang, H.; Cai, W. Compatibility of Polyurethane/(vinyl ester resin)(ethyl acrylate) Interpenetrating Polymer Network. Polym. J. 2007, 39, 1365–1372. [Google Scholar] [CrossRef]
- Chen, H.; Dai, F.; Hu, M.; Chen, C.; Qian, G.; Yu, Y. Heat-resistant polyimides with low CTE and water absorption through hydrogen bonding interactions. J. Polym. Sci. 2021, 59, 1942. [Google Scholar] [CrossRef]
- Luo, S.L.; Gong, G.F.; Deng, J.Q.; Shi, G.; Zhu, H. Improved Water Resistance of Waterborne Polyurethane. Adv. Mater. Res. 2010, 168–170, 1796–1800. [Google Scholar] [CrossRef]
- Matteliano, C.J. The Effect of Temperature and Relative Humidity on Dimension, Volume Resistivity and Ionic Depletion Rate of Semi-Conductive Polyurethane. In Proceedings of the IS&T’s NIP19: 2003 International Conference on Digital Printing Technologies, New Orleans, LA, USA, 28 September–3 October 2003; Society of Imaging Science and Technology: Springfield, VA, USA, 2003; pp. 524–528. [Google Scholar] [CrossRef]
- Quan, H.; Xing, J.; Gu, Z. Effects of soft monomers on the water resistance and moisture permeability of hydrophilic polyurethane. J. Wuhan Univ. Technol. Mat. Sci. Edit. 2010, 25, 789–794. [Google Scholar] [CrossRef]
- Xie, F.; Zhang, T.; Bryant, P.; Kurusingal, V.; Colwell, J.; Laycock, B. Degradation and stabilization of polyurethane elastomers. Prog. Polym. Sci. 2019, 90, 211–268. [Google Scholar] [CrossRef]
- Davis, F.D.; Mitchell, G. Polyurethane Based Materials with Applications in Medical Devices. In Bio-Materials and Prototyping Applications in Medicine; Springer: Boston, MA, USA, 2008; pp. 27–48. [Google Scholar] [CrossRef]


| Polyurethane Layers | Poly (Ethylene Terephthalate Glycol) Layer | ||
|---|---|---|---|
| Wavenumber (cm−1) | Vibration | Wavenumber (cm−1) | Vibration |
| 3316 | ν N–H | 2927 | νas C–H (CH2) |
| 2939 | νas C–H (CH2) | 2855 | νs C–H (CH2) |
| 2855 | νs C–H (CH2) | 1714 | ν C=O |
| 1726 | ν C=O (free) | 1407 | δ CH2 |
| 1698 | ν C=O (hydrogen bonded) | 1375 | δwg CH2 |
| 1596 | ν C=C (aromatic) | 1262 | ν (C=O)–O |
| 1524 | δ N–H, ν C–C, ν C–N | 1244 | |
| 1218 | ν C–O | 1096 | νs C–O |
| 1104 | ν C–O–C (of ester group) | 1017 | δip C–H |
| 1063 | 956 | δ C–H (cyclohexylene ring) | |
| 726 | δoop C–H | ||
| Brand | Beverage | ΔE* (24 h) | ΔE* (48 h) | ΔE* (72 h) | ΔE* (7 Days) | ||||
|---|---|---|---|---|---|---|---|---|---|
| Mean | SD | Mean | SD | Mean | SD | Mean | SD | ||
| Invisalign | Coffee | 10.64 | 2.43 | 13.38 | 2.3 | 16.95 | 2.68 | 20.06 | 2.61 |
| Black tea | 2.89 | 0.96 | 2.71 | 0.73 | 3.69 | 1.58 | 4.75 | 2.34 | |
| Coca-Cola | 2.16 | 0.97 | 3.55 | 1.84 | 3.19 | 1.1 | 3.42 | 1.5 | |
| Red Bull | 4.74 | 1.9 | 4.66 | 1.69 | 4.01 | 1.55 | 6.87 | 6.52 | |
| ClearCorrect | Coffee | 2.51 | 1.06 | 3.28 | 0.66 | 4.27 | 0.94 | 4.28 | 1.46 |
| Black tea | 2.86 | 1.62 | 2.94 | 0.94 | 3.19 | 0.88 | 2.99 | 1.07 | |
| Coca-Cola | 3.43 | 0.85 | 3.79 | 1.15 | 3.91 | 0.77 | 3.62 | 1.04 | |
| Red Bull | 3.18 | 1.47 | 5.27 | 1.9 | 4.6 | 1.97 | 4.86 | 2.18 | |
| Clear-A | Coffee | 15.02 | 4.72 | 19.45 | 1.76 | 19.72 | 1.12 | 23.38 | 2.12 |
| Black tea | 6.54 | 1.82 | 8.45 | 1.71 | 12.48 | 1.98 | 17 | 1.93 | |
| Coca-Cola | 5.24 | 2.72 | 5.1 | 2.6 | 6.06 | 2.61 | 4.36 | 2.93 | |
| Red Bull | 5.48 | 2.14 | 4.82 | 3.28 | 3.57 | 2.29 | 4.92 | 2.81 | |
| Tera Harz TC85 | Coffee | 17.14 | 4.76 | 22.48 | 2.44 | 23.56 | 1.72 | 26.38 | 2.39 |
| Black tea | 9.77 | 2.77 | 15.46 | 2.65 | 22.06 | 2.1 | 27.04 | 1.58 | |
| Coca-Cola | 3.89 | 1.57 | 6 | 2.77 | 6.79 | 2.11 | 5.49 | 2.05 | |
| Red Bull | 4.3 | 2.59 | 4.74 | 2.33 | 3.6 | 2.38 | 3.73 | 1.92 | |
| Brand (I) | Brand (J) | Mean Difference (I–J) | 95% CI Lower | 95% CI Upper | p-Value |
|---|---|---|---|---|---|
| Invisalign | ClearCorrect | 3.041 | 2.027 | 4.055 | <0.001 |
| Clear-A | −3.371 | −4.386 | −2.357 | <0.001 | |
| Tera Harz TC85 | −5.924 | −6.938 | −4.909 | <0.001 | |
| ClearCorrect | Invisalign | −3.041 | −4.055 | −2.027 | <0.001 |
| Clear-A | −6.413 | −7.427 | −5.398 | <0.001 | |
| Tera Harz TC85 | −8.965 | −9.979 | −7.951 | <0.001 | |
| Clear-A | Invisalign | 3.371 | 2.357 | 4.386 | <0.001 |
| ClearCorrect | 6.413 | 5.398 | 7.427 | <0.001 | |
| Tera Harz TC85 | −2.552 | −3.566 | −1.538 | <0.001 | |
| Tera Harz TC85 | Invisalign | 5.924 | 4.909 | 6.938 | <0.001 |
| ClearCorrect | 8.965 | 7.951 | 9.979 | <0.001 | |
| Clear-A | 2.552 | 1.538 | 3.566 | <0.001 |
| Beverage (I) | Beverage (J) | Mean Difference (I–J) | 95% CI Lower | 95% CI Upper | p-Value |
|---|---|---|---|---|---|
| Coffee | Black tea | 6.103 | 5.089 | 7.117 | <0.001 |
| Coca-Cola | 10.781 | 9.767 | 11.796 | <0.001 | |
| Red Bull | 10.571 | 9.557 | 11.586 | <0.001 | |
| Black tea | Coffee | −6.103 | −7.117 | −5.089 | <0.001 |
| Coca-Cola | 4.678 | 3.664 | 5.692 | <0.001 | |
| Red Bull | 4.468 | 3.454 | 5.482 | <0.001 | |
| Coca-Cola | Coffee | −10.781 | −11.796 | −9.767 | <0.001 |
| Black tea | −4.678 | −5.692 | −3.664 | <0.001 | |
| Red Bull | −0.210 | −1.224 | 0.804 | 1.000 | |
| Red Bull | Coffee | −10.571 | −11.586 | −9.557 | <0.001 |
| Black tea | −4.468 | −5.482 | −3.454 | <0.001 | |
| Coca-Cola | 0.210 | −0.804 | 1.224 | 1.000 |
| Brand | Beverage | L* Parameter | a* Parameter | b* Parameter | ΔE* | ||||
|---|---|---|---|---|---|---|---|---|---|
| Mean | SD | Mean | SD | Mean | SD | Mean | SD | ||
| Invisalign | Coffee | 0.26 * | 0.04 | 0.06 * | 0.01 | 0.68 | 0.04 | 20.06 | 2.61 |
| Black tea | 0.45 | 0.18 | 0.15 | 0.1 | 0.40 * | 0.15 | 4.75 | 2.34 | |
| Coca-Cola | 0.33 | 0.15 | 0.17 | 0.15 | 0.50 * | 0.2 | 3.42 | 1.5 | |
| Red Bull | 0.34 | 0.27 | 0.1 | 0.08 | 0.56 | 0.26 | 6.87 | 6.52 | |
| ClearCorrect | Coffee | 0.35 | 0.15 | 0.17 | 0.08 | 0.49 * | 0.17 | 4.28 | 1.46 |
| Black tea | 0.17 * | 0.13 | 0.23 | 0.12 | 0.60 * | 0.15 | 2.99 | 1.07 | |
| Coca-Cola | 0.28 | 0.19 | 0.15 * | 0.08 | 0.57 * | 0.2 | 3.62 | 1.04 | |
| Red Bull | 0.15 * | 0.12 | 0.06 * | 0.04 | 0.79 | 0.15 | 4.86 | 2.18 | |
| Clear-A | Coffee | 0.37 * | 0.07 | 0.08 * | 0.02 | 0.54 | 0.06 | 23.38 | 2.12 |
| Black tea | 0.57 | 0.11 | 0.15 | 0.01 | 0.28 * | 0.11 | 17.0 | 1.93 | |
| Coca-Cola | 0.46 | 0.21 | 0.17 | 0.17 | 0.37 * | 0.18 | 4.36 | 2.93 | |
| Red Bull | 0.49 | 0.22 | 0.07 * | 0.03 | 0.44 | 0.22 | 4.92 | 2.81 | |
| Tera Harz TC85 | Coffee | 0.35 * | 0.08 | 0.11 | 0.02 | 0.54 | 0.08 | 26.38 | 2.39 |
| Black tea | 0.44 * | 0.06 | 0.16 | 0.02 | 0.40 * | 0.05 | 27.04 | 1.58 | |
| Coca-Cola | 0.76 | 0.11 | 0.08 | 0.06 | 0.16 * | 0.11 | 5.49 | 2.05 | |
| Red Bull | 0.52 * | 0.32 | 0.1 | 0.19 | 0.38 * | 0.24 | 3.73 | 1.92 | |
| Brand | Beverage | Mean |
|---|---|---|
| Invisalign | Coffee | 18.45 |
| Black tea | 4.37 | |
| Coca-Cola | 3.14 | |
| Red Bull | 6.32 | |
| ClearCorrect | Coffee | 3.94 |
| Black tea | 2.75 | |
| Coca-Cola | 3.33 | |
| Red Bull | 4.47 | |
| Clear-A | Coffee | 21.51 |
| Black tea | 15.64 | |
| Coca-Cola | 4.01 | |
| Red Bull | 4.53 | |
| Tera Harz TC 85 | Coffee | 24.27 |
| Black tea | 24.87 | |
| Coca-Cola | 5.05 | |
| Red Bull | 3.43 |
Disclaimer/Publisher’s Note: The statements, opinions and data contained in all publications are solely those of the individual author(s) and contributor(s) and not of MDPI and/or the editor(s). MDPI and/or the editor(s) disclaim responsibility for any injury to people or property resulting from any ideas, methods, instructions or products referred to in the content. |
© 2024 by the authors. Licensee MDPI, Basel, Switzerland. This article is an open access article distributed under the terms and conditions of the Creative Commons Attribution (CC BY) license (https://creativecommons.org/licenses/by/4.0/).
Share and Cite
Šimunović, L.; Čekalović Agović, S.; Marić, A.J.; Bačić, I.; Klarić, E.; Uribe, F.; Meštrović, S. Color and Chemical Stability of 3D-Printed and Thermoformed Polyurethane-Based Aligners. Polymers 2024, 16, 1067. https://doi.org/10.3390/polym16081067
Šimunović L, Čekalović Agović S, Marić AJ, Bačić I, Klarić E, Uribe F, Meštrović S. Color and Chemical Stability of 3D-Printed and Thermoformed Polyurethane-Based Aligners. Polymers. 2024; 16(8):1067. https://doi.org/10.3390/polym16081067
Chicago/Turabian StyleŠimunović, Luka, Sara Čekalović Agović, Antun Jakob Marić, Ivana Bačić, Eva Klarić, Flavio Uribe, and Senka Meštrović. 2024. "Color and Chemical Stability of 3D-Printed and Thermoformed Polyurethane-Based Aligners" Polymers 16, no. 8: 1067. https://doi.org/10.3390/polym16081067
APA StyleŠimunović, L., Čekalović Agović, S., Marić, A. J., Bačić, I., Klarić, E., Uribe, F., & Meštrović, S. (2024). Color and Chemical Stability of 3D-Printed and Thermoformed Polyurethane-Based Aligners. Polymers, 16(8), 1067. https://doi.org/10.3390/polym16081067