Article

Response of Rice Algal Assemblage to Fertilizer and Chemical Application: Implications for Early Algal Bloom Management

1
Department of Plant Sciences, University of California, Davis, CA 95616, USA
2
USDA-ARS, Invasive Species and Pollinator Health Research Unit, Davis, CA 95616, USA
*
Author to whom correspondence should be addressed.
Agronomy 2021, 11(3), 542; https://doi.org/10.3390/agronomy11030542
Submission received: 12 February 2021 / Accepted: 9 March 2021 / Published: 13 March 2021
(This article belongs to the Section Pest and Disease Management)

Abstract

:
California water-seeded rice is challenged with the rapid growth of nuisance algae at the beginning of the season. Rice seedlings entangled in the algal mat may not be established, causing empty rice patches in the field. Two separate studies were conducted to (1) evaluate the effect of nutrients (nitrogen and phosphorous) on algae growth, and (2) test various chemical options to control algae. Both studies utilized 19 L buckets inoculated with algae collected from a rice field. In the nutrient evaluation study, 36 nutrient treatments obtained from a combination of nitrogen (0, 60, 120, 180, 240 and 300 kg ha−1) and phosphorous (0, 20, 40, 60, 80 and 100 kg ha−1) rates were applied into the buckets, while eight chemicals with potential for algae control (two Protox inhibitor herbicides, four copper-based compounds, hydrogen peroxide, Zinc sulfate) were tested in the second experiment. In addition, a yeast extract-based surfactant (AMP activator) was tested in combination with a chelated copper formulation (Algimycin) and hydrogen peroxide. The studies had a completely randomized design with three replicates and each study was repeated two times. The result from the nutrient evaluation study showed that nitrogen and phosphorus can independently cause change in algae growth as reflected in the fresh and dry biomass. Moreover, low rates of either nitrogen or phosphorus resulted in a rapid increase in algae biomass and water chlorophyll a content, whereas the growth of algae declined at higher rates of applied fertilizer. Among tested chemicals in the second experiment, the chelated formulation of copper (Algimycin PWF) controlled algae (85%) better than the ethanolamine formulations [Cutrine-Ultra (70%) and Cutrine-Plus (52%)] and elemental copper (crystalline copper sulfate) (75%). Protox herbicides (oxyfluorfen and oxadiazon) were able to control algae by up to 70%. Hydrogen peroxide controlled algae by 50% and its efficacy dropped dramatically five days after treatment (DAT). Zinc sulfate was only effective at 1 DAT and algae recovered rapidly after that. Combining fertilizer management practices with chemical options will enable us toward an integrative approach for early algal bloom in the rice cropping system.

1. Introduction

California is the second largest rice producer in the U.S., and almost 90% of medium-grain rice and 98% of short-grain rice in the U.S. are produced there [1]. Rice is predominantly grown in more than 200,000 hectares [1]. A water-seeded system for growing rice is used in California, where imbibed rice seeds are spread aerially into pre-flooded fields. This specialized, unique rice growing system can lead to the production of up to 12 metric tons of rice per hectare [1].
In California, rice is grown as a monoculture and all the cultivating activities are specialized accordingly. Rice fields are leveled to zero or no slope with permanent wide levees, allowing maintenance of a uniform water depth in large basins [2]. Once the field is prepared, a corrugated roller is used to eliminate large clods, pack the soil and more importantly provide a uniform surface for even distribution of rice seeds. It may take approximately two days to a week for a whole field to be flooded and the water level is maintained (2.5–20 cm) for most of the season from this time to prior to harvest [3].
Green algae, cyanobacteria and diatoms are the predominant microphytes coexisting with rice at the wet phase of the rice growing season [4]. The algae community usually builds up once the field is being flooded and may thrive until the field is drained [4]. Although algal communities are ephemeral, they can exert both positive and negative impacts on rice production. There is an extensive body of literature on the nitrogen (N)-fixing capacity of algae species, specifically cyanobacteria, suggesting positive effects of algal communities on rice production [5]. In regions where nitrogen is a limiting factor for rice production, inoculation of cyanobacteria is often suggested to enhance soil fertility and rice grain yield [6,7]. However, propagation of enough inoculum and its uniform distribution are difficult, hence limiting this fertilizer management practice to only small-scale applications [8,9]. Furthermore, the nitrogen fixed by cyanobacteria cannot alleviate all rice nitrogen requirements and only provides a fraction of rice needed for commercial yields [10].
On the negative side, the early occurrence of algae can hinder rice (seedling) growth especially in water-seeded rice systems. In this system, fertilizers (nitrogen and phosphorous) are typically applied pre-plant directly to the soil surface or are minimally incorporated [2]. Once the field is flooded, an algae mat starts to develop even prior to spreading the rice seeds and therefore rice seedling establishment can be disrupted [4]. Algal mats can ultimately reduce rice yield by either entrapping or uprooting rice seedlings or, in the case of large thick mats, preventing the emergence of the rice seedlings through the mat [4].
It has been suggested that rapid growth of nuisance algae has been widely associated with an excess of nutrients, mainly phosphorus and to a lesser extent nitrogen, available in the water. Most algal blooming species, including cyanobacteria, have been described as phosphorus limited [11]. The reason is that blooming algae species are able to fix atmospheric nitrogen and thus their growth should be limited only by the amount of available phosphorus [12]. Therefore, reducing the phosphorus input into the water has traditionally been proposed for algae management [13]. However, not all algae species are able to fix atmospheric nitrogen and there are several cases in which the availability of nitrogen alone or in proportion to phosphorus can induce the rapid growth of algae. For example, prevention of phosphorus input into Lake Erie was associated with the decline in phosphophilous algae species and the increase in the population of nitrophilic ones [14].
Current nutrient management in the water-seeded rice has mainly focused on reducing the availability of phosphorus to algae, by changing the time of phosphorus application in order to mitigate algal bloom. A study by Lundy et al. [13] showed that the delay in phosphorus application (up to 35 days after seeding) decreased algae growth. However, postponing phosphorus application may affect the early growth and vigor of rice seedlings [15]. In addition, any changes in the amount and type of fertilizer application can change the algal profile in a system [14], and therefore such phosphorous management techniques may be less effective if the blooming species profile changes over time. However, the rice algal community response to the amount of phosphorous (i.e., low vs. high) or presence of nitrogen is not well understood.
Another common method of algae control in California rice is the application of copper sulfate in the form of elemental copper sulfate, or “blue stone” [16]. Copper sulfate is applied aerially at the time of or after rice seeding (i.e., within the first 30 days after flooding) [17]. However, this conventional method fails to provide satisfactory results perhaps because the method of application is suboptimal, there has been selection of algae species that have innate tolerance to copper, and dissolved copper ions are rapidly bound by substances in the water, or any combination thereof [18]. Therefore, alternative chemical options are required to manage nuisance algal bloom in the rice cropping system.
The objectives of this study were: (1) to determine how algae assemblage responds to the amount of available phosphorus and nitrogen separately and in combination, and (2) to test the efficacy of algaecides and common rice herbicides for their potential algaecide activity. Knowledge of algal responses to the amount of nutrient would enable us to develop and extend the nutrient management program for controlling nuisance algal bloom in California rice cropping systems. Incorporation of nutrient management with suitable algaecide options may increase the algae-free period and provide adequate time for rice seedlings to establish.

2. Materials and Methods

Two separate studies were conducted at the Rice Experiment Station, Biggs, California (39°27′8.0964″ N, 121°43′14.6532″ W) during the rice growing season (August–October 2018). The first study evaluated the effect of nitrogen and phosphorus application rate on algae growth, while the second study evaluated chemical options for controlling the algae. Each study was replicated two times (i.e., Run). Both studies utilized buckets (19 L) filled with 11 L of water. The water height in buckets was maintained at 15 cm, which is within the range of standing water in the California rice production system. The water temperature was also recorded hourly using the ONSET® HOBO® (Onset Computer Corporation, Bourne, MA, USA) temperature data logger (Figure 1). Algae samples were collected from the rice field near the study site and the buckets were inoculated with approximately 10 g of fresh algae. Subsamples of algae were collected (preserved in 0.25% glutaraldehyde) from the field near the experiment site and the buckets for species identification to ensure the similarity in the algae profile. Algae species identification was performed by PhycoTech Inc. (St. Joseph, MI, USA).

2.1. Nutrient Evaluation Study

Buckets, already inoculated with algae, received nitrogen application rates corresponding to 0, 60, 120, 180, 240 and 300 kg ha−1 in combination with phosphorus amounts of 0, 20, 40, 60, 80 and 100 kg ha−1 (total of 36 treatments). Nitrogen and phosphorus were applied in the form of urea (46-0-0) and triple super phosphate (0-44-0), respectively. The above N and P application rates were chosen as they cover the whole range of rice fertilizer requirements [19]. Under field conditions, these fertilizers are usually applied pre-plant as a single application at the beginning of the season or in a split application, where approximately 70% is used pre-plant while the rest is applied as a starter or top-dress [19]. Water samples (50 mL) were collected from each bucket at two- to three-day intervals. The water samples were stored at fridge (3 °C) at dark before measuring chlorophyll a content, and the total fresh and dry biomass of algae. At the end of the experiment, all the water in the bucket was filtered through a 20 µm mesh sieve (fisher scientific®) to measure total algae fresh and dry biomass. To remove the remaining water from filtered algae, the samples were centrifuged for 4 min at 5000 rpm. The pelleted algae were weighted for fresh biomass determination and dried at 70 °C to obtain the dry biomass. The in vivo chlorophyll a content measurement (i.e., directly from the water sample collected) was carried out using a handheld chlorophyll meter, AquaFluor® Turner Designs.

2.2. Algaecide Evaluation Study

We used the same bucket system as described above to test 10 chemicals with potential algaecide efficacy and how they compared with untreated control (Table 1). All treatments received N and P fertilizers corresponding to field application rates for rice (120 kg N ha−1 and 60 kg P ha−1). The buckets were inoculated with 10 g of fresh algae and we allowed the algae to grow for seven days (run 1) or 14 days (run 2) prior to the application of algaecide or herbicides. Water samples (50 mL) were collected before the algaecide treatment (0) and 1, 3 and 7 days after algaecide/herbicide treatment (DAT) in both experiments. At 15 days after algaecide treatment, the fresh and dry biomass of algae were determined by separating algae from the whole bucket as explained above. Data on fresh and dry biomass and chlorophyll a content were obtained over the course of experiments as per the nutrient study.

2.3. Data Analysis

For fertilizer evaluation study, the cumulative amount of fresh and dry biomass was calculated from the sum of all sampled biomass over time and used for the data analysis, whereas the mean water chlorophyll a content overtime was used for analysis. The experiment was conducted as a completely randomized design with three replicates and the whole experiment was repeated (i.e., two runs). All the data were analyzed in SAS 9.4 using the Proc GLM procedure. When experimental run by treatment effect was significant, we used the SLICE feature of Proc GLM to study the interaction. Comparisons of treatment means were performed using the LSMeans statement of Proc GLM.
In the algaecide evaluation study, the percentage of algae control was calculated as
x = ( B c B t B c ) × 100 .
where Bc is the average biomass (fresh or dry) of the untreated control and Bt is the avarage biomass in the treated bucket [20]. The experiment was set as a completely randomized design with four replicates and the experiment was repeated once. All the data were analyzed in SAS 9.4 using the PROC GLM procedure as explained above for the cumulative fresh and dry biomass and chlorophyll a content. To determine whether there is a significant change in the amount of biomass (fresh and dry) and chlorophyll a content over time, the repeated procedure of PROC GLM was added to the model for a repeated measurement analysis.

3. Results and Discussion

3.1. Nutrient Evaluation Study

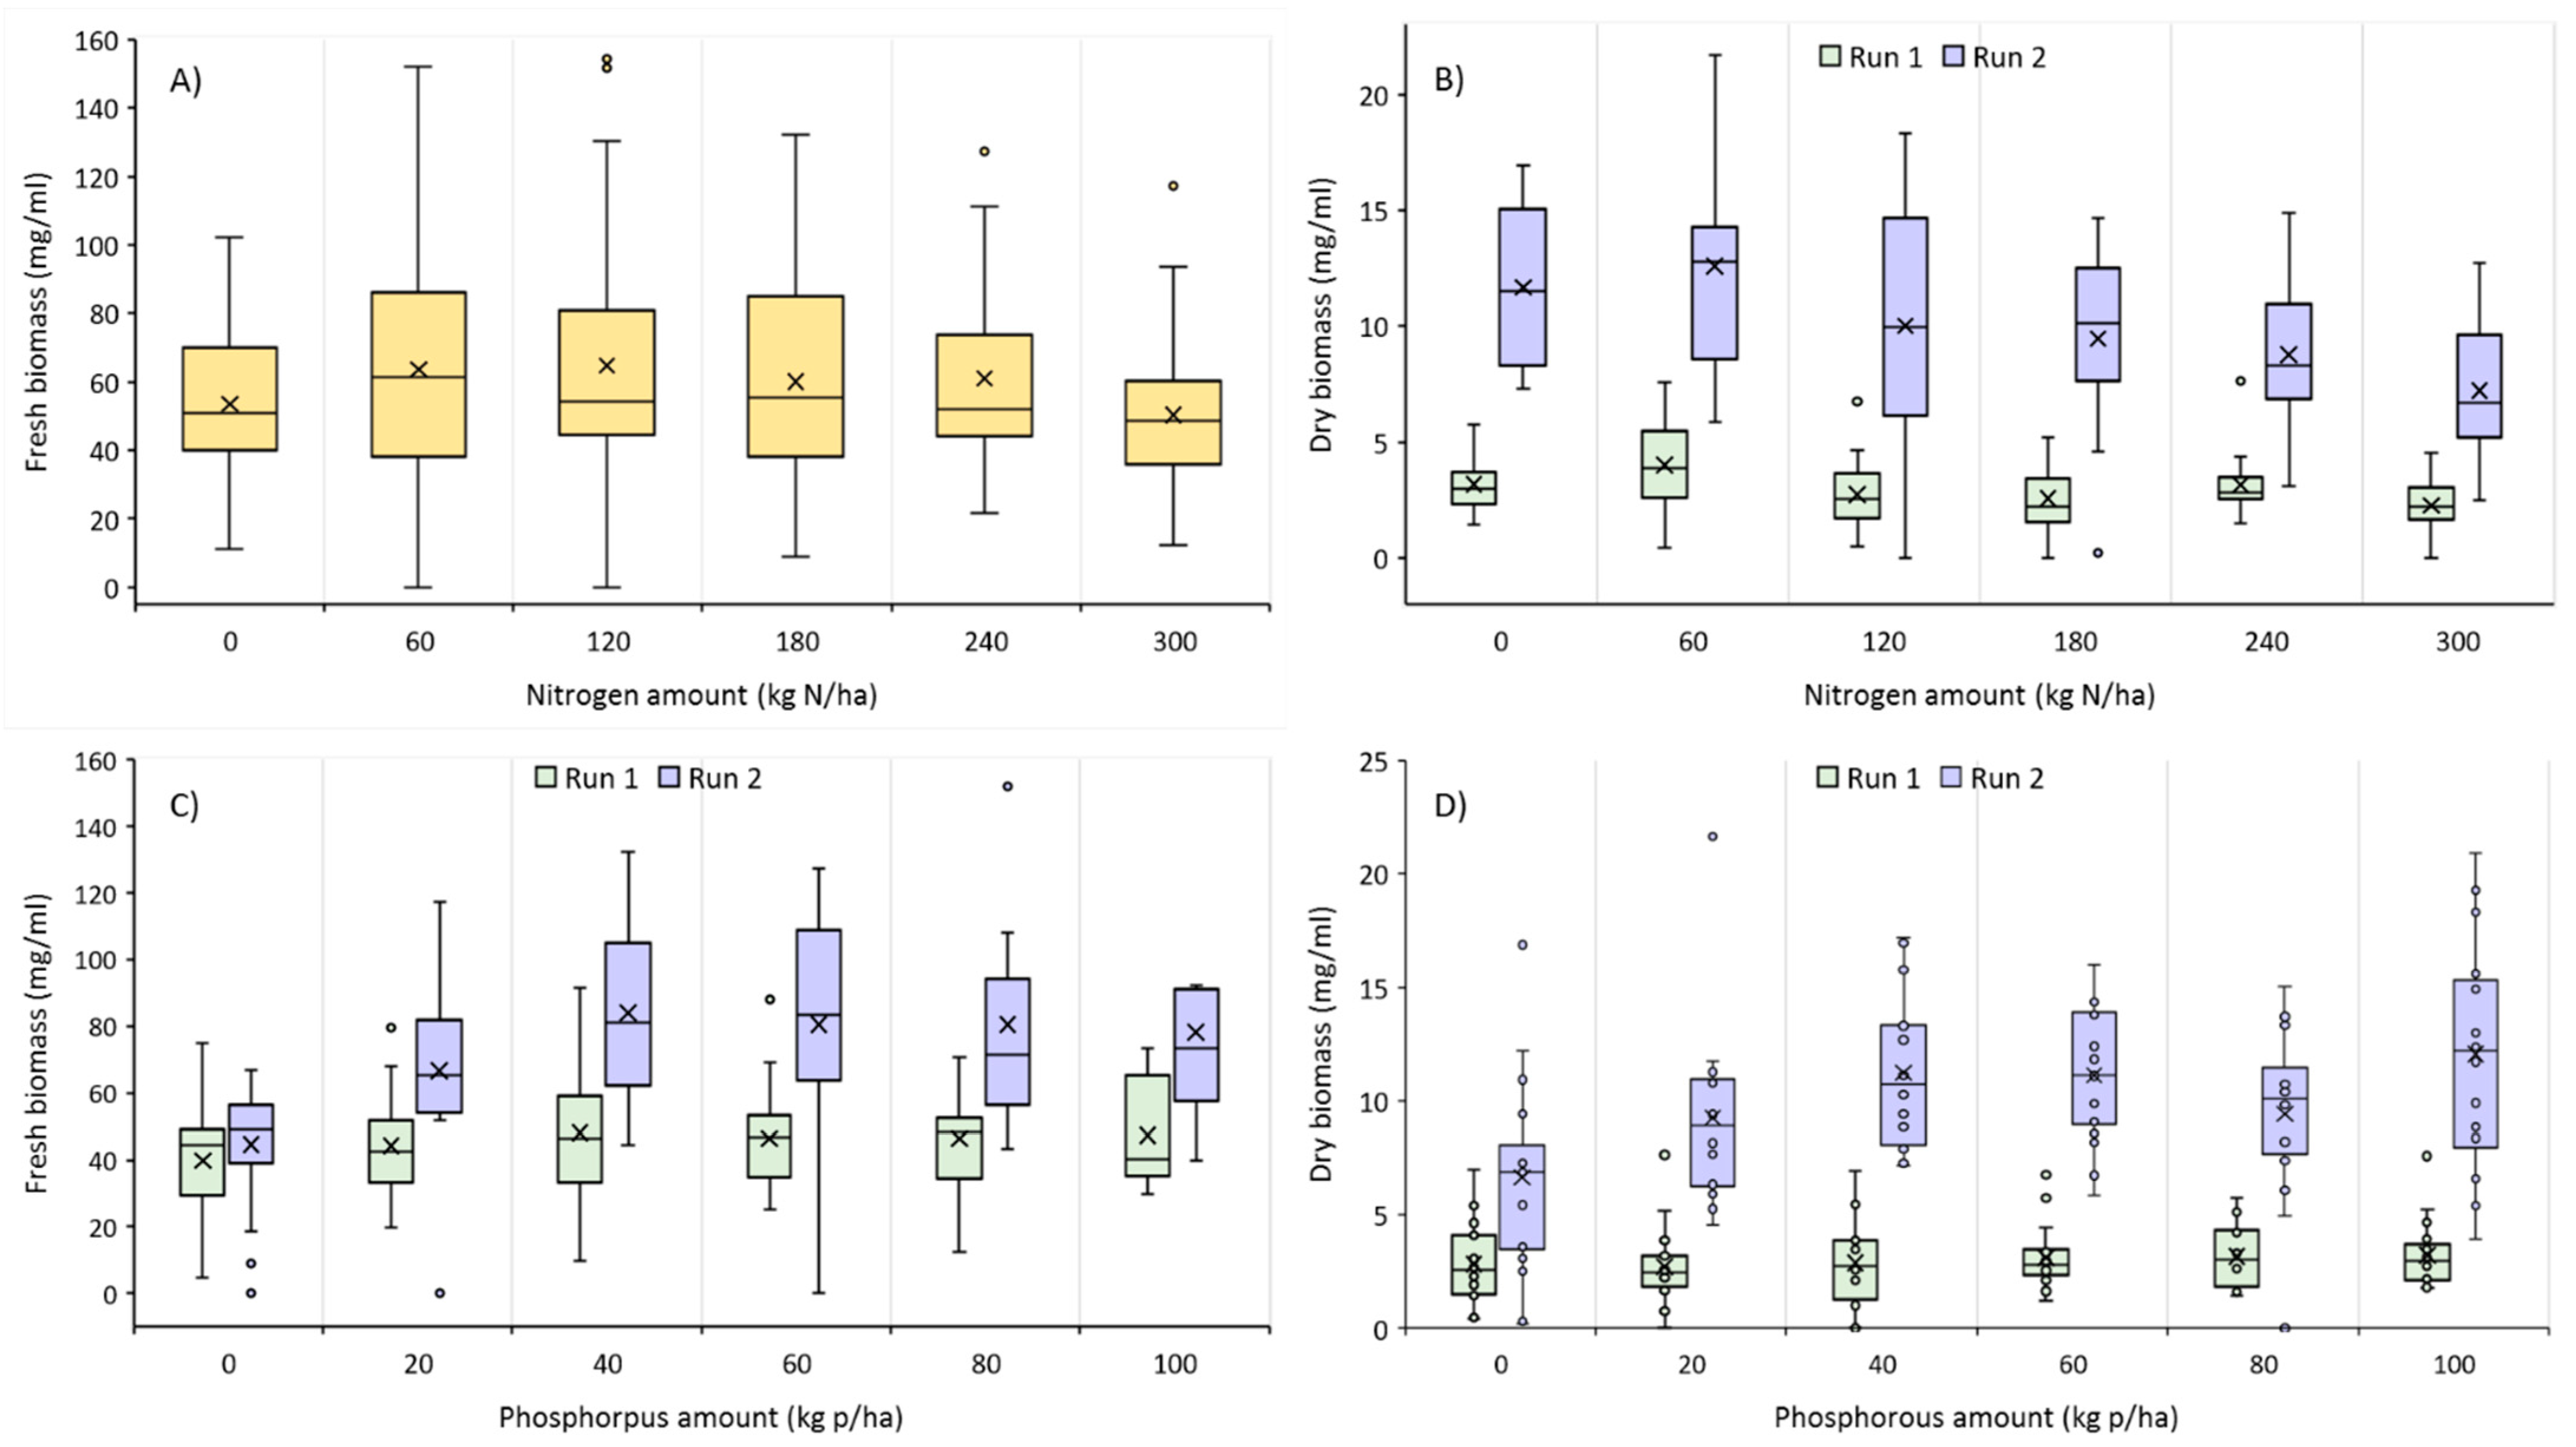
Because of a significant experimental run by treatment interaction, perhaps because of the experiment environmental temperature (Figure 1), analysis was carried out on each of the runs separately except for the effect of nitrogen on fresh biomass (Table 2, Figure 2). There was no significant interaction between the amount of nitrogen and phosphorous on the fresh and dry biomass of the algae while chlorophyll a content was influenced by the interaction of both nutrients (Table 2). Both the fresh and dry biomass of the algae increased with the addition of nitrogen in the buckets (Figure 2A,B). The highest amounts of fresh and dry biomass were obtained when the nitrogen was applied at 60 kg N ha−1. Increasing the concentration of nitrogen above 60 kg N ha−1 did not affect the fresh and dry biomass accumulation of algae but rather caused a slight reduction. A similar rate response pattern was observed with the phosphorus application. Fresh and dry algae biomass reached the highest levels when phosphorus was applied at 40 or 60 kg P ha−1 (Figure 2C,D) and then decreased at higher rates. It seems that an increase in N and P initially favors the growth of algae but further proliferation of the algae in the buckets intensifies the competition for space, limiting algal growth. The algae growth rate is mostly reflected by the number of cells in unit of water or species biovolume [21]. However, no enumeration of cell number or their biovolume was conducted in this study.
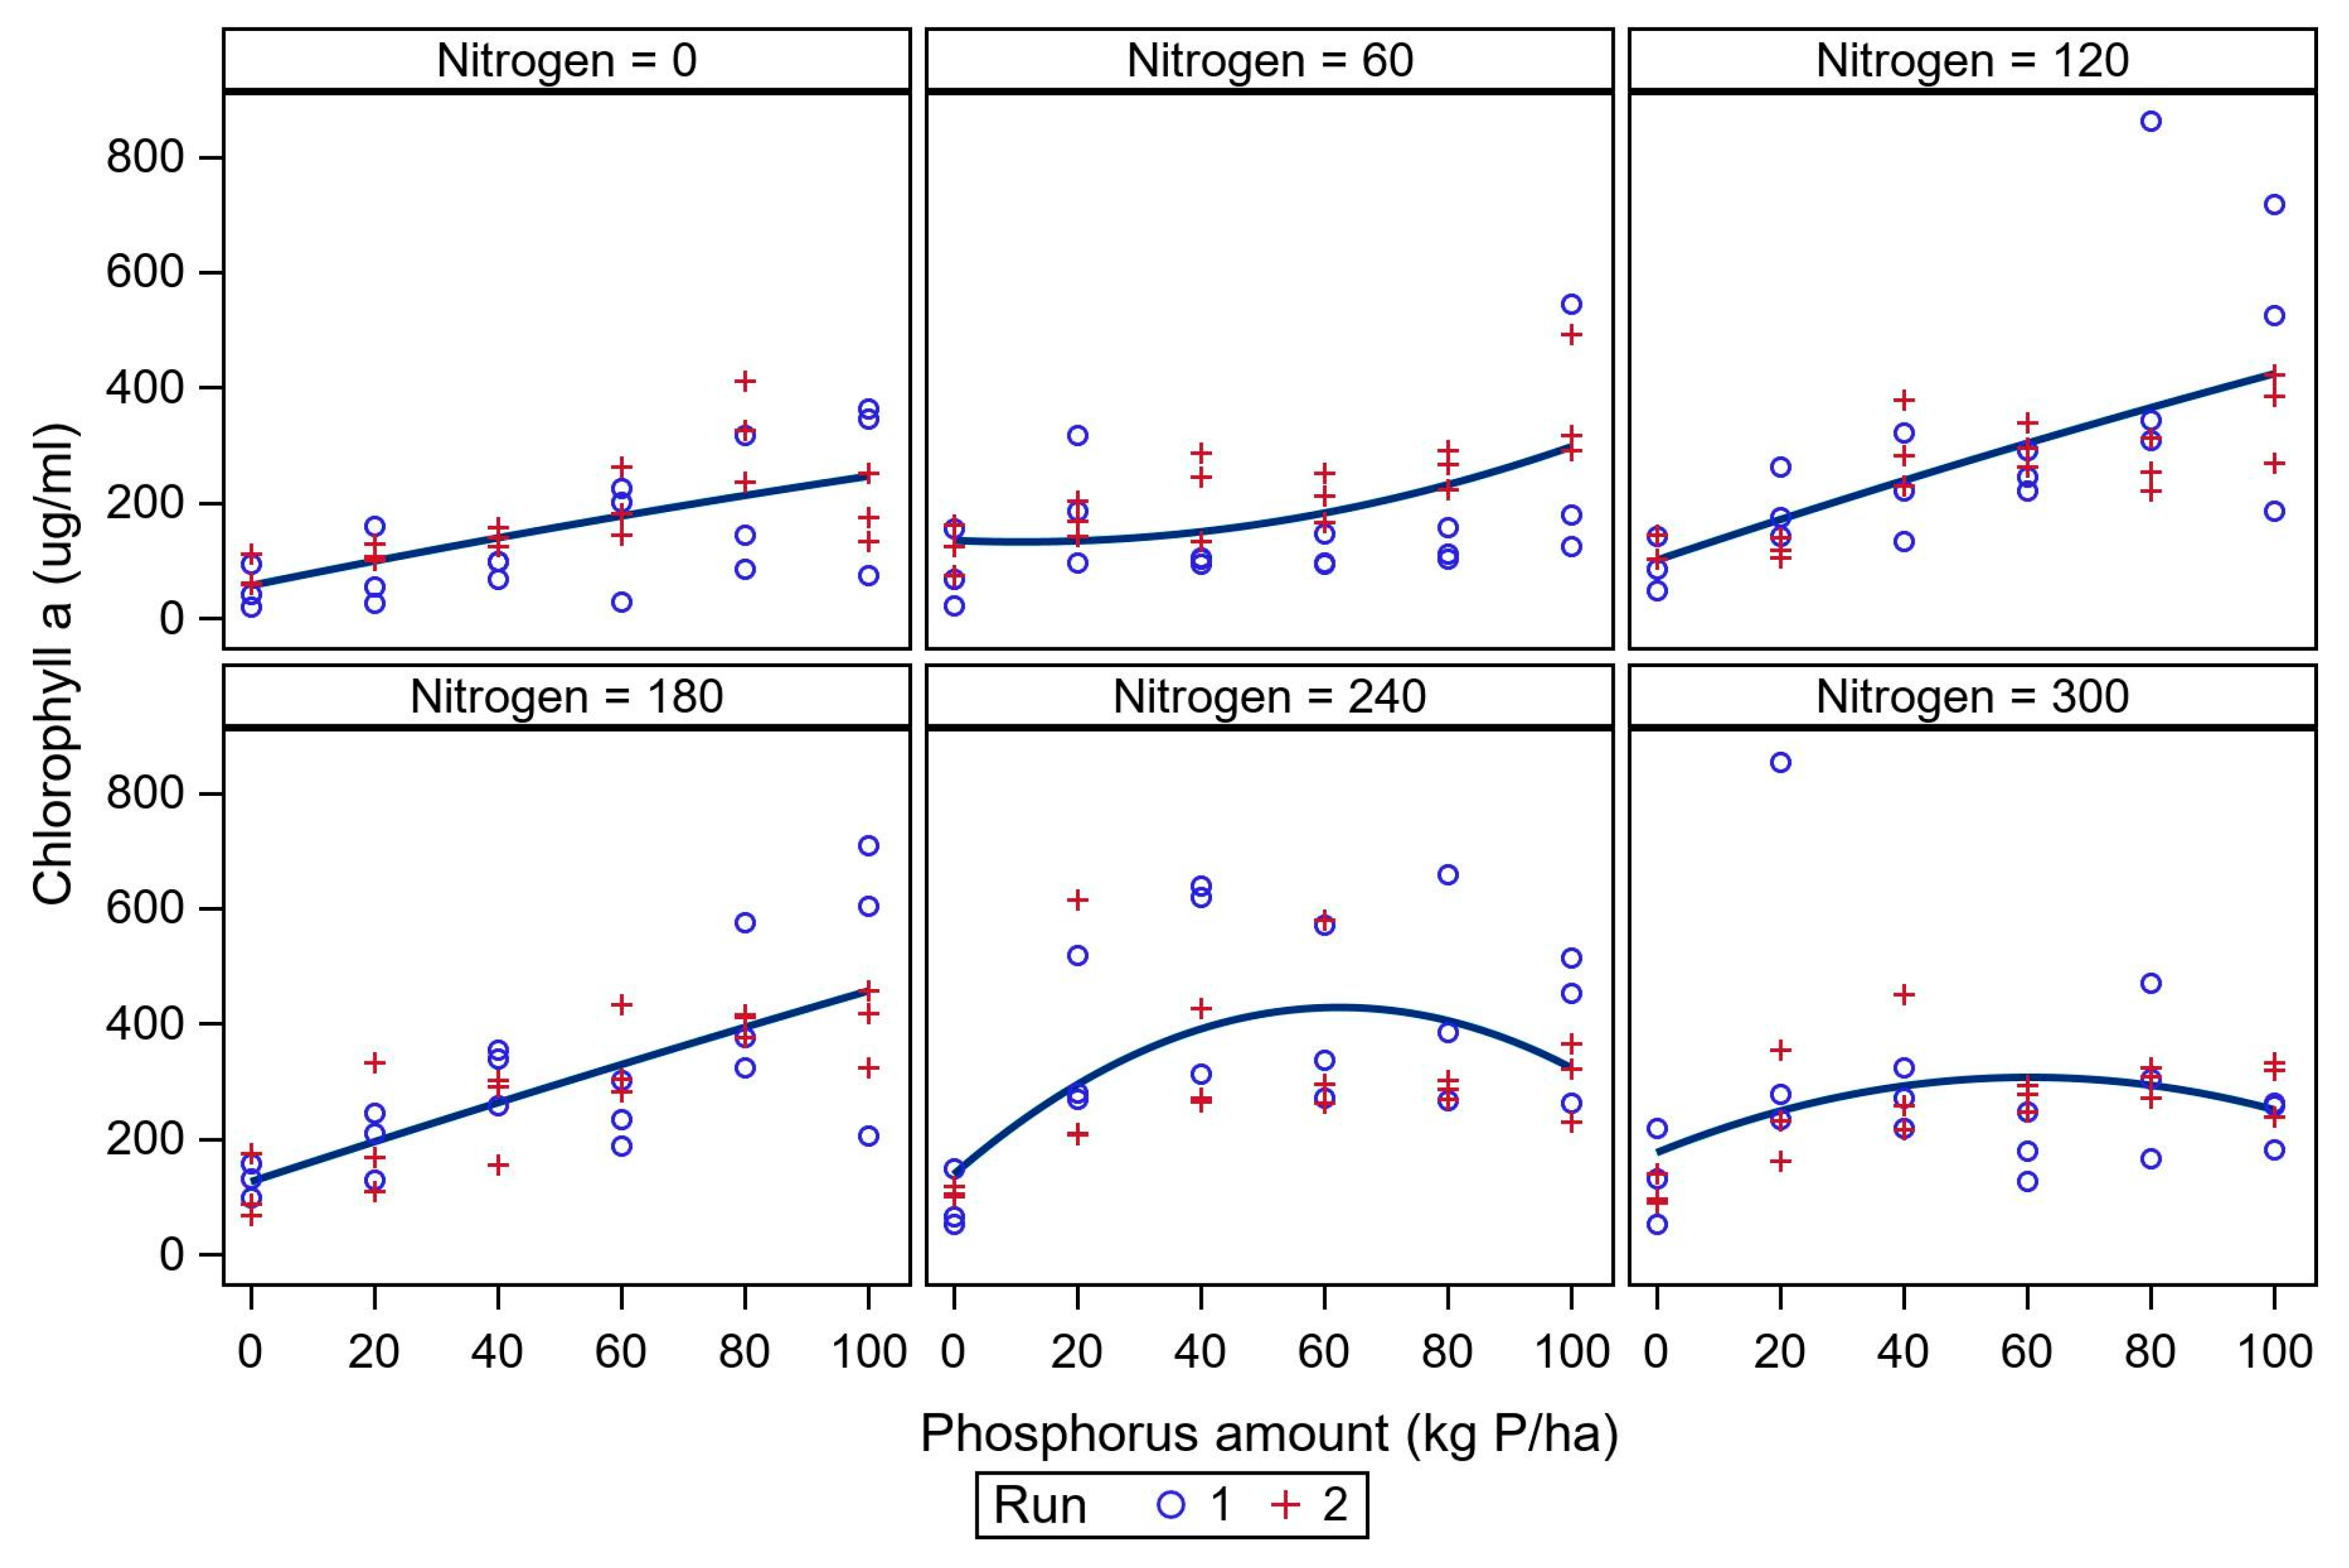
Another explanation for the decline in algae growth at higher rates of N and P could be due to the N:P ratio. There seems to be an optimal N:P ratio for growth of algae; however, it has a very wide range (N:P of 8 and 45); and varies with species [22]. When the N:P ratio is above the optimum value, algae growth is P limited, and it is N limited when the ratio is less than optimum [22]. In our study the N:P ratio ranged from 0 (i.e., absence of either N or P) to 15 (300 N kg ha−1: 20 P kg ha−1). When the applied P was low (i.e., N:P ratio < 3), chlorophyll a content was at minimum. By increasing the amount of P, chlorophyll a content increased, while the N:P ratio was smaller (Figure 3).
In contrast to the biomass, chlorophyll a content was affected by the interaction of nitrogen and phosphorus (Table 3, Figure 3). Increasing the phosphorus rate resulted in a linear increase in chlorophyll a content at all the nitrogen levels except at 240 and 300 kg N ha−1. When N was applied at 240 or 300 kg ha−1, chlorophyll a content increased with P application rates up to 60 kg ha−1 but then showed a declining trend, suggesting an inhibitory effect of high amounts of these nutrients on the growth of the algae.
Given that nitrogen and phosphorous requirements are species specific, our ratio of fertilizer application might have favored a certain group of algae species. In a subsample collected from the rice field, we found more than 34 million algae cells per milliliter of water comprising 28 genus/species (three diatoms, 15 green algae and 10 Cyanobacteria) (Table 4), whereas the subsample taken during the experiment contained fewer algae cells (>18,000,000 cells/mL), with only eight species (6 green algae and 2 Cyanobacteria). Therefore, knowledge on algae composition and diversity in rice would be helpful for utilizing proper nutrient management for algae control in rice.
The rates of fertilizers used in this experiment were in the spectrum of the rates applied for rice. In California, N is mostly injected in the form of liquid (known as Aqua) before planting, while P is either minimally incorporated into the soil (pre-plant) or spread aerially later in the season (up to 30 days after seeding) as ammonium phosphate (i.e., low N:P ratio). Both methods of application increase the P concentration early in the season, which could be conducive to algae growth rather than rice growth [13]. Our study suggested that algae species in rice are more P limited, therefore decreasing the P available for algae might decrease its nuisance growth. The delayed application of P has been shown to reduce the extent of algal bloom [13]. However, this method is only practical when the field is not P deficient. Further, P deficiency may affect the early growth and vigor of rice seedlings [15]. Another method that may help with the management of algae is the split application of P and N, wherein fertilizers are applied in the early season at a low rate (⅓ of the total) and the rest can be applied once rice seedlings are established [23]. However, this method yet to be tested.

3.2. Algaecide Evaluation Study

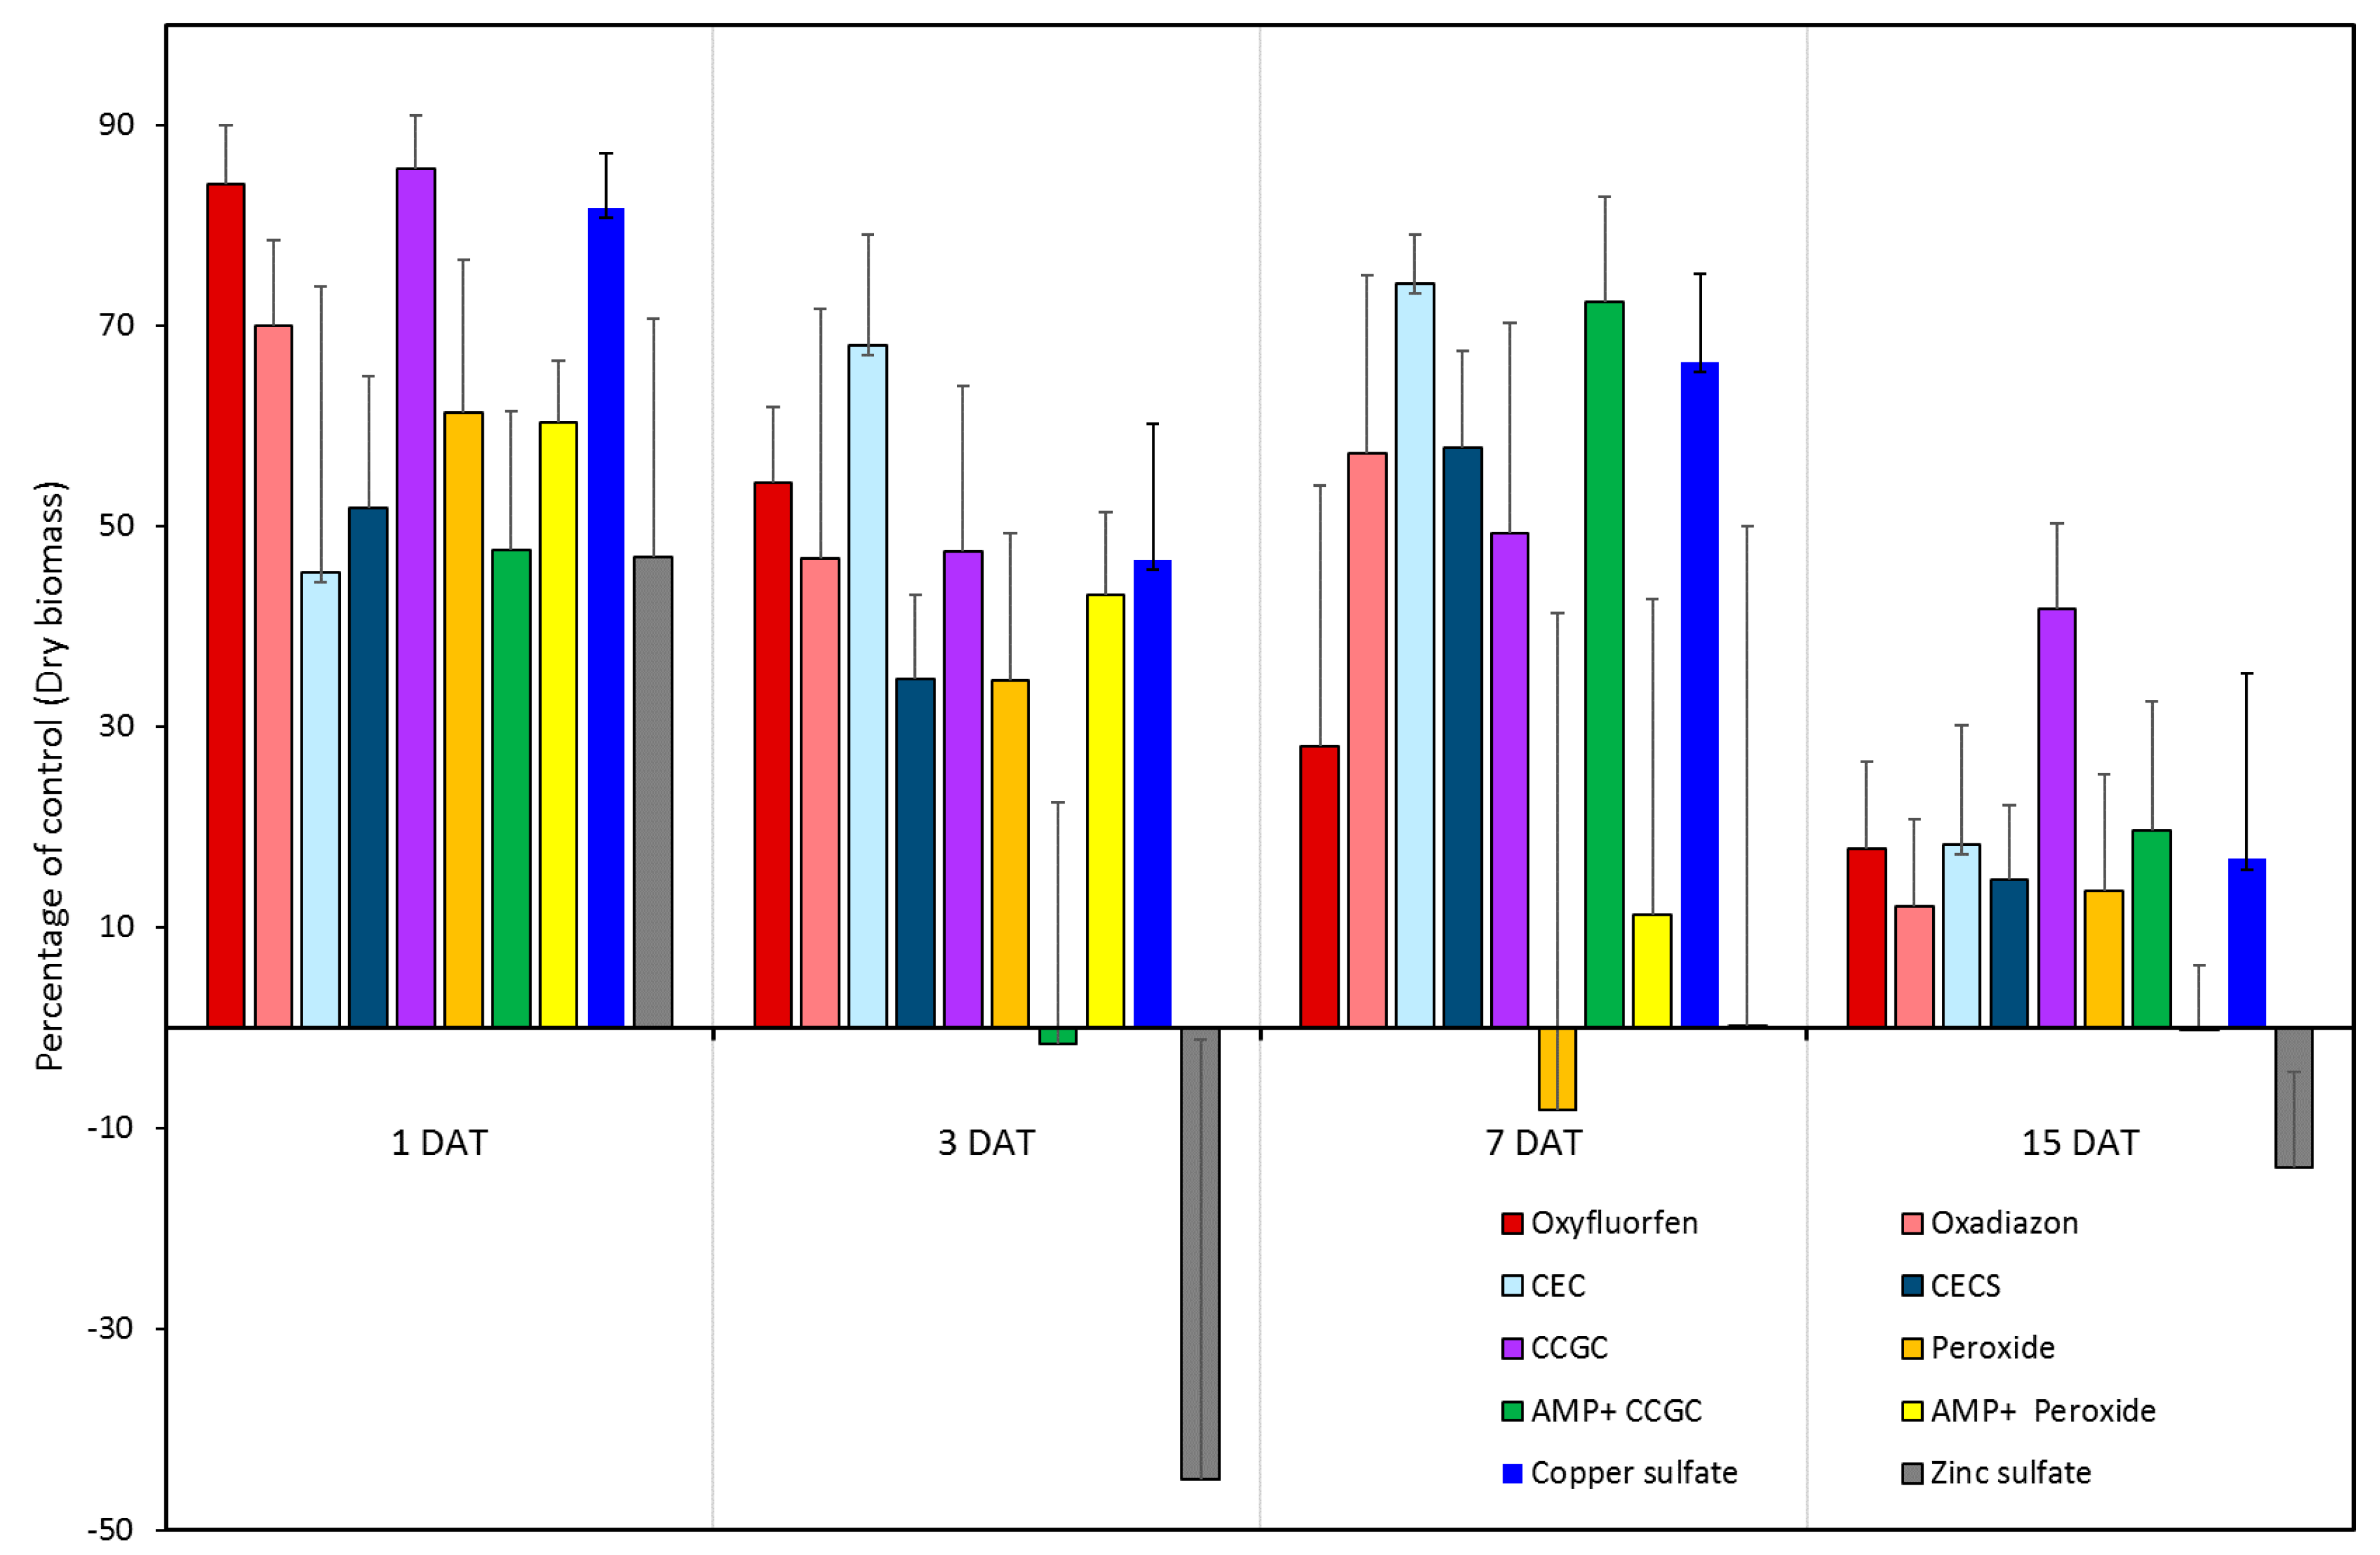
Since there were no significant interactions between experimental run and treatment, the data were pooled. All of the applied chemicals provided some level of algae control one day after treatment (1 DAT) (Figure 4) but the efficacy dropped towards the end of the experiment (15 DAT), suggesting that algae were able to recover from the chemical treatment.
At 1 DAT, the percentage of algae control based on fresh biomass was greatest with oxyfluorfen (39%), followed by CCGC (38%) (data not shown). CEC and CCGC showed the greatest reduction in algae fresh biomass at 3 DAT, while CECS and CCGC had greater fresh biomass control at 7 DAT. At 3 DAT and 7 DAT, AMP+ CCGC, AMP+ peroxide and zinc sulfate showed the lowest reduction in algae fresh biomass (data not shown). The algal fresh biomass reduction by CCGC treatment remained at the highest level even 15 days after algaecide treatment, while algae seemed to have recovered from AMP+ peroxide and zinc sulfate treatment 15 DAT (data not shown).
Algae dry biomass showed a similar response to chemicals as observed with algae fresh biomass (Figure 4). At 1 DAT, the greatest dry biomass reductions were observed with CCGC (85.56% control) followed by oxyfluorfen (84.07% control) (Figure 4). At 3 and 7 DAT, CECS had the highest algae control, while zinc sulfate treatment had almost no control (Figure 4). The control of algae declined for all the applied chemicals two weeks after treatment (15DAT). However, CCGC seemed to remain active even two weeks after treatment and had approximately 40% of algae control.
In general, all the tested chemicals had potential for algal control in the rice field. The most commonly used chemical for controlling algae in California rice is elemental copper sulfate. The maximum amount of copper that is allowed to be applied is approximately 1 ppm. All the tested copper-based algaecides (CEC, CECS and CCGC) contained the same amount of copper but differed in their formulation. Among copper-based algaecides, the chelated form of copper, CCGC, was more effective for controlling algae than the ethanolamine forms (CEC and CECS). In addition, CCGC can control the algae for a longer period of time compared to the rest of the copper-based chemicals. However, when CCGC is applied with AMP, its control level dropped by 50% (Figure 4).
Peroxide might be a better option for algae control due to its rapid degradation rate and lower environmental impacts compared to copper sulfate [21]. However, its efficacy can be limited depending on the algae species [15]. In this study, peroxide controlled algae moderately and its control level dropped rapidly over a week after application. Adding AMP did not improve the control level provided by peroxide, but conversely reduced its performance.
Physiological similarities between algae species and plants may encourage the use of herbicides as a dual-purpose product. The inhibiting protoporphyrinogen oxidase enzyme (Protox inhibitors) herbicide, carfentrazone (Shark), has previously been shown to control algae [24]. Although carfentrazone can be used in rice, it is not very popular as it can injure rice and has a narrow weed control spectrum [25]. Introduction of a new herbicide-resistant rice, oxyfluorfen-resistant rice [26], however, could provide an opportunity to control algae through the application of Protox herbicides.
Zinc sulfate, another chemical tested for algaecide activity in this study, has been shown by Spencer and Lembi [24] to reduce the dry biomass (up to 50%) of algae at 48 h after treatment when applied at 20 ppm (50 lbs/acer). Similar to Spencer and Lembi [24], we found that the application of zinc sulfate can reduce the biomass of algae. In contrast to Spencer and Lembi [24], we observed that it is only effective for one day. Since rice can benefit from zinc [27], zinc sulfate application may not only reduce the algae infestation but also help with rice growth. Zinc deficiency in rice can occur from early stages of leaf development and therefore it is applied prior to flooding to the soil surface [27]. In this experiment, zinc sulfate was applied directly to the water at the time of algae occurrence. Therefore, the zinc application method (i.e., soil vs. water) should be taken into account for its efficacy in controlling algae.

4. Conclusions

The results of our study showed that algae growth in rice can be stimulated with either nitrogen or phosphorus, or the combination of both fertilizers. When fertilizers are applied at the conventional field rate (60 kg P ha−1 and 150 kg N ha−1) at the beginning of the season, the growth of algae is inevitable. However, at low rates (⅓ of the field rate), algae growth could be limited or slowed, which may provide enough of a window of opportunity for rice establishment. The remaining ⅔ of fertilizer can then be applied after rice seedling establishment. This study also showed that Protox herbicides were the most effective chemical options for algae control. However, they could only be considered in a herbicide-resistant rice system. Elemental copper sulfate is the main chemical available for algae control in California rice, but its efficacy is temperamental. The chelated formulation of copper—here we tested CCGC (Algymicin)—was much more effective than its elemental and ethanolamine forms. Integration of fertilizer management with chemical control method would provide enough of a window of opportunity for rice seedling establishment. However, we did not test their combined effects in this study. The result of these studies still needs to be tested under real field conditions to develop integrative algae management in California rice.

Author Contributions

Conceptualization, S.O., J.M. and K.A.-K.; writing—original draft preparation, S.O.; writing—review and editing, S.O., A.G., J.M. and K.A.-K.; project administration, K.A.-K.; funding acquisition, J.M. and K.A.-K. All authors have read and agreed to the published version of the manuscript.

Funding

The funding for this project was provided by a grant from USDA ARS entitled Aquatic Weeds Associated with Agricultural Water supply NACA agreement 58-2030-7-039.

Institutional Review Board Statement

Not applicable.

Informed Consent Statement

Not applicable.

Data Availability Statement

Not applicable.

Acknowledgments

The authors acknowledge the Weed Science Program at University of California, Davis, California Cooperative Rice Research Foundation and Rice Experimental Station. The authors would like to thank Applied Biochemists for providing the algaecides for this study.

Conflicts of Interest

The authors declare no conflict of interest.

References

  1. McBride, W.D.; Skorbiansky, S.R.; Childs, N. US Rice Production in the New Millennium: Changes in Structure, Practices, and Costs. Econ. Res. Serv. Econ. Res. Bull. 2018, 1–62. [Google Scholar] [CrossRef] [Green Version]
  2. Hill, J.E.; Williams, J.; Mutters, R.; Greer, C. The California rice cropping system: Agronomic and natural resource issues for long-term sustainability. Paddy Water Environ. 2006, 4, 13–19. [Google Scholar] [CrossRef]
  3. Hill, J.E.; Brouder, S.M.; Roberts, S.R.; Williams, J.F.; Scardaci, S.C.; Wick, C.M. A survey of water management practices of California rice growers. J. Nat. Resour. Life Sci. Educ. 1994, 23, 119–124. [Google Scholar] [CrossRef]
  4. Spencer, D.F.; Lembi, C.A.; Blank, R. Spatial and Temporal Variation in the Composition and Biomass of Algae Present in Selected California Rice Fields. J. Freshwater Ecol. 2006, 21, 649–656. [Google Scholar] [CrossRef] [Green Version]
  5. Roger, P.A.; Reynaud, P.A. Ecology of Blue-Green Algae in Paddy Fields; International Rice Research Station Institute: Los Banos, Philipines, 1978; pp. 289–309. [Google Scholar]
  6. Ghosh, T.K.; Saha, K.C. Effects of inoculation with N2-fixing cyanobacteria on the nitrogenase activity in soil and rhizosphere of wetland rice (Oryza sativa L.). Biol. Fertil. Soils 1993, 16, 16–20. [Google Scholar] [CrossRef]
  7. Hashem, M.A. Problems and prospects of cyanobacterial biofertilizer for rice cultivation. Funct. Plant Biol. 2001, 8, 881–888. [Google Scholar] [CrossRef]
  8. Saha, K.C.; Mandal, L.N. A greenhouse study on the effect of inoculation of N-fixing blue-green algae in an alluvial soil treated with P and Mo on the yield of rice and changes in the N-content of soil. Plant Soil 1980, 57, 23–30. [Google Scholar] [CrossRef]
  9. Watanabe, I. Use of symbiotic and free-living blue-green algae in the rice culture. Outlook Agric. 1984, 13, 166–172. [Google Scholar] [CrossRef]
  10. Norman, R.J.; Wilson, C.E.; Slaton, A. Soil fertilization and mineral nutrition in US mechanized rice culture. In Rice: Origin, History, Technology and Production; John Wiley and Sons, Inc.: Hoboken, NJ, USA, 2002; pp. 331–412. [Google Scholar]
  11. Elser, J.J.; Marzolf, E.R.; Goldman, C.R. Phosphorus and nitrogen limitation of phytoplankton growth in the freshwaters of North America: A review and critique of experimental enrichments. Can. J. Fish Aquat. Sci. 1990, 47, 1468–1477. [Google Scholar] [CrossRef]
  12. Hecky, R.E.; Kilham, P. Nutrient limitation of phytoplankton in freshwater and marine environments: A review of recent evidence on the effects of enrichment. Limnol. Oceanogr. 1988, 33, 796–822. [Google Scholar] [CrossRef] [Green Version]
  13. Lundy, M.; Spencer, D.F.; Van Kessel, C.; Hill, J.; Linquist, B. Managing phosphorous fertilizer to reduce algae, maintain water quality, and sustain yields in water-seeded rice. Field Crops. Res. 2012, 131, 81–87. [Google Scholar] [CrossRef]
  14. Davis, T.W.; Bullerjahn, G.S.; Tuttle, T.; McKay, R.M.; Watson, S.B. Effects of increasing nitrogen and phosphorus concentrations on phytoplankton community growth and toxicity during Planktothrix blooms in Sandusky Bay, Lake Erie. Environ. Sci. Technol. 2015, 49, 7197–7207. [Google Scholar] [CrossRef]
  15. Julia, C.C.; Rose, T.J.; Pariasca-Tanaka, J.; Jeong, K.; Matsuda, T.; Wissuwa, M. Phosphorus uptake commences at the earliest stages of seedling development in rice. J. Exp. Bot. 2018, 69, 5233–5240. [Google Scholar] [CrossRef]
  16. Netherlands, M. Chemical control of aquatic weeds. In Biology and Control of Aquatic Plants: A Best Management Practices Handbook; Marietta, G.A., Ed.; Aquatic Ecosystem Restoration Foundation: Flint, MI, USA, 2014; pp. 71–88. [Google Scholar]
  17. Spencer, D.F.; Liow, P.S.; Lembi, C.A. Effect of a combination of two rice herbicides on the Caynobacterium, Nostoc. spongieforme. J. Aquat. Plant Manag. 2009, 47, 145–147. [Google Scholar]
  18. Spencer, D.F.; Liow, P.; Lembi, C.A. Influence of a non-copper algaecide on the cyanobacterium, Nostoc spongiaeforme, and the green alga, Hydrodictyon reticulatum, in field and laboratory experiments. Paddy Water Environ. 2013, 11, 611–617. [Google Scholar] [CrossRef]
  19. Mutters, R.G.; Greer, C.A.; Horwath, W.R. Rice Nutrient Management in California; University of California, Agriculture and Natural Resources: Berkeley, CA, USA, 2010; Publication 3516. [Google Scholar]
  20. Calomeni, A.J.; Kinley, C.M.; Geer, T.D.; Hendrikse, M.; Rodgers, J.H., Jr. Lyngbya wollei responses to copper algaecide exposures predicted using a concentration-exposure time (CET) model: Influence of initial biomass. J. Aquat. Plant Manag. 2018, 56, 73–83. [Google Scholar]
  21. Calomeni, A.J.; Geer, T.D.; Iwinski, K.J.; Rodgers, J.H.; Madsen, J.D.; Wersal, R.M. Monitoring for national pollutant discharge elimination system permit Requirements: Algaecides. J. Integr. Pest Manag. 2017, 27, 1–9. [Google Scholar] [CrossRef]
  22. Klausmeier, C.A.; Litchman, E.; Daufresne, T.; Levin, S.A. Optimal nitrogen-to-phosphorus stoichiometry of phytoplankton. Nature 2004, 429, 171–174. [Google Scholar] [CrossRef]
  23. Linquist, B.; Sengxua, P. Efficient and flexible management of nitrogen for rain fed lowland rice. Nutr. Cycl. Agroecosyst. 2003, 67, 107–115. [Google Scholar] [CrossRef]
  24. Spencer, D.F.; Lembi, C.A. Evaluation of Additional Alternative Methods for Managing Algae in California Rice Fields. Annual Report Comprehensive Research on Rice; California Rice Research Board: Biggs, CA, USA, 2006. [Google Scholar]
  25. Montgomery, G.B.; Bond, J.A.; Golden, B.R.; Gore, J.; Edwards, H.M.; Eubank, T.W.; Walker, T.W. Response of commercial rice cultivars to postemergence applications of saflufenacil. Weed Technol. 2014, 28, 679–684. [Google Scholar] [CrossRef]
  26. McKenzie, K.S. Oxyfluorfen Resistant Rice Lines. U.S. Patent Application 20180070548, 22 March 2018. [Google Scholar]
  27. Mikkelson, D.S. Zinc deficiency in California rice. Calif. Agric. 1975, 29, 8–9. [Google Scholar]
Figure 1. Changes in the water temperature (°C) during the course of nutrient (A) and chemical (B) evaluation studies. Run 1 and Run 2 indicate temperature fluctuations per experimental runs. Arrows indicate the time of chemical applications in the first (Run 1) and second (Run 2) run.
Agronomy 11 00542 g001
Figure 2. Changes in fresh and dry biomass of algae against various levels of nitrogen (A,B) and phosphorous (C,D).
Agronomy 11 00542 g002
Figure 3. Changes in water chlorophyll a content relative to the amount of nitrogen and phosphorous.
Agronomy 11 00542 g003
Figure 4. Changes in algal control percentage based on dry biomass relative to control measured at four different days after treatment (DAT).
Agronomy 11 00542 g004
Table 1. Herbicide and algaecide treatment details and their abbreviations in the manuscript.
TreatmentTrade NameApplication RateAbbreviation
No algaecide/herbicide ---
OxyfluorfenGoal® 2XL500 g ai ha−1oxyfluorfen
OxadiazonRonstar®50 WSP500 g ai ha−1oxadiazon
Copper ethanolamine complexCutrine®-Plus1 ppm CuCEC
Copper ethanolamine complex with surfactantCutrine®-Ultra1 ppm CuCECS
Chelated copper gluconate and citrateAlgimycin® PWF1 ppm CuCCGC
PeroxideLZA-peroxide30.8 mL ai ha−1peroxide
Yeast protein extract activator + CCGCAMP® activator + Algimycin® PWF1.3 mL ai ha−1 + 1 ppm CuAMP+ CCGC
Yeast protein extract activator+ peroxideAMP® activator + LZA-peroxide1.3 mL ai ha−1 + 30.8 mL ai ha−1AMP+ peroxide
Conventional copper sulfate-1 ppm Cucopper sulfate
Zinc sulfate-18 ppm Znzinc sulfate
Table 2. Analysis of variance for the effect of fertilizer application rates on total fresh biomass, total dry biomass and water chlorophyll a content.
Sources of VarianceFresh BiomassDry BiomassChlorophyll a Content
Mean SquarepMean SquarepMean Squarep
Experiment45,136.22<0.00012664.48<0.00012383.870.6693
Nitrogen1859.170.002155.72<0.0001155,278.87<0.0001
Phosphorous2965.55<0.000138.93<0.0001248,929.93<0.0001
Nitrogen × Phosphorous377.760.72597.800.199922,855.560.0215
Nitrogen × Experiment576.780.296020.470.007327,391.810.0681
Phosphorous × Experiment1402.830.013229.610.000414,451.500.3574
Phosphorus × Nitrogen × Experiment391.600.68758.490.127311,207.830.6570
Table 3. Parameters of the model fitted to the response of chlorophyll a content to phosphorous at different nitrogen levels. The fitted model was y = a + b P + c P 2 , where y is chlorophyll a content (µg/mL), P is the amount of phosphorous, a is the model intercept and b and c are the coefficients of the second-order polynomial model.
Nitrogen Amount
(kg N ha−1)
Model Parameters EstimateR2
a (SE)b (SE)c (SE)
056.15 (29.94)2.18 (1.41)−0.002 (0.01)0.41
60134.46 (35.80)−0.46 (1.68)0.02 (0.016)0.29
120100.13 (51.86)3.59 (2.36)−0.003 (0.022)0.43
180125.48 (34.44)3.51 (1.71)−0.002 (0.016)0.59
240138.02 (51.94)9.27968 (2.44)−0.07 (0.023)0.34
300175.92 (49.19)4.32 (2.31)−0.035 (0.022)0.11
Table 4. List of algae and Cyanobacteria genus/species identified in the rice field and nutrient study experiment.
DivisionClassOrderFamilySpeciesCell Concentration (Cell mL−1)
Adjacent rice field subsample
BacillariophytaBacillariophyceaeBacillaralesBacillariaceaeNitzschi palea178,592
N. gracillis847
NaviculalesStauoneidaceaeStauroneis phoenicenteron26
ChlorophytaChlorophyceaeChlorococcalesChlorococcaceaeChlorococcum spp.10,205.3
Tetraedron minimum5102.7
CoelastraceaeCoelastrum microporum13,550.7
HydrodictyaceaePediastrum duplex5102.6
OocystaceaeChlorella ellipsoidea17,527,526.9
Monoraphidium arcuatum30,615.7
M. griffithii15,307.8
ScenedesmaceaeDesmodesmus brasiliensis51,025.7
Scenedesmus acutus846.9
OedogonialesOedogoniaceaeOedogonium spp.383.4
VolvocalesVolvocaceaeVolvox spp.30,489.2
ChlamydomonadaceaeChlamydomonas spp.10,205.2
ZygnematalesDesmidiaceaeCosmarium spp.846.9
ZygnemataceaeMougeotia spp.1693.8
ChrysophytaChrysophyceaeChromalinalesChrysococcaceaeChrysococcus minutus10,205.2
CyanophytaCyanophyceaeChroococcalesChroococcaceaeSynechococcus elongatus535,775.9
Synechococcus spp.280,644.5
NostocalesNostocaceaeAnabaena spp.5,714,943.2
Cylindrospermum spp.796,009.9
Dolichospermum macrosporum469,441.7
D. planctonicum67,753.9
Komvophoron spp.76,539.4
Pseudanabaena galeata8,761,966.3
OscillatorialesOscillatoriaceaeLeptolyngbya subtilissima127,565.6
PleurocapsaceaPleurocapsaceaePleurocapsa minor61,231.5
Bucket algae subsample
ChlorophytaChlorophyceaeChlorococcalesOocystaceaeChlorella ellipsoidea17,527,526.9
Monoraphidium arcuatum30,615.7
M. griffithii15,307.8
ScenedesmaceaeDesmodesmus brasiliensis15,244.6
Scenedesmus acutus3387.6
VolvocalesChlamydomonadaceaeChlamydomonas spp.15,307.8
CyanophytaCyanophyceaeChroococcalesChroococcaceaeSynechococcus spp.612,315.3
NostocalesNostocaceaePseudanabaena galeata42,346.1
Publisher’s Note: MDPI stays neutral with regard to jurisdictional claims in published maps and institutional affiliations.