Article

Values for the Mechanical Properties of Wheat, Maize and Wood Pellets for Use in Silo Load Calculations Involving Numerical Methods

by
Manuel Moya
1,*,
David Sánchez
2 and
José Ramón Villar-García
1
1
Forest Research Group, Departamento de Ingeniería del Medio Agronómico y Forestal, Centro Universitario de Plasencia, Universidad de Extremadura, Avda. Virgen del Puerto 2, 10600 Plasencia, Cáceres, Spain
2
Centro Universitario de Plasencia, Universidad de Extremadura, Avda. Virgen del Puerto 2, 10600 Plasencia, Cáceres, Spain
*
Author to whom correspondence should be addressed.
Agronomy 2022, 12(6), 1261; https://doi.org/10.3390/agronomy12061261
Submission received: 21 April 2022 / Revised: 19 May 2022 / Accepted: 23 May 2022 / Published: 24 May 2022
(This article belongs to the Special Issue Selected Papers from 11th Iberian Agroengineering Congress)

Abstract

:
The mechanical properties of the materials stored in agricultural silos determine the loads they generate under static and dynamic conditions. The present work describes the mechanical properties of wheat, maize and wood pellets. Direct shear and triaxial assay devices, and oedometers (all commonly used in geotechnical assays), were used to determine these materials’ internal angle of friction, Poisson’s ratio, Young’s modulus, apparent specific weight, etc. The results for wheat and maize were similar to those previously reported by other authors. For the wood pellets, the results for the internal angle of friction and apparent specific weight were also similar to those found in the literature. However, this is a relatively new type of material, and few results of this type have been reported, certainly not enough for reference values to be available. This work is the first to report this material’s dilatancy angle and Poisson’s ratio. A table is provided with suggested reference values for the studied mechanical properties of each of the test materials; these can be used in silo load calculations involving numerical methods.

1. Introduction

Classical silo load calculations, which most commonly involve the use of the Janssen formula [1], allow the loads exerted by stored materials to be determined under static conditions. The values obtained depend on the different mechanical properties of these materials, including the internal angle of friction, the apparent cohesion, the particle–wall coefficient of friction, the apparent specific weight, etc. The literature contains numerous reports on these properties, both for granular materials and for powders, which have been studied for many years [2,3,4,5,6,7,8,9,10,11,12,13].
In the 1970s, numerical methods began to appear for calculating agricultural silo loads [14]. Since then, they have become ever more important thanks to advances in computing, which have allowed increasingly more complex calculations to be undertaken. These methods have allowed theoretical studies of the loads exerted by materials stored in agricultural silos, both under static and dynamic conditions. Initially, finite element models were used to simulate their behaviour, understanding these materials as a continuous medium [15,16,17,18]. More recently, discrete element models have been used since they allow simulations at the particle level [19,20,21,22,23,24,25]. Some authors have combined both techniques [19,21,26].
From the point of view of safety, it is under dynamic conditions when the least favourable situations arise, and several studies have examined what happens in such scenarios [27,28,29,30,31]. However, the theoretical results obtained when using classical or numerical techniques require validation in real silos, allowing models to be appropriately adjusted [29,32,33,34].
It should always be remembered that the reliability of theoretical results obtained via simulations depends on knowing the mechanical properties of the materials analysed. Indeed, both classical theories and numerical simulations require values for the properties they contemplate, such as the Poisson’s ratio and the dilatancy angle. These have been determined for some materials [6,35,36,37,38], but for others, such as wood pellets, the literature contains no information; laboratory tests are needed to provide the required data.
The aim of the present work was to determine the values of a number of mechanical properties of the following materials commonly stored in silos: wheat (Triticum), maize (Zea mays) and wood pellets. The results add to those already reported in the literature for the first two and provide some of the first information of their kind for the third.

2. Materials and Methods

The assays described in this work were all performed at the Geotechnical Laboratory of the Centro Universitario de Plasencia (University of Extremadura). Figure 1 shows the following materials examined:
The wood pellets used in this work corresponded to natural wood (100%). Their main characteristics were as follows: diameter = 6 ± 1 mm; length = 3,15 < L ≤ 40 mm; fines ≤ 0.5%; net calorific value ≥ 4.6 kWh/kg; ash ≤ 0.7%; moisture ≤ 10%; bulk density = 600 ≤ DB ≤ 750 kg/m3; mechanical durability ≥ 98%.
The properties determined for these materials were the following: the internal angle of friction (ϕ), the apparent cohesion (C), the particle–wall coefficient of friction (μ), the dilatancy angle (ψ), the Poisson’s ratio (ν), Young’s modulus (E) and the apparent specific weight (γ).
The assays employed to determine the values for these variables have been described in detail elsewhere [35,38]; information regarding particular conditions is, however, provided here.

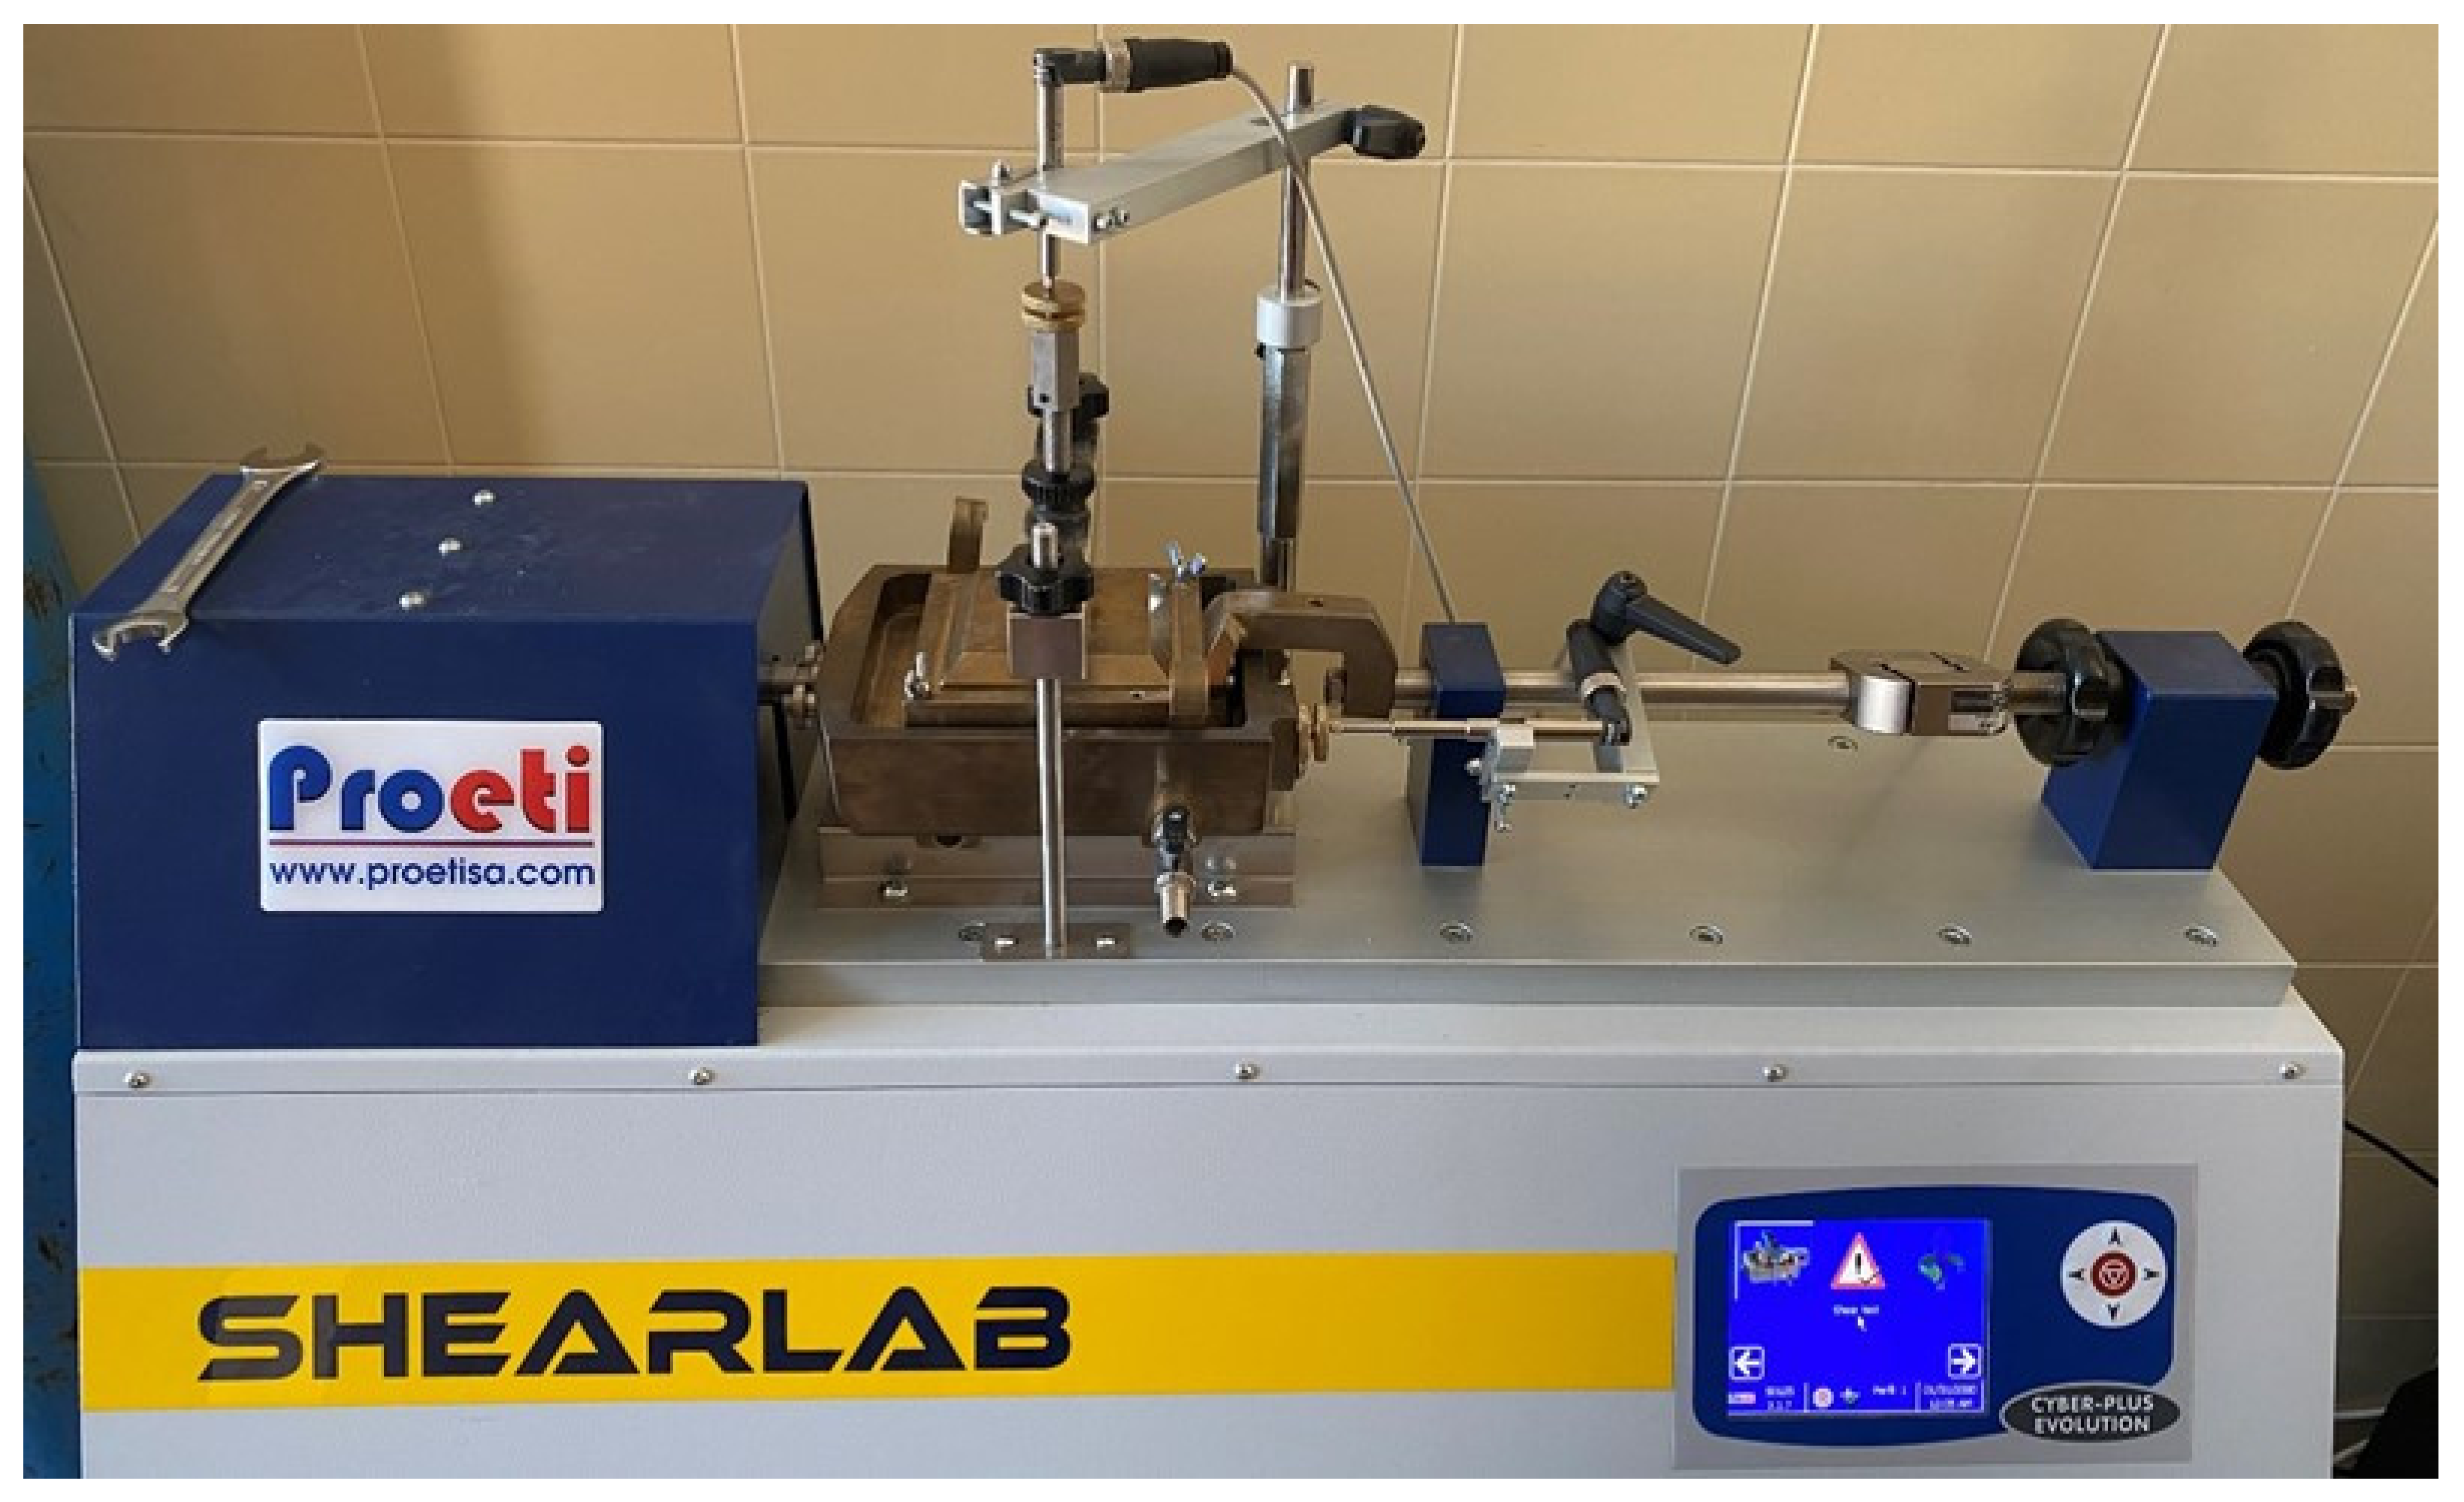
2.1. Direct Shear Assays

The assays adhered to the procedure established in part 10 of Standard UNE-EN ISO 17892 [39]. Figure 2 shows the semi-automatic direct shear test device as follows:
The semi-automatic shear test device used had a square shear box dimensions 10 cm long and 3 cm deep. It was provided with a load cell of 5 kN with the following technical characteristics: Sensibility: 2.0 (mV/V) ± 0.1%; Tolerance: 1.5% F.E.; Hysteresis error: 0.023% F.E.; Creep (30 min): 0.019% F.E.; Max. linearity error: 0.021% F.E.; Load limit: 150% F.E.; Min. failure load: 250% F.E.; Protection IP 67. In addition, the device had a linear strain gauge transducer 10 mm travel for measuring the vertical deformation and other one 25 mm travel for measuring horizontal displacement. The technical data of both strain gauge transducers were the following: Linearity < 0.5%; Sensibility = 440 mV/mm (±10%); Repeatability: ±6 micron; Zero deviation depending on temp < 0.005%/°C; Resistance to crack: 250 g SRS 20…2000 Hz; Resistance to vibrations: 20 g rms (max 50 g); Protection level IP 66. The speed selector allows developing assays at speeds ranging between 0.00001 and 10 mm/min.
Normal stresses of 20, 30, 100, 200 and 300 kPa were employed. The assay speed was 1 mm/min, with three repetitions for each assay. The vertical deformation of the sample was measured using a deformation sensor. This device was used to determine the internal angle of friction, the apparent cohesion and the dilatancy angle for each material.
The dilatancy angle is determined using the following Equation (1):
Ψ = (Δεv/h0)/(ΔεH/L)
where
  • Ψ = Dilatancy angle;
  • Δεv = Increment of the vertical deformation at a time range (mm);
  • ΔεH = Horizontal displacement variation at a time range (mm);
  • h0 = Initial height of the sample (mm);
  • L = Initial length of the sample (mm).
As well as performing conventional assays, others were performed modifying the shear box to determine the coefficient of friction of the material with the metallic casing (i.e., the particle–wall coefficient of friction). For this, the normal stresses employed were 30, 100, 200 and 300 kPa. The assay speed was again 1 mm/min, with three repetitions at each stress.
As reported in earlier work [36], while Eurocode 1 Part 4 [40] recommends that the ratio between the size of the sample and the size of the grain not be below 40, for the maize and wood pellets it was clearly distant from this value. However, the interest in the present results outweighs the need to adhere to this criterion, especially bearing in mind the limitations of the apparatus and the lack of any larger devices. Certainly, other researchers [41] have performed direct shear tests limiting the above ratio to 5, similar to that resulting in the present work.

2.2. Triaxial Tests

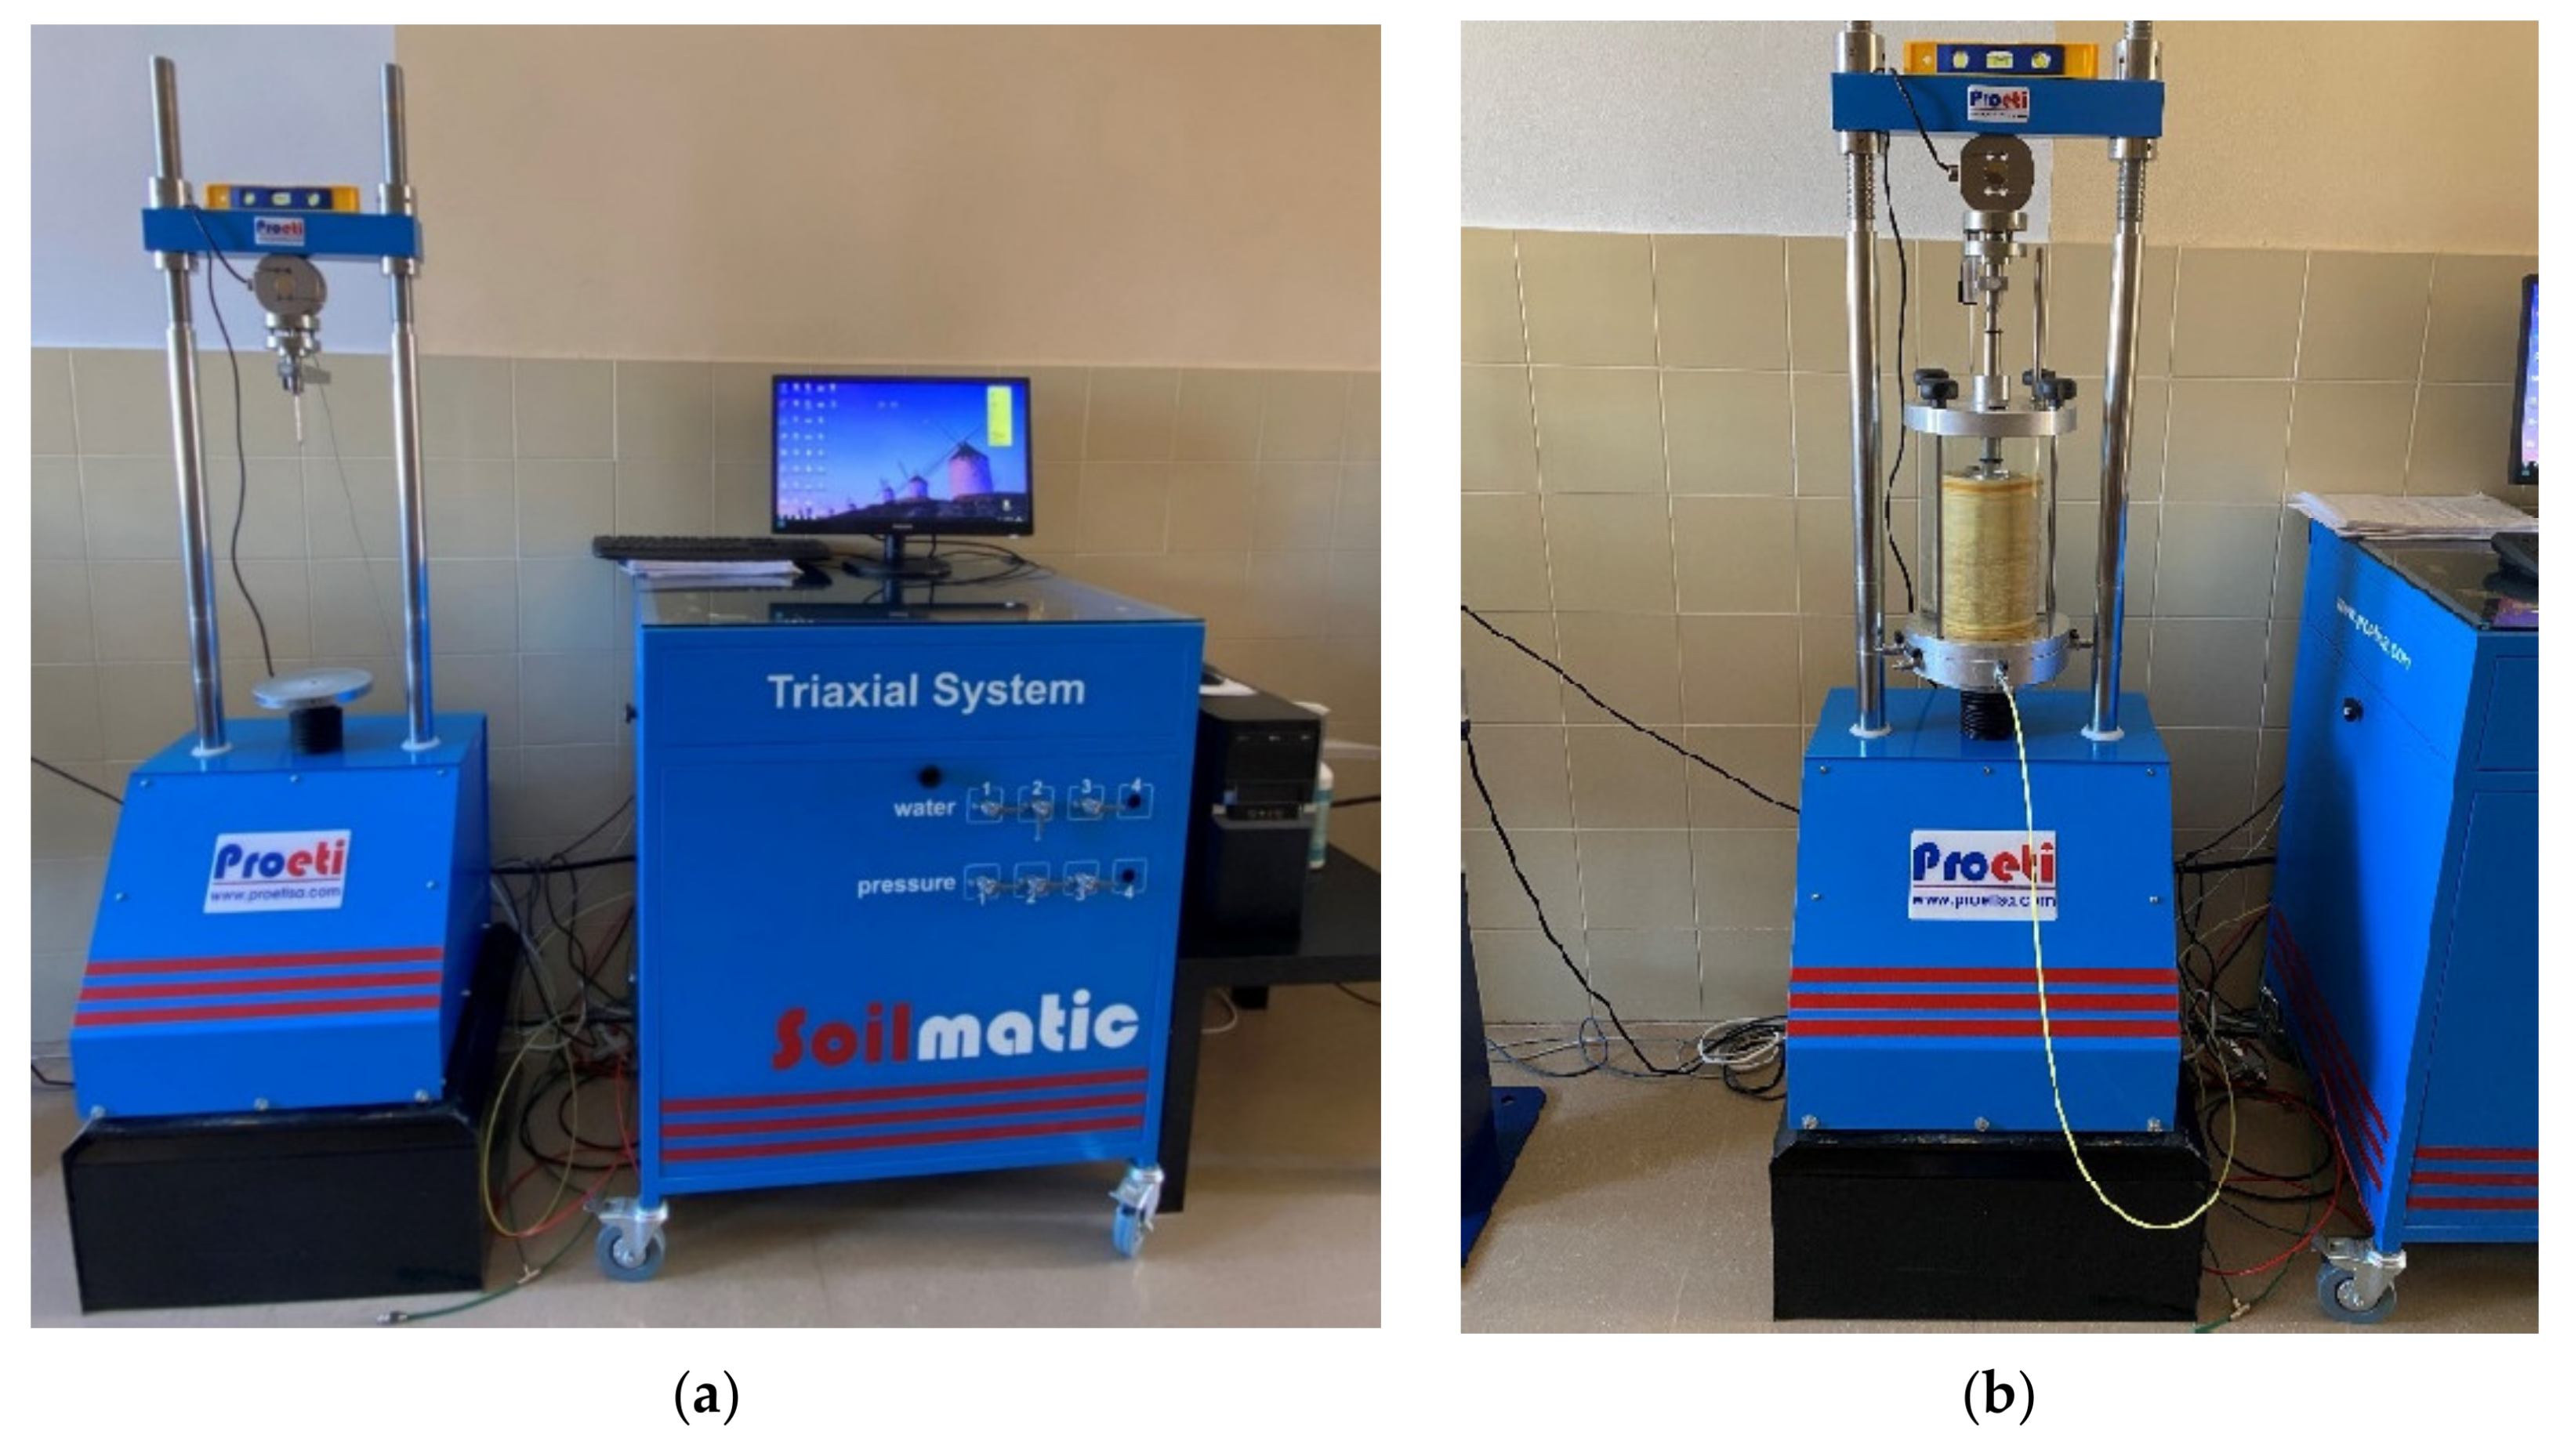
Assays were performed adhering to the procedure described in Part 8 of Standard UNE-EN ISO 17892 [42]. Figure 3 shows the apparatus used, a fully automatic device that requires the use of a multiuse press; in the present work, one with a 50 kN load cell was used.
The triaxial test device was provided with two load cells, one of 20 kN and the other of 50 kN, although in this work just the second one was used, as commented. In addition, it has an absolute pressure transducer up to 20 bar (20 kg/cm2) and a strain gauge transducer with a measurement range of 0–100 mm. The technical characteristics of both the load cells and the strain gauge transducers were the same provided for the direct shear test device.
The triaxial test device could be used with two sample-holding vessels, one 101.6 mm (4 inches) in diameter and one of 38.1 mm (1.5 inches). In the present work, the 101.6 mm vessel was used with the maize and wood pellets, and the 38.1 mm vessel with the wheat. This device was used in free lateral deformation (FLD) and K0 assays following methods previously described [35,36,38].
In the FLD assays, the applied confinement pressure was maintained constant and the samples allowed to deform freely until they reached 20% axial deformation (the maximum allowed by Standard UNE-EN ISO 17892), recording the shear stress continuously. The confinement pressures used were 100, 200 and 300 kPa. This allowed the internal angle of friction and apparent cohesion of the test material to be determined following the procedure described for the direct shear tests.
For the K0 assays, the initial confinement pressure exerted was 100 kPa, but at the moment the sample began to deform at the centre it was increased to 200 kPa (all other conditions were maintained). When the sample began to deform again at the centre, the confinement pressure was increased to 300 kPa and the assay continued until an axial deformation of 20% was reached. All assays with the 101.6 mm vessel were performed at a speed of 1.016 mm/min, while all those with the 38.1 mm vessel were performed at 0.508 mm/min. All assays were performed in triplicate.
The membrane effect was taken into account in both types of assays (as required by Standard UNE-EN ISO 17892) using the following Equation (2):
σm = [(4 × tm × Em)/Dm] × εvm
where
  • σm = The action of the latex membrane used to surround the sample (kPa);
  • tm = The thickness of the membrane when not under stress (mm);
  • Em = The Young’s modulus of the membrane, measured under stress (kPa);
  • Dm = The initial internal diameter of the membrane (mm);
  • εvm = The vertical deformation of the membrane (mm).
In the present case, the value for εvm is automatically recorded by the triaxial device’s software. The value for Em was 1400 kPa, i.e., the value recommended for latex membranes by the above standard. The value of tm for the 38.1 mm internal-diameter membrane was 0.2 mm, and for the 101.6 mm internal-diameter membrane it was 1.5 mm.

2.3. Oedometric Assays

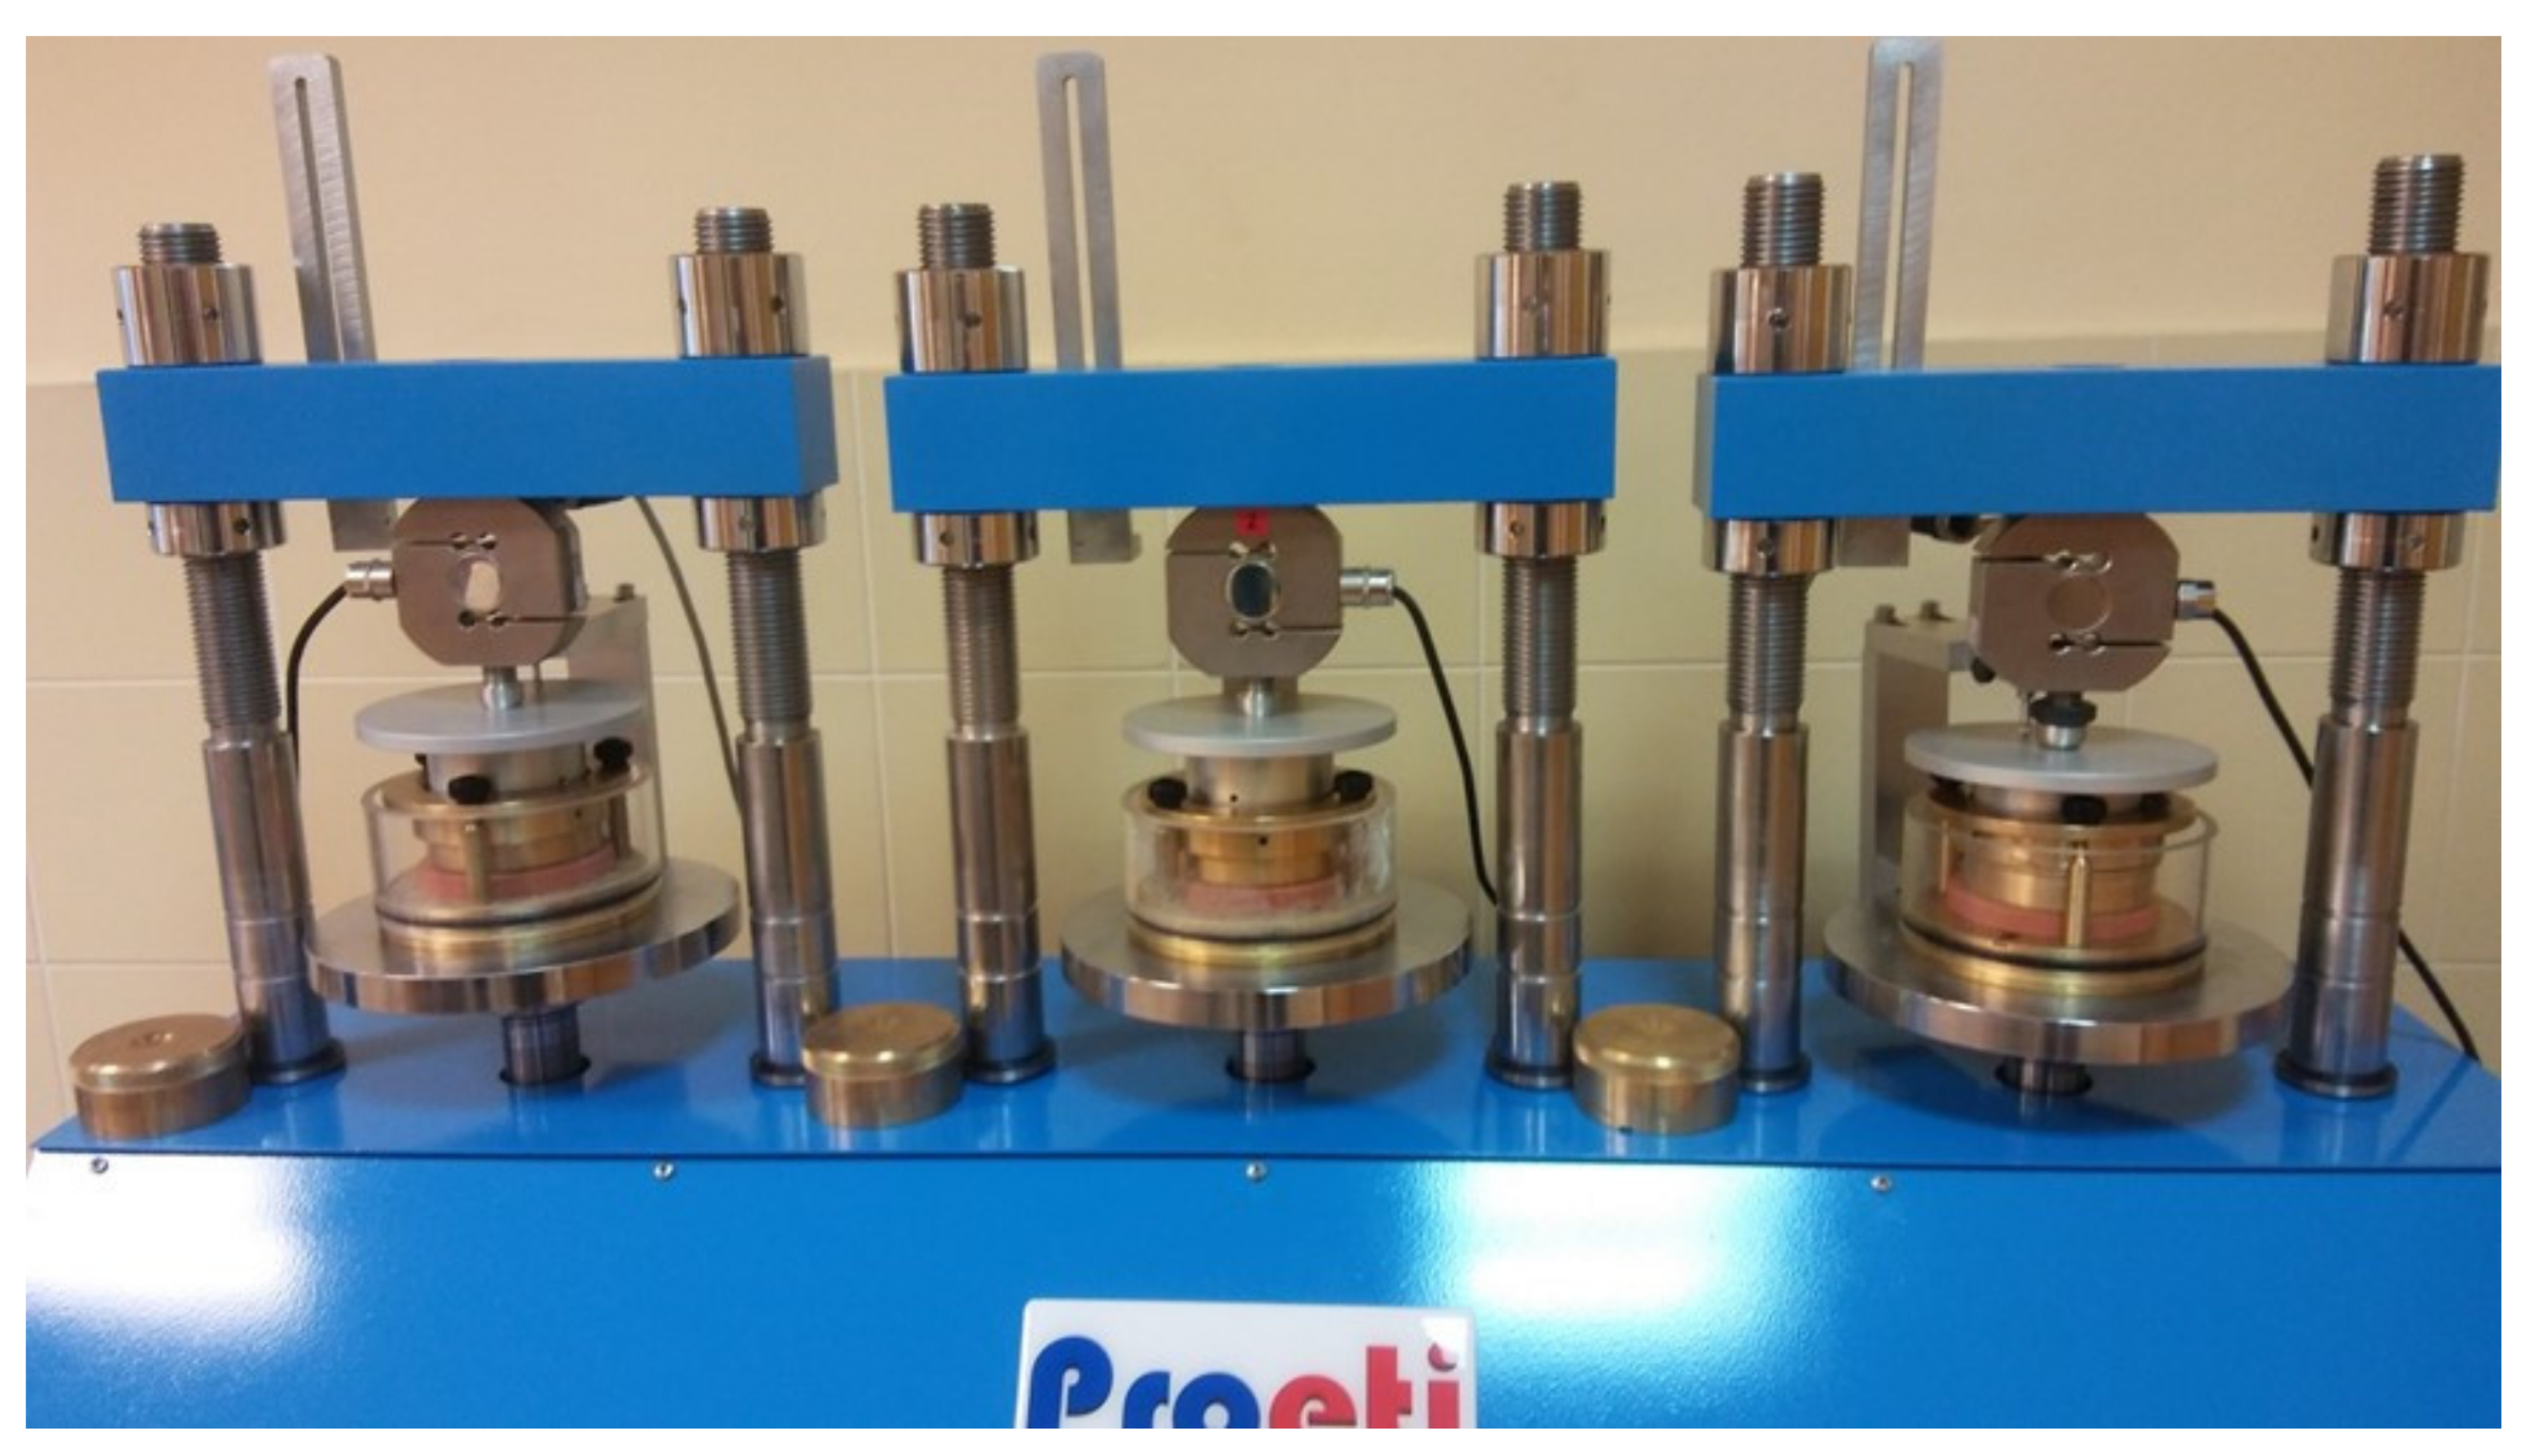
These assays were performed following the procedure described in Part 5 of Standard UNE 17892 [43]. Figure 4 shows the apparatus used, a completely automatic device.
The oedometric apparatus is a fully automatic device provided with three oedometers (each cell 75 mm-internal diameter/20 mm high) each equipped with 10 kN load cells. In addition, it has three strain gauge transducers 10 mm travel and PID control for the applied force with a resolution of 1 N. The technical characteristics of both the load cells and the strain gauge transducers are the same provided for the direct shear test device.
Figure 5 shows a sample of wood pellets inside one of the oedometric cells.
For these assays, normal stresses of 8, 16, 32, 64, 128 and 256 kPa were applied. Using the load and deformation values reached during the unloading process, oedometric modulus was calculated as previously described [35,38], which was then used to derive the elasticity of the test materials. All assays were performed in triplicate.

2.4. Determination of the Apparent Specific Weight

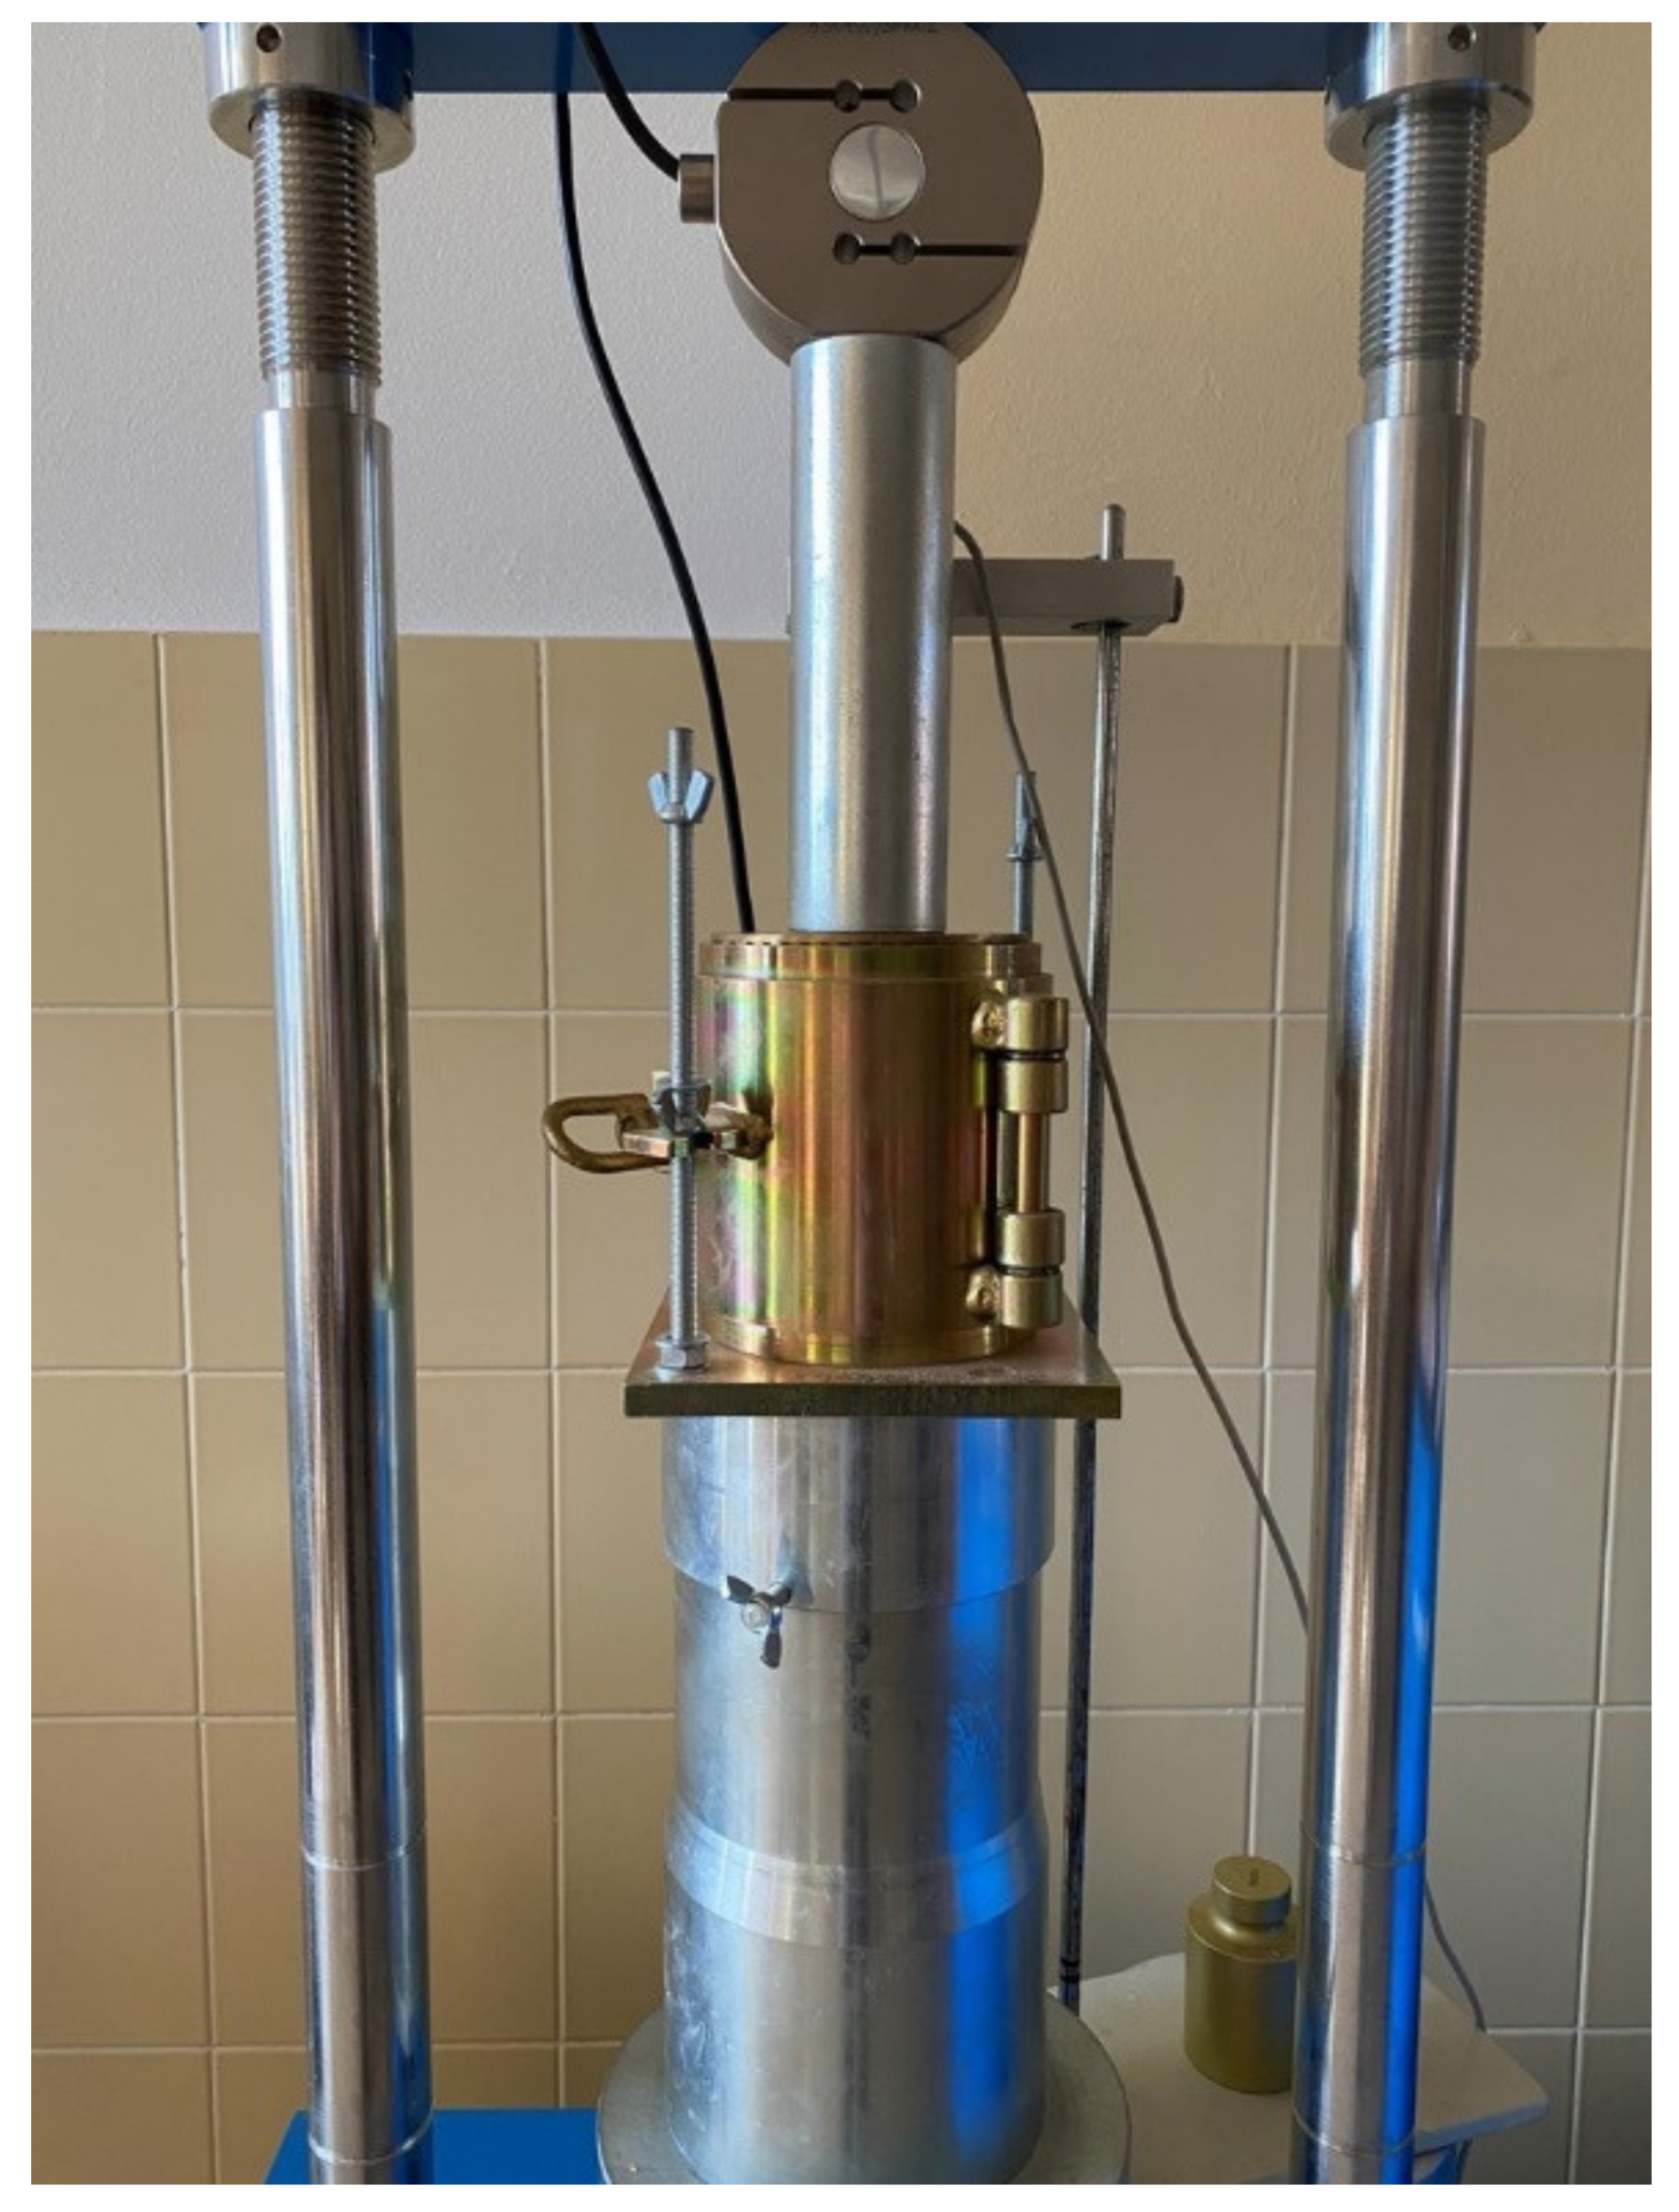
These assays were performed following previously described methods [35,38] that adhere to Part 2 of Standard UNE-EN ISO 17892 [44]. The assay speed was 0.382 mm/min; all assays were performed in triplicate. Figure 6 shows the arrangement of the normal Proctor mould in the multiuse press in order to determine the variation in the specific weight of the samples under normal stress.

2.5. Determination of the Moisture Content

The materials were dried in an oven at 105–110 °C, adhering to Part 1 of Standard UNE-EN ISO 17892 [45] for the maize and wheat samples and to Part 2 of Standard UNE-EN ISO 18134 [46] for the wood pellets. Samples were weighed every 24 h until a constant weight was reached.

3. Results

3.1. Direct Shear Assays

3.1.1. Internal Angle of Friction and Apparent Cohesion

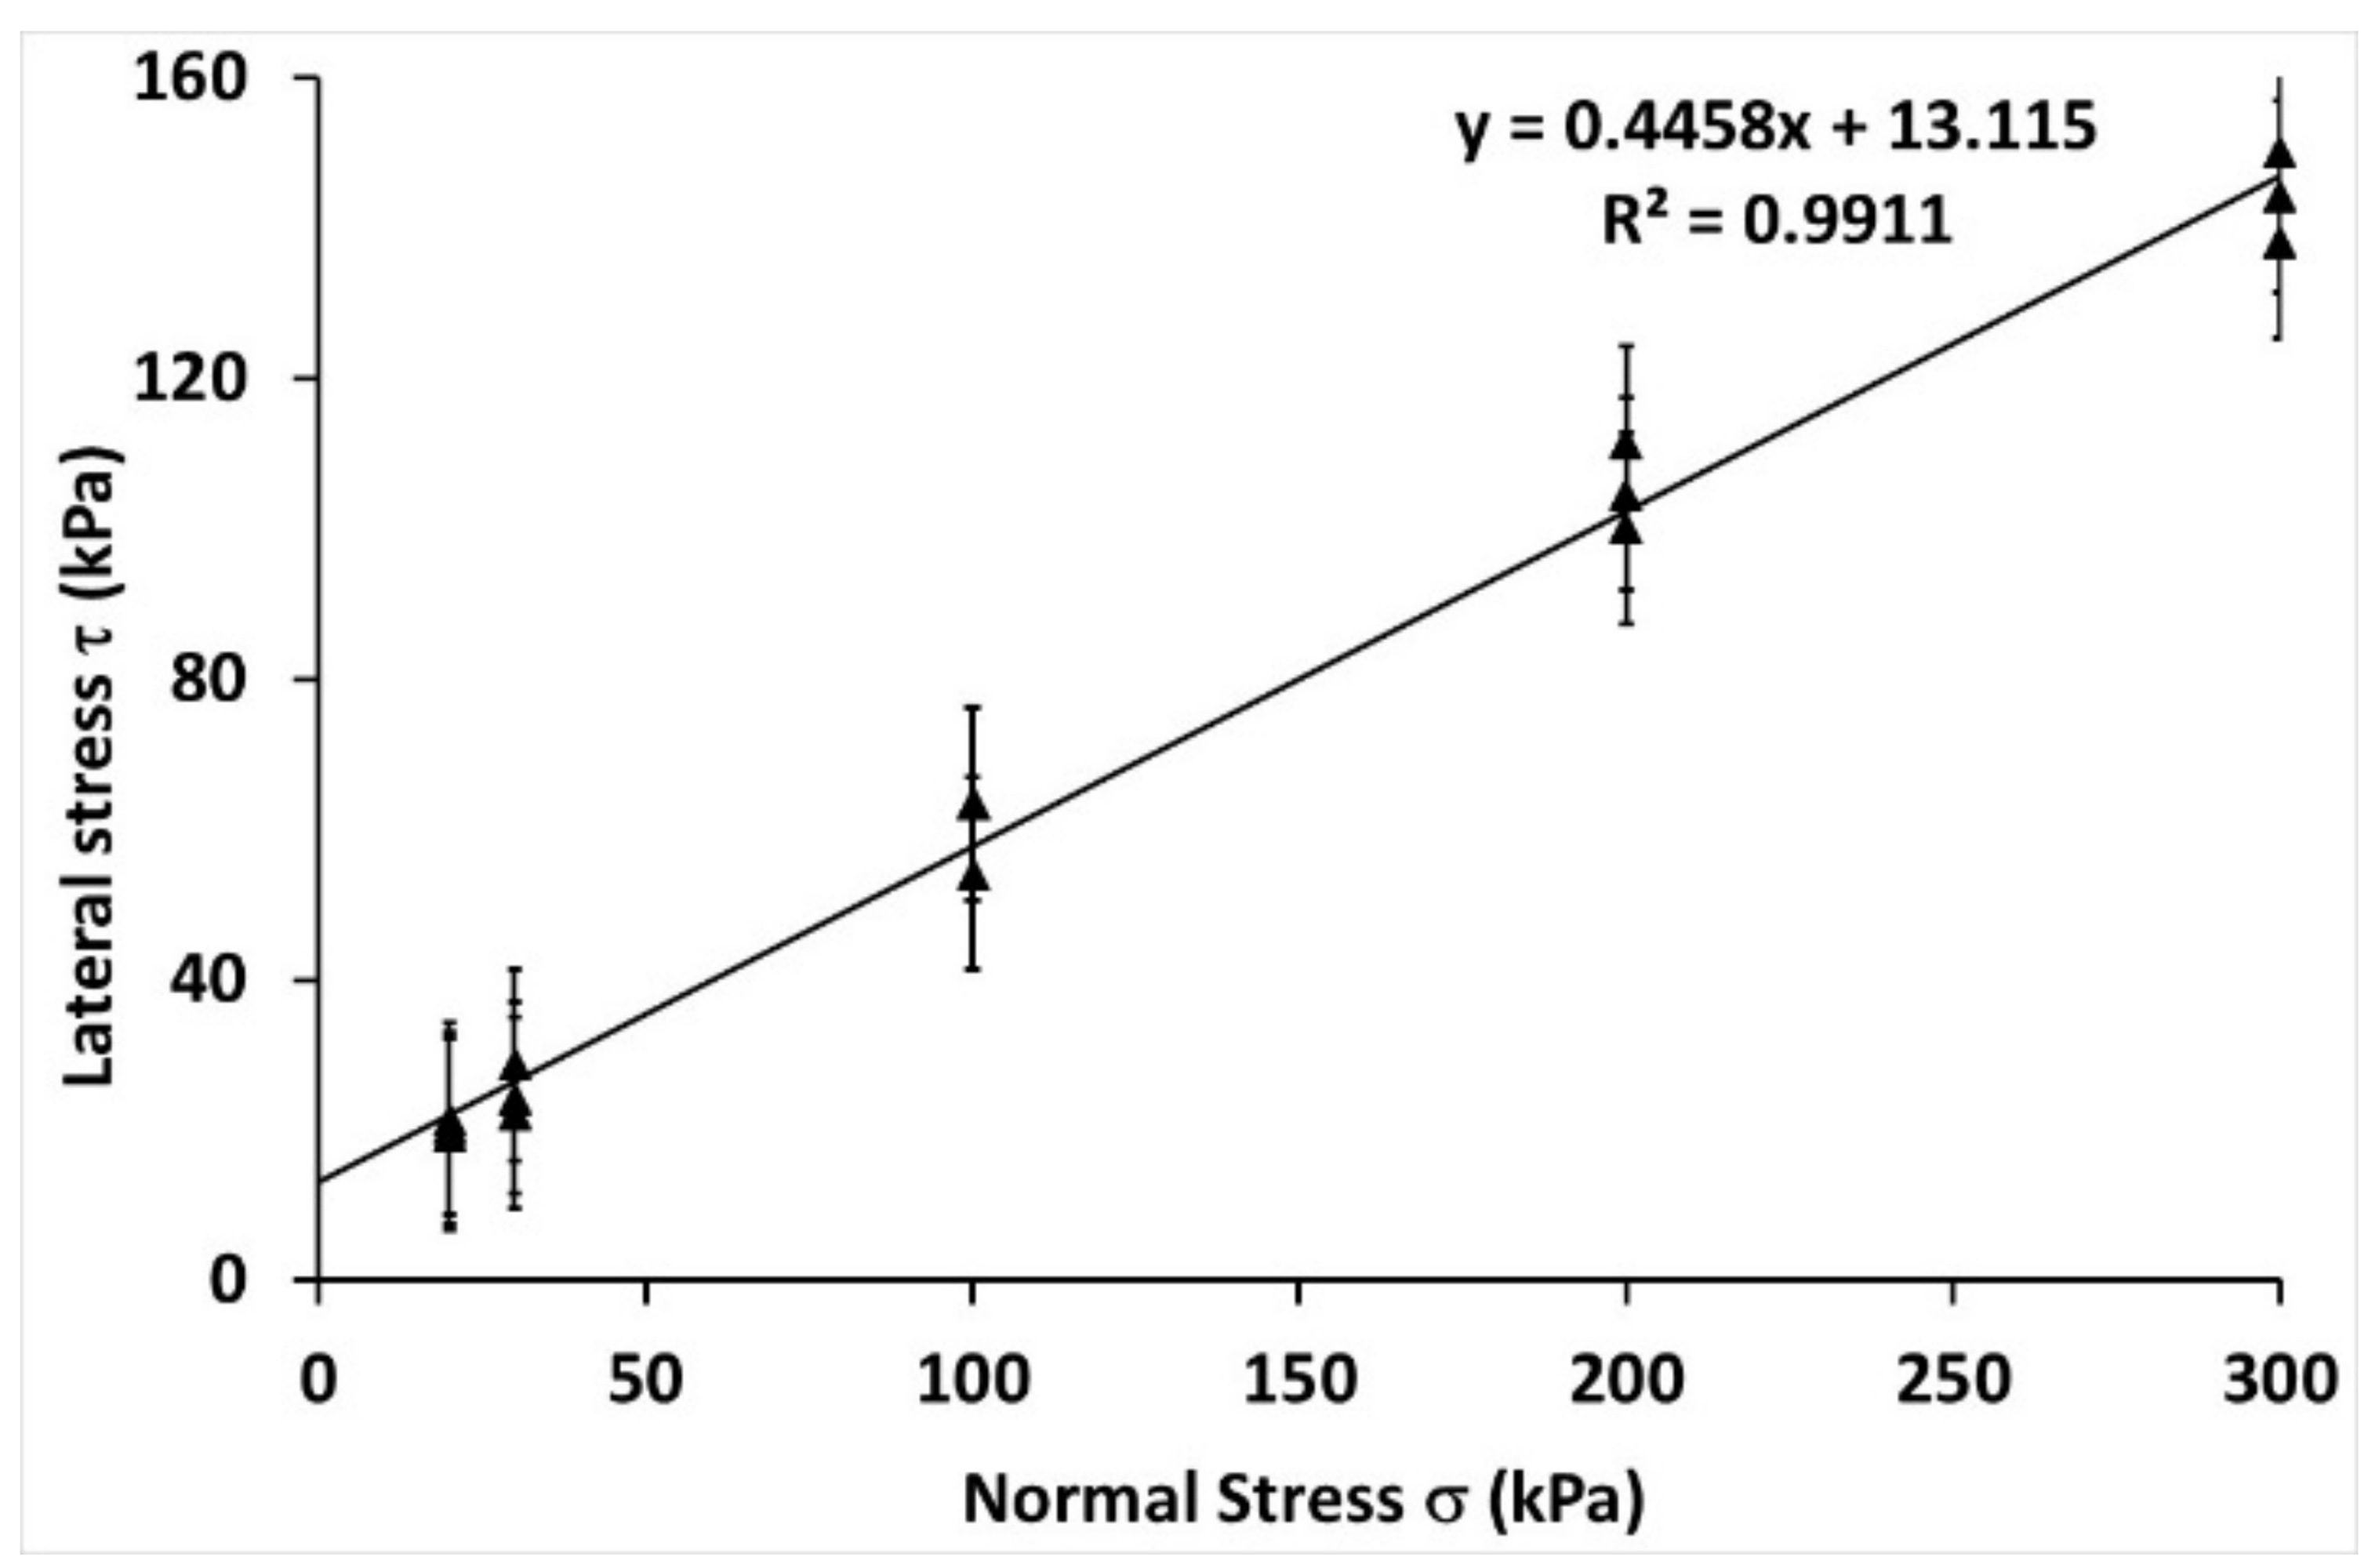
Figure 7 shows the regression line for the Mohr–Coulomb strength envelope obtained for the wheat in the direct shear assays performed at the indicated normal stresses. The slope provides the value for the internal angle of friction and the intersection with the ordinate axis of the apparent cohesion.
The regression line formula for the wheat was y = 0.4458x + 13.115 (R2 = 0.9911), for the maize it was y = 0.5532x + 13.988 (R2 = 0.9817) and for the wood pellets it was y = 0.8592x + 23.017 (R2 = 0.9786).
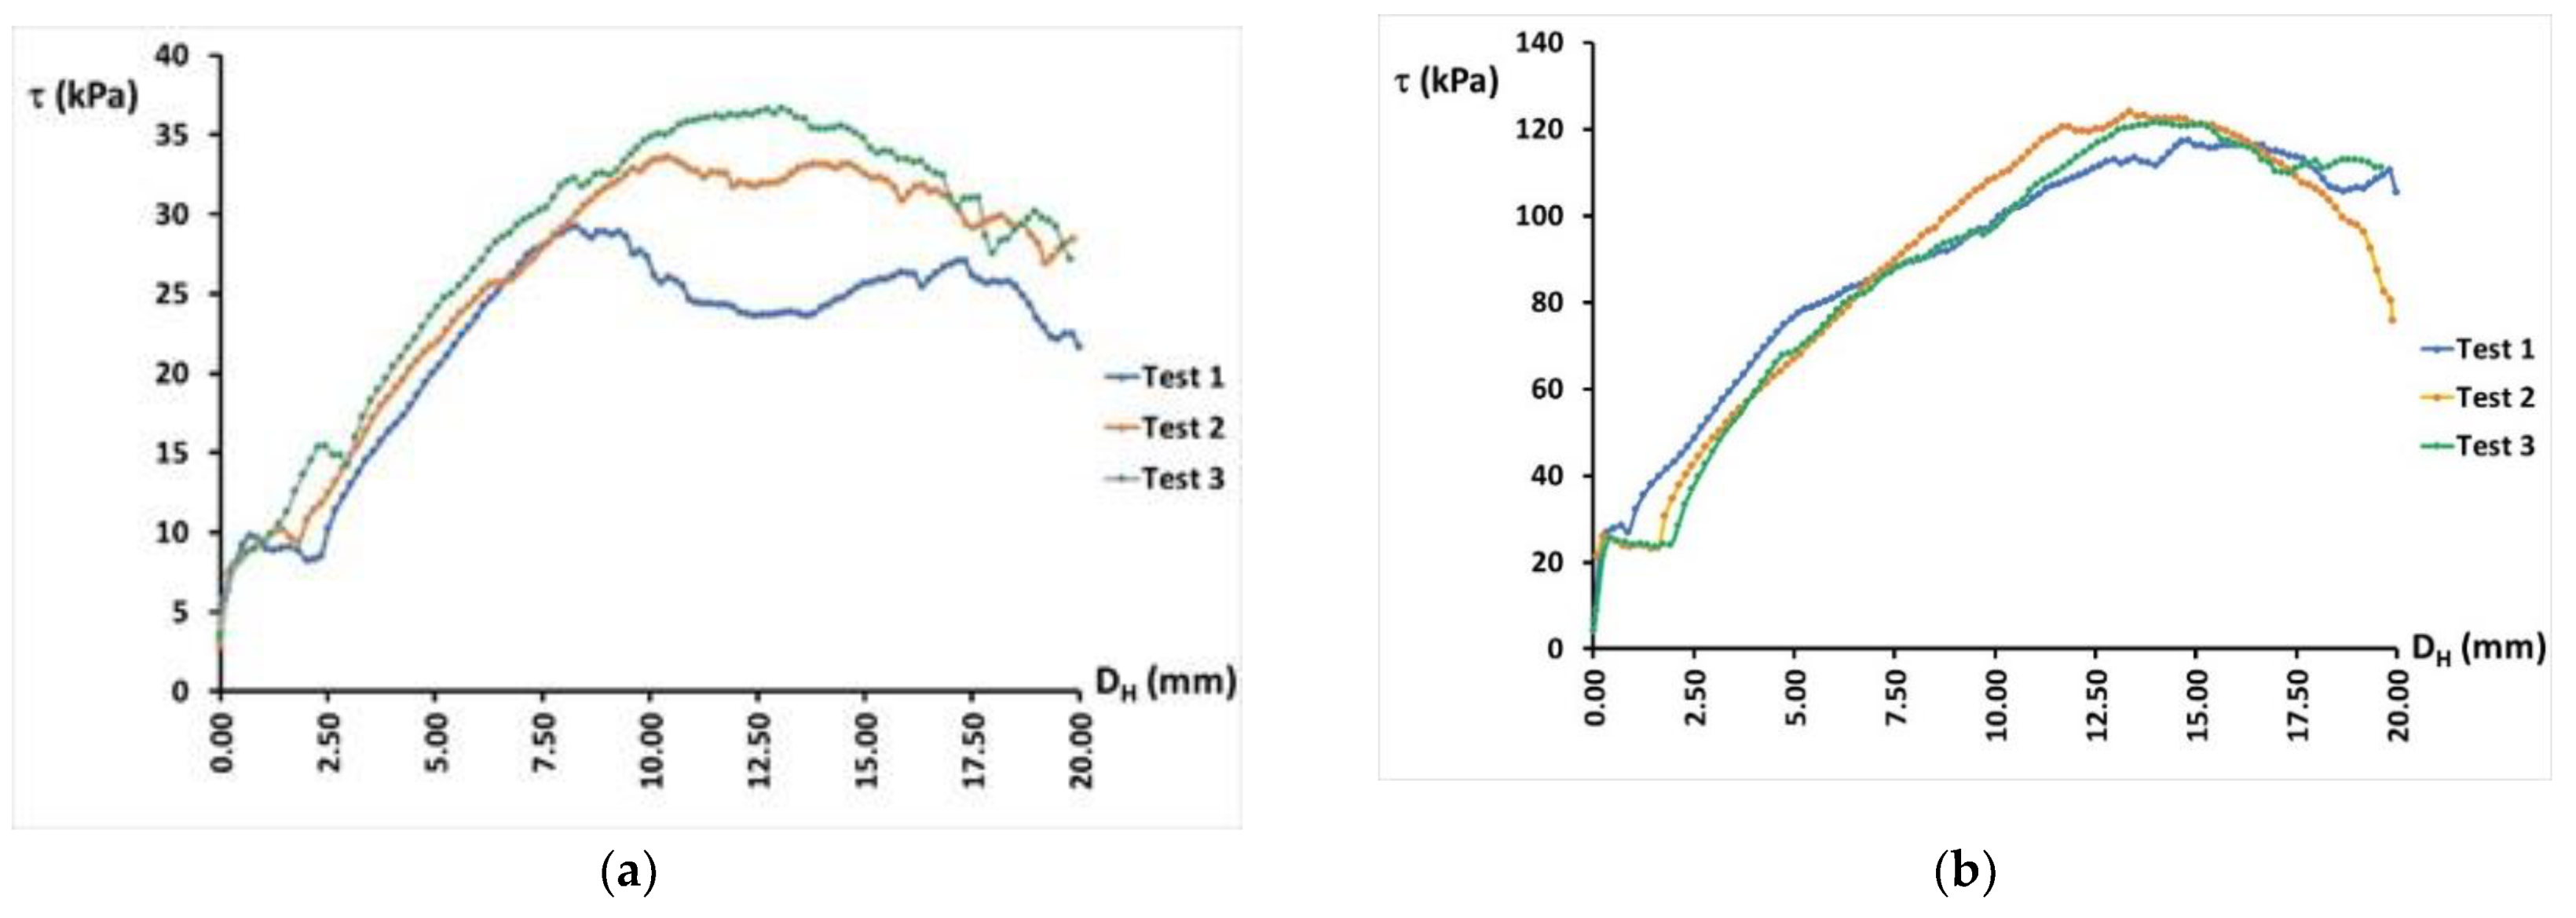
Figure 8 shows the shape of the stress-deformation curve for the wood pellets under normal stress of 20 kPa (a) and 100 kPa (b). The shear stress is plotted on the ordinate axis, whereas the horizontal deformation is plotted on the abscissa.
The way in which the material breaks is similar under both conditions, with an immediate fall following a peak ratio value. The values in Figure 8b are notably higher than those in Figure 8a. This is due to the increase in the stress state due to the higher normal stress exerted, which hinders the displacement of the particles as the horizontal displacement of the shear box increases. For the particles to leave their initial positions, increasing shear stress is required. Shearing occurs when the shear stress reached equals the shear stress threshold of the material.
Table 1 shows the mean ± standard deviation for the internal angle of friction and the apparent cohesion of the tested materials.
The wood pellets (followed by the maize and then the wheat) returned the highest value for the internal angle of friction; therefore, they offered greater resistance to shearing. All three materials returned notable apparent cohesion values, with wheat the highest, followed by maize and wood pellets.

3.1.2. Dilatancy Angle

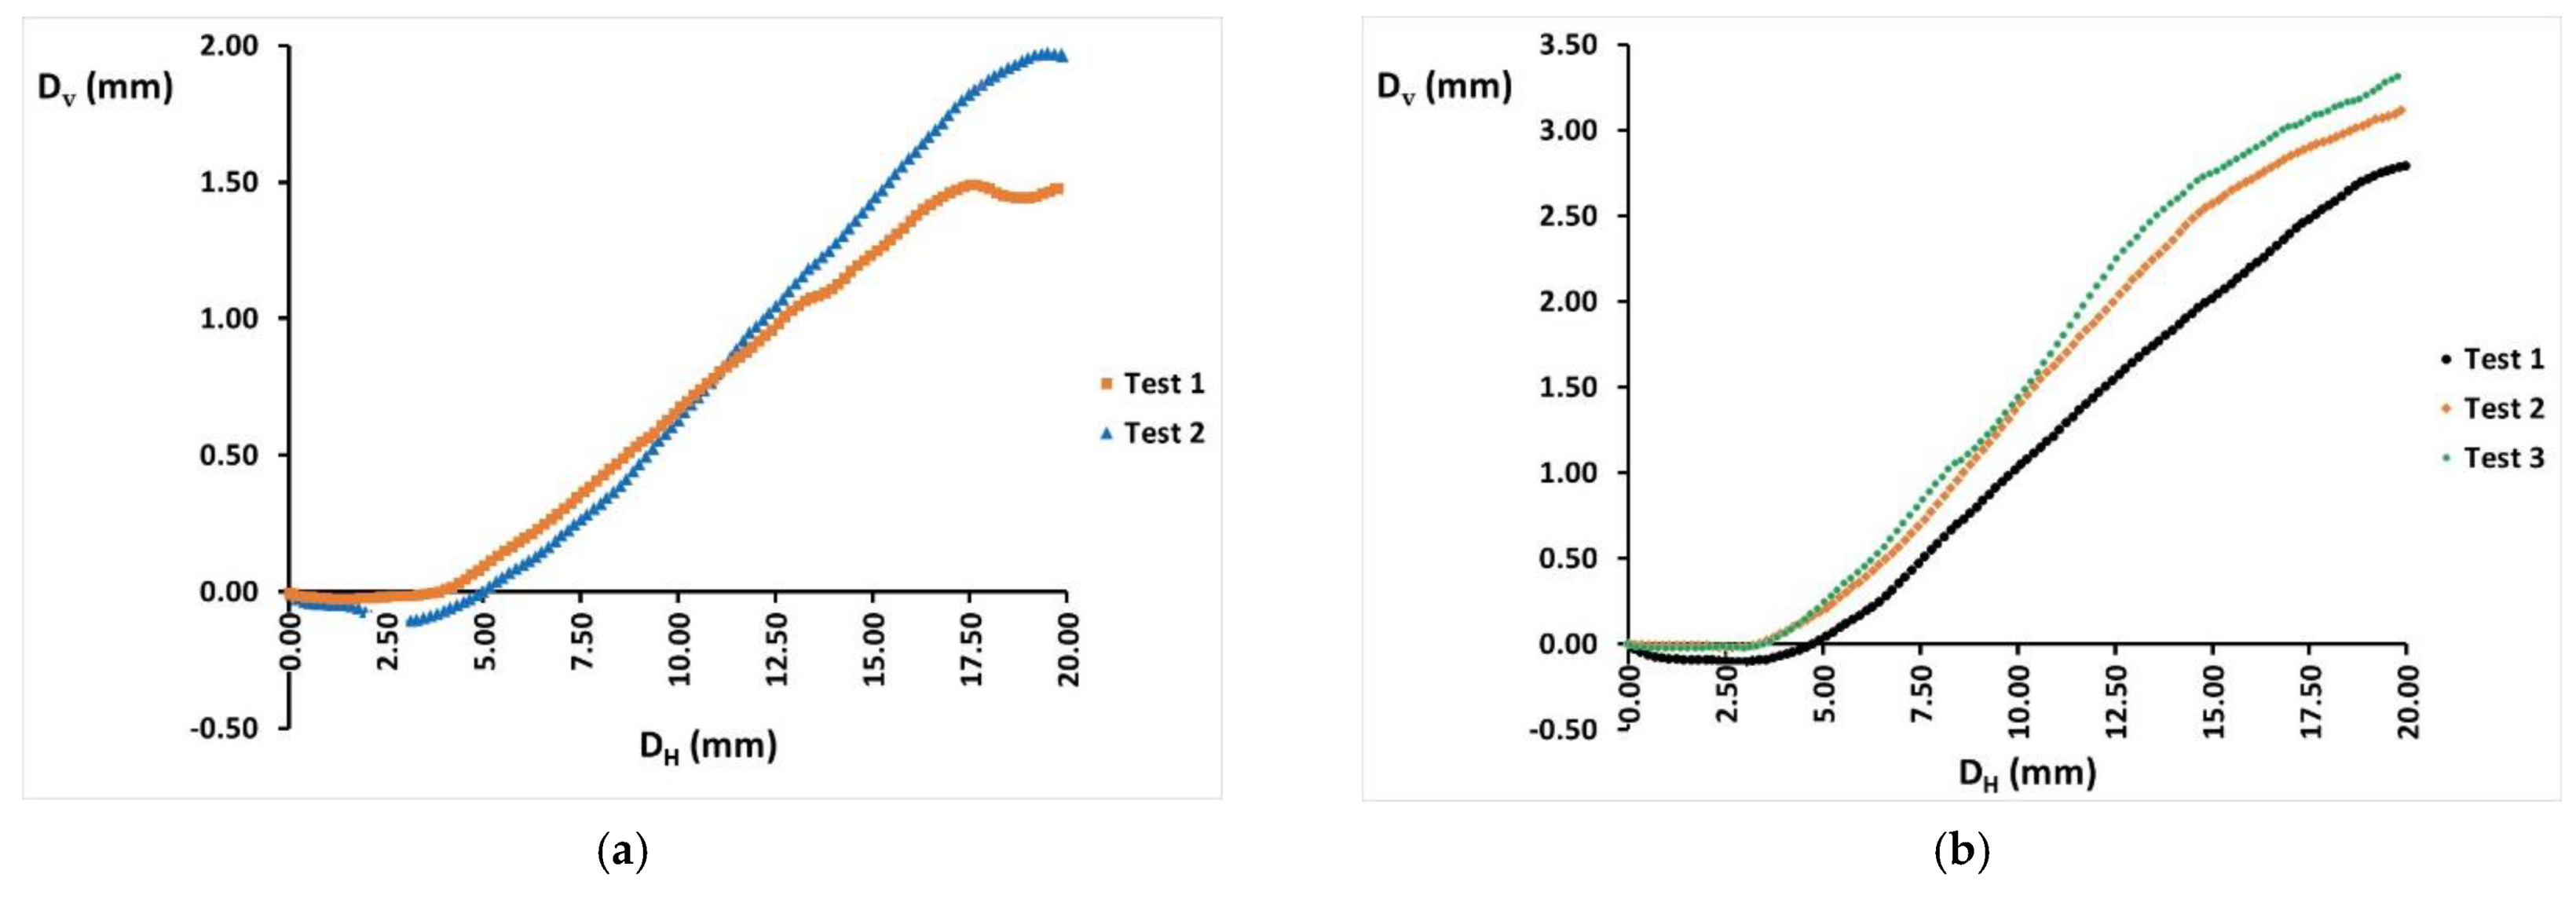
Figure 9 shows the deformation curve (obtained via direct shear assays; abscissa = horizontal deformation, ordinate = vertical deformation) for the wood pellets at 100 kPa (left) and 20 kPa (right). Results for each repetition are shown; it should be noted that while three repetitions were performed at 100 kPa, only the results for two were valid.
The different repetitions at each normal stress returned similar results. Immediately after beginning the assay, the samples first began to become compressed as the particles adjusted their positions. The resistance they offered to shear then increased significantly until the shearing stress was reached, causing the displacement of the particles and increasing the height of the vessel they occupied inside the shear box. As expected, the vertical deformation values were higher at 20 kPa since the particles are freer to move and become less imbricated, thus achieving a larger dilatancy angle.
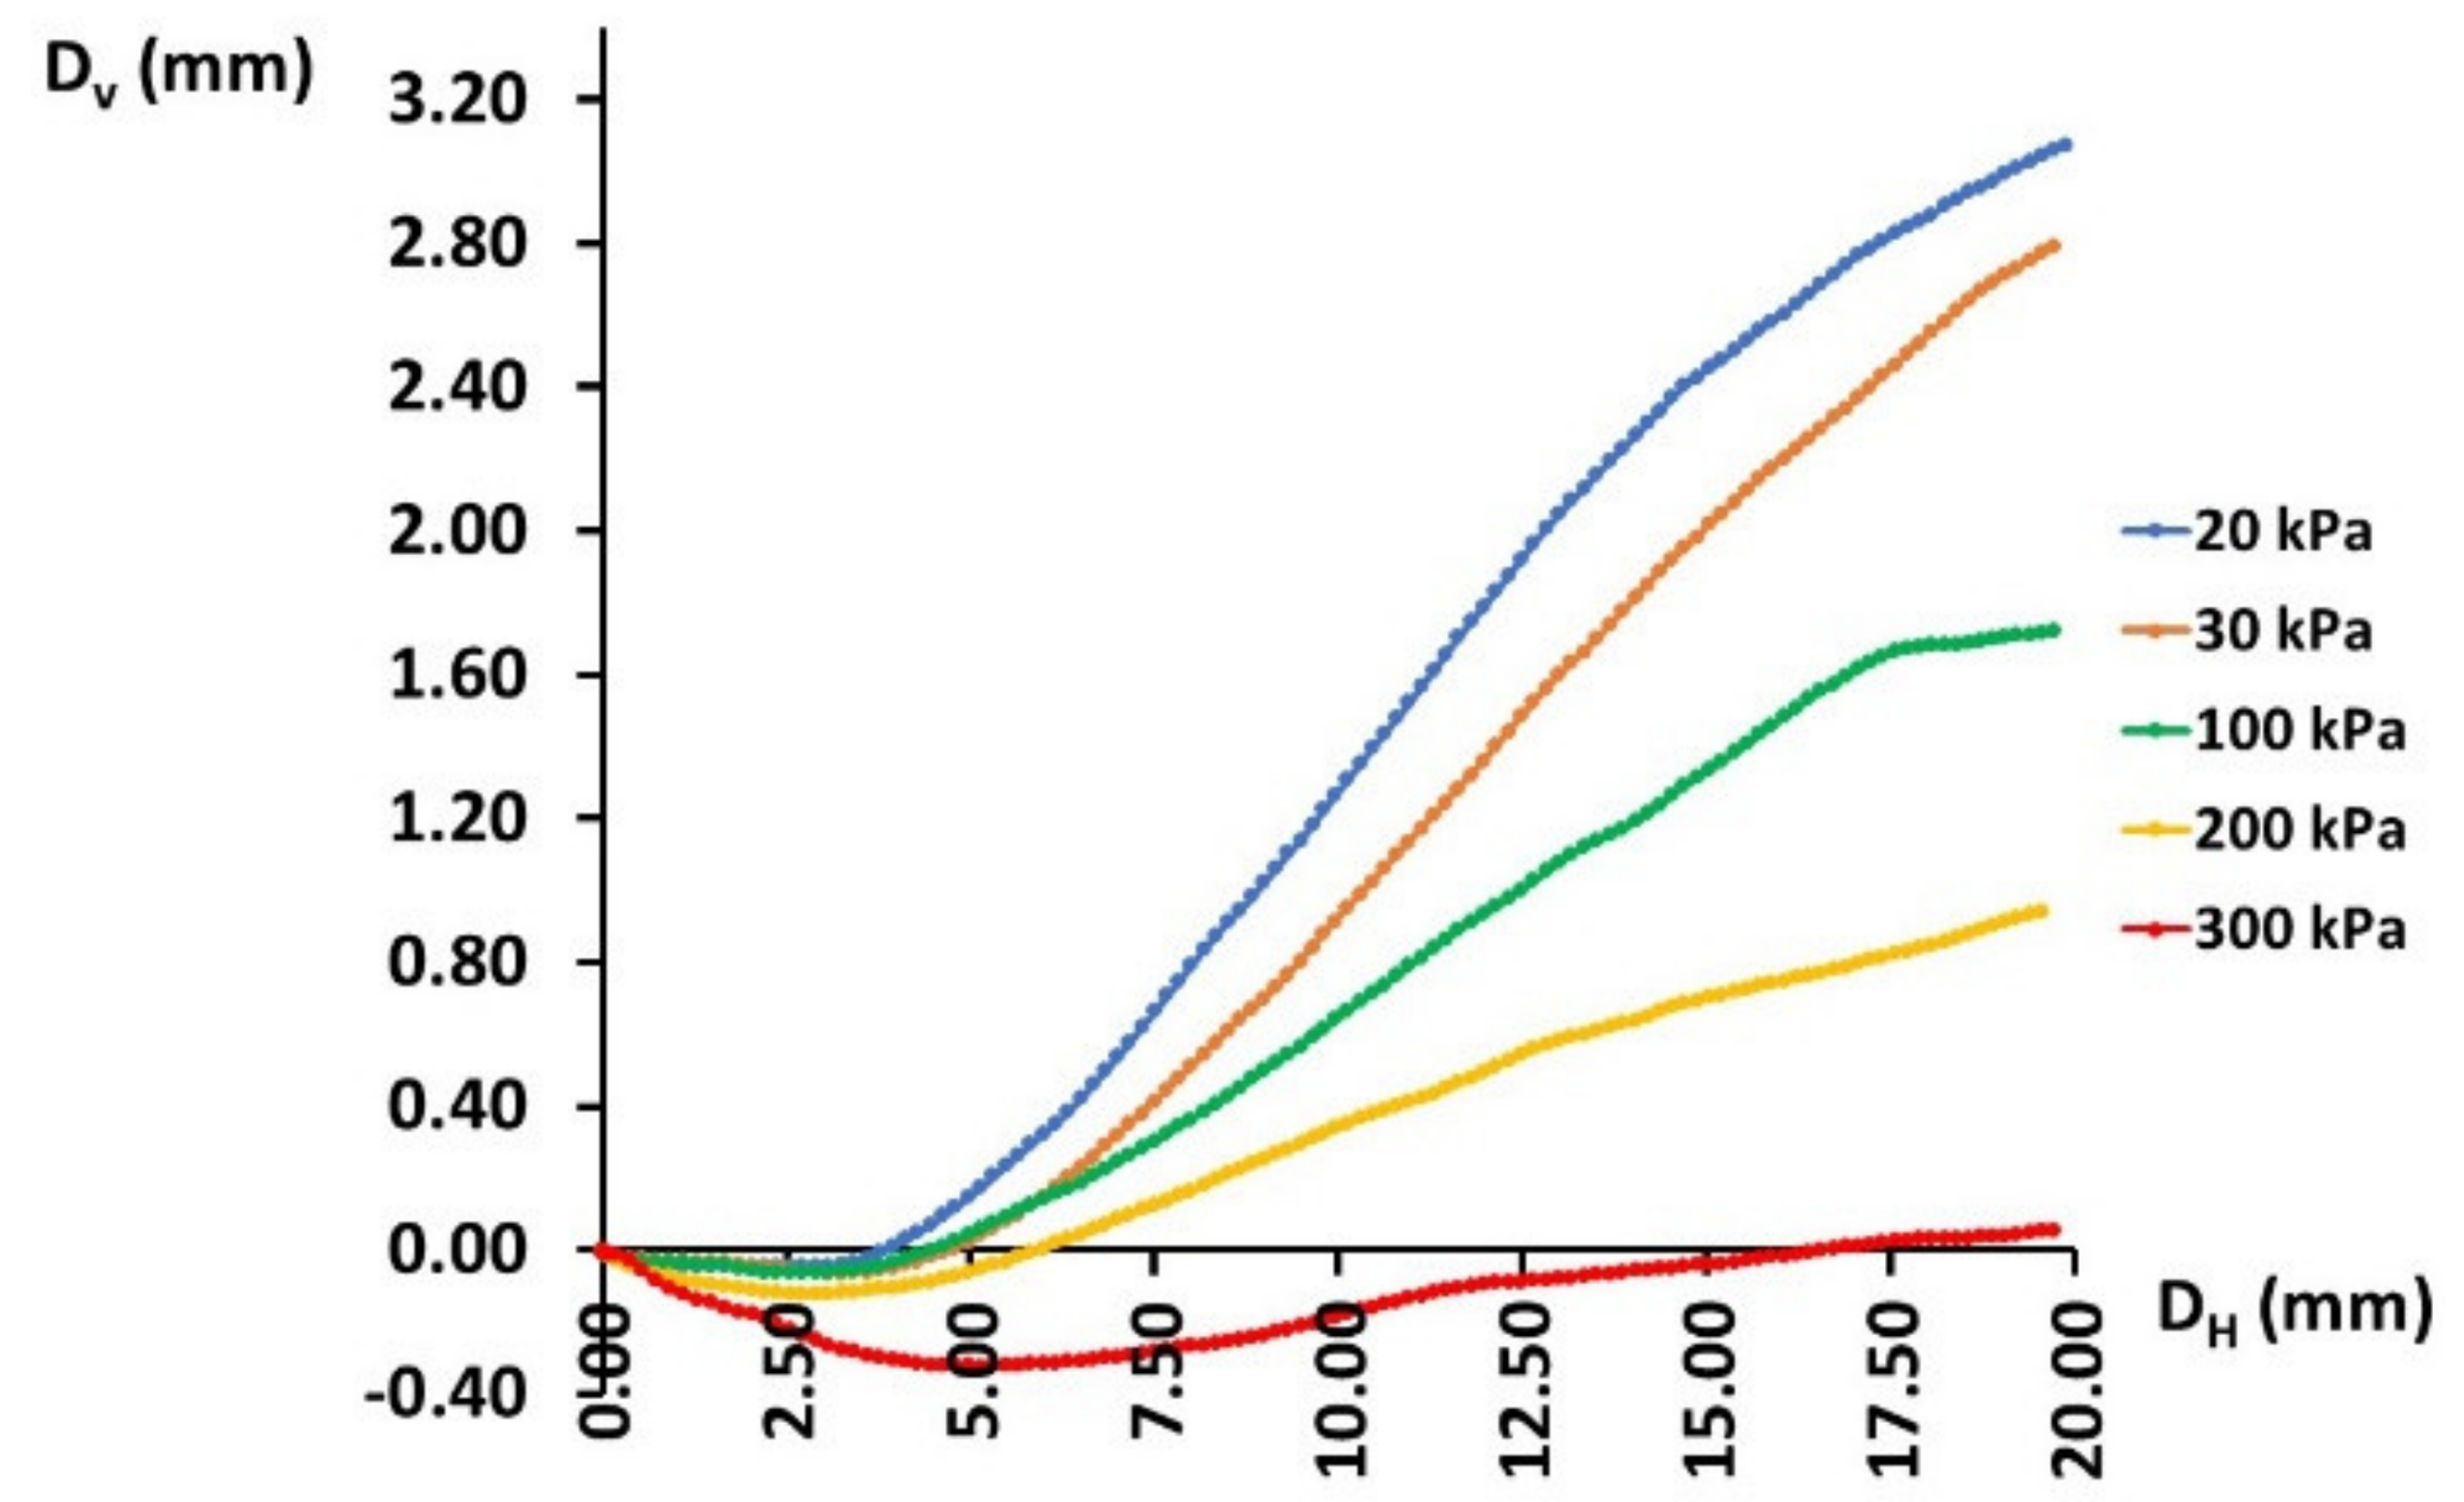
Figure 10 shows the differences in the vertical deformation recorded for the wood pellets at the five stress values assayed. Each curve represents the mean values from three repetitions.
The difference in the vertical deformation recorded at 300 kPA and 20 kPa is significant because of the reasons explained above.
Table 2 shows the mean ± SD for the dilatancy angles obtained for each material under the different normal stresses assayed.
The wood pellets (followed by the maize and wheat) returned the highest dilatancy angles at all the normal stresses exerted, with the maximum value (36.4°) recorded at 20 kPa. The maize returned a similarly high value at 20 kPa (33.6°), while that for wheat was much lower (19.7°). In all cases, these values fell as the normal stress exerted increased. For wheat, the dilatancy angle at 300 kPa was 4.2°, i.e., 79% smaller than at 20 kPa (19.7°), while for maize, these values were 8.8° and 33.6°, i.e., 74% smaller at the higher stress. For the pellets, the reduction was 72% (33.6° at 20 kPa and 10.4° at 300 kPa) the smallest percentage change registered.

3.1.3. Particle–Wall Coefficient of Friction

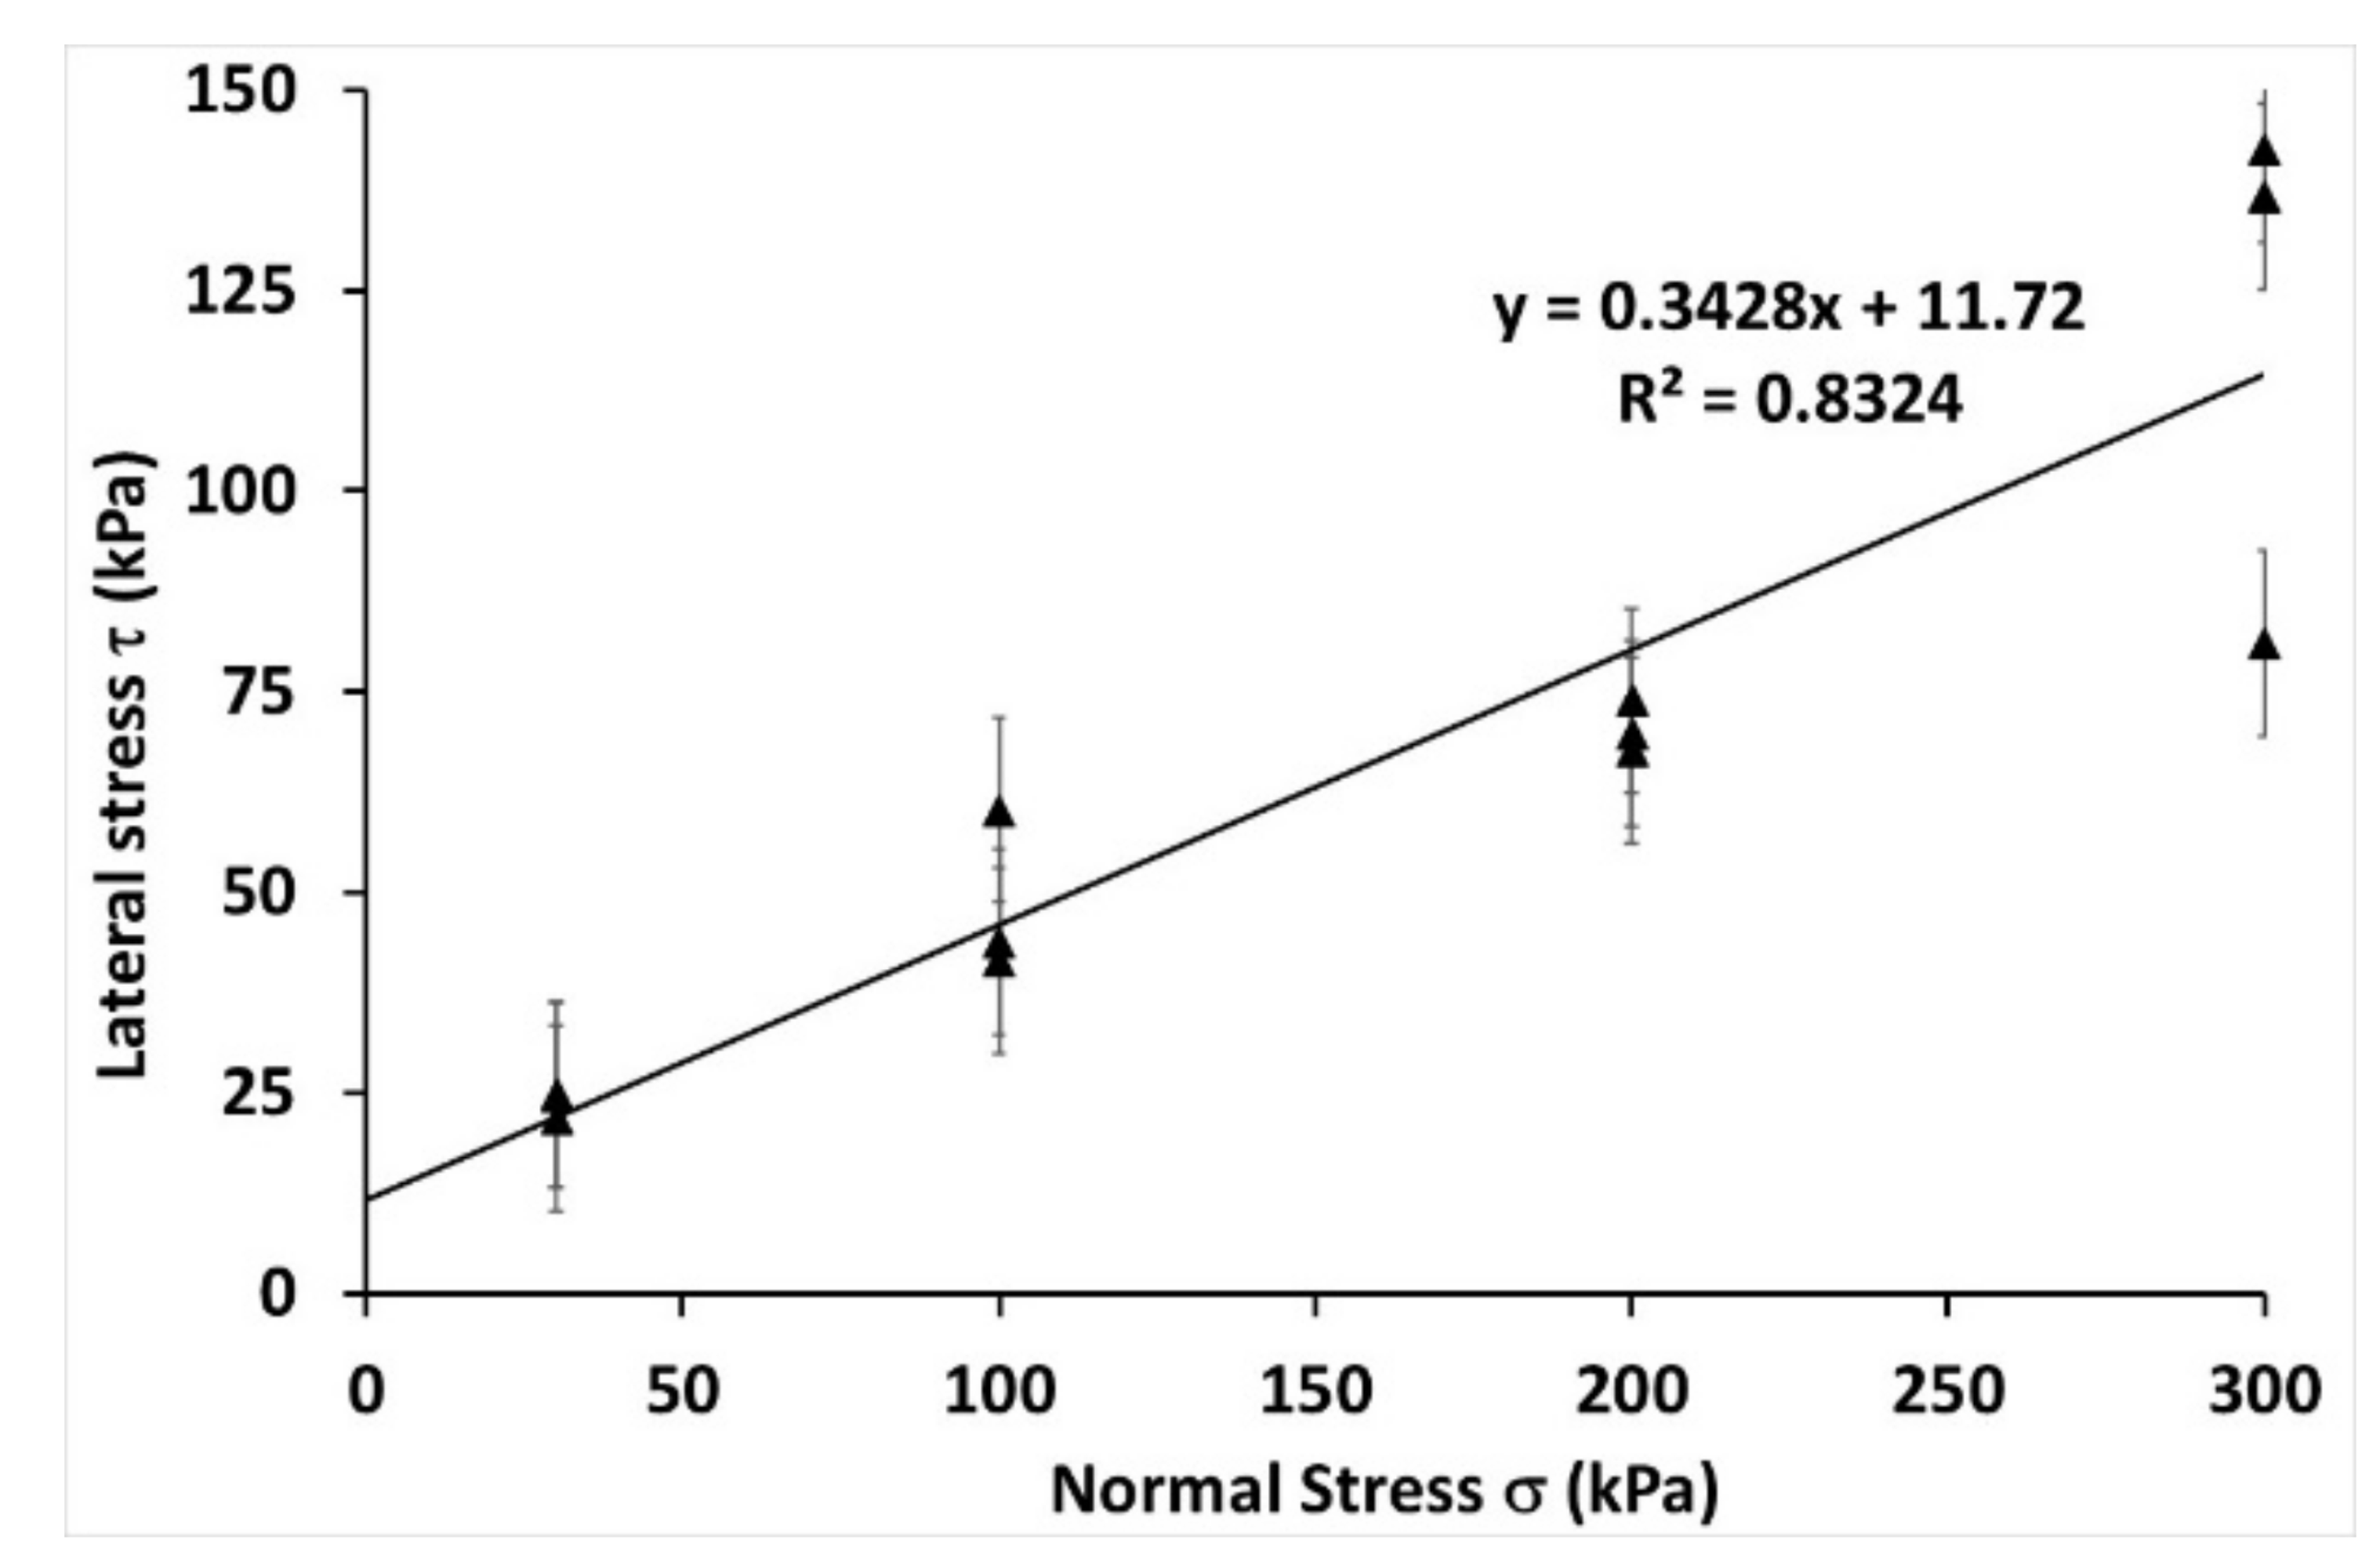
Figure 11 shows the regression line for the particle–wall coefficient of friction obtained for the maize.
The regression line formula was y = 0.3482x + 11.72 (R2 = 0.8324) for the maize, y = 0.5187x + 17.03 (R2 = 0.8103) for the wood pellets and y = 0.2916x + 10.775 (R2 = 0.9847) for the wheat.
Table 3 shows the mean ± SD for the particle–wall coefficient of friction for the three materials examined.
The wood pellets returned the highest particle–wall coefficient of friction, a value notably higher than those for the maize and wheat.

3.2. Triaxial Tests

3.2.1. Free Lateral Deformation

Figure 12 shows the FLD regression lines for the wheat (the maize line was very similar) and wood pellets obtained at axial deformations between 10% and 20%.
The slopes were steeper when the axial deformation was 20%. The regression line formula for wheat was y = 0.2935x − 1.8833 (R2 = 0.9807) for an axial deformation of 20% and y = 0.2611x + 3.3353 (R2 = 0.945) for 10%. For maize, these formulae were y = 1.0946x − 13.287 (R2 = 0.998) and y = 1.0623x − 10.114 (R2 = 0.9998), respectively, and for the wood pellets, y = 1.4049x − 28.683 (R2 = 0.9969) and y = 1.2874x − 22.73 (R2 = 0.9992), respectively.
Table 4 shows the means ± SD for the internal angle of friction and apparent cohesion of the tested materials derived from the above.
For all three materials, the internal angle of friction increased with the axial deformation. The highest value was obtained for the pellets (54.6°), followed by the maize (47.6°) and finally the wheat (16.4°). The value for the wheat fell by 11% at 10% axial deformation compared to 20%, while that of the pellets fell by 7.5%, and the maize by 2%.
With respect to the apparent cohesion values, wood pellets returned the lowest values for this parameter. In fact, these values were negative at between 10 and 20% axial deformations, as well as they were for maize. Wheat was the only material that presented a positive value (3.34 kPa) at 10% axial deformation.

3.2.2. K0 Assays

Table 5 shows the mean ± SD for the Poisson’s ratio of all three materials at the different confinement pressures applied.
The wheat returned the highest Poisson’s ratios, with the highest (0.39) at a confinement pressure of 100 kPa; the lowest value (0.13) was recorded for the wood pellets at the same confinement pressure. For all three materials, the values tended to decrease with increasing confinement pressure. The maize showed the greatest difference between the maximum and minimum values (22%); for the wood pellets, the difference was 7% and for the wheat, 5%.

3.3. Oedometric Assays

Table 6 shows the means ± SD for Young’s modulus obtained in the oedometric assays.
Due to the elastic-plastic behaviour of granulate solids, the elastic modulus can be calculated only during the unloading process, while the loading process allows to determine the so-called compressibility modulus. The reference value for the normal stress in the unloading process was 100 kPa since it can be considered that the maximum pressure reached in most commercial agricultural silos is of that order. Therefore, prorating between 64 and 128 kPa, the wheat would return the highest Young’s modulus value (about 37,350 kPa), followed by the maize (about 34,800 kPa) and finally the wood pellets (at a much lower 21,330 kPa). At 128 kPa compared to 64 kPa in the discharge cycle, Young’s modulus for the maize and wood pellets fell by 50% and by some 65% for the wheat. However, when comparing those at 64 kPa and 32 kPa, the reduction was 28% for the wood pellets, 22% for the wheat and 8% for the maize.
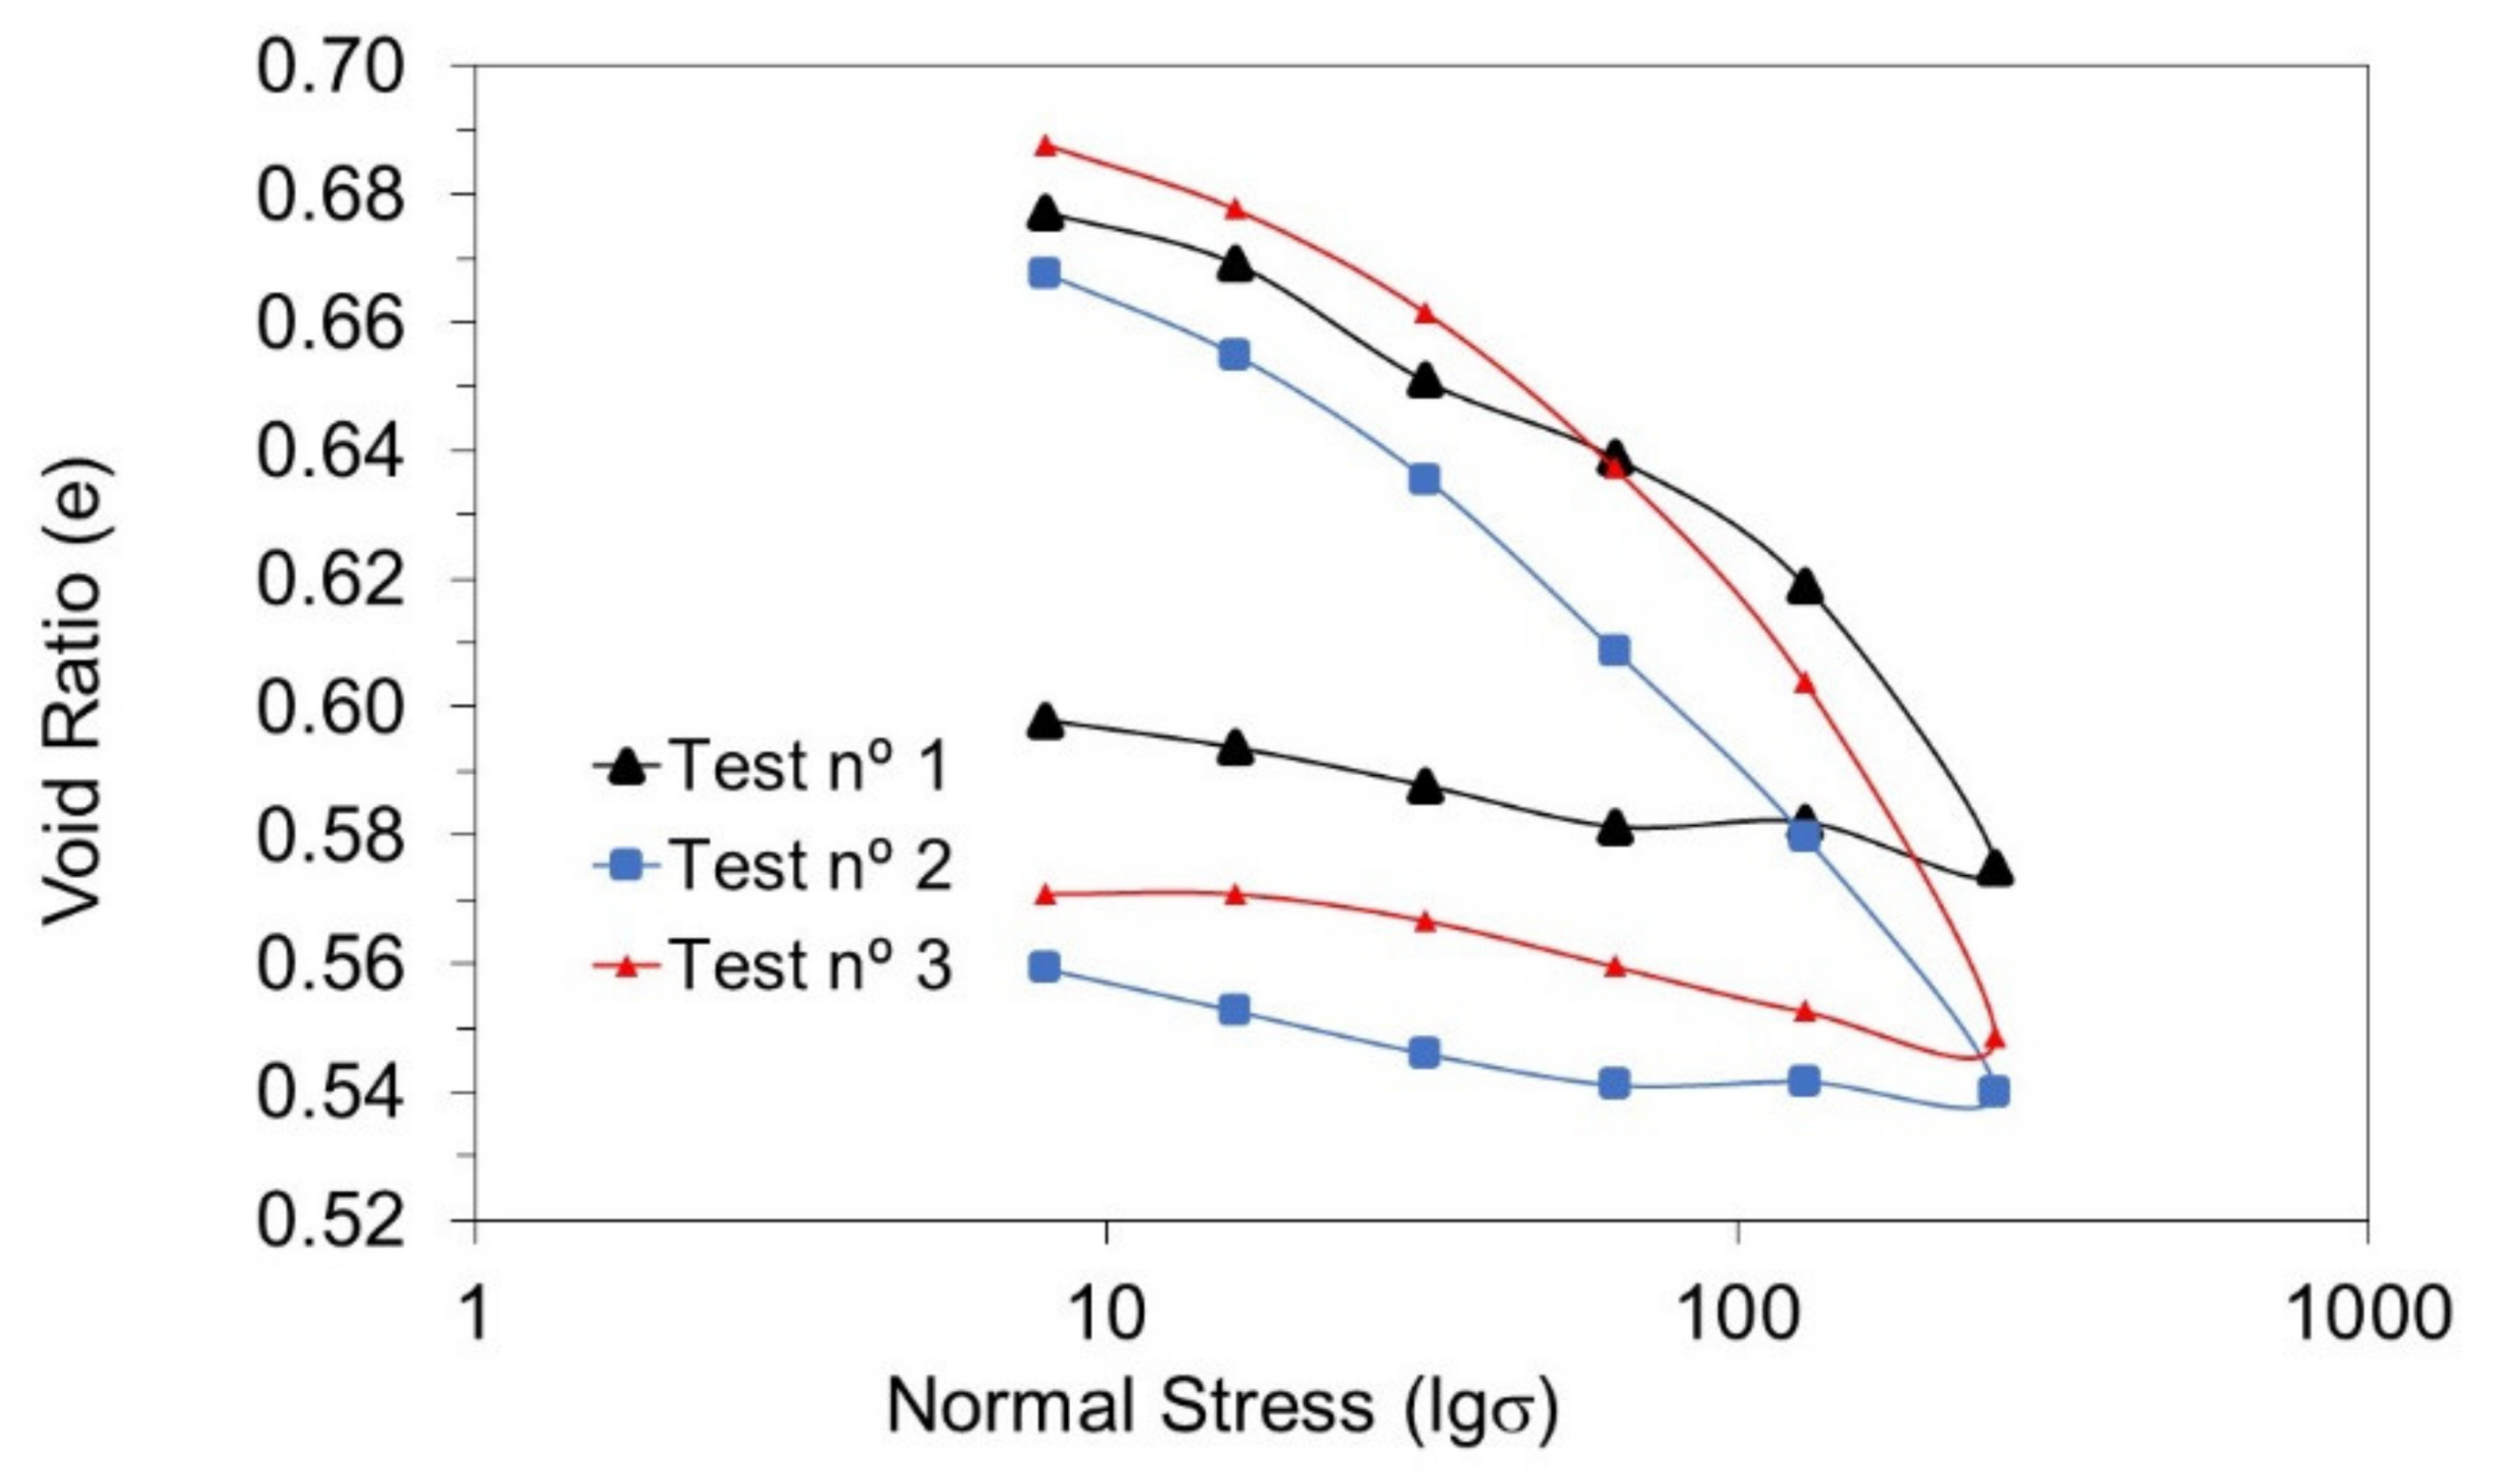
Figure 13 shows the oedometric curves for the wood pellets (void ratio on the ordinate axis and normal stress on the abscissa). As for the determination of Young’s modulus value, the discharge cycle values are those of greatest importance.

3.4. Determination of the Apparent Specific Weight

Table 7 shows change in apparent specific weight of the materials at different normal stresses.
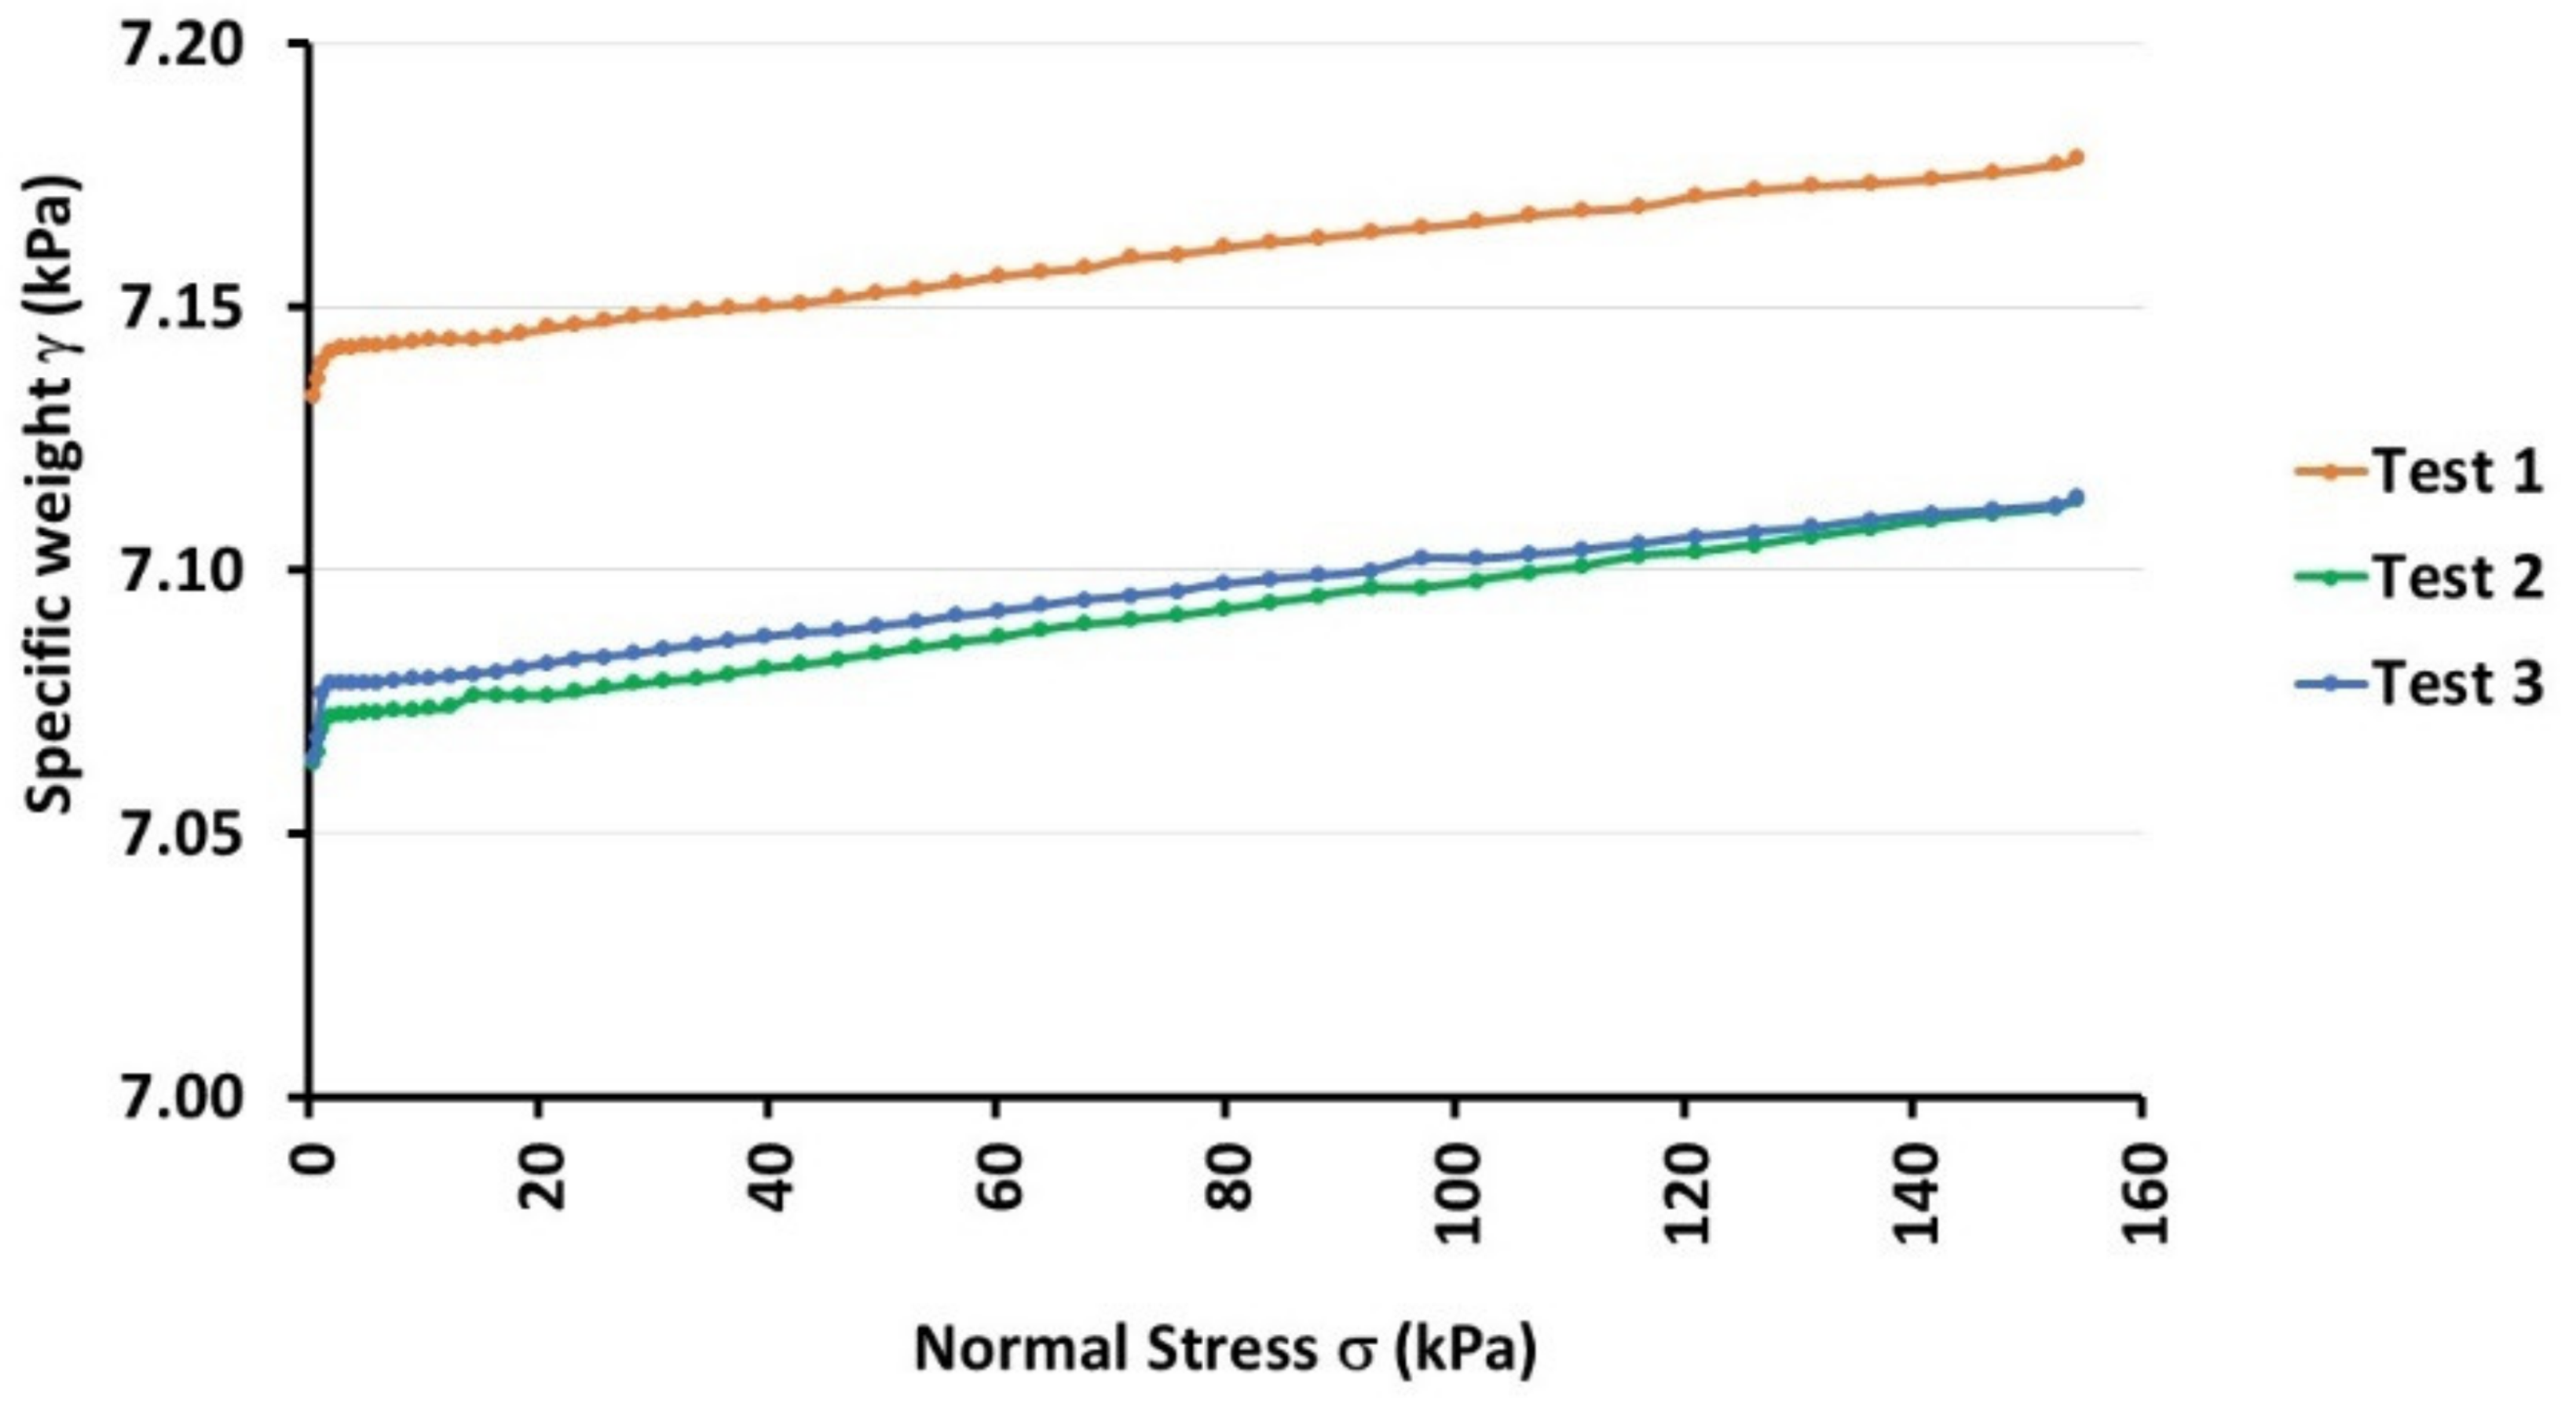
For the wood pellets, a normal stress of 200 kPa could not be reached after taking into account the particle–wall coefficient of friction with the interior of the normal Proctor mould. However, this is of little importance since the normal stress reference value is 100 kPa [36]. The wheat returned the highest apparent specific weight, with values always close to 8.0 kN/m3, followed by the maize (around 7.50 kN/m3) and finally the wood pellets (around 7.10 kN/m3). The apparent specific weight for all the materials increased by some 1% at the highest normal stress compared to 0 kPa.
Figure 14 shows the change in apparent specific weight for the wood pellets (by way of representation) with changing normal stress.

3.5. Determination of the Moisture Content

Table 8 shows the moisture content of the materials as determined by drying them to a constant weight at 105–110 °C.
The maize had the highest moisture content, followed by the wheat and the wood pellets.

4. Discussion

4.1. Direct Shear Assays

4.1.1. Internal Angle of Friction and Apparent Cohesion

For the wheat, the range of values obtained for the internal angle of friction lies over that reported in the literature (with values from 2 to 11% smaller [6,35,47], to around 11% higher [36,38]). For maize, the range is similar to that reported by Horabik et al. [48] and Moya et al. [36], 9% higher than that recorded by Molenda and Horabik [47], and 11% higher than that determined by Lebègue and Boudakian [5]. For the wood pellets, the range reaches 55% higher than that reported by Gallego et al. [49] but is similar to that reported by Wu et al. [50] (who used 6–12 mm-long pellets similar to the present material). Knowing the internal angle of friction for wood pellets is important since it correlates with durability and the resistance to shearing; the greater the resistance to shearing, the greater the possibility that the particles maintain their shape and remain intact during transport and storage [51]. For all three materials, the differences between the present and previously published results might be explained by differences in the moisture content, the bulk density, the consolidation time (there was none in the present work), the shape of the particles, the orientation of the particles within the shear box, the arrangement of the particles and the formation of shear bands [47]. It has also been reported that the mechanical properties of maize, especially the particle thickness, may influence the rupture of the material [52].
For the wheat, the present range of values for the apparent cohesion is notably higher than that reported by other authors [6,35,36,38,47]. Unlike in these latter reports, the apparent cohesion cannot, therefore, be considered negligible. Similarly, the range determined for the maize is higher than that reported by Molenda and Horabik [47] but within that reported by Moya et al. [36]. The range for the pellets could not be compared to any previously published values (when using numerical methods, it is not usually considered an important variable for this type of material). The moisture content may account for the above discrepancies between reports; the assay speed may also have a little influence [38], as may the shape of the particles and their orientation in the shear box during an assay [35].

4.1.2. Dilatancy Angle

For the wheat, the range of dilatancy angle values lies within that reported by some authors [35,36,38,53] but is below that reported by yet others [37]. The range for the maize falls within that reported by Moya et al. [36]. Once again, the range of the pellets cannot be compared with any other; the literature contains no information. The results show that, for all three materials, as the normal stress rises, the dilatancy angle decreases, confirming that reported by Zeng et al. [53]. The latter authors also showed that the void index decreases with rising normal stress.

4.1.3. Particle–Wall Coefficient of Friction

For the wheat, the range of values for the particle–wall coefficient of friction is higher (by some 16–21%) than that reported by other authors [11,35,36] but similar to that published by yet others [47]. The values recorded for the maize exceed those reported in the literature [36,47,54]; the same is true for the wood pellets [50]. These discrepancies might be explained in the same manner as described for the internal angle of friction.

4.2. Triaxial Tests

4.2.1. Free Lateral Deformation Assays

For the wheat, the values for the internal angle of friction recorded in the FLD tests were some 5–11% smaller than those reported by other authors [6,35,36,38,53], both at 10% and 20% axial deformation. In contrast, the values for the maize are more than double those reported in the literature [35]. For the wood pellets, they are 10–28% higher than reported by other authors [49,50]. A comparison of the values obtained in the direct shear test with those obtained in the triaxial tests shows those recorded for the wheat in the latter to be 10° (58%) lower, a finding in stark contrast to that reported by other authors when using similar materials [38], and rather more similar to that seen for sand. However, for the maize and wood pellets, the values obtained in the triaxial tests were notably higher than those obtained in the direct shear assays (17° [60%] and 14° [31%], respectively), similar to that previously reported [35] (and therefore quite different to that seen for sand). The factors that might explain the variation between the present and published results are the same as outlined above for the direct shear assay.
For the wheat, the apparent cohesion values are similar to those reported by other authors [6,35,36,38]; since they did not reach 10 kPa, the apparent cohesion for wheat can be considered negligible. For the maize, the values were smaller than those reported by others [36]; since they were close to 10 kPa, the apparent cohesion for maize can also be deemed negligible. For the wood pellets, a maximum value of −22.73 kPa was recorded. There are no results in the literature with which to compare this, but considering the differences observed in the results obtained for this parameter in both direct shear tests and triaxial tests, it would be wise not to regard the apparent cohesion for this material as negligible. The factors that affect these values are the same as those affecting the internal angle of friction, but the moisture content, the orientation of the particles during the assay and the type of particle are likely the most important.

4.2.2. K0 Assays

For the wheat, the Poisson’s ratio recorded at the normal stresses exerted (100, 200 and 300 kPa) coincides with values in some reports [36,38,55] but is some 16–18% higher than those recorded in other work [6,35,36,38,47,56]. For the maize, they were similar to values reported by other authors [47] but up to 67% smaller than those reported by yet others [36]. The literature contains no values with which to compare those recorded for the wood pellets.
The possible explanations for these discrepancies are the same as outlined for the FLD tests, although the orientation and arrangement of the particles might be the most important.

4.3. Oedometric Assays

The Young’s modulus values recorded for the wheat at a normal stress of 100 kPa are similar to those reported by other authors [35] but 100–150% higher than those reported by yet others [6,36,47]. For the maize, the values at 100 kPa were similar to those reported in other work [36] but 30–80% higher than those reported by other authors [47]. For the wood pellets, the value of 21,330 kPa recorded at 100 kPa is 73% lower than that reported in other work [49], although the latter authors worked with individual pellets. These discrepancies might be explained by differences in the arrangement of the particles in the sample vessel and their moisture content.

4.4. Apparent Specific Weight

For the wheat, the apparent specific weight values recorded ranged from 7.98 to 8.05 kN/m3, i.e., within the range reported in numerous studies [3,5,35,36,38,47,48,55,56,57]. Those for maize ranged from 7.47 to 7.55 kN/m3, again similar to those reported by many other authors [5,36,47,48,54,58]. For the wood pellets, values of 7.08–7.13 kN/m3 were recorded, similar to those reported in certain official documents [58] and slightly higher than those reported in other studies [50,51]. The discrepancy might be explained in terms of the arrangement of the particles in the normal Proctor mould, their moisture content and differences in the materials tested (which may not have been exactly the same).

4.5. Moisture Content

The moisture contents of the samples are similar to those reported by other authors [3,5,58]. Limits (<10%) exist for the moisture content of wood pellets in order to guarantee their quality [58] (the pellets in the present work met this criterion).
Table 9 shows the recommended values for the different mechanical properties of the tested materials, as determined from the present results. These values are the means of those recorded in the different assays, except for the dilatancy angle and the Poisson’s ratio, for which the maximum values are provided. These values might serve as references for future work.

5. Conclusions

For all three materials, the values for the internal angle of friction, the particle–wall coefficient of friction and the apparent specific weight were similar to those reported in the literature.
For the maize and wood pellets, the internal angle of friction determined by the direct shear assay was notably smaller than that determined in the triaxial tests. The orientation and arrangement of the particles during the assays might explain this discrepancy.
For all three materials, the particle–wall coefficient of friction was similar to, or higher than that reported in the literature. The type of material actually used in different studies might account for these discrepancies.
This is the first work to report the Young’s modulus and dilatancy angle for wood pellets; the results for other properties of this material were similar to those in the literature.
Finally, the present work provides recommended values for the studied properties that can be used in the calculation of silo pressures using numerical methods (either finite or discrete element techniques).

Author Contributions

Conceptualization, M.M.; methodology, M.M. and J.R.V.-G.; software, M.M.; validation, M.M., J.R.V.-G. and D.S.; formal analysis, M.M. and D.S.; investigation, M.M., J.R.V.-G. and D.S.; data curation, M.M. and D.S.; writing—original draft preparation, M.M.; writing—review and editing, M.M., J.R.V.-G. and D.S.; supervision, M.M., J.R.V.-G. and D.S.; funding acquisition, M.M. and J.R.V.-G. All authors have read and agreed to the published version of the manuscript.

Funding

This research and APC was funded by the Spanish “Agencia Estatal de Investigación” via the research project “Study of the structural behavior of corrugated wall silos using Discrete Element Models (SILODEM)”, grant number PID2019-107051GB-I00/AEI/10.13039/501100011033.

Institutional Review Board Statement

Not applicable.

Informed Consent Statement

Not applicable.

Data Availability Statement

Not applicable.

Acknowledgments

The authors thank COTERRAM for providing the wood pellets used in this research.

Conflicts of Interest

The authors declare no conflict of interest. The funders had no role in the design of the study; in the collection, analyses, or interpretation of data; in the writing of the manuscript, or in the decision to publish the results.

References

  1. Janssen, H. Versuche Über Getreidebruck in Silozellen. Z. Des Ver. Dtsch. Ing. 1895, 39, 1045–1049. [Google Scholar]
  2. Bucklin, R.A.; Thompson, S.A.; Ross, I.J.; Biggs, R.H. Apparent Dynamic Coefficient of Friction of Corn on Galvanized Steel Bin Wall Material. Trans. Am. Soc. Agric. Eng. 1993, 36, 1915–1918. [Google Scholar] [CrossRef]
  3. Bucklin, R.A.; Molenda, M.; Bridges, T.C.; Ross, I.J. Slip-Stick Frictional Behavior of Wheat on Galvanized Steel. Trans. Am. Soc. Agric. Eng. 1996, 39, 649–653. [Google Scholar] [CrossRef]
  4. Degoutte, G. Caractérisation En Laboratoire Des Propriétés Physiques et Mécaniques Des Matiéres Ensilées. Constr. Métallique 1989, 2, 91–95. [Google Scholar]
  5. Lebègue, Y.; Boudakian, A. Bases Des Règles « Silos » Du SNBATI—Essais Sur Les Produits et Principes Des Formules « Silos ». Ann. ITBTP 1989, 476, 69–113. [Google Scholar]
  6. Molenda, M.; Stasiak, M.; Moya, M.; Ramirez, A.; Horabik, J.; Ayuga, F. Testing Mechanical Properties of Food Powders in Two Laboratories—Degree of Consistency of Results. Int. Agrophys. 2006, 20, 37–45. [Google Scholar]
  7. Molenda, M.; Thompson, S.A.; Ross, I.J. Friction of Wheat on Corrugated and Smooth Galvanized Steel Surfaces. J. Agric. Eng. Res. 2000, 77, 209–219. [Google Scholar] [CrossRef]
  8. Moysey, E.; Lambert, E.; Wang, Z. Flow Rates of Grains and Oilseeds through Sharp-Edged Orificesitle. Trans. Am. Soc. Agric. Eng. 1988, 31, 226–231. [Google Scholar] [CrossRef]
  9. Ramírez, A.; Moya, M.; Ayuga, F. Determination of the Mechanical Properties of Powdered Agricultural Products and Sugar. Part. Part. Syst. Charact. 2010, 26, 220–230. [Google Scholar] [CrossRef]
  10. Thompson, S.A.; McNeill, S.G.; Ross, I.J.; Bridges, T.C. Packing Factors of Whole Grains in Storage Structures. Trans. Am. Soc. Agric. Eng. 1987, 3, 215–221. [Google Scholar] [CrossRef]
  11. Thompson, S.A.; Bucklin, R.A.; Batich, C.D. Variation in the Apparent Coefficient of Friction of Wheat on Galvanized Steel. Trans. Am. Soc. Agric. Eng. 1988, 31, 1518–1524. [Google Scholar] [CrossRef]
  12. Zhang, Q.; Li, Y.; Puri, V.M.; Manbeck, H.B. Physical Properties Effect on Stress-Strain Behavior of Wheat En Masse—Part II. Constitutive Elastoplastic Parameter Dependence on Initial Bulk Density and Moisture Content. Trans. Am. Soc. Agric. Eng. 1989, 32, 203–209. [Google Scholar] [CrossRef]
  13. Zhang, Q.; Britton, M.G.; Kieper, R.J. Interactions between Wheat and a Corrugated Steel Surface. Trans. Am. Soc. Agric. Eng. 1994, 37, 951–956. [Google Scholar] [CrossRef]
  14. Jofriet, J.C.; Lelievre, B.; Fwa, T.F. Friction Model for Finite Element Analyses of Silos. Trans. Am. Soc. Agric. Eng. 1977, 20, 735–740. [Google Scholar] [CrossRef]
  15. Ooi, J.Y.; Chen, J.F.; Lohnes, R.A.; Rotter, J.M. Prediction of Static Wall Pressures in Coal Silos. Constr. Build. Mater. 1996, 10, 109–116. [Google Scholar] [CrossRef]
  16. Ayuga, F.; Guaita, M.; Aguado, P. Static and Dynamic Silo Loads Using Finite Element Models. J. Agric. Eng. Res. 2001, 78, 299–308. [Google Scholar] [CrossRef]
  17. Vidal, P.; Gallego, E.; Guaita, M.; Ayuga, F. Simulation of the Filling Pressures of Cylindrical Steel Silos with Concentric and Eccentric Hoppers Using 3-Dimensional Finite Element Models. Trans ASABE 2006, 49, 1881–1895. [Google Scholar] [CrossRef]
  18. Holst, J.; Doerich, C.; Rotter, J. Accurate Determination of the Plastic Collapse Loads of Shells When Using Finite Element Analyses; Elsevier: Oxford, UK, 2005; ISBN 9780080446370. [Google Scholar]
  19. Rotter, J.M.; Holst, J.M.F.G.; Ooi, J.Y.; Sanad, A.M. Silo Pressure Predictions Using Discrete-Element and Finite-Element Analyses. Philos. Trans. R. Soc. A Math. Phys. Eng. Sci. 1998, 356, 2685–2712. [Google Scholar] [CrossRef]
  20. Höhner, D.; Wirtz, S.; Scherer, V. Experimental and Numerical Investigation on the Influence of Particle Shape and Shape Approximation on Hopper Discharge Using the Discrete Element Method. Powder Technol. 2013, 235, 614–627. [Google Scholar] [CrossRef]
  21. Zheng, Z.; Zang, M.; Chen, S.; Zhao, C. An Improved 3D DEM-FEM Contact Detection Algorithm for the Interaction Simulations between Particles and Structures. Powder Technol. 2017, 305, 308–322. [Google Scholar] [CrossRef]
  22. Weinhart, T.; Labra, C.; Luding, S.; Ooi, J.Y. Influence of Coarse-Graining Parameters on the Analysis of DEM Simulations of Silo Flow. Powder Technol. 2016, 293, 138–148. [Google Scholar] [CrossRef]
  23. Liu, Y.; Liu, H.; Mao, H. DEM Investigation of the Effect of Intermediate Principle Stress on Particle Breakage of Granular Materials. Comput. Geotech. 2017, 84, 58–67. [Google Scholar] [CrossRef]
  24. González-Montellano, C.; Ayuga, F.; Ooi, J.Y. Discrete Element Modelling of Grain Flow in a Planar Silo: Influence of Simulation Parameters. Granul. Matter 2011, 13, 149–158. [Google Scholar] [CrossRef]
  25. González-Montellano, C.; Gallego, E.; Ramírez-Gómez, A.; Ayuga, F. Three-Dimensional Discrete Element Models for Simulating the Filling and Emptying of Silos: Analysis of Numerical Results. Comput. Chem. Eng. 2012, 40, 22–32. [Google Scholar] [CrossRef]
  26. Bagherzadeh Kh., A.; Mirghasemi, A.A.; Mohammadi, S. Numerical Simulation of Particle Breakage of Angular Particles Using Combined DEM and FEM. Powder Technol. 2011, 205, 15–29. [Google Scholar] [CrossRef]
  27. Zhang, Q.; Britton, M.G. A Micromechanics Model for Predicting Dynamic Loads during Discharge in Bulk Solids Storage Structures. Can. Biosyst. Eng. Le Genie Des Biosyst. Au Can. 2003, 45, 5.21–5.27. [Google Scholar]
  28. Kobyłka, R.; Molenda, M. DEM Modelling of Silo Load Asymmetry Due to Eccentric Filling and Discharge. Powder Technol. 2013, 233, 65–71. [Google Scholar] [CrossRef]
  29. Couto, A.; Ruiz, A.; Aguado, P.J. Experimental Study of the Pressures Exerted by Wheat Stored in Slender Cylindrical Silos, Varying the Flow Rate of Material during Discharge. Comparison with Eurocode 1 Part 4. Powder Technol. 2013, 237, 450–467. [Google Scholar] [CrossRef]
  30. Gallego, E.; Ruiz, A.; Aguado, P.J. Simulation of Silo Filling and Discharge Using ANSYS and Comparison with Experimental Data. Comput. Electron. Agric. 2015, 118, 281–289. [Google Scholar] [CrossRef]
  31. Wang, X.; Liang, C.; Guo, X.; Chen, Y.; Liu, D.; Ma, J.; Chen, X.; An, H. Experimental Study on the Dynamic Characteristics of Wall Normal Stresses during Silo Discharge. Powder Technol. 2020, 363, 509–518. [Google Scholar] [CrossRef]
  32. Ruiz, A.; Couto, A.; Aguado, P.J. Design and Instrumentation of a Mid-Size Test Station for Measuring Static and Dynamic Pressures in Silos under Different Conditions—Part II: Construction and Validation. Comput. Electron. Agric. 2012, 85, 174–187. [Google Scholar] [CrossRef]
  33. Wójcik, M.; Tejchman, J.; Enstad, G.G. Confined Granular Flow in Silos with Inserts—Full-Scale Experiments. Powder Technol. 2012, 222, 15–36. [Google Scholar] [CrossRef] [Green Version]
  34. Wójcik, M.; Sondej, M.; Rejowski, K.; Tejchman, J. Full-Scale Experiments on Wheat Flow in Steel Silo Composed of Corrugated Walls and Columns. Powder Technol. 2017, 311, 537–555. [Google Scholar] [CrossRef]
  35. Moya, M.; Guaita, M.; Aguado, P.; Ayuga, F. Mechanical Properties of Granular Agricultural Materials, Part 2. Trans. ASABE 2006, 49, 479–489. [Google Scholar] [CrossRef]
  36. Moya, M.; Aguado, P.J.; Ayuga, F. Mechanical Properties of Some Granular Agricultural Materials Used in Silo Design. Int. Agrophys. 2013, 27, 181–193. [Google Scholar] [CrossRef]
  37. Zeng, C.; Wang, Y. The Shear Strength and Dilatancy Behavior of Wheat Stored in Silos. Complexity 2019, 2019, 1547616. [Google Scholar] [CrossRef] [Green Version]
  38. Moya, M.; Ayuga, F.; Guaita, M.; Aguado, P.J. Mechanical Properties of Granular Agricultural Materials. Trans. ASAE 2002, 45, 1569–1577. [Google Scholar] [CrossRef]
  39. UNE-EN ISO 17892-10; Geotechnical Investigation and Testing—Laboratory Testing of Soil—Part 10: Direct Shear Tests. Asociación Española de Normalización: Madrid, Spain, 2018.
  40. UNE-EN-1991-4: 2011/AC; Eurocode 1: Actions on Structures—Part 4: Silos and Tanks. [Eurocódigo 1: Acciones En Estructuras. Parte 4: Silos y Depósitos]. Asociación Española de Normalización: Madrid, Spain, 2013.
  41. Härtl, J.; Ooi, J.Y. Numerical Investigation of Particle Shape and Particle Friction on Limiting Bulk Friction in Direct Shear Tests and Comparison with Experiments. Powder Technol. 2011, 212, 231–239. [Google Scholar] [CrossRef]
  42. UNE-EN ISO 17892-8; Geotechnical Investigation and Testing—Laboratory Testing of Soil—Part 8: Unconsolidated Undrained Triaxial Test. Asociación Española de Normalización: Madrid, Spain, 2018.
  43. UNE-EN ISO 17892-5; Geotechnical Investigation and Testing—Laboratory Testing of Soil—Part 5: Incremental Loading Oedometer Test. Asociación Española de Normalización: Madrid, Spain, 2017.
  44. UNE-EN ISO 17892-2; Geotechnical Investigation and Testing—Laboratory Testing of Soil—Part 2: Determination of Bulk Density. Asociación Española de Normalización: Madrid, Spain, 2014.
  45. UNE-EN ISO 17892-1; Geotechnical Investigation and Testing—Laboratory Testing of Soil—Part 1: Determination of Water Content. Asociación Española de Normalización: Madrid, Spain, 2015.
  46. UNE-EN ISO 18134-2; Solid Biofuels. Determination of Moisture Content. Oven Dry Method—Part 2: Total Moisture. Simplified Method. Asociación Española de Normalización: Madrid, Spain, 2017.
  47. Molenda, M.; Horabik, J. Mechanical Properties of Granular Agro-Materials and Food Powders for Industrial Practice. Part I: Characterization of Mechanical Properties of Particulate Solids for Storage and Handling; Horabik, J., Laskowski, J., Eds.; Institute of Agrophysics Polish Academy of Science: Lublin, Poland, 2005. [Google Scholar]
  48. Horabik, J.; Molenda, M.; Ross, I.J. Comparison of Load Distribution in Two Similar Grain Bins. Trans. ASAE 1995, 38, 1875–1879. [Google Scholar] [CrossRef]
  49. Gallego, E.; Fuentes, J.M.; Ruiz, Á.; Hernández-Rodrigo, G.; Aguado, P.; Ayuga, F. Determination of Mechanical Properties for Wood Pellets Used in DEM Simulations. Int. Agrophys. 2020, 34, 485–494. [Google Scholar] [CrossRef]
  50. Wu, M.R.; Schott, D.L.; Lodewijks, G. Physical Properties of Solid Biomass. Biomass Bioenergy 2011, 35, 2093–2105. [Google Scholar] [CrossRef]
  51. Tumuluru, J.S. Specific Energy Consumption and Quality of Wood Pellets Produced Using High-Moisture Lodgepole Pine Grind in a Flat Die Pellet Mill. Chem. Eng. Res. Des. 2016, 110, 82–97. [Google Scholar] [CrossRef] [Green Version]
  52. Kruszelnicka, W. Study of Selected Physical-Mechanical Properties of Corn Grains Important from the Point of View of Mechanical Processing Systems Designing. Materials 2021, 14, 1467. [Google Scholar] [CrossRef] [PubMed]
  53. Zeng, C.; Gu, H.; Wang, Y. Stress-Strain Response of Sheared Wheat Granular Material Stored in Silos Using Triaxial Compression Tests. Int. Agrophys. 2020, 34, 103–114. [Google Scholar] [CrossRef]
  54. Thompson, S.A.; Galili, N.; Williams, R.A. Floor and Wall Pressures in a Full-Scale Corrugated Grain Bin during Unloading. Trans. ASAE 1998, 41, 1799–1805. [Google Scholar]
  55. Shan, Y. Structural Loads in a Model Grain Bin during Drying of Stored Grain with Near-Ambient Air. Master’s Thesis, University of Manitoba, Winnipeg, MB, Canada, 1996. [Google Scholar]
  56. Cheng, X.; Zhang, Q.; Shi, C.; Yan, X. Model for the Prediction of Grain Density and Pressure Distribution in Hopper-Bottom Silos. Biosyst. Eng. 2017, 163, 159–166. [Google Scholar] [CrossRef]
  57. Reimbert, M.; Reimbert, A. Silos.Theory and Practice; Lavoisier: Paris, France, 1987; ISBN 9782852063655. [Google Scholar]
  58. European Pellet Council (EPC). Handbook ENplus. Quality Certification Scheme for Wood Pellets. Spanish Version. Part 3: Quality Requirements. [Manual ENplus. Esquema de Certificación de Calidad Para Pellets de Madera. Versión Para España. Parte 3: Requisitos de Calidad]; European Biomass Association: Brussels, Belgium, 2015. [Google Scholar]
Figure 1. Samples of wood pellets (left), maize (centre) and wheat (right).
Agronomy 12 01261 g001
Figure 2. Semi-automatic direct shear test device.
Agronomy 12 01261 g002
Figure 3. The triaxial test device and multiuse press used. (a) Complete apparatus; (b) Detail showing the use of the device’s 101.6 mm specimen vessel during an assay.
Agronomy 12 01261 g003
Figure 4. Apparatus used in oedometric assays.
Agronomy 12 01261 g004
Figure 5. A sample of wood pellets inside one of the oedometric cells.
Agronomy 12 01261 g005
Figure 6. Normal Proctor mould in the multiuse press, used to determine the apparent specific weight of the test materials under normal stress.
Agronomy 12 01261 g006
Figure 7. Regression line for the Mohr–Coulomb strength envelope for wheat obtained from direct shear assays.
Agronomy 12 01261 g007
Figure 8. Stress-deformation curve for the wood pellets: (a) at a normal stress of 20 kPa; (b) at a normal stress of 100 kPa.
Agronomy 12 01261 g008
Figure 9. Deformation curves for the wood pellets at (a) 100 kPa normal stress and (b) 20 kPa normal stress.
Agronomy 12 01261 g009
Figure 10. Deformation curves for the wood pellets at the different normal stresses assayed.
Agronomy 12 01261 g010
Figure 11. Particle–wall coefficient of friction obtained for maize in direct shear assays.
Agronomy 12 01261 g011
Figure 12. Regression lines for the FLD of the wheat and wood pellets obtained at axial deformations of 10% and 20%: (a) wheat, (b) wood pellets.
Agronomy 12 01261 g012
Figure 13. Oedometric curves obtained for the wood pellets in the oedometric assays.
Agronomy 12 01261 g013
Figure 14. Change in apparent specific weight for the wood pellets with changing normal stress.
Agronomy 12 01261 g014
Table 1. Mean ± standard deviation for the internal angle of friction and the apparent cohesion of the tested materials.
MaterialInternal Angle of Friction (ϕ)Apparent Cohesion (C, kPa)
Wheat24.0 ± 0. 613.12 ± 30.19
Maize29.0 ± 0.913.99 ± 26.25
Wood pellets40.7 ± 1.223.02 ± 27.89
Table 2. Dilatancy angles obtained for each material under the different normal stresses assayed.
MaterialDilatancy Angle (ψ)
20 kPa30 kPa100 kPa200 kPa300 kPa
Wheat19.7 ± 7.213.7 ± 1.07.4 ± 1.76.0 ± 2.14.2 ± 1.2
Maize33.6 ± 2.331.9 ± 4.315.3 ± 2.614.3 ± 1.48.8 ± 0.6
Wood pellets36.4 ± 4.833.2 ± 3.222.8 ± 3.415.7 ± 2.510.4 ± 1.2
Table 3. Particle–wall coefficient of friction for the three materials examined.
MaterialParticle–Wall Coefficient of Friction (μ)
Wheat0.29 ± 0.01
Maize0.34 ± 0.04
Wood pellets0.52 ± 0.06
Table 4. Internal angle of friction and apparent cohesion of the tested materials obtained in the triaxial tests at deformations of 10% and 20%.
MaterialInternal Angle of Friction (ϕ)Apparent Cohesion (C, kPa)
Axial Deformation
10%20%10%20%
Wheat14.6 ± 0.516.4 ± 0.33.34 ± 13.20−1.88 ± 6.54
Maize46.7 ± 0.147.6 ± 0.3−10.11 ± 9.55−13.29 ± 12.26
Wood pellets50.5 ± 2.154.6 ± 0.3−22.73 ± 1.66−28.68 ± 20.66
Table 5. Poisson’s ratio for the three materials at the three confinement pressures used in the K0 assays.
MaterialPoisson’s Ratio (ν)
100 kPa200 kPa300 kPa
Wheat0.39 ± 0.010.38 ± 0.000.37 ± 0.01
Maize0.18 ± 0.040.15 ± 0.020.14 ± 0.01
Wood pellets0.13 ± 0.010.12 ± 0.010.12 ± 0.02
Table 6. Young’s modulus for the different materials as obtained in the oedometric assays. Values are expressed in kPa.
Normal Stress (kPa)Material
WheatMaizeWood Pellets
Loading cycle81405 ± 290.61350 ± 148.51067 ± 363.2
16977 ± 87.91793 ± 172.51146 ± 418.5
321418 ± 137.52331 ± 530.51265 ± 185.3
642620 ± 352.33476 ± 511.82549 ± 1480.5
1284321 ± 733.34714 ± 511.53446 ± 1650.0
2568693 ± 1629.27319 ± 355.44739 ± 257.4
Unloading
cycle
12851,720 ± 1011.244,476 ± 10172.627,495 ± 215.7
6418,883 ± 997.722,349 ± 3268.113,404 ± 38.2
3214,677 ± 1793.920,518 ± 16780.79674 ± 2031.3
168767 ± 208.66047 ± 804.13868 ± 379.7
83476 ± 72.83660 ± 1200.72363 ± 754.5
Table 7. Change in apparent specific weight of the materials at different normal stresses.
MaterialApparent Specific Weight γ (kN/m3)
Normal Stress (kPa)
0255075100125150200
Wheat7.98 ± 0.108.02 ± 0.088.03 ± 0.088.03 ± 0.088.03 ± 0.088.04 ± 0.088.04 ± 0.088.05 ± 0.08
Maize7.47 ± 0.047.51 ± 0.057.51 ± 0.067.52 ± 0.057.52 ± 0.057.53 ± 0.067.53 ± 0.067.55 ± 0.06
Wood pellets7.08 ± 0.047.10 ± 0.047.11 ± 0.037.12 ± 0.047.12 ± 0.047.13 ± 0.037.13 ± 0.04----
Table 8. Moisture content of the materials.
MaterialMoisture Content (%)
Wheat9.78
Maize12.77
Wood pellets6.38
Table 9. Recommended values for the different mechanical properties of the tested materials.
Materialϕ
(°)
C
(kPa)
Ψ
(°)
μ
Steel
νE
(kPa)
γap
(kN/m3)
H
(%)
Wheat19.36.619.70.290.3937,3508.039.78
Maize38.87.033.60.340.1834,8007.5212.77
Wood
pellets
47.711.536.40.520.1321,3307.126.38
Publisher’s Note: MDPI stays neutral with regard to jurisdictional claims in published maps and institutional affiliations.