Abstract
Agricultural non-point source pollution has emerged as a significant driver of declining global water quality in recent years. Ditch systems hold considerable promise for trapping and purifying pollutants. However, the persistent challenge has been the limited availability of carbon sources in drainage water, which significantly hinders nitrogen (N) removal in ditches. This study investigated the dynamic changes in ammonia (NH4+) and nitrate (NO3−) levels caused by three cellulosic carbon additions (rice straw, coir, and sawdust) during both winter and summer seasons. Water column devices were used as containers, and the impacts on environmental factors and water denitrification rates were explored. Results demonstrated that the addition of straw exhibited the most effective N removal in winter and summer, and significantly enhanced water denitrification rates in a short timeframe, with the maximum denitrification rate reaching 1482.42 μmol·L−1·h−1. However, there was an observed accumulation of NH4-N and chemical oxygen demand (COD) in summer. Also, the addition of sawdust resulted in a notable increase in greenhouse gas emissions during the summer test. In conclusion, during the cooler seasons of winter and spring when temperatures are not as high, the combined use of various cellulosic carbon sources has the potential to enhance water denitrification and mitigate adverse environmental impacts, offering valuable applications for water quality improvement.
1. Introduction
As a major agricultural nation, China boasts an abundance of theoretical straw resources, estimated at over 805 million tons [1]. However, an alarming trend persists, with more than 20 billion tons of crop straw being either incinerated or left unused on-site each year. This not only leads to substantial resource wastage but also contributes to environmental pollution. Moreover, the long-standing practice of straw incineration poses threats to human health and social stability [2]. Cellulosic carbon, rich in lignin and cellulose-like compounds, typically possesses a robust texture and is hailed as a high-quality, slow-release solid carbon source due to its ample availability, cost-effectiveness, and its potential to enhance denitrification [3].
The hydrolysis of cellulose and hemicellulose in plant materials, triggered by soaking, results in the breakdown into various monosaccharide and polysaccharide molecules, which, in turn, provide energy for microbial decomposition. It is worth noting that the rate and quantity of carbon release vary among different types of plant materials [4,5]. Zhao et al. (2011) conducted a comparison of various ecological wetlands and found that wetland systems with a higher C/N ratio (greater than 5) exhibited significantly higher N removal rates [6]. An optimal C/N ratio supports enhanced N removal, but excessively high C/N ratios may lead to unstable electron consumption rates of denitrifying enzymes, causing more NO3−-N to convert into incomplete denitrification intermediates, NO2−-N and NO, thus inhibiting enzyme activity [7]. Moreover, Zhang et al. (2020) suggested that an increase in COD/N results in a higher peak accumulation of NO and N2O during denitrification, with accumulated concentrations of NO and N2O reaching 5.3 mg·L−1 and 32.8 mg·L−1, respectively, at a COD/N ratio of 10:1 [8]. According to He’s study (2015), ensuring a C/N ratio higher than 4:1 is crucial for complete denitrification in practical wastewater treatment. Cameron and Schipper compared nine organic carbon media and found that the highest nitrate removal rates were achieved with the addition of maize cobs (15.0~19.8 g N m−3·d−1) [9]. However, NH4+ and BOD concentrations experienced early-stage elevations, exceeding 10 and 100 mg·L−1, respectively [10]. The decomposition of straw also triggers a rapid increase in dissolved organic matter (DOM) in the water column, including various phenolic substances, leading to odors and potential toxicity, ultimately impacting plant photosynthesis and causing damage to plant roots and leaves. On the other hand, incomplete denitrification carries the risk of gas accumulation, particularly N2O, a potent greenhouse gas and potential ozone-depleting substance [11]. Thus, it is crucial to investigate the release of organic substances and greenhouse gas emissions, such as N2O and CH4, resulting from the addition of cellulosic carbon sources for practical applications.
Agricultural non-point source pollution has become an important driver of global water quality declining in recent years. Drainage ditches play a critical role in reducing N and phosphorus (P) nutrient levels in farmland drainage through processes like soil adsorption, plant uptake, and biodegradation. This helps to lower the overall nutrient load that enters receiving water bodies, thus mitigating the issue of eutrophication [12]. In contrast to paddy fields, dry land runoff and leachate tend to exhibit relatively high NO3− concentrations. Fan’s study (2015) found that NO3− losses in runoff were often higher than those of NH4+, sometimes reaching as high as 10 kg·hm−2 [13]. The application of cellulosic carbon source materials in ditches to promote denitrification of dry land drainage water and reduce N concentrations is an intriguing prospect. Yet, the potential risks associated with such applications remain uncertain and underexplored in current studies. In this study, we conducted a static water column experiment to focus on N removal and transformation in water bodies during both summer and winter, employing three carbon sources (rice straw, coir, and sawdust). We also assessed greenhouse gas emissions and their environmental impacts. This paper addresses the following issues:
- (1)
- Investigate the dynamic changes in ammonia/nitrate and greenhouse gas emissions in water bodies resulting from the addition of three cellulosic carbon sources during summer and winter.
- (2)
- Compare denitrification rates with different cellulosic carbon additions in simulating dry land drainage.
- (3)
- Assess environmental effects, primarily concerning phenolic acid and COD, associated with the introduction of cellulosic carbon.
2. Materials and Methods
2.1. Experiment Design
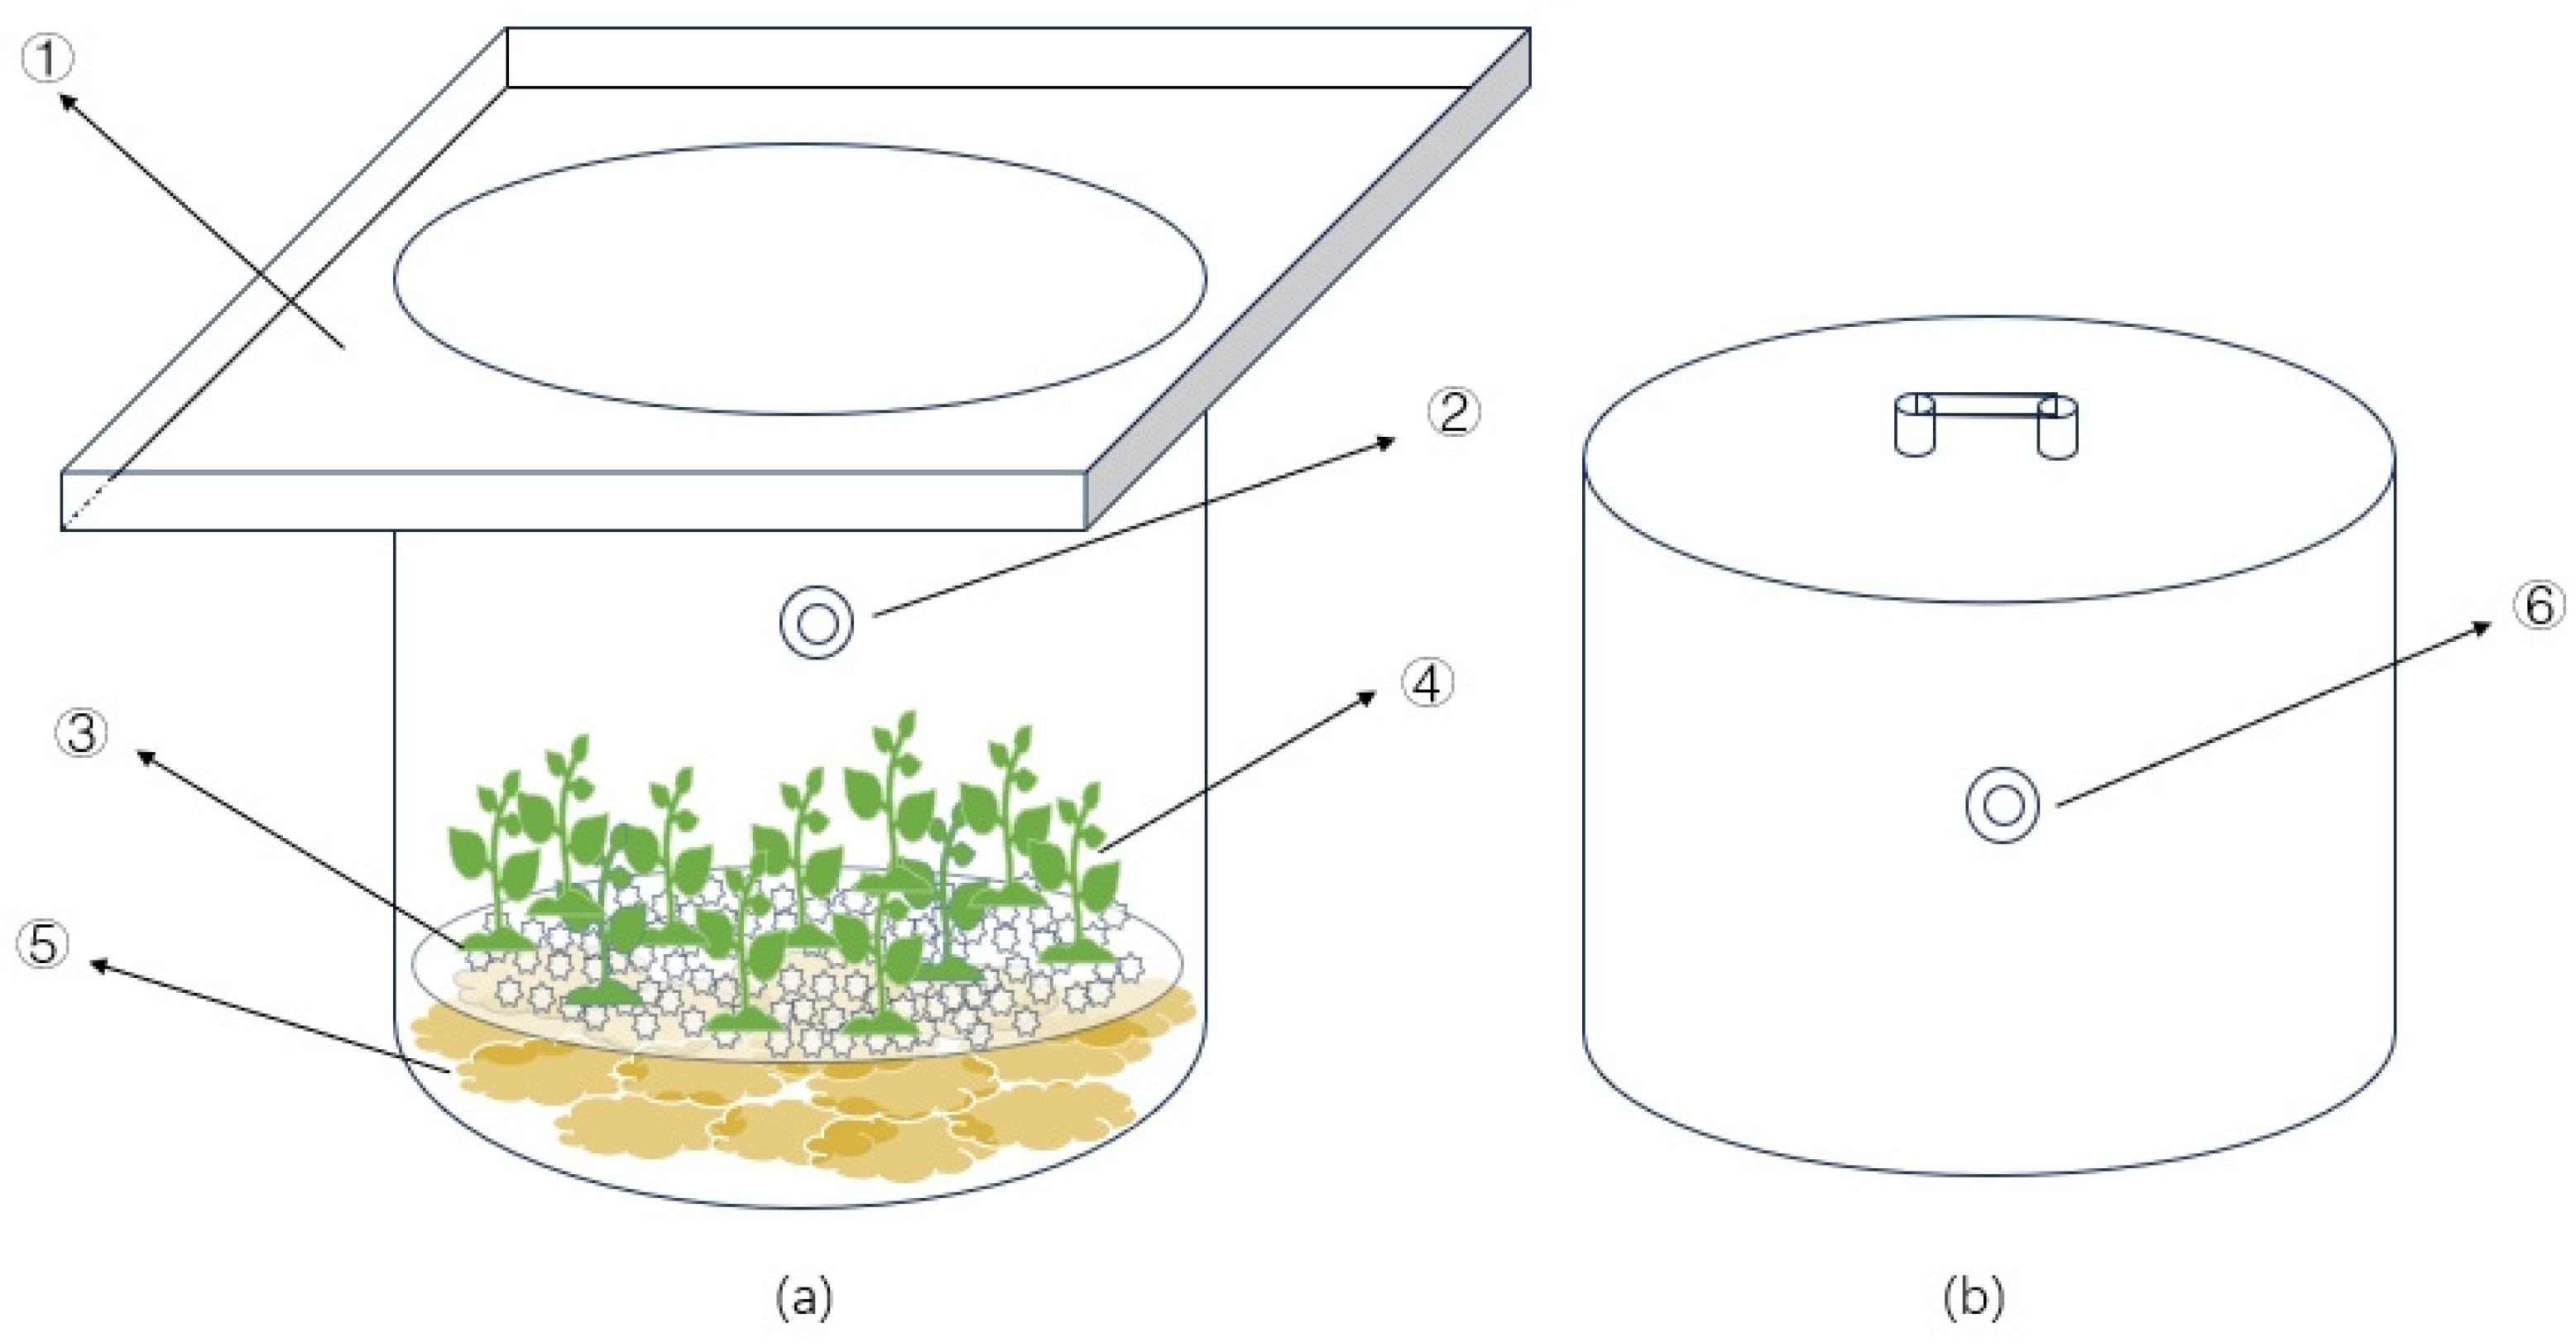
The experiment was carried out in a steel-framed shed located at the Jiangsu Academy of Agricultural Sciences in China. Rice straw, coir, and wood chips were used as cellulosic carbon sources. The rice straw was obtained from plant stalks preserved after the rice harvest at the experimental base. The coir was processed from coir bricks purchased from the market, and the wood chips were made from common pine shavings. These materials were cut into pieces of approximately 2–3 cm in length, and 200 g of each material was placed in a net bag. The net bags were then positioned at the bottom of a water column with a 355 mm inner diameter and a height of 500 mm (as shown in Figure 1). A tray containing 2 kg of quartz sand was placed on top of the net bags to ensure that the cellulosic carbon materials sank to the bottom. Subsequently, 10 g of pre-cultivated Vallisneria natans were planted in the quartz sand. Four treatment groups were established: Straw—with rice straw addition, Coir—with coconut shred addition, Sawdust—with wood chip addition, and CK—the control group with quartz sand and Vallisneria natans. The N, P, and potassium contents of the cellulosic carbon used in the experiment are presented in Table 1. Each treatment was replicated three times.

Figure 1.
Schematic diagram of test device (a) water column and (b) static box. Note: ①—The sink, ②—Water sampling port, ③—Quartz sand tray, ④—Plant, ⑤—Carbon source material, ⑥—Gas collection port.

Table 1.
N, P, and K of carbon sources in each treatment group (g·kg−1).
To simulate dry land drainage, potassium nitrate (analytically pure) was dissolved in tap water to achieve a total nitrogen (TN) concentration of 15 mg·L−1. The formal experiment began after allowing the influent to stand in the test device for 12 h. The experiment was divided into a winter test and a summer test (water temperature variations in the two seasons are given in Figure S1). To assess the long-term performance of the carbon sources, two stages were conducted for each test, each lasting for 15 days. At the end of the first stage, the water level in the container was reduced to approximately 200 mm, while keeping the carbon material and plants submerged in water.
Water samples were collected concurrently with greenhouse gas sampling. During the first three days of each stage, samples were collected daily, followed by one-day intervals, resulting in a total of nine sampling events for each stage. In the winter test, Stage I took place from 14 December to 18 December 2020, and Stage II occurred from 12 January to 26 January 2021, with sampling conducted between 13:00 and 15:00. In the summer test, Stage I was conducted from 16 June to 30 June 2021, and Stage II was carried out from 8 July to 22 July 2021, with sampling taking place between 8:00 and 10:00.
2.2. Sample Collection and Determination
Gas samples were collected and analyzed using the static box method. For the initial three days of the experiment, continuous monitoring was conducted over 72 h, and detection was limited to daytime hours (7:00–19:00) for the subsequent four days. Sampling was performed at two-hour intervals. The static tank, constructed from plexiglass, was equipped with a thermometer and a sampling port (as shown in Figure 1). A 5 cm wide water trough encircled the upper part of the water column. The static box was placed within this trough, and it was sealed with water during sampling. A double-headed valve was installed in the sampling port to ensure that the gas within the box remained isolated from the external atmosphere. Gas samples were withdrawn from the tank using a 20 mL syringe at 0, 10, 20, and 30 min after the tank was sealed. Before storage in a vacuum glass bottle, the syringe was pumped back and forth 3–4 times. These samples were subsequently transported to the laboratory for analysis. Simultaneously, the temperature inside the chamber was recorded. The concentrations of greenhouse gases were determined using an Agilent 7890A gas chromatograph with an FID detector for CH4 and an ECD detector for N2O. The detection temperature was set at 300 °C for both detectors, and 60 °C was set for the column chamber. Greenhouse gas emission fluxes were calculated as follows [14]:
where:
F = ρ·h·dc/dt·273/(273 + T)
F represents the greenhouse gas emission or absorption flux (mg·m−2·h−1),
ρ is the standard density of the gas (kg·m−3),
h is the effective height of the static box (m),
dc/dt is the change rate of the greenhouse gas concentration in the box with time,
T is the average temperature in the box (°C),
273 is the ideal gas constant.
The formula for calculating cumulative GHG emissions [15] is as follows:
where:
En is the cumulative emission of the measured gas (mg·m−2),
Fi is the emission flux of the greenhouse gas at the ith measurement,
(ti+1 − ti) represents the number of days between two adjacent samples, in days.
It is important to note that the global warming potentials of CH4 and N2O on a 100-year scale (GWP) are 25 and 298 times that of CO2, respectively [15]. Therefore, the combined greenhouse effect of these gases is calculated as follows:
GWP = En(N2O) × 298 + En(CH4) × 25
A sampling port was established 200 mm from the top of the water column, equipped with a silicone tube (50 cm) for water sampling. The silicone tube was sealed with a water stopper. During sampling, the water stopper was opened to slowly collect approximately 100 mL of water samples into a sampling bottle, which was then stored in a refrigerator at 4 °C after filtration. The TN, NO3−-N, and NH4+-N concentrations in the water column were determined using a SKALAR SAN++ SYSTEM flow analyzer (Netherlands SKALAR COMPANY, Breda, The Netherlands, purchased from Huizhou, Guangdong). COD was determined using a HACH COD analyzer (DR 1010 COD, Beijing, China), and phenolic acid was determined through a colorimetric method [16].
2.3. Denitrification Test
The assessment of denitrification rates was conducted through static tests during the summer. In-situ water samples were collected for isotope incubation treatment. Following incubation, the samples were refrigerated and subsequently analyzed for N2 isotope fraction using a membrane injection mass spectrometer.
2.3.1. Sample Collection and Cultivation
Water samples were collected at three different time points during each stage: day 1, day 7, and day 15. This was done using a rubber catheter and sealed 12 mL culture bottles (Labco Exetainer, Wycombe, UK) equipped with rubber gaskets. Before taking samples, the water stopper was opened to allow some water to flow out of the catheter, ensuring the absence of air bubbles and maintaining a uniform flow rate. Subsequently, the outlet pipe was extended to the bottom of the culture bottle, allowing water to gently fill the bottle from the bottom until it overflowed to occupy roughly half of the culture bottle’s volume. Afterward, the catheter was slowly withdrawn to eliminate any air bubbles inside the bottle. If air bubbles were observed, the samples were retaken. For each replicate, four samples were collected. Out of these four samples, one served as a blank sample, while the remaining three were designated for three different incubation periods: 0 h, 12 h, and 24 h.
To create an incubation system with a 15NO3− abundance of approximately 20%, a 60 μmol·L−1 solution of K15NO3− (with a 15N atomic abundance of 98.50%, obtained from the Shanghai Research Institute of Chemical Technology, Shanghai, China) was injected into the culture flask using a microinjection needle. The flask was kept airtight throughout this process. The reaction was halted by adding 10 μL of saturated ZnCl2 to the blank sample and the sample incubated for 0 h immediately. For the remaining samples, ZnCl2 was added at the end of each respective incubation period to deactivate and store the samples. The pre-incubation procedures were conducted in the absence of light, and the incubation phase was carried out at room temperature in a thermostat while protecting the samples from light.
2.3.2. Calculation of the Conversion of Electronic Signal Values and Concentrations
A Membrane Inlet Mass Spectrometer (MIMS) is an analytical instrument used to analyze gas components in a sample, typically water. It functions by passing the sample through a semi-permeable membrane within a vacuum chamber. Since the concentration of the specific component on the vacuum side of the semi-permeable membrane is virtually zero, volatile and gaseous components can naturally permeate through the semi-permeable membrane. The permeated gas is then introduced into the mass spectrometer, either through an inlet or helium flow. The mass spectrometer subsequently quantifies and analyzes the gas components.
The M(28N2) values obtained through MIMS represent the standard electron signal values of pure water at 20 °C with a salinity of 0. These signal values may vary with time during the sample measurement, which is denoted as t. The variation can be described as a curve: y = At + B. By substituting the sample measurement time into this curve, the calibrated standard electron signal value for 28N2 at that specific time can be determined. This value is then directly recorded as M(28N2)t. The actual corrected concentration of 28N2 is calculated by multiplying the value of S1/M(28N2)t by the concentration of 28N2 in pure water, denoted as c(28N2)s. Similar calculations are performed to obtain the concentrations of c(29N2) and c(30N2) based on corresponding ratios [17].
The equation for converting electronic signal values into concentrations is as follows:
c(28N2) = M(28N2)t × [c(28N2)s]/At + B
c(29N2) = c(29N2) × M(29N2)t/M(28N2)t
c(30N2) = c(29N2) × M(30N2)t/M(28N2)t
In these equations, M(28N2)t, M(29N2)t, and M(30N2)t represent the actual measured electron signal values for 28N2, 29N2, and 30N2 at time t. While c(28N2), c(29N2), and c(30N2) denote the actual corrected concentrations of 28N2, 29N2, and 30N2 at time t, expressed in μmol·L−1.
The N2 produced through denitrification in this incubation system is considered to originate from N atoms in NOx−. The ratio of production rates for 28N2, 29N2, and 30N2 is consistent with the ratio of 14N to 15N in NOx− within the system. This ratio can be calculated as follows:
Dtotal = D30/FN2, D30 = c(30N2)
In these equations, Dtotal represents the denitrification rate in μmolL−1h−1, FN2 is the ratio of 14N to 15N abundance, and c(30N2) is the actual concentration as obtained from Equation (4).
2.4. Data Processing and Analysis
The data were analyzed and processed using Excel 2016. To test for significant differences among treatments, a one-way ANOVA (Analysis of Variance) was conducted in SPSS (Statistical Package for the Social Sciences, IBM SPSS Statistics 27.0.1). Plots and graphical representations were created using Origin 9.1
3. Results
3.1. N Removal
3.1.1. Winter Test
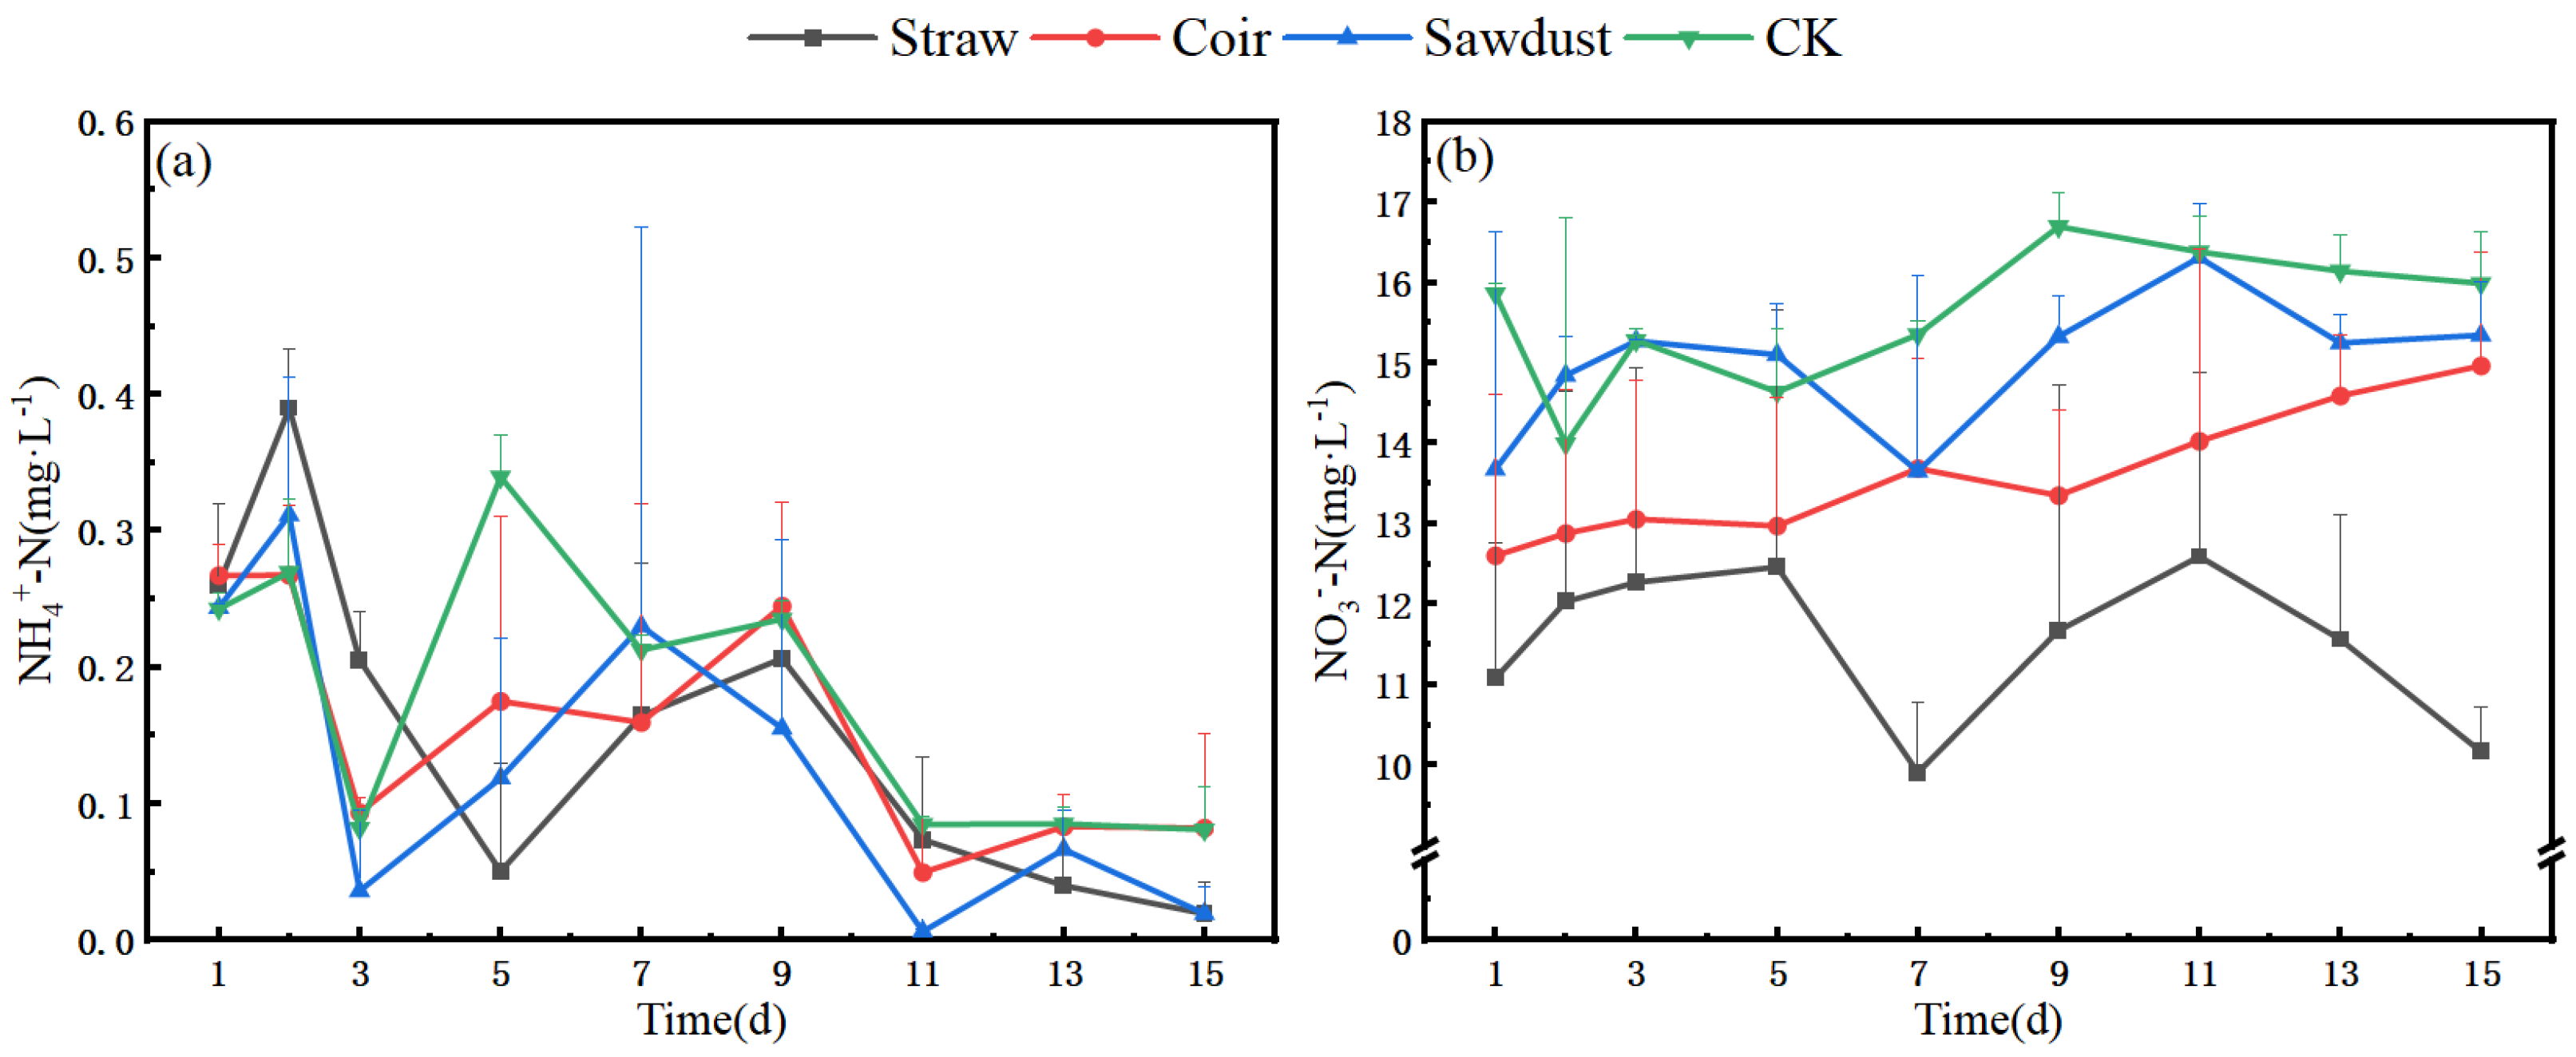
The changes in N dynamics within the water column during stage I in winter are depicted in Figure 2a,b. Notably, the NO3−-N concentration in the straw treatment group decreased by 7.57% on day D15 when compared to the initial straw concentration. In contrast, the coir and wood chips treatments exhibited an increase in NO3−-N levels, rising by 19.55% and 11.99%, respectively (Table S1). The NH4+-N content in the water column remained consistently at a low level, with a similar trend observed across all treatment groups. There was a notably sharp decrease in NH4+-N levels on day D3.

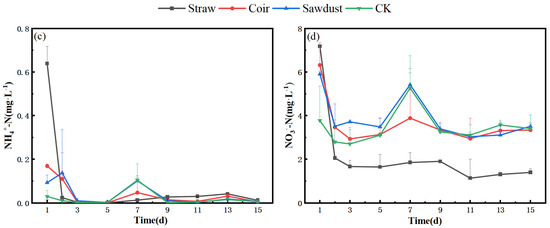
Figure 2.
Dynamic changes of N at two stages in winter. (a) (NH4+), (b) (NO3−)-stage I, (c) (NH4+), (d) (NO3−)-stage II. Note: Straw, Coir, Sawdust represent the addition of cellulosic carbon of straw, coir, and sawdust, respectively; CK is the control group.
In stage II, the N dynamics of each treatment group are presented in Figure 2c,d. During this stage, all three N groups experienced a significant decrease on D2, surpassing the rate observed in the control group (CK). The NO3−-N removal rates ranged from 40.6% to 80.5% (Table S1), indicating a substantial improvement compared to stage I. Furthermore, the removal effect of NH4+-N also showed a slight increase in the straw treatment, ranging from 91.6% to 98.1%.
3.1.2. Summer Test
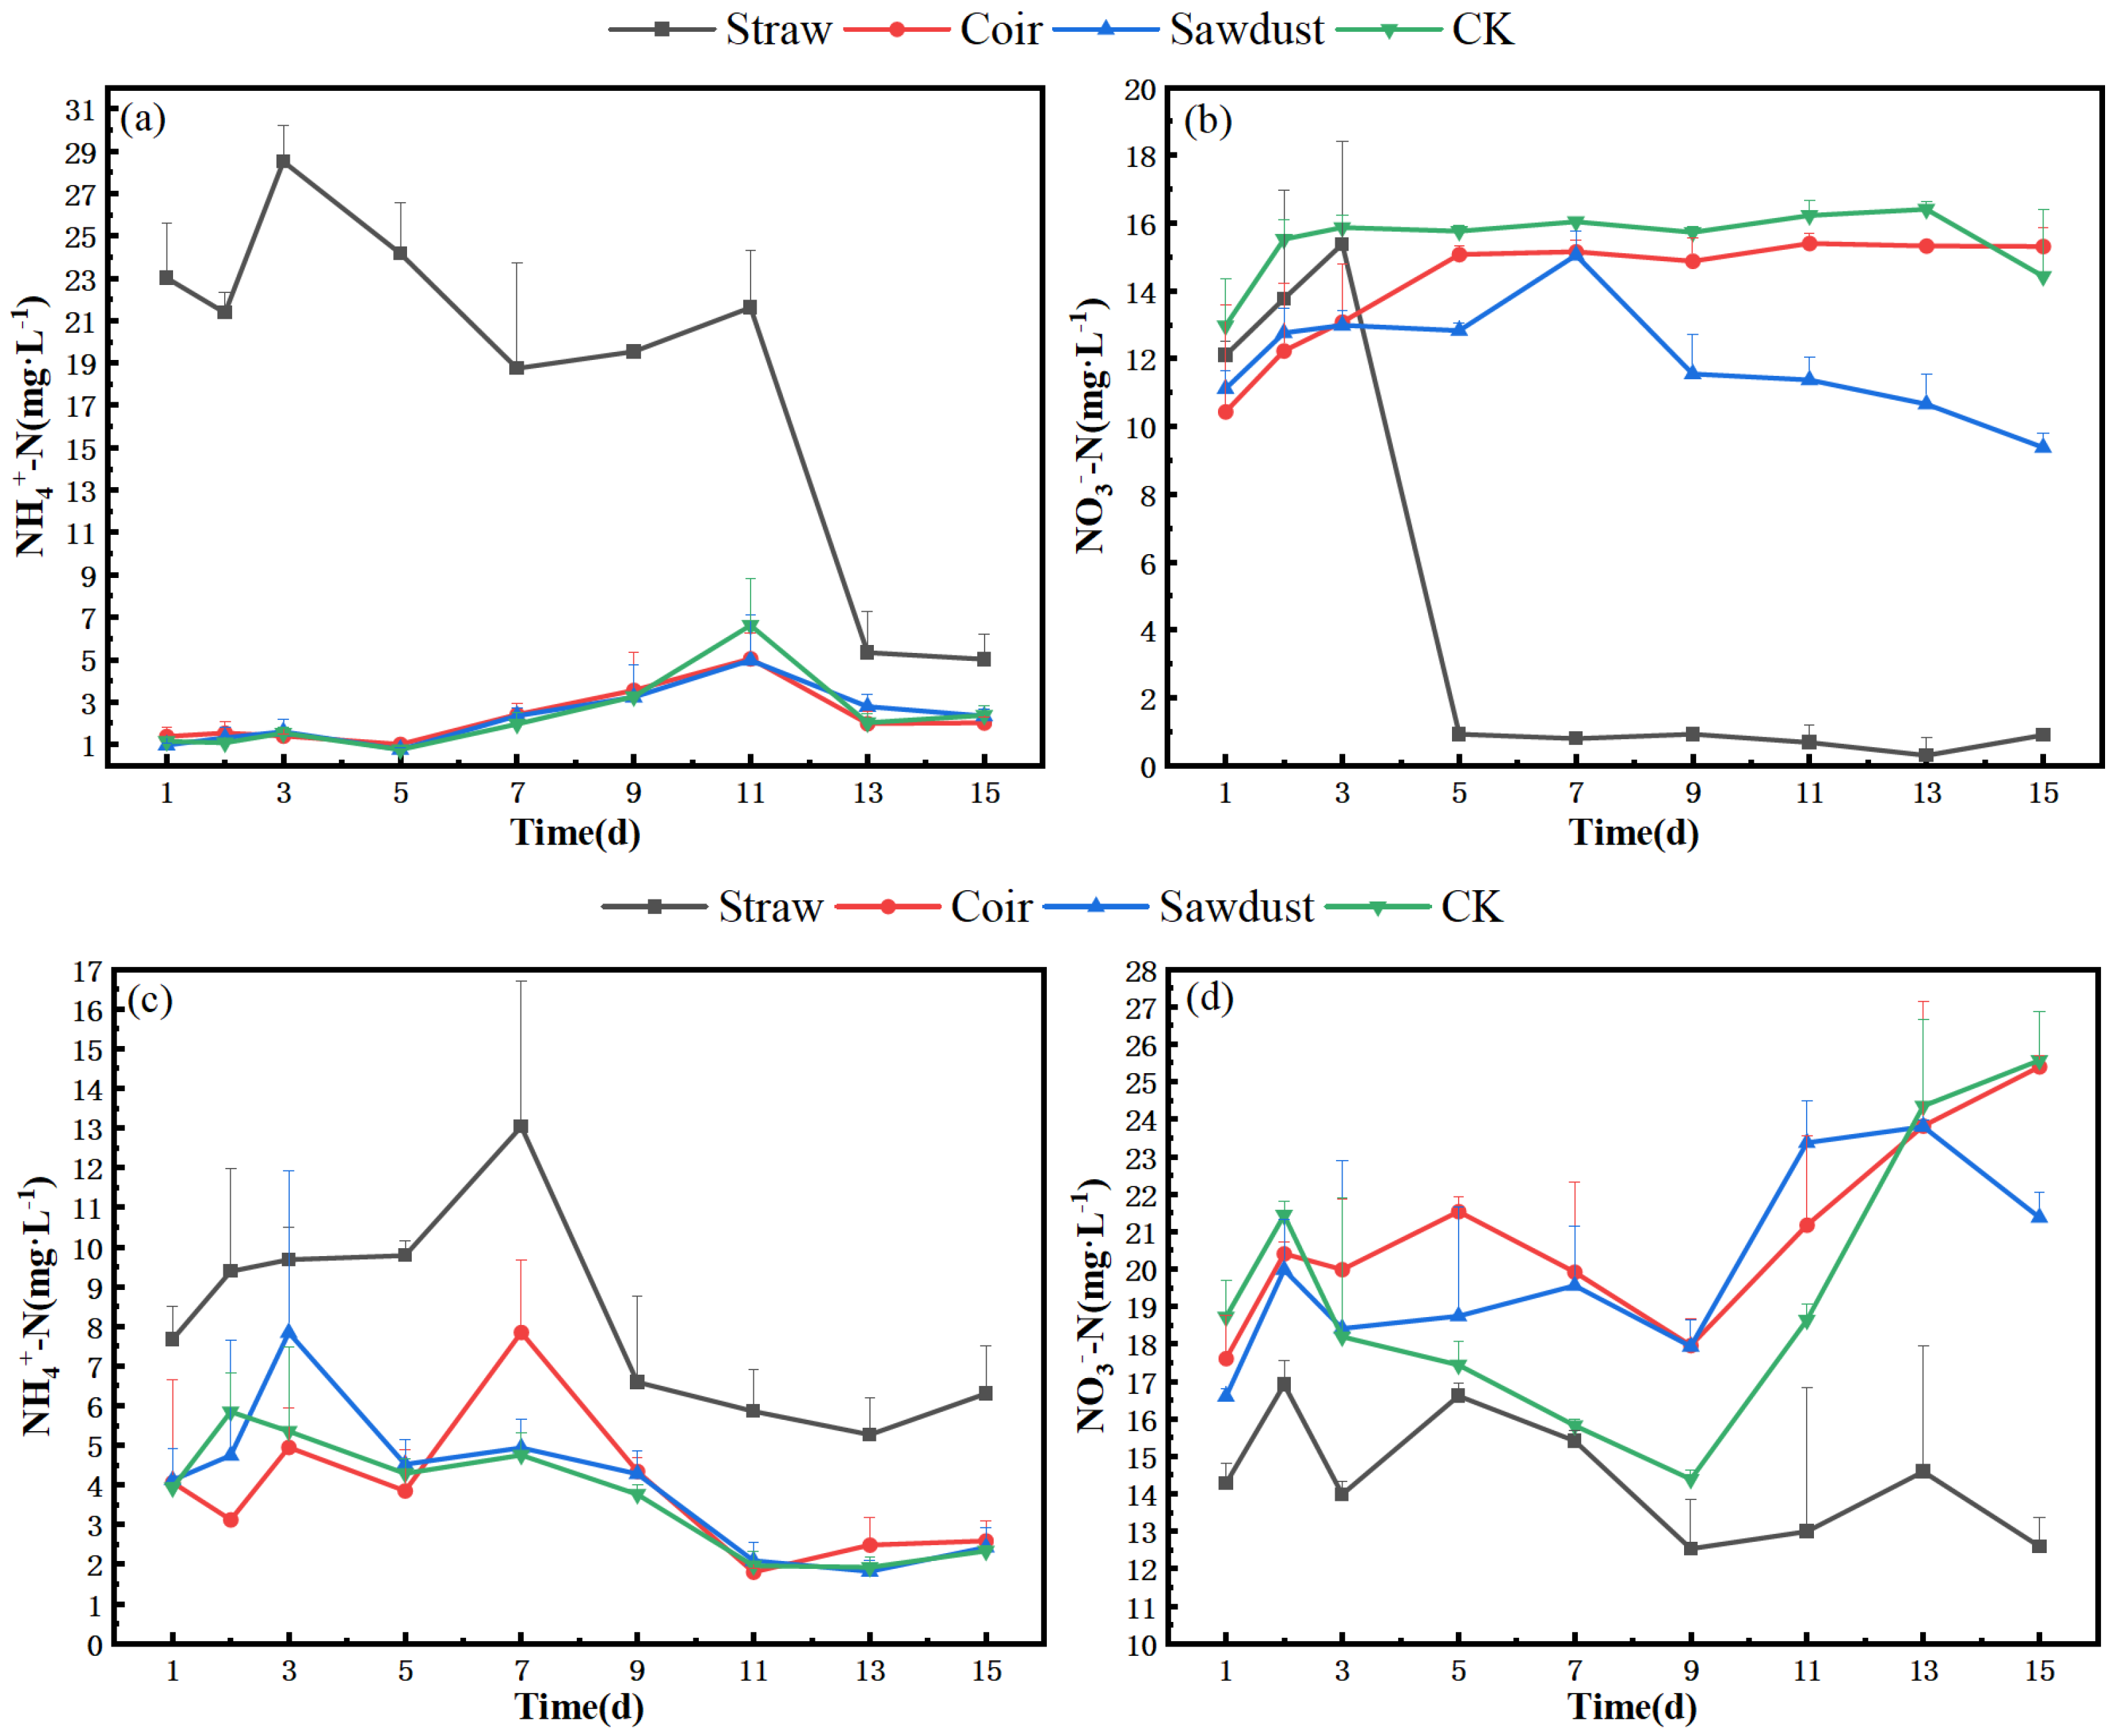
The N removal in the water column during the summer is described as follows. In Figure 3a,b, we observe the dynamics during stage I. Specifically, the NO3−-N levels in the straw group exhibited a slight increase from D1 to D3, followed by a significant drop from 15.4 mg·L−1 to 0.9 mg·L−1 between D3 and D5. Subsequently, the concentration remained consistently low, staying below 1 mg·L−1.
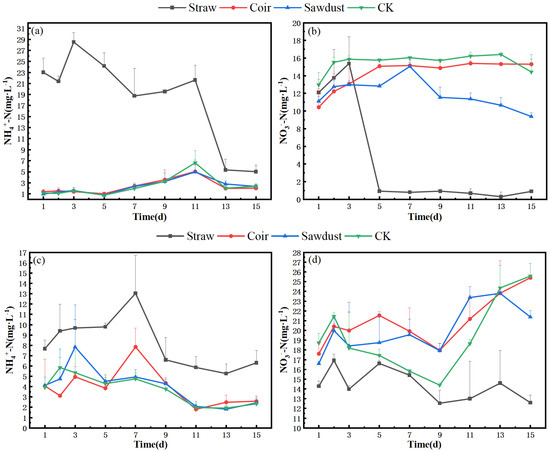
Figure 3.
Dynamic changes of N at two stages in summer. (a) (NH4+), (b) (NO3−)-stage I, (c) (NH4+), (d) (NO3−)-stage II. Note: Straw, Coir, Sawdust represent the addition of cellulosic carbon of straw, coir, and sawdust, respectively; CK is the control group.
Regarding NH4+-N concentration, both the coir and wood chip groups displayed a pattern similar to that of the CK. They increased to their maximum values on D11 and then decreased to approximately 2 mg·L−1 by D15, slightly higher than their initial values. Notably, the straw group showed a distinct NH4+-N pattern, reaching 23.0 mg·L−1 on the first day of the experiment, peaking at 28.5 mg·L−1 on D3, and then gradually decreasing. However, even at its lowest point, the concentration in the straw group remained significantly higher than in the other treatments.
In Figure 3c,d, we shift to stage II. During this stage, the NO3−-N concentrations in the straw group were lower, with a removal rate of 10.0% (Tabel S1). In contrast, the NO3−-N concentrations in the coir, sawdust, and CK groups increased by 44.6%, 28.8%, and 29.7%, respectively, reaching levels above 20 mg·L−1 by D15. The removal rates for each group were lower than those observed in stage I.
For NH4+-N, the straw group exhibited a maximum concentration of 13.0 mg·L−1 on D7, which was 54.3% lower than the peak concentration observed in stage I. The coir and sawdust groups peaked at D3 and D7, respectively, but their overall trends were more in line with CK. The NH4+-N removal rates for the straw, coir, sawdust, and CK groups reached 21.9%, 31.7%, 38.1%, and 39.2%, respectively (Tabel S1).
3.2. Greenhouse Gas Emission
In the winter experiment, there were no significant differences in the cumulative emissions of N2O among treatments in both of the two stages (Table 2). However, there were some interesting trends in terms of Global Warming Potentials (GWPs). The GWPs of straw and coir increased by 2.4 and 3.1 times from stage I to stage II, respectively, while they decreased in the sawdust and CK groups. In general, all treatments showed a trend of decreasing CH4 emissions, but only straw and coir displayed a trend of increasing N2O emissions from stage I to stage II. Figure S2 shows the greenhouse gas emission fluxes in winter.
Table 2.
Cumulative emissions of N2O and CH4 in two stages in winter (mg·m−2).
The cumulative emission fluxes and GWPs of different treatment groups in the summer test are presented in Table 3. The GWP value of straw increased by 12.8% from stage I to stage II, while the GWP value of coir and CK remained relatively stable. The GWP value of sawdust was significantly higher than that of other treatments in stage I but decreased to almost one-tenth in Stage II. Notably, CK had negative GWP values in both stages. Figure S3 shows the greenhouse gas emission fluxes in winter.
Table 3.
Cumulative emissions of N2O and CH4 in two stages in summer (mg·m−2).
3.3. Changes in Total Phenolic Acid and COD
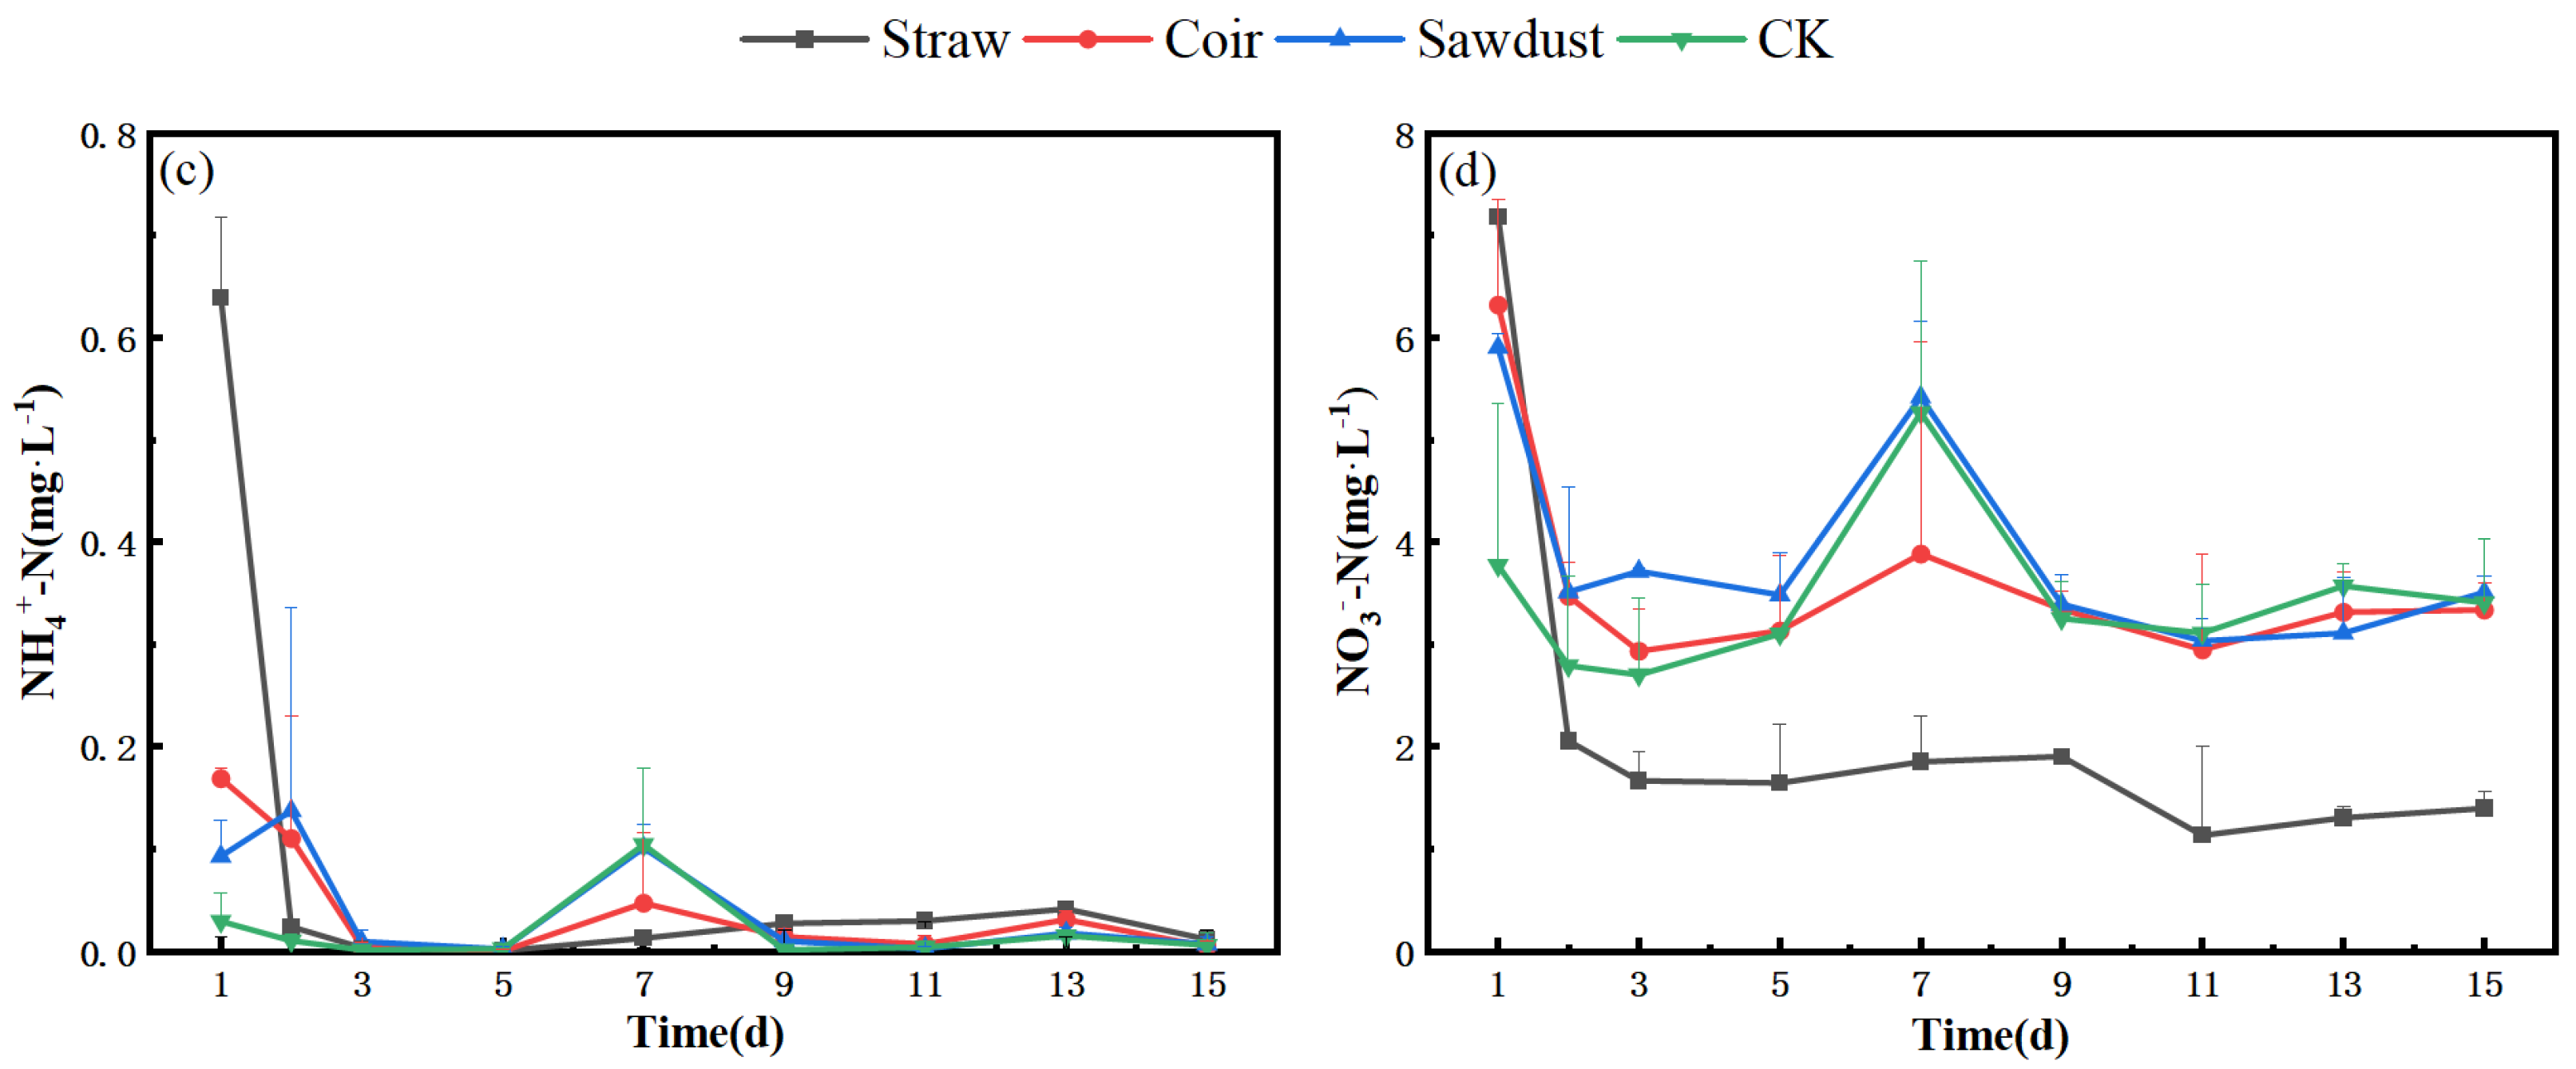
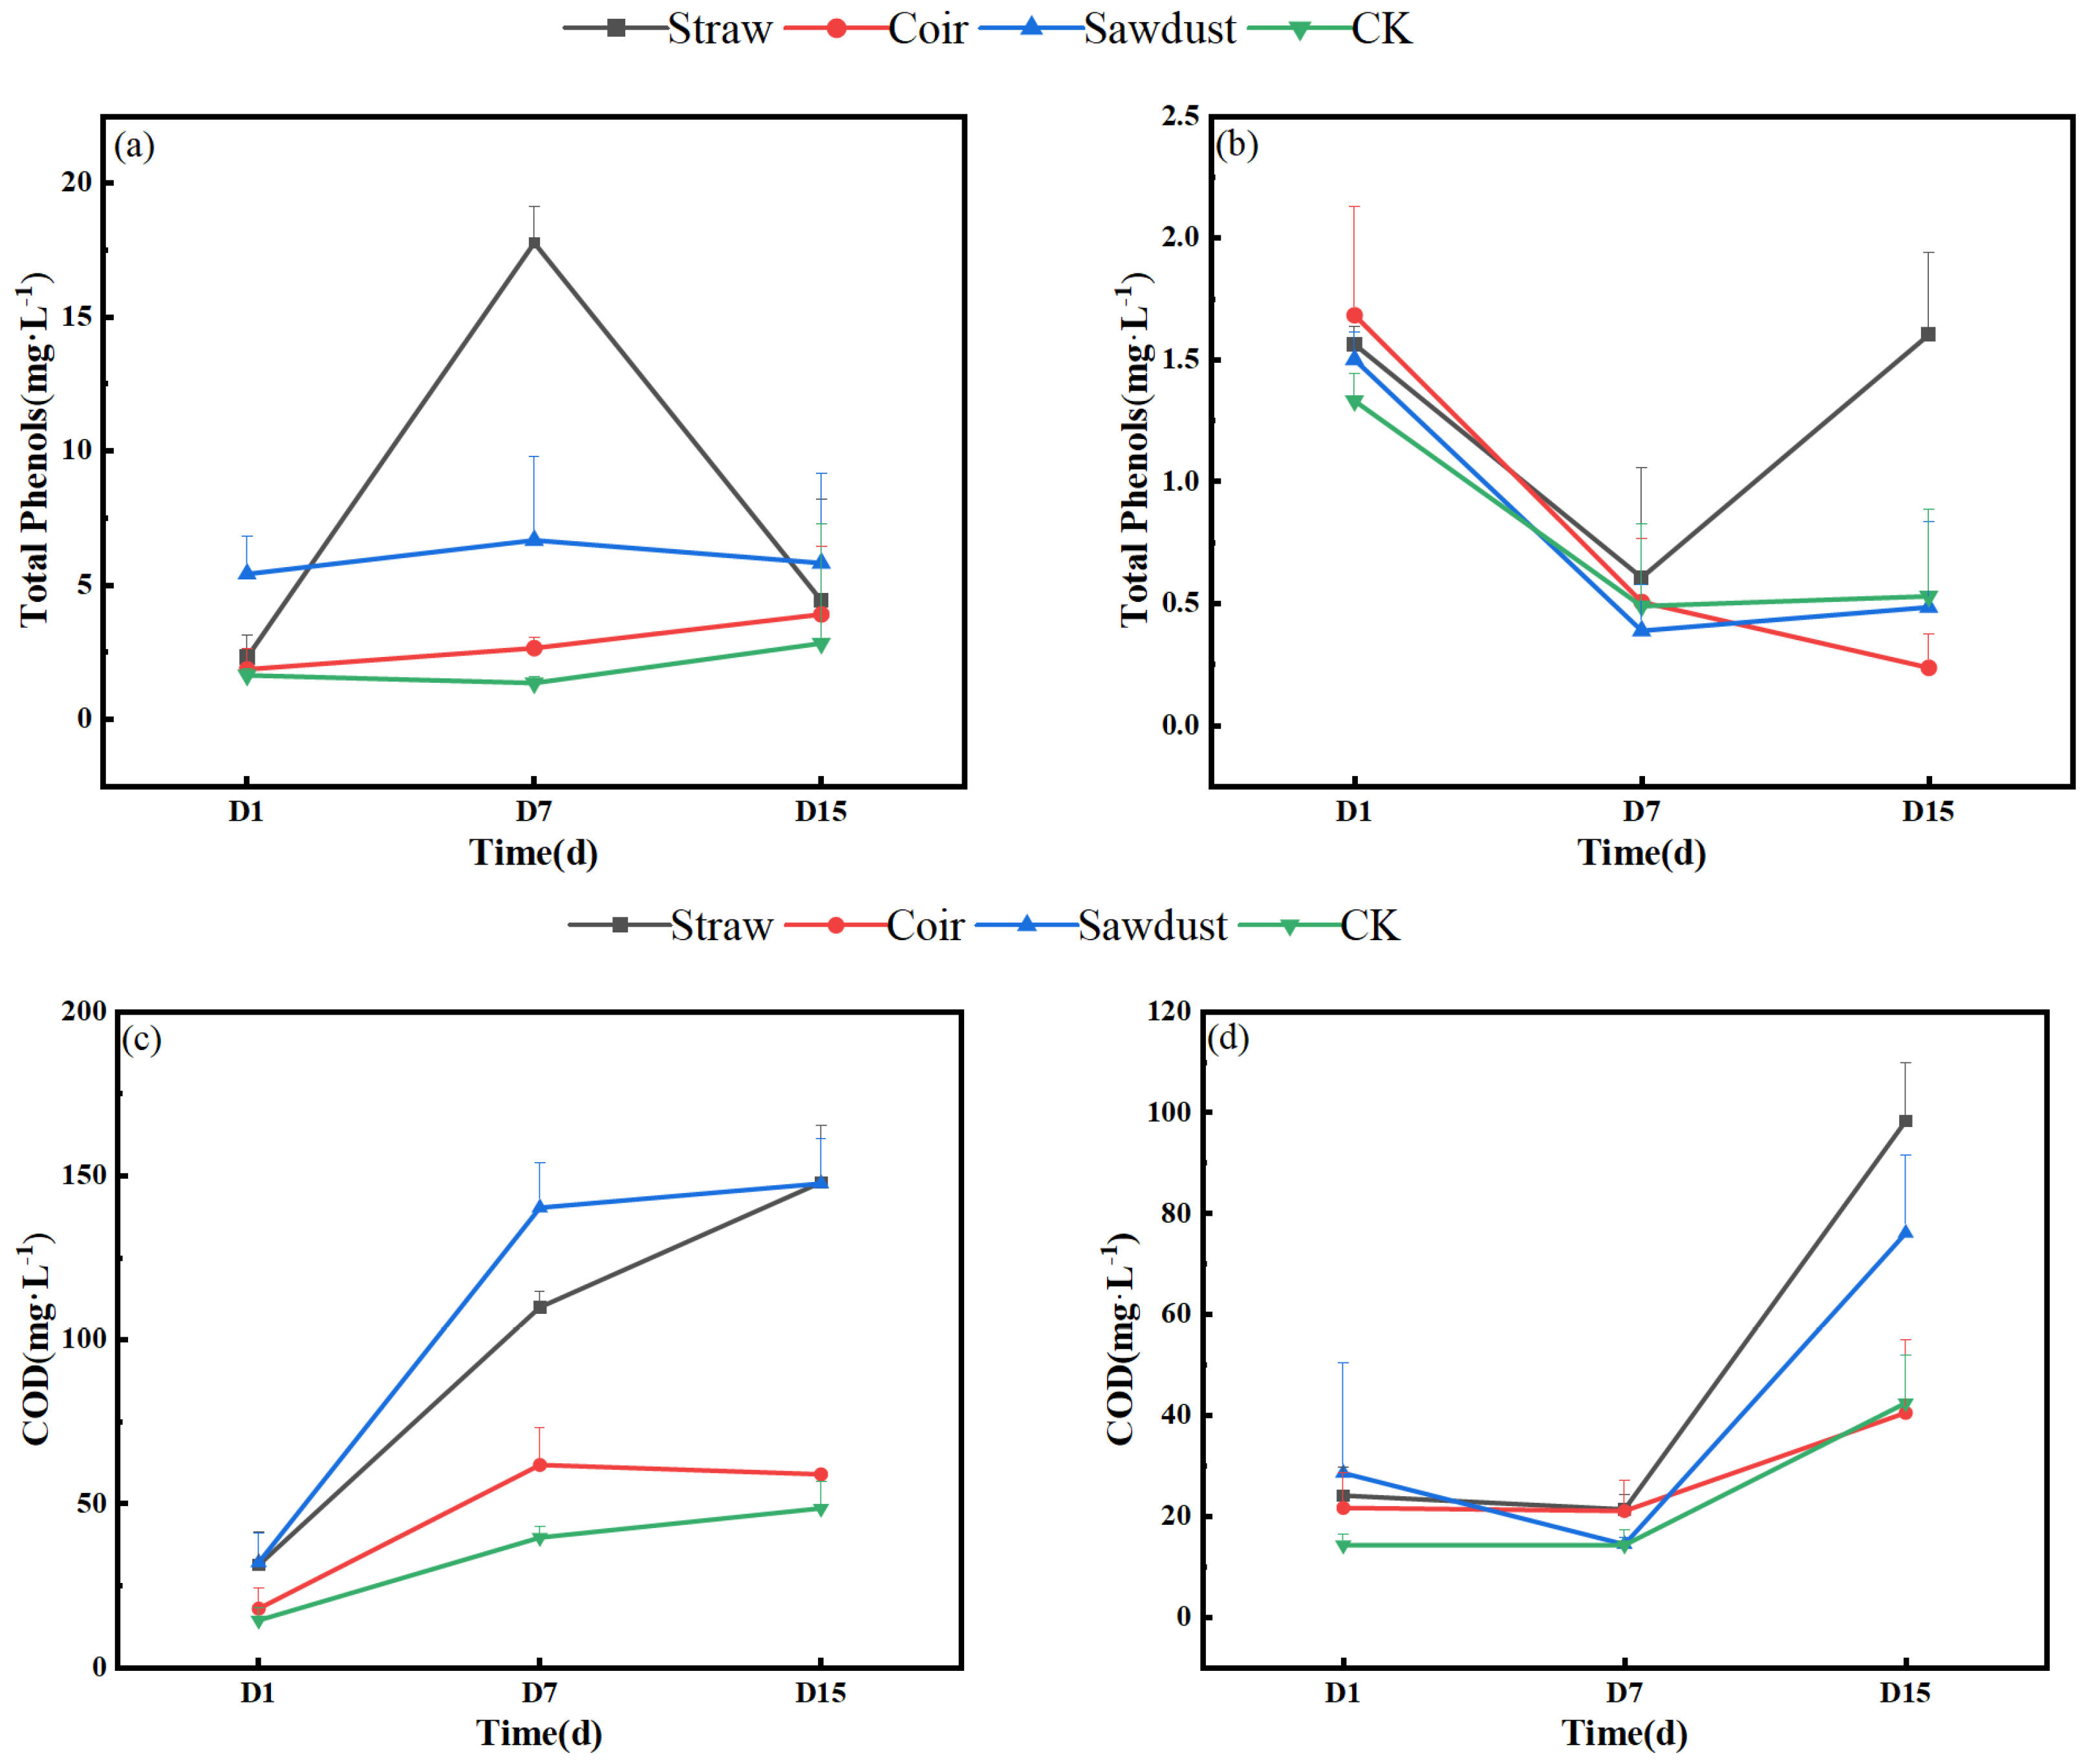
Figure 4 illustrates the dynamic changes in total phenolic acid and COD in the two stages of the summer test. From Figure 4a,b, we observe that the total phenolic acid content in the water column of the straw group increased rapidly from 2.3 mg·L−1 on D1 to 17.8 mg·L−1 on D7. This value was significantly higher than all other treatment groups. However, it then decreased to 4.4 mg·L−1 by D15. In contrast, the total phenolic acid content in the CK was the lowest in stage I. In stage II, the total phenolic acid content for all treatments did not exceed 2 mg·L−1, with the maximum value observed in the straw group on D15 (1.6 mg·L−1). This was a 91.0% reduction compared to stage I.
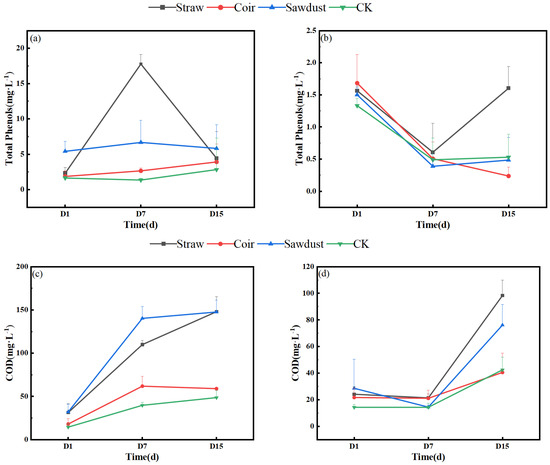
Figure 4.
Dynamic change in total phenols, COD in two stages. (a,b)—stage I, (c,d)—stage II. Note: Straw, Coir, Sawdust represent the addition of cellulosic carbon of straw, coir, and sawdust, respectively; CK is the control group.
Referring to Figure 4c,d, the COD concentrations in each treatment showed an increasing trend in stage I, with the order of straw > sawdust > coir > CK. The COD values for straw and sawdust on D15 reached 148.0 mg·L−1 and 147.7 mg·L−1, respectively, representing substantial increases of 371.3% and 358.6% compared to the initial levels. The COD values for the other treatments did not exceed 60 mg·L−1. In stage II, the COD values did not change significantly from D1 to D7. However, they increased notably from D7 to D15, with the order of straw > sawdust > CK > coir in the end.
3.4. Variation in Denitrification Rate of the Water Body
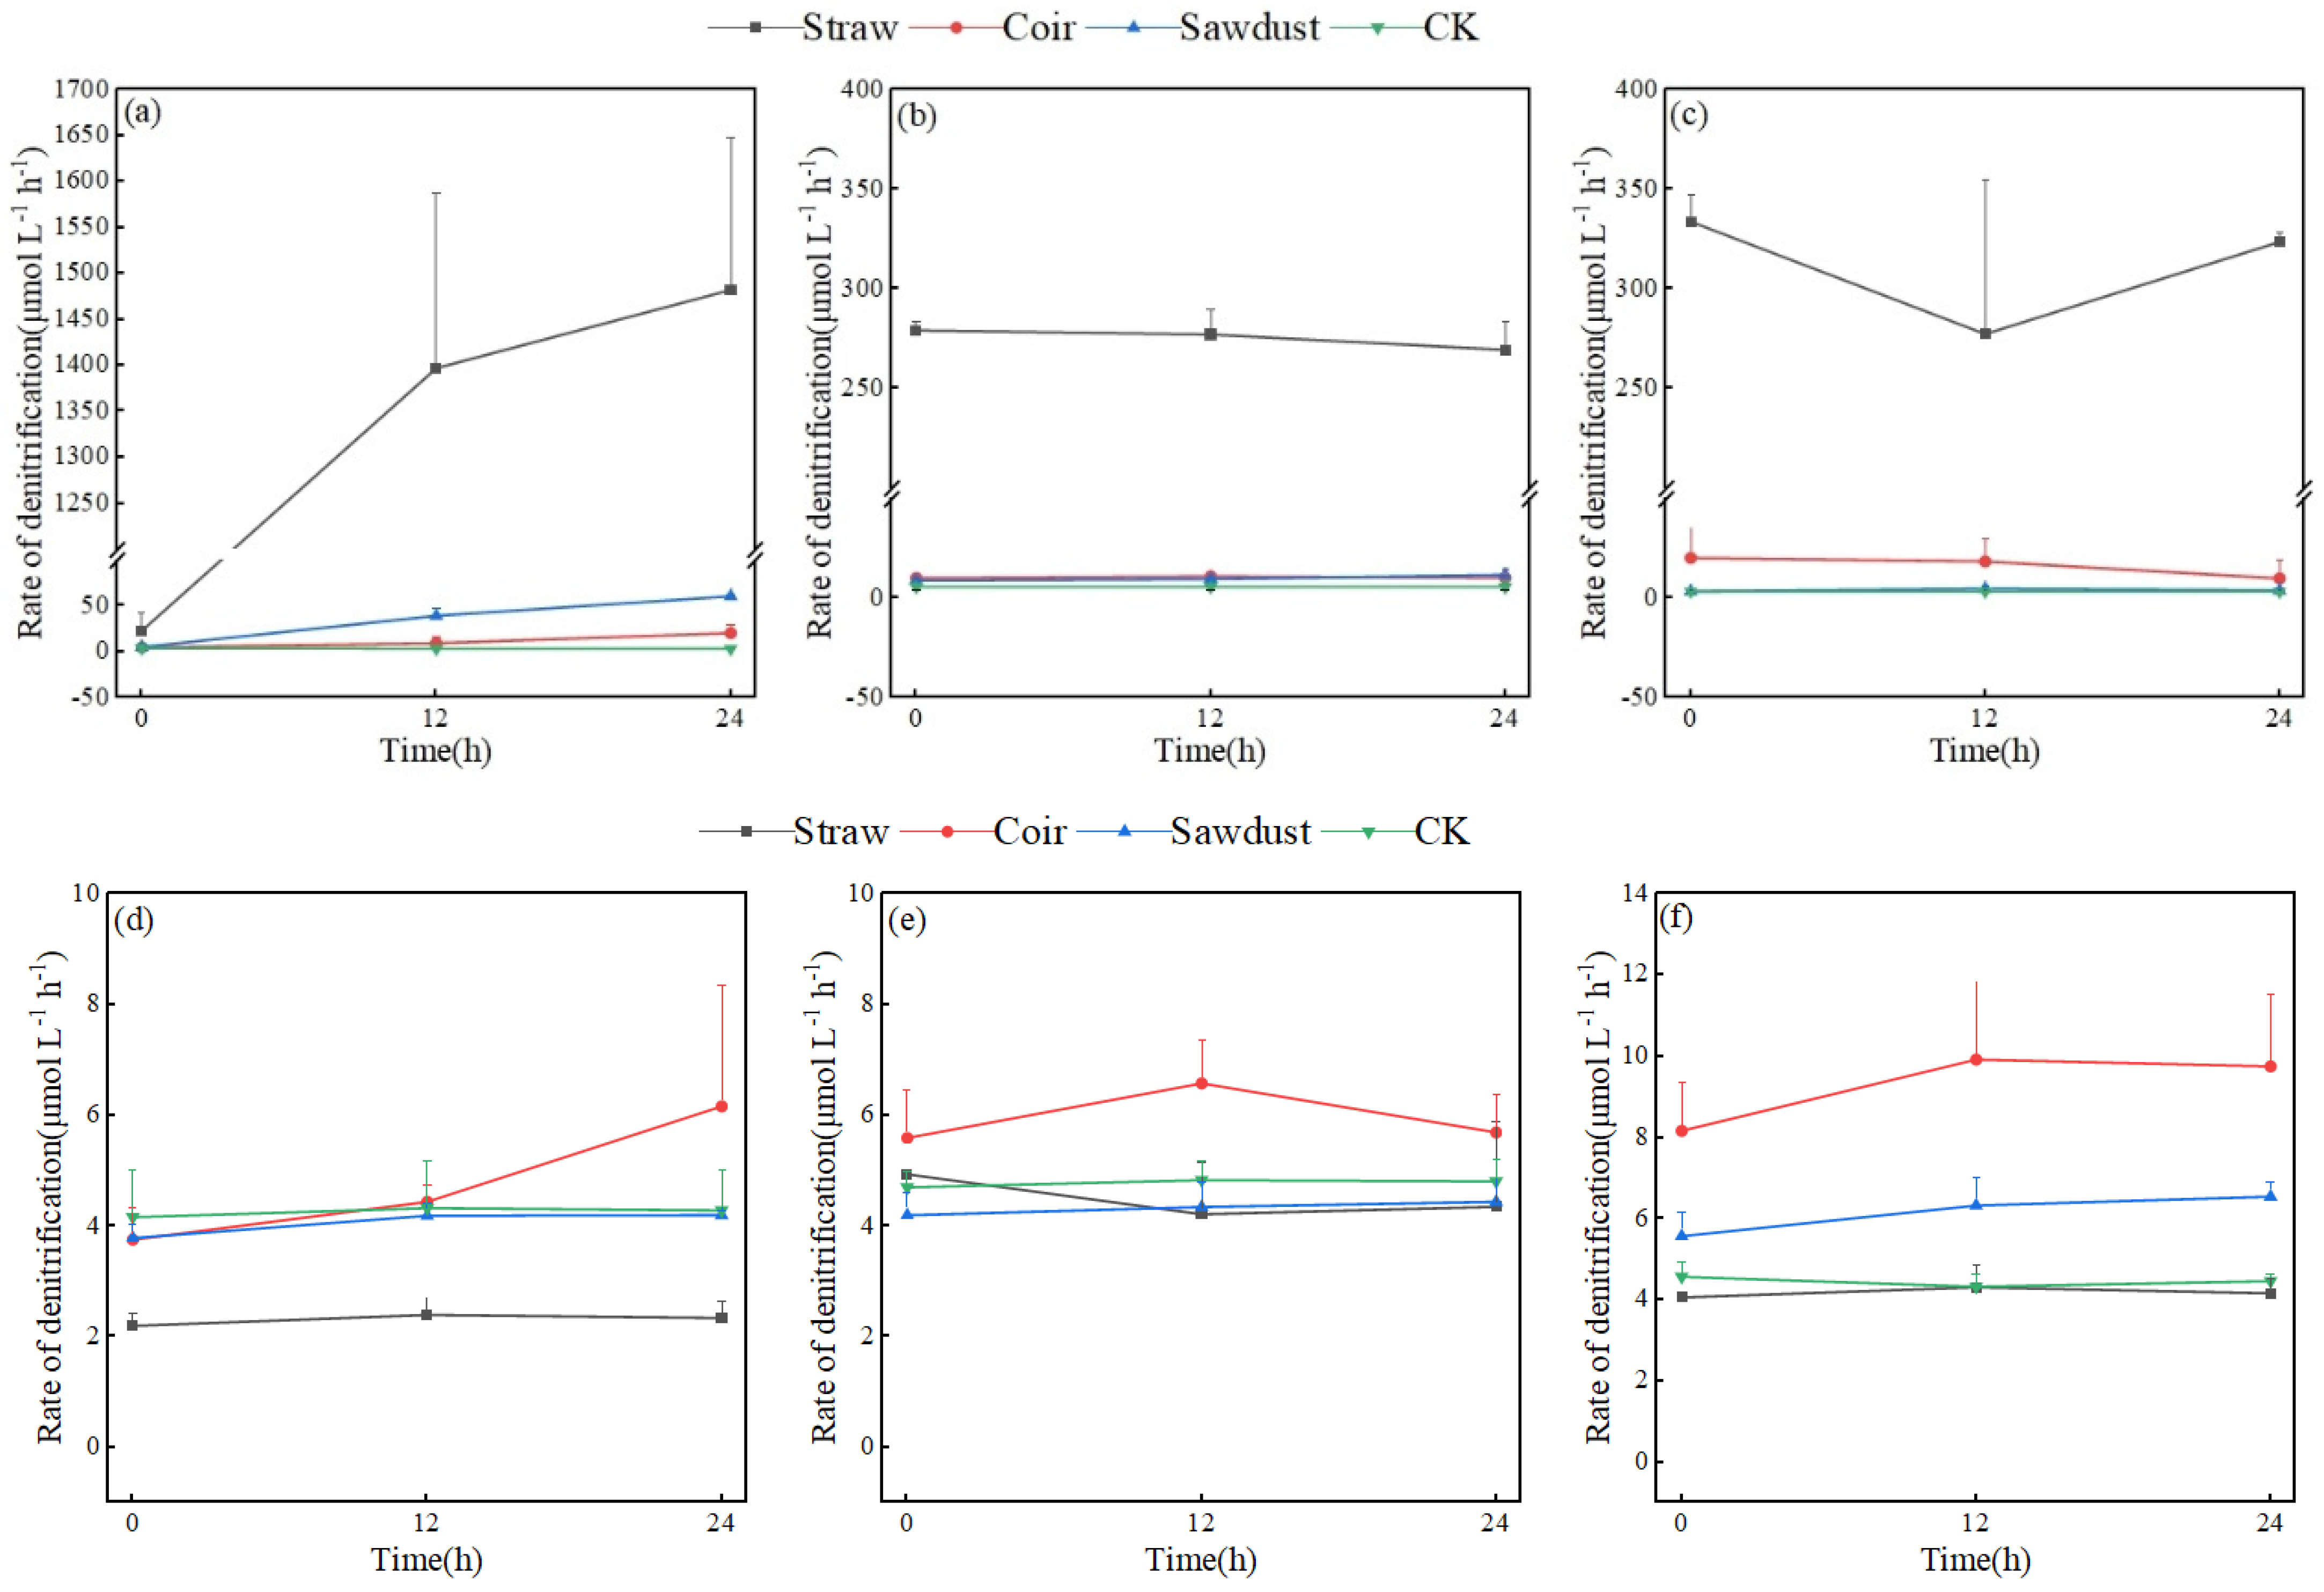
Figure 5 provides a comparison of denitrification rates for each treatment after 24 h of incubation on D1, D7, and D15 in the two stages of the summer test. Figure 5a reveals that all three carbon sources had varying degrees of promotion on denitrification rates on the first day of the test (straw > sawdust > coir), and all treatments displayed an increasing trend during the incubation period. The denitrification rate in the coir and sawdust groups reached the maximum values of 20.99 and 60.87 μmol·L−1·h−1, respectively, at 24 h; these were higher than those of CK. The promotion of denitrification was even more significant in the straw group, with the denitrification rate rapidly increasing from 0 to 1397.34 μmol·L−1·h−1 at 12 h and reaching 1482.42 μmol·L−1·h−1 at 24 h.
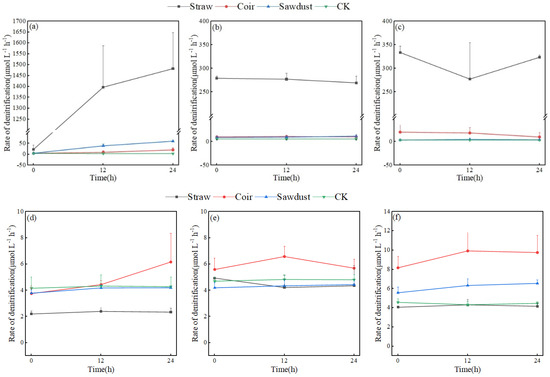
Figure 5.
The denitrification rates of each treatment in two stages. (a–c)—D1, D7, D15 of stage I, (d–f)—D1, D7, D15 of stage II. Note: Straw, Coir, Sawdust represent the addition of cellulosic carbon of straw, coir, and sawdust, respectively; CK is the control group.
In Figure 5b, the denitrification rate of the straw group showed a slight decrease from 0 h to 24 h of incubation on D7 but remained significantly higher than that of coir and sawdust. On D15 of stage I, the straw group’s denitrification rate remained high, the sawdust group’s rate was close to that of CK, while coir’s rate was slightly higher (Figure 5c).
The results of stage II differed from those of stage I, with denitrification intensity much weaker (Figure 5d–f). The denitrification rate of the straw group was only (2.32 ± 0.10) μmol·L−1·h−1, lower than the other treatments. The denitrification rates of the sawdust group and CK were similar in magnitude and variation pattern, while the coir group’s denitrification rate slightly increased from 12 to 24 h. Specifically, the denitrification rates on D7 in stage II were as follows: coir (5.96 ± 0.54 μmol·L−1·h−1) > CK > straw > sawdust, with CK’s rate reaching 4.78 μmol·L−1·h−1. On D15’s incubation, the denitrification rates of the coir and sawdust groups were higher than those on D7, with rates of (9.29 ± 0.97) and (6.15 ± 0.51) μmol·L−1·h−1, respectively, surpassing those of straw and CK.
3.5. Correlation Analysis of Denitrification Rate and Environmental Factors
Table 4 presents the correlations between denitrification rates in stage I and stage II and various environmental factors and N elements. The analysis reveals several significant associations:
Table 4.
Correlation analysis of denitrification rate and environmental factors.
In stage I, the denitrification rates of the straw and sawdust groups exhibited a significant positive correlation with NO3−-N concentration (p values of 0.025 and 0.037, respectively). The denitrification rate of the sawdust group showed a highly significant positive correlation with dissolved oxygen (DO), with an r2 of 1.000 (p = 0.006). The denitrification rate of the coir treatment displayed a significant negative correlation with temperature, with an r2 of −1.000 (p = 0.008). The denitrification rates of both the straw and sawdust groups showed strong negative correlations with the C/N ratio and temperature, although these relationships did not reach significance. The denitrification rate of the coir group was positively correlated with DO and negatively correlated with NH4+-N concentration.
In stage II, the denitrification rates of the coir treatment were significantly and positively correlated with NO3−-N concentration, with an r2 of 0.999 (p = 0.025). The denitrification rate of the straw group exhibited a strong negative correlation with DO. The coir group showed a positive correlation with pH. The denitrification rate of the sawdust group was positively correlated with C/N ratio, pH, and NO3−-N concentration, and negatively correlated with NH4+-N concentration.
4. Discussion
4.1. Effect of Cellulosic Carbon Addition on N Removal from Water Bodies
The varying carbon release capacities of different cellulosic carbon source materials are attributed to the structural composition of the agricultural waste, which directly impacts denitrification and N removal processes. In a study by [18], four plant carbon source materials were compared in artificial wetlands. It was found that corn straw had a higher carbon release rate initially, but it also introduced more N and P into the water, which was detrimental to water purification. In contrast, despite having a lower carbon release rate, the addition of reed stalks enhanced TN removal rates to 60% to 85% in the system.
In the current study, the highest NO3−-N removal rate was achieved by adding straw (80.5%) in the winter test, while coir and sawdust achieved removal rates of only about 42%. However, in the summer test, the addition of rice straw led to high NO3−-N removal but NH4+ accumulation. This suggests that rice straw addition can promote nitrate removal in the water column with an appropriate carbon release rate when the temperature is low or moderate.
Research has indicated that nitrification rates are significantly inhibited below 10 °C and decrease sharply to stagnation below 6 °C [19], while denitrification rates exhibit significant differences in performance below 15 °C and above 20 °C [20]. Additionally, lower DO levels are beneficial for biological denitrification under conditions of lower C/N ratios or lower organic matter concentration. In this experiment, the accumulation of NO3−-N in stage I led to an increase in TN in all treatment groups, and only the straw group had relatively low TN and NO3−-N concentrations. This may be due to the slow growth and reduced activity of microorganisms under low-temperature winter conditions, which inhibited nitrification and denitrification to some extent, thereby slowing down the N transformation process.
4.2. Effect of Cellulosic Carbon Addition on Denitrification
The addition of cellulosic carbon source materials is essential for providing the necessary electrons required for denitrification. However, the impact of denitrification promotion varies among different materials due to differences in carbon release performance [21]. In this experiment, the straw group exhibited high denitrification intensity in the early stage, but with the sudden decrease in NO3−-N concentration on the fifth day, NO3−-N became the primary factor limiting denitrification under conditions of high carbon source availability. The intensity of denitrification in the straw group significantly declined during stage II, which might be attributed to the water being emptied from all the treatments at the end of stage I. Coir and sawdust are slow-release carbon sources, and they showed low denitrification rates throughout the experimental period. With proper pretreatment methods to destroy their lignin structure, the carbon release rates could be accelerated.
Numerous factors can influence the denitrification process. While it is generally accepted that a neutral or weakly alkaline pH favors denitrification [22,23], some studies have suggested that pH does not strongly correlate with denitrification intensity [24]. Her and Huang’s (1995) study indicated that the optimal C/N ratio for complete denitrification varies significantly among different carbon sources [25]. It is the easily utilized and readily soluble effective carbon that can quickly impact the microorganisms, rather than the large organic molecules. She et al. (2017) suggested that the main factors influencing denitrification in agricultural drainage ditch systems in Taihu Lake, China, are inorganic N concentration and water temperature, and the denitrification process is influenced by the integrated impact of environmental factors [26]. The present study revealed that higher C/N and water temperature in the early stage of cellulosic carbon addition were not conducive to denitrification, with NO3−-N concentration being the primary limiting factor. In the later stage, the influence of environmental factors such as pH and DO became more prominent.
4.3. Environmental Impact of Carbon Source Addition
The addition of a carbon source can indeed increase the C/N ratio and contribute to the removal of N from the water column. However, when the COD is too high, the conversion of NO3−-N can become biased towards the nitrate isomerization reduction to ammonium (DNRA) process, leading to higher NH4+-N concentrations and a deterioration in water quality [27]. Straw and other cellulosic materials contain numerous small organic molecules that are easily hydrolyzed on the surface [28]. These small surface molecules are rapidly released into the water column upon addition, and the organic matter within the material also diffuses into the water through the pores after the material dissolves upon immersion. A study by Zhang et al. (2020) concluded that the release of dissolved organic matter (DOM) increased continuously for 30 days following rice straw addition and then reached a dynamic equilibrium at 46.2 mg·C·g−1 [29]. The total phenolic content of rice straw addition in this experiment showed a significant increase during the middle of the summer test. This indicates that organic acids are released at a faster rate following the addition of rice straw to the water column, and the amount of carbon release, measured by COD, also exhibited a rapid and continuous increase. Therefore, caution should be exercised when applying straw-based carbon sources in high-temperature conditions to avoid a rapid increase in NH4+-N and COD concentrations in the water column.
Another significant concern is greenhouse gas emissions following the addition of cellulosic carbon sources. Given that N2O has a global warming potential 298 times that of CO2, and CH4 is 25 times that of CO2 [15], N2O emissions need to be taken seriously. The release of N2O is primarily driven by nitrification and denitrification processes, and environmental factors such as pH, C/N ratios, etc., can lead to variations in greenhouse gas emissions by influencing biochemical reactions. In the present study, the cumulative emissions of N2O with straw and coir were higher than in other treatments during the winter, but these values were significantly lower than those with sawdust in the summer. This highlights the importance of combining different cellulosic carbon sources to achieve a mitigation effect on greenhouse gas emissions.
Agricultural production areas typically exhibit relatively high greenhouse gas emissions. For instance, Hasegawa et al. (2000) determined that the maximum N2O emission flux in a river in an agricultural area of Japan reached 56.5 mg·m−2·h−1, while Dong et al. (2015) noted that CH4 and N2O emission fluxes from canals in hilly areas of the Mianyang region in China were in the range of −0.04~44.8 mg·m−2·h−1 and 0.0012~0.4415 mg·m−2·h−1, respectively, without external carbon sources [30,31]. In the present study, the greenhouse gas emission fluxes (N2O, CH4: −0.0136~0.3241 mg·m−2·h−1 and −0.7157~0.6606 mg·m−2·h−1, respectively) did not increase much after the addition of carbon sources under high-temperature conditions in the summer (Figure S3), compared to previous studies. However, special attention should be given to N2O emissions in the initial stage with sawdust addition.
5. Conclusions
The study investigated the impact of adding cellulosic carbon sources on N removal, greenhouse gas emissions, and environmental factors in both winter and summer drainage systems. The key conclusions drawn from the study are as follows:
- (1)
- Seasonal Differences: Seasonal variations were observed in the effects of cellulosic carbon addition on N removal and greenhouse gas emissions. The addition of straw was effective in removing NO3−-N in both seasons. However, in summer, it led to a significant release of NH4+-N in the early stages of the experiment.
- (2)
- Greenhouse Gas Emissions: With the exception of sawdust addition, the introduction of cellulosic carbon did not significantly increase greenhouse gas emissions in summer. This suggests that, when properly managed, the addition of these materials can help improve N removal without substantially contributing to greenhouse gas emissions.
- (3)
- Denitrification Rate: The addition of straw significantly increased the denitrification rate, with a rapid initial increase to more than 1400 μmol·L−1·h−1, followed by a sustained promotion of denitrification at a rate of about 300 μmol·L−1·h−1 for an extended period. These denitrification rates were much higher than those achieved with coir and wood chips.
- (4)
- Environmental Impact: Unfortunately, the addition of straw in the summer led to an increase in COD and total phenolic acid concentrations in the water, indicating a negative environmental impact in terms of water quality. In contrast, cellulosic carbon sources were found to be more effective and less environmentally impactful in lower temperature seasons.
In summary, the study suggests that the combination use of cellulosic carbon sources can be a valuable strategy for promoting denitrification and N removal in drainage systems, especially during colder or milder seasons.
Supplementary Materials
The following supporting information can be downloaded at: https://www.mdpi.com/article/10.3390/agronomy13123044/s1, Table S1: Removal rates of NH4+-N and NO3−-N in winter and summer; Figure S1: Water temperature variations in (a) winter and (b) summer; Figure S2: Greenhouse gas emission fluxes in winter; Figure S3: Greenhouse gas emission fluxes in summer.
Author Contributions
Conceptualization, J.D. and L.X.; methodology, T.S. and B.Z.; software, P.C.; validation, J.D., P.C. and T.S.; formal analysis, P.C.; investigation, P.C. and T.S.; resources, J.D.; data curation, T.S.; writing—original draft preparation, P.C.; writing—review and editing, J.D.; supervision, L.X.; project administration, L.Y.; funding acquisition, L.X. All authors have read and agreed to the published version of the manuscript.
Funding
This research was funded by the National Key Research and Development Program of China (No. 2021YFD1700803), the Province Key Research and Development Program of Jiangsu, China (D21YFD17008), and the Jiangsu Agriculture Science and Technology Innovation Fund, China (No. CX(19)1007).
Data Availability Statement
Data are contained within the article.
Acknowledgments
Hai Xu (Nanjing Institute of Geography & Limnology, Chinese Academy of Sciences) is gratefully acknowledged for his valuable assistance in determining denitrification rates.
Conflicts of Interest
The authors declare no conflict of interest.
References
- Ma, L. Study on the Effect of Organic Fertilizer Dosed with Nitrogen Fertilizer and Nitrogen Destination of Organic Fertilizer in Dryland Wheat Fields Based on ~(15)N Marker. Ph.D. Dissertation, Northwest Agriculture and Forestry University, Xianyang, China, 2022. [Google Scholar]
- Zhang, A.; Yang, S.; Yang, Z.; Wang, W. Transform waste straw into water-holding fertilizer: A targeted modification strategy of functional groups. React. Funct. Polym. 2023, 186, 105571. [Google Scholar] [CrossRef]
- Guo, L.; Zhao, J. Effect of burning straw in rural areas on ecological environment quality. Arab. J. Geosci. 2021, 14, 1357. [Google Scholar] [CrossRef]
- Zhang, K.; Yang, S.; Wang, W.; Luo, H.; Chen, W.; Zhang, X.; Xiao, W. Bioelectrochemical processes and cellulosic carbon source enhance the autotrophic and heterotrophic denitrification of low C/N ratio wastewater in tidal flow constructed wetland-microbial fuel cells. J. Clean. Prod. 2022, 363, 132368. [Google Scholar] [CrossRef]
- Tao, Y.; Dai, Y.; Zhang, Z.; Geng, M.; Liu, F.; Na, H.; Zhu, J. Formation of hydroxyl-rich carbon layer coated silica microspheres and its application to enhance hydrolysis of cellulose to sugar. Carbon 2023, 202, 276–285. [Google Scholar] [CrossRef]
- Zhao, Y.J.; Hui, Z.; Chao, X.; Nie, E.; Li, H.J.; He, J.; Zheng, Z. Efficiency of two-stage combinations of subsurface vertical down-flow and up-flow constructed wetland systems for treating variation in influent C/N ratios of domestic wastewater. Ecol. Eng. 2020, 37, 1546–1554. [Google Scholar] [CrossRef]
- von Ahnen, M.; Dalsgaard, J.; Pedersen, P.B. Effect of different C/N ratios and hydraulic retention times on denitrification in Saline, recirculating aquaculture system effluents. Aquac. Eng. 2021, 94, 102170. [Google Scholar] [CrossRef]
- Zhang, H.Y.; Yang, Q.X.; Yang, Q.; Ren, L.P.; Wang, J.G.; Ren, D. Composition and photochemical activity characterization of dissolved organic matter from straw sources in aqueous environments. Chin. Environ. Sci. 2020, 40, 2521–2528. [Google Scholar]
- He, S. Characterization of N2O Release during Biological Denitrification of Wastewater. Master’s Thesis, Chang’an University, Xi’an, China, 2015. [Google Scholar]
- Cameron, S.G.; Schipper, L.A. Nitrate removal and hydraulic performance of organic carbon for use in denitrification beds. Ecol. Eng. 2010, 36, 1588–1595. [Google Scholar] [CrossRef]
- Li, P.; Peng, Y.; Wang, S.; Liu, Y. N2O emission from partial nitrification and full nitrification in domestic wastewater treatment process. Water 2022, 14, 3195. [Google Scholar] [CrossRef]
- Wei, W.; Tong, J.; Hu, B.X. Study on ecological dynamic model for phytoremediation of farmland drainage water. J. Hydrol. 2019, 578, 124026. [Google Scholar] [CrossRef]
- Fan, H.X.; Xu, L.G.; Zhao, X.; Hu, Y.F. Study on nitrogen loss process in typical rice-wheat crop rotation farmland area in Taihu Lake Basin. J. Ecol. Environ. 2015, 2, 255–262. [Google Scholar]
- Wang, W.; Sardans, J.; Wang, C.; Zeng, C.; Tong, C.; Asensio, D.; Peñuelas, J. Relationships between the potential production of the greenhouse gases CO2, CH4 and N2O and soil concentrations of C, N and P across 26 paddy fields in southeastern China. Atmos. Environ. 2017, 164, 458–467. [Google Scholar] [CrossRef]
- Gao, W.; Wang, X.X.; Xie, J.Z.; Chen, Y.H.; Ni, X.H.; Wang, J.C.; Cao, B. Effects of controlled-release blended fertilizers on crop yield and greenhouse gas emissions in wheat and jade rotation system. Environ. Sci. 2023. [Google Scholar] [CrossRef]
- Blum, U.; Wentworth, T.R.; Klein, K.; Worsham, A.D.; King, L.D.; Gerig, T.M.; Lyu, S.-W. Phenolic acid content of soils from wheat-no till, wheat-conventional till, and fallow-conventional till soybean cropping systems. J. Chem. Ecol. 1991, 17, 1045–1068. [Google Scholar] [CrossRef] [PubMed]
- Li, C.; Xu, H.; Zhan, X.; Zhu, G.; Qin, B.; Zhang, Y. Effects of cyanobacterial blooms on denitrification in the water column of Lake Taihu. Environ. Sci. 2019, 44, 4977–4984. [Google Scholar]
- Zhao, L.F.; Zhu, W.; Gao, Q. Supplementary plant carbon sources to improve nitrogen removal efficiency in artificial wetlands. Journal of the People’s Liberation Army University of Science and Technology. Nat. Sci. Ed. 2009, 6, 644–649. [Google Scholar]
- Picard, C.R.; Fraser, L.H.; Steer, D. The interacting effects of temperature and plant community type on nutrient removal in wetland microcosms. Bioresour. Technol. 2005, 96, 1039–1047. [Google Scholar] [CrossRef]
- Brodrick, S.J.; Cullen, P.; Maher, W. Denitrification in a natural wetland receiving secondary treated effluent. Water Res. 1988, 22, 431–439. [Google Scholar] [CrossRef]
- Christianson, L.E.; Hoover, N.; Bhandari, A.; Helmers, M.J. Technical note: The potential of municipal yard waste to be denitrification bioreactor fill. Appl. Eng. Agric. 2012, 28, 853–859. [Google Scholar] [CrossRef]
- Xu, Y. Effect of pH and temperature on denitrification. Chin. Environ. Sci. 1994, 14, 308–313. [Google Scholar]
- Koskinen, W.C.; Keeney, D.R. Effect of pH on the rate of gaseous products of denitrification in a silt loam soil. Soil Sci. Soc. Am. J. 1982, 46, 1165–1167. [Google Scholar] [CrossRef]
- Liu, B.; Mørkved, P.T.; Frostegård, Å.; Bakken, L.R. Denitrification gene pools, transcription and kinetics of NO, N2O and N2 production as affected by Soil Ph. FEMS Microbiol. Ecol. 2010, 72, 407–417. [Google Scholar] [CrossRef] [PubMed]
- Her, J.J.; Huang, J.S. Influences of carbon source and C/N ratio on nitrate/nitrite denitrification and carbon breakthrough. Bioresour. Technol. 1995, 54, 45–51. [Google Scholar] [CrossRef]
- She, D.; Zhang, L.; Gao, X.; Yan, X.; Zhao, X.; Xie, W.; Cheng, Y.; Xia, Y. Limited n removal by denitrification in agricultural drainage ditches in the Taihu Lake region of China. J. Soils Sediments 2017, 18, 1110–1119. [Google Scholar] [CrossRef]
- Pettit, N.E.; Davies, T.; Fellman, J.B.; Grierson, P.F.; Warfe, D.M.; Davies, P.M. Leaf litter chemistry, decomposition and assimilation by macroinvertebrates in two tropical streams. Hydrobiologia 2011, 680, 63–77. [Google Scholar] [CrossRef]
- Zhao, Y.; Wang, H.; Dong, W.; Chang, Y.; Yan, G.; Chu, Z.; Ling, Y.; Wang, Z.; Fan, T.; Li, C. Nitrogen Removal and microbial community for the treatment of rural domestic sewage with low C/N ratio by A/O biofilter with Arundo donax as carbon source and Filter Media. J. Water Process Eng. 2020, 37, 101509. [Google Scholar] [CrossRef]
- Zhang, X.X.; Zhao, R.X.; Zhao, J.Q. A new species of the genus Pterostichus (Hymenoptera, Staphylinidae). Study on the effect of carbon to nitrogen ratio on NO and N2O accumulation during nitrite denitrification. Water Supply Drain. 2020, 2011, 86–91. [Google Scholar]
- Hasegawa, K.; Hanaki, K.; Matsuo, T.; Hidaka, S. Nitrous oxide from the agricultural water system contaminated with high nitrogen. Chemosphere-Glob. Chang. Sci. 2000, 2, 335–345. [Google Scholar] [CrossRef]
- Dong, H.W. Characterization of CO2, CH4 and N2O fluxes in ditch ecosystems and their influencing factors in the hilly area of central Sichuan. Doctoral Dissertation, Chongqing Normal University, Chongqing, China, 2015. [Google Scholar]
Disclaimer/Publisher’s Note: The statements, opinions and data contained in all publications are solely those of the individual author(s) and contributor(s) and not of MDPI and/or the editor(s). MDPI and/or the editor(s) disclaim responsibility for any injury to people or property resulting from any ideas, methods, instructions or products referred to in the content. |
© 2023 by the authors. Licensee MDPI, Basel, Switzerland. This article is an open access article distributed under the terms and conditions of the Creative Commons Attribution (CC BY) license (https://creativecommons.org/licenses/by/4.0/).