Article

Biochar Improves Greenhouse Tomato Yield: Source–Sink Relations under Deficit Irrigation

College of Water Resource Science and Engineering, Taiyuan University of Technology, Taiyuan 030024, China
*
Author to whom correspondence should be addressed.
Agronomy 2023, 13(9), 2336; https://doi.org/10.3390/agronomy13092336
Submission received: 10 August 2023 / Revised: 25 August 2023 / Accepted: 6 September 2023 / Published: 7 September 2023
(This article belongs to the Section Water Use and Irrigation)

Abstract

:
It is important to evaluate any effects that biochar may have on tomato yield under deficit-irrigation to develop water-saving and yield-increasing best management practices for greenhouse tomato production. For this purpose, greenhouse trials were conducted in 2021 and 2022 with five biochar (B) application rates and three irrigation (W) levels. The B treatments were B0: 0 t ha−1; B1: 15 t ha−1; B2: 30 t ha−1; B3: 45 t ha−1; and B4: 60 t ha−1, and the W levels were W1: 50–70% of field capacity (θf); W2: 60–80% of θf; and W3B0: 70–90% of θf full irrigation without biochar, which was designated as the control. Our objective was to quantify the effects of biochar on the characteristics of tomato sources and sinks to determine, first, the optimal irrigation–biochar combination to achieve high yield tomato production, and, second, evaluate the mechanisms of this effect. At W1 and W2 irrigation levels, the addition of 30–60 t ha−1 and 45–60 t ha−1 biochar could compensate for the adverse effects of deficit-irrigation on the tomato source and sink characteristics. Our results show that in both years the highest tomato yield was obtained with the W2 irrigation level and the B3 biochar application rate, with 52% higher tomato yield compared to the lowest value obtained with the W1 irrigation level and B0 application rate. We conclude that biochar application can improve tomato yield by promoting the filling rather than the building of the sink capacity. The tomato yield was mainly affected by the net photosynthetic rate (Pn), followed by the leaf area, and the leaf chlorophyll content indirectly affected tomato yield through Pn. The W2 irrigation level combined with the B3 biochar application rate resulted in the best water–biochar combination under the experimental conditions.

1. Introduction

Arid and semi-arid areas are rich in light and heat resources, and are suitable for the development of greenhouse agriculture, which is an effective way to promote rural revitalization and agricultural transformation [1,2]. Rich in nutrients, tomatoes are one of the most popular vegetables [3], and are also a common greenhouse crop. China was the world’s largest tomato producer in 2021, with its planted area and output of 1.14 million hectares and 67.54 million tons, respectively [4]. Greenhouse tomatoes require a lot of water—based on previous research in experimental fields, the water requirement under adequate irrigation is about 300–330 mm [5]—and are supplied with this water mainly through irrigation [6]. However, in arid and semi-arid areas, the problem of the short supply of water resources combined with the high demand for greenhouse crops is prominent, so appropriate irrigation measures should be taken to achieve reductions in water use and the rational allocation of water resources. In recent years, a large number of studies have focused on the trend of deficit-irrigation in the development of water-saving agriculture [7,8,9,10], which is a biological approach to water saving that facilitates the improvement of crop drought resistance during the whole life cycle or specific growth stages of crops, and thus reduces agricultural water use [11,12].
Deficit-irrigation has a specific effect on the growth and physiological index of crops, which affects yield [13,14,15]. Lu et al. [9] conducted a meta-analysis of 561 experimental groups across 25 articles, and showed that deficit-irrigation reduces the average yield of tomato by about 18.6 t ha−1. A large number of studies have shown that, with increases in the degree of water deficit, tomato growth (plant height, stem diameter, leaf area, plant fresh weight and dry weight) and physiological indexes (leaf net photosynthetic rate and SPAD) decrease, and the degree of this influence is positively correlated with the degree of water deficit [16,17,18,19]. Therefore, in arid and semi-arid areas where water resources are scarce, in order to save water and protect the normal growth of crops, it becomes necessary to add substances to the soil under the conditions of deficit-irrigation so as to maintain or increase production.
Biochar is a porous material formed from the organic waste produced by agriculture, forestry and animal husbandry under conditions of high temperature and oxygen deficiency [20]. It has been widely used in recent years in soil and crop yield improvement and the efficient utilization of water and fertilizer [21,22,23]. Commonly used as a soil amendment, biochar can be applied to soil to improve plant growth [24]. Compared with no biochar, the addition of 20% biochar increases leaf number and leaf area by 16–28% and 26–36%, respectively. Meanwhile, the addition of biochar nearly triples the biomass of tomato roots, stems and leaves [25]. The photosynthetic rate and chlorophyll content of capsicum showed an increasing trend with the addition of biochar [26]. Bai et al. [27] conducted a meta-analysis on 627 datasets extracted from 57 articles, and showed that the average crop yield increased by 25.3% with the addition of a certain amount of biochar compared with the addition of no biochar. However, crop yield is not always increased with the addition of more biochar. Li et al. [28] showed that compared with the application of 40 t ha−1, a 20 t ha−1 biochar treatment could facilitate a higher vegetable yield. In summary, deficit-irrigation has a clear negative impact on crop growth, and the application of biochar to soil causes an increase in the yield of crops. However, the effect of the combination of the two on the growth, physiology and yield of tomato needs to be evaluated.
Some studies also have focused on adding a certain amount of biochar to soil under deficit-irrigation conditions in an attempt to save water and increase yield (or maintain yield) [29,30]. Studies have shown that in humid subtropical climates, when the available irrigation water is reduced by 25–50%, adding 25–50 t ha−1 wheat straw biochar to loam soil causes no significant difference in tomato yield compared with full irrigation without biochar. This increase in yield was accompanied by increases in plant height, leaf number per plant, fresh weight and other indicators [13]. However, other studies have shown that biochar cannot alleviate the negative impacts of water deficit on crop growth [31,32]. The effects of biochar on crop growth may be related to climatic conditions, biochar type and quantity added, water deficit degree, soil type and other factors [33]. The interaction between deficit-irrigation and biochar on tomato yield was not consistent under different experimental conditions, so it is necessary to explore the mechanisms of the effects of biochar on tomato yield under deficit-irrigation.
As one of the approaches to research on crop yield formation, source–sink relationship analyses systematically assess the crop material’s source, distribution and output, which elucidates the internal mechanisms of yield formation [34]. Since the source–sink relationship of crops was first proposed by Mason and Maskell [35] in 1928, a large number of scholars have successfully improved crop biomass and yield by adjusting this metric [36,37,38]. The source–sink relationship of crops is affected by factors such as crop genotype, environment and agronomic practice [39]. Compared with the use of irrigation at other growth stages, undertaking single irrigation at the jointing or booting stage of winter wheat can increase the wheat population and leaf size, delay leaf senescence, help to optimize the sink to source ratio, improve the ear grain allocation index and grain production efficiency, and ultimately increase winter wheat yield [40]. Delaying the sowing date of maize can reduce the number, size and activity of the grain grown (sink capacity), as well as the supply of assimilates (source capacity) at the filling stage, thus reducing the grain yield [41]. Existing studies on the source–sink relationship mainly focus on cereal crops such as wheat, maize and rice [42,43], while relatively few studies have addressed the source–sink relationship of greenhouse crops such as tomato [44].
Currently, attempts to regulate the source–sink relationship in crops have mainly focused on field operations such as irrigation, fertilization, leaf cutting and heading removal [42]. However, there are few reports on the effects on tomato yield of including biochar during deficit-irrigation focusing on the source–sink relationship. As such, by adding biochar at different deficit levels, the objectives of this study were as follows: (1) to analyze the effects of different treatments on the characteristics of the greenhouse tomato source and sink, and determine the optimal water–biochar combination for attaining high yields of greenhouse tomato; and (2) by focusing on the source–sink relationship, to clarify the mechanism of the influence of biochar on the yield of greenhouse tomatoes under deficit-irrigation, thus providing a theoretical basis for saving water and increasing the yield of greenhouse tomatoes.

2. Materials and Methods

2.1. Description of the Study Site

Greenhouse trials were conducted in 2021 and 2022 in Liujiapu Village (112°24′~112°43′ E, 37°36′~37°49′ N), Xiaodian District, Taiyuan City, Shanxi Province, China. The study area has a continental semi-arid climate influenced by typical warm temperate monsoons, with an average annual temperature of 9.5 °C, an average sunshine duration of 2675.8 h, and a frost-free period of 202 days. The greenhouse was 60 m long and 10 m wide. The plot area was 28.8 m2 (8 m × 3.6 m), and each plot comprised 3 ridges and 3 furrows (ridge length × width × height dimensions are 8 m × 0.8 m × 0.1 m, with a furrow width of 0.4 m). In this study, two rows of tomatoes were planted in each ridge, and two drip irrigation tapes were laid between the plants. Between 5 and 7 days after transplanting (DAT), a layer of black mulch 1.5 m wide and 0.008 mm thick was applied to fully cover the surface of the plot, and an impervious film was buried at a depth of 60 cm between adjacent plots to prevent the lateral exchange of soil water.

2.2. Experimental Materials

Before the experiment started, three sampling points were randomly selected in the greenhouse plot, and soil samples were collected and mixed every 20 cm to a depth of 60 cm. Soil texture was measured using the hydrometer method [45] and the average content for sand was 20 ± 2%, for silt 54 ±1.6%, and for clay 27 ± 0.8%. According to the Chinese soil classifications, the test site featured a silty loam soil type. Soil bulk density and field capacity were measured by the ring knife method [46]. Soil pH was measured by the pH electrode method (water and soil ratio 2.5:1). Soil organic matter was determined with potassium dichromate external heating [47]. Soil total N was determined through an elemental analyzer (Vario MACRO Cube, Elementar, Langenselbold, Germany). Soil total phosphorus (TP) and total potassium (TK) were determined by the NaOH melting method, TP was determined by the molybdenum antimony colorimetric method, and TK was determined by the flame photometer method [47]. The measured physical and chemical properties of the soil are shown in Table 1.
The biochar applied in this study was a corn stalk biochar obtained by high-temperature pyrolysis (400–500 °C) in a tempering furnace. Before the experiment began in 2021, the biochar was evenly spread on the soil’s surface, with no reapplication in 2022. The biochar and 20,000 kg ha−1 of cow manure were combined using a rototiller to produce the 0–30 cm soil layer, and the same quantity of cow manure was applied every year. The organic matter and pH were measured using the same methods used on the soil samples. The carbon (C), hydrogen (H) and nitrogen (N) of biochar were analyzed with an elemental analyzer instrument Vario EL III according to the procedure provided by the manufacturer [48]; C/N is the ratio of carbon to nitrogen. The measured physical and chemical properties of biochar are shown in Table 1.
The tomato variety used in this study, “Shouyan PT326”, was planted on 17 May 2021 and 25 May 2022, with row and plant spacings of 60 cm and 50 cm, respectively, and a transplanting density of 35,417 plants ha−1. After transplanting, 25 mm of water was applied to ensure the survival of the seedlings. The tomato growth stage was divided into the seedling period (17 May–22 June 2021; 25 May–30 June 2022), the flowering and fruiting period (23 June–13 July 2021; 1 July–22 July 2022), the fruit expansion period (14 July–25 August 2021; 23 July–4 September 2022) and the fruit-ripening period (26 August–22 September 2021; 5 September–30 September 2022), while a slow growth of seedlings was observed within 15 days of transplanting, and no test treatment was carried out.

2.3. Experimental Design

Greenhouse trials were conducted in 2021 and 2022 with five biochar (B) application rates and three irrigation (W) levels. The B treatments were B0: 0 t ha−1; B1: 15 t ha−1; B2: 30 t ha−1; B3: 45 t ha−1; and B4: 60 t ha−1 and the W levels were W1: 50–70% of field capacity (θf); W2: 60–80% of θf; and W3B0: 70–90% of θf full irrigation without biochar, which was designated as the control. Here, 50–70% θf indicates that the lower limit and upper limit of irrigation were 50% and 70% of the field capacity (θf), respectively, and the other levels were similar. There were 11 treatments in total, with three replicates per treatment. The test scheme is shown in detail in Table 2.

2.4. Measurement and Methods

2.4.1. Source Characteristic

Leaf Area

At the end of the slow growth of seedlings, 3 tomato plants were selected for each treatment, and their leaf areas were measured every 7 days. We measured the maximum length (L/cm) and width (W/cm) of the leaves and counted the number of leaves (n) of each tomato plant, and calculated the leaf area (LA/cm2) of the plants; the actual area of leaves was measured using the grid method during the first measurement process [49]. The ratio of actual leaf area to calculated leaf area is the leaf area coefficient, the average value of which in this test was 0.558, and the formula for calculating leaf area is as follows:
L A = 0.558 × n × L × W

Leaf Soil Plant Analysis Development (SPAD)

The SPAD meter measures the difference between the transmittance of a red and an infrared light [50]. Due to the strong correlation between chlorophyll content and SPAD values, measuring leaf SPAD values is an effective, non-destructive method for monitoring chlorophyll content in leaves [51]. The sample plants and measuring times used for determining leaf SPAD are the same as those used for LA. The leaf SPAD values of new leaves at the tops of tomato plants were determined using a chlorophyll analyzer (SPAD-502, Konica Minolta, Japan) applied in 4 directions, and the average values were taken as the SPAD values of an individual plant.

Net Photosynthetic Rate (Pn)

The Pn was measured once at the end of each growing period. Three tomato plants showing consistent growth patterns were selected for each treatment, and the leaf Pn was determined using an LI–6400 portable photosynthetic system. The Pn was measured on the young fully exposed leaf at a concentration of 1000 PARi (µmol m−2 s−1), with a chamber flow rate of 300 mL min−1. The measurement period was 09:00 to 12:00 in the morning, and the heights and orientations of the tomato leaves were kept consistent during the measurement.

Leaf Weight Per Plant (LWPP)

A 30 × 25 cm area was established around the center of the plant, corresponding to the measured Pn, and the whole plant was excavated to a depth of 60 cm. The roots, stems, leaves and fruits of the plant were separated, and each part was placed in an oven at 105 °C for 30 min and dried at 75 °C to constant weight. The dry weight was then measured using a balance (YP-B, Lichen, Jinjiang, China) with an accuracy of 0.01 g. Leaf weight per plant (LWPP) was used as the source characteristic index.

2.4.2. Sink Characteristic

Stem weight per plant (SWPP), root weight per plant (RWPP), fruit weight per plant (FWPP) and total yield were taken as the key characteristics of tomato sink, and the number of fruits per plant (FNPP) was recorded. The building of sink capacity is represented by FNPP. Weight per fruit (WPF) is the ratio of FWPP to FNPP, and WPF represents the filling of the sink capacity. Leaving 4 ears of fruit on each tomato plant, the core was picked, and the yield of each plant in each plot was measured using an electronic balance (A16, Kaifeng, China) with a precision of 0.05 kg.

2.4.3. Sink–Source Ratio

In this paper, the ratio of weight per fruit to leaf area (WPF–LA), the ratio of the number of fruits per plant to leaf area (FNPP–LA) and the harvest index (HI) are used to represent the sink-to-source ratio of greenhouse tomatoes [42], where WPF–LA is the ratio of the weight per fruit to the maximum leaf area during the growth stage, FNPP–LA is the ratio of the number of fruit per plant to the maximum leaf area during the growth stage, and HI is the ratio of fruit weight per plant to the total dry weight of all organs of the tomato.

2.5. Statistical Analysis

IBM SPSS Statistics 26 (IBM, Armonk, NY, USA) was used to perform the two-factor analysis of variance, and Duncan’s method was used to perform the significance analysis at the p < 0.05 level. IBM SPSS AMOS 26 was used for path analysis.

3. Results

3.1. Effects of Biochar on Tomato Source Characteristics under Deficit-Irrigation
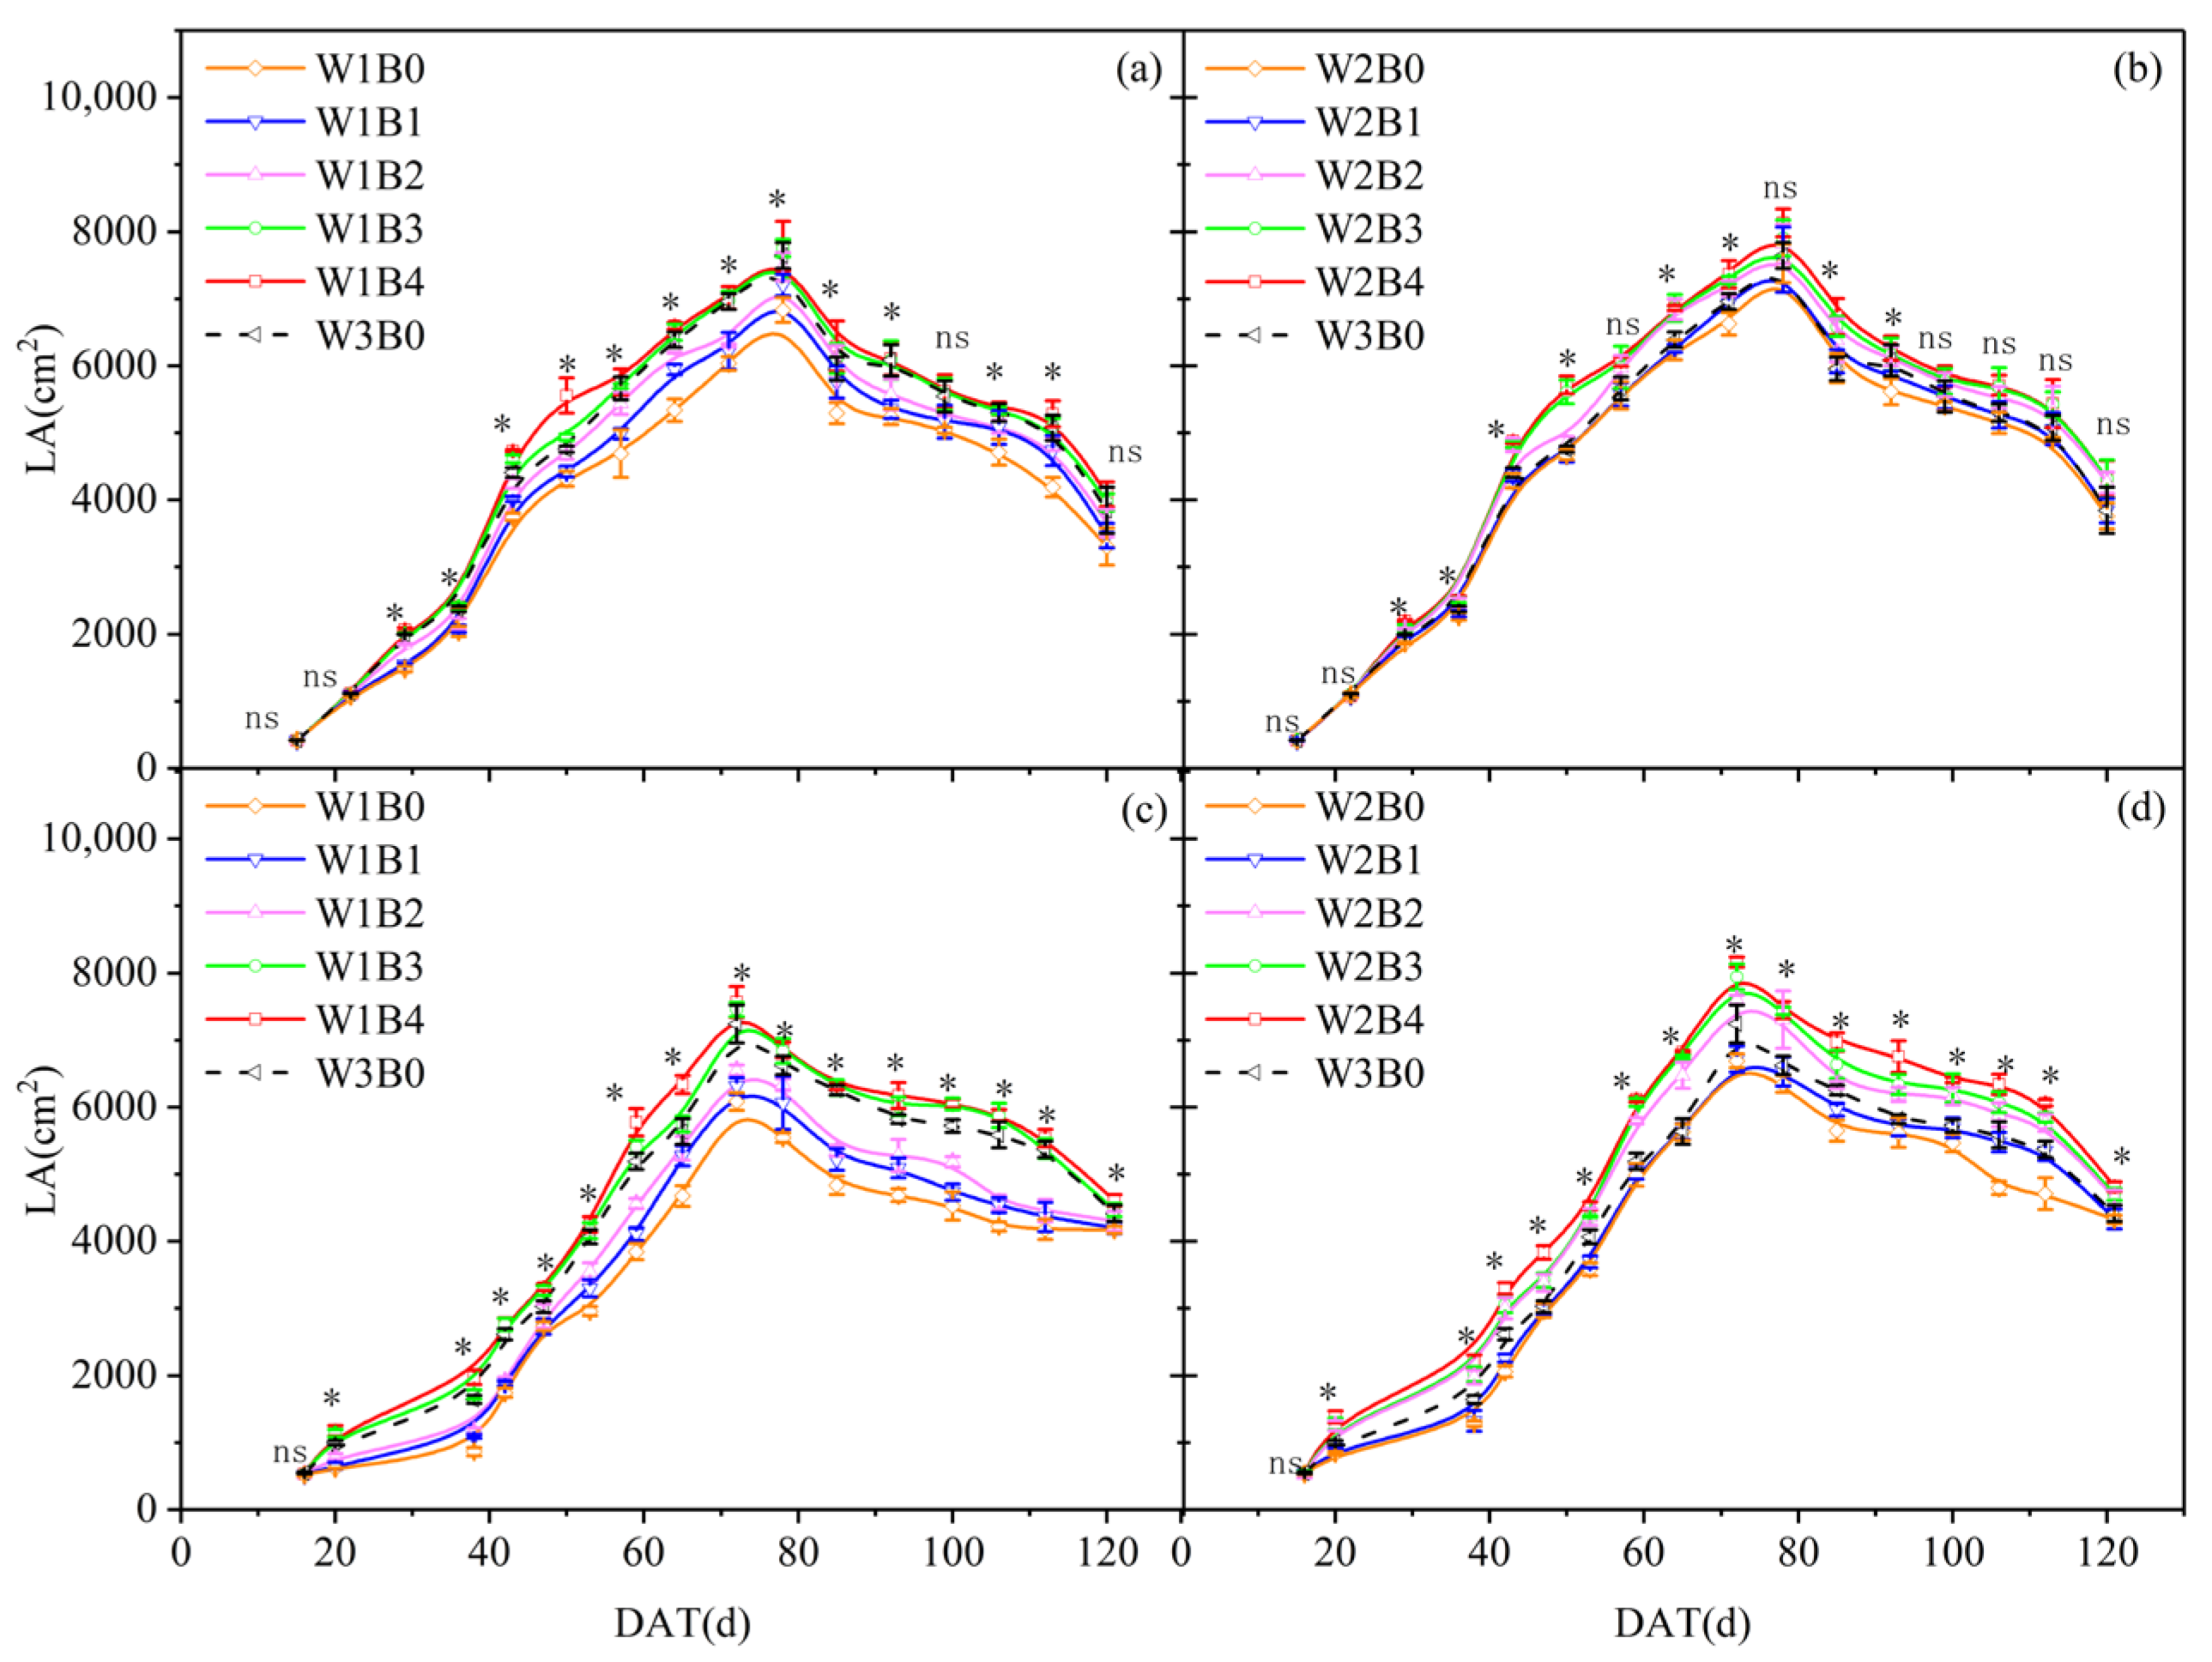
3.1.1. Leaf Area

Figure 1 shows the dynamic changes in tomato leaf area in 2021 (a,b) and 2022 (c,d) with the number of days after transplanting under different treatments. The tomato leaf area was taken as the main index in this paper to evaluate source capacity; it showed a trend of first increasing and then decreasing as the growth stage advanced. No significant differences were seen among different treatments in the early growth stage, while a significant difference began to gradually appear among the treatments on the 29th and 20th days after transplanting in 2021 and 2022, respectively. The leaf area of tomato reached its maximum value at 78 and 72 days after transplanting in the two years, respectively. Compared with W3B0, the maximum leaf area values of W2B0 and W1B0 decreased by 2–8% and 11–16%, respectively. With the application of the same level of irrigation, the maximum leaf area values in 2021 and 2022 increased by 1–12% and 0.4–20%, respectively, compared with that without biochar added. Compared with CK, the addition of 45–60 t ha−1 and 30–60 t ha−1 biochar increased the tomato leaf area by 1–5% and 2–13%, respectively, at the W1 and W2 irrigation levels, indicating that adding the appropriate amount of biochar can compensate for the adverse effects of deficit-irrigation on tomato source capacity.

3.1.2. SPAD

The dynamic changes in leaf SPAD with DAT in 2021 (a,b) and 2022 (c,d) are shown in Figure 2. The SPAD values showed similar trends of dynamic change with time in terms of the leaf area values, but the SPAD values of leaves under two years of age reached significance after 20–23 days from transplanting, while the same values reached their maximum at 78 days and 72 days after the two-year mark of W3B0, respectively. Compared with CK, the maximum leaf SPAD value under the W1 and W2 irrigation systems was reached 7 days earlier. When no biochar was added, the SPAD values of the W1 and W2 levels were lower than those of CK (DAT = 78 days in 2021; DAT = 72 days in 2022) by 7–20% and 2–12%, respectively. Under the same irrigation level, the SPAD values of leaves showed an increasing trend with greater biochar addition. Compared with B0, the B1, B2, B3 and B4 treatments showed SPAD values (DAT = 78 days and 72 days) increased by 1–3%, 4–9%, 4–13% and 5–14%, respectively. The SPAD values of the W1B3, W1B4, W2B2, W2B3, and W2B4 groups treated for two years were higher than those of W3B0.

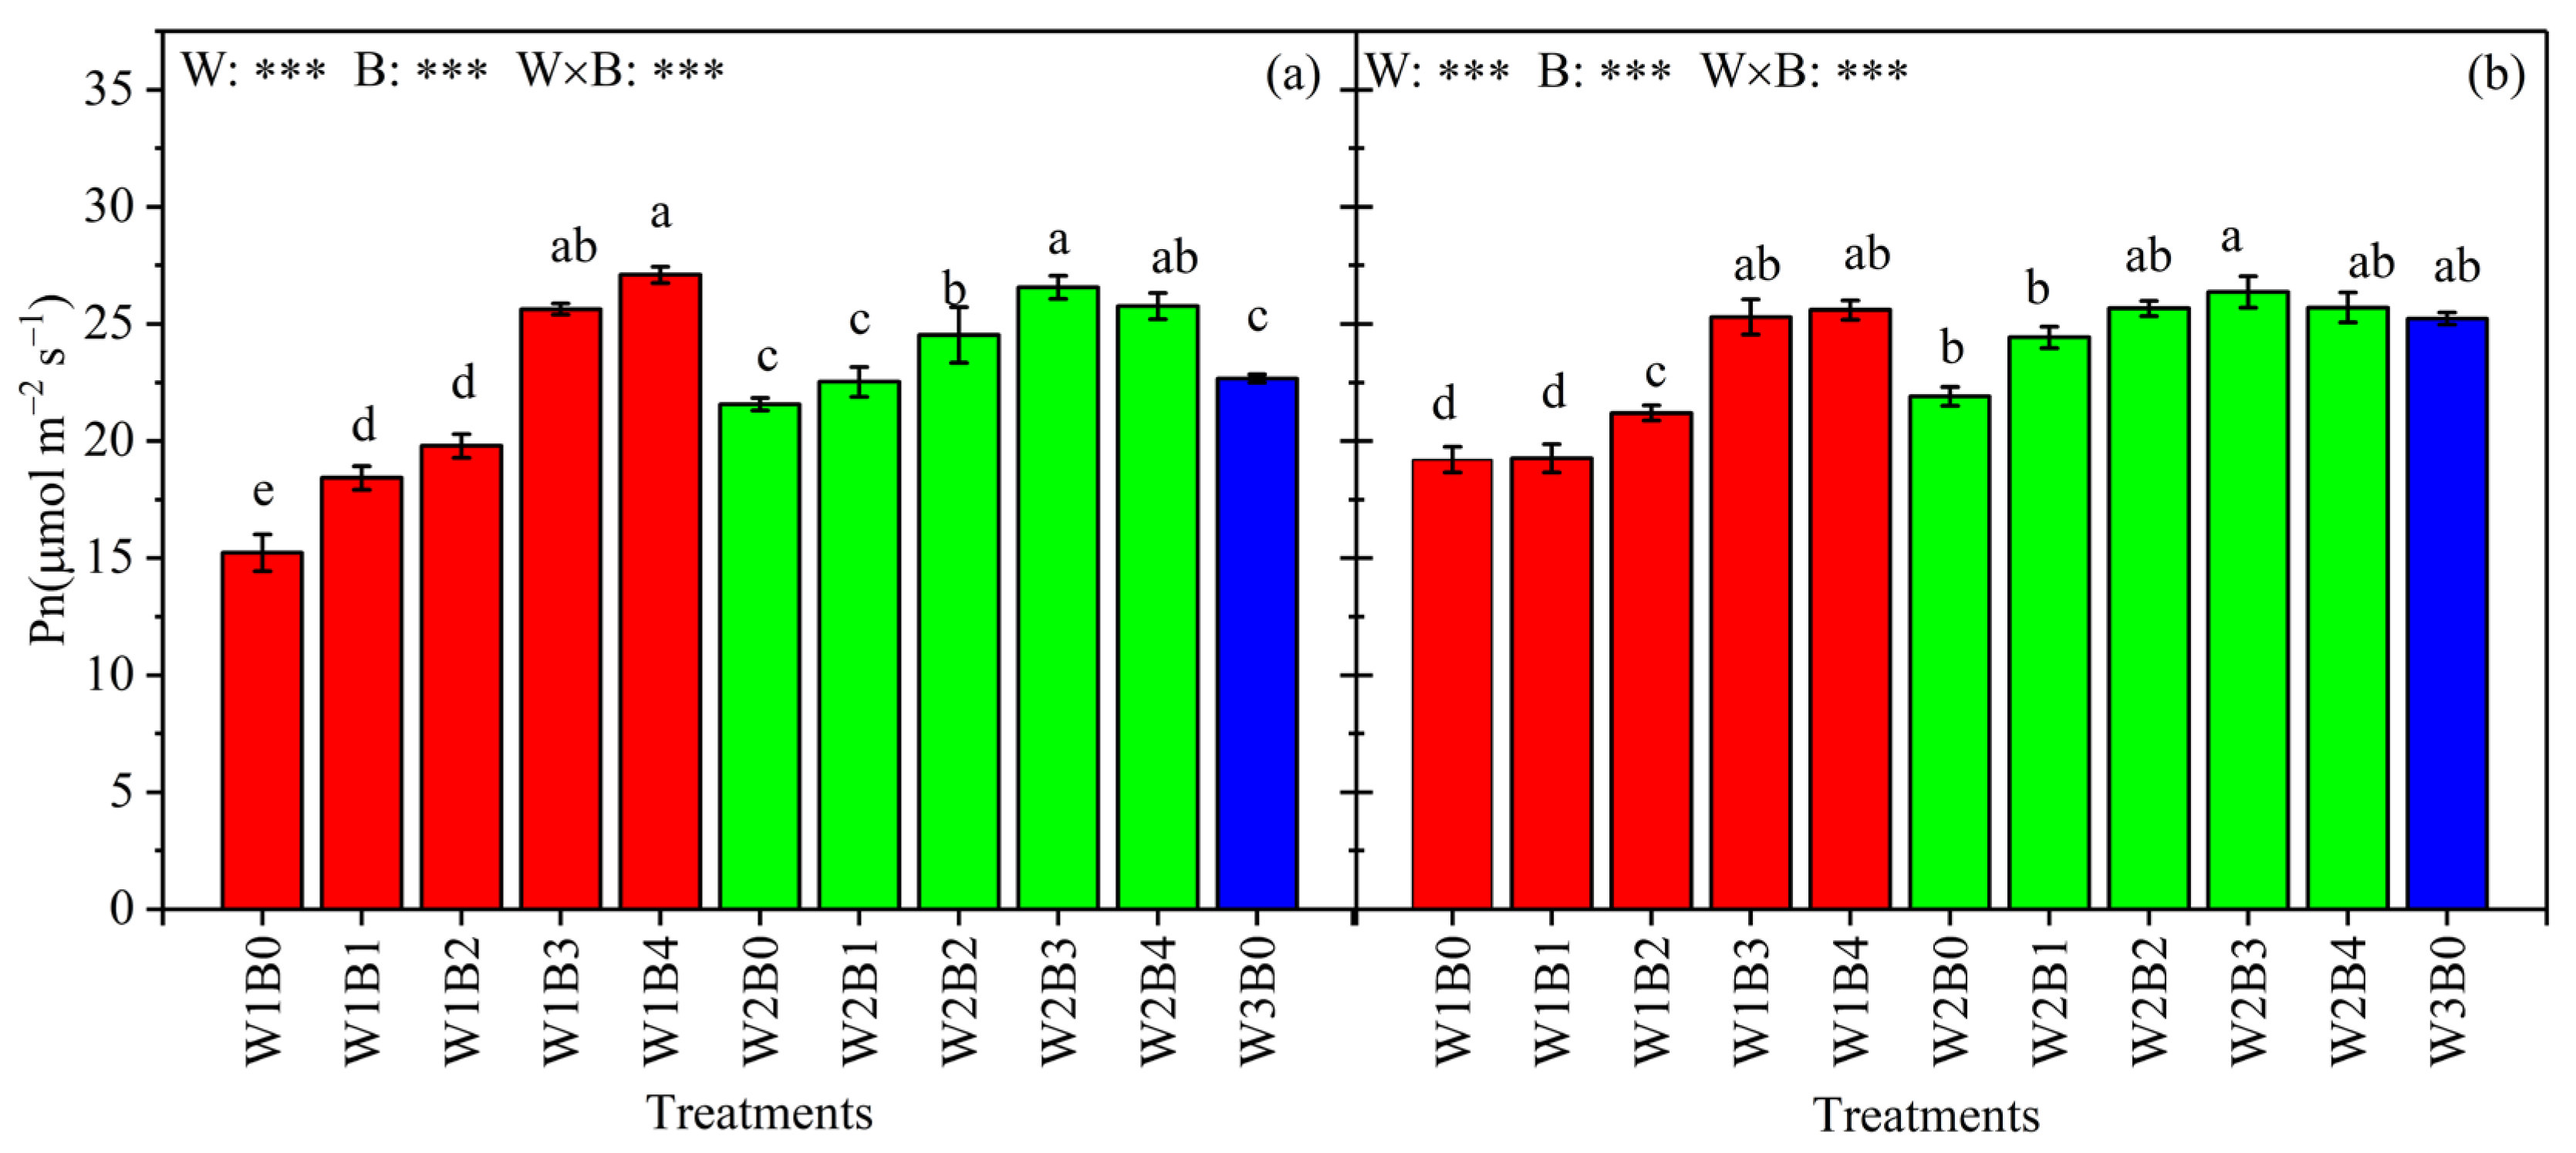
3.1.3. Net Photosynthetic Rate (Pn)

The effects of different levels of irrigation and of biochar addition on the Pn values of tomato leaves at different growth stages were similar. Taking the key growth stage (fruit expansion stage) for yield formation in 2021 (Figure 3a) and 2022 (Figure 3b) as examples, the effects of the levels of irrigation and biochar addition, and their interaction, on the Pn of tomato leaves were extremely significant (p < 0.001). Compared with CK, W1B0 and W2B0 showed Pn values reduced by 24–33% and 5–13%, respectively. Under the W1 treatment, the Pn value was increased with the increase in biochar addition. Under W2, the Pn value first increased and then decreased with the increase in biochar addition, and it reached its maximum value under the B3 level. The Pn values of W2B3 in both years were the highest, and were 43% and 27% higher than the lowest value (W1B0). Compared with CK, the Pn values of the W1B3, W1B4, W2B2, W2B3, and W2B4 tomato leaves were increased by 0.3–12%, 1–16%, 2–8%, 4–15% and 2–12%, respectively. The results indicate that the addition of 45–60 t ha−1 and 30–60 t ha−1 biochar at W1 and W2 irrigation levels could improve the Pn value of tomato.

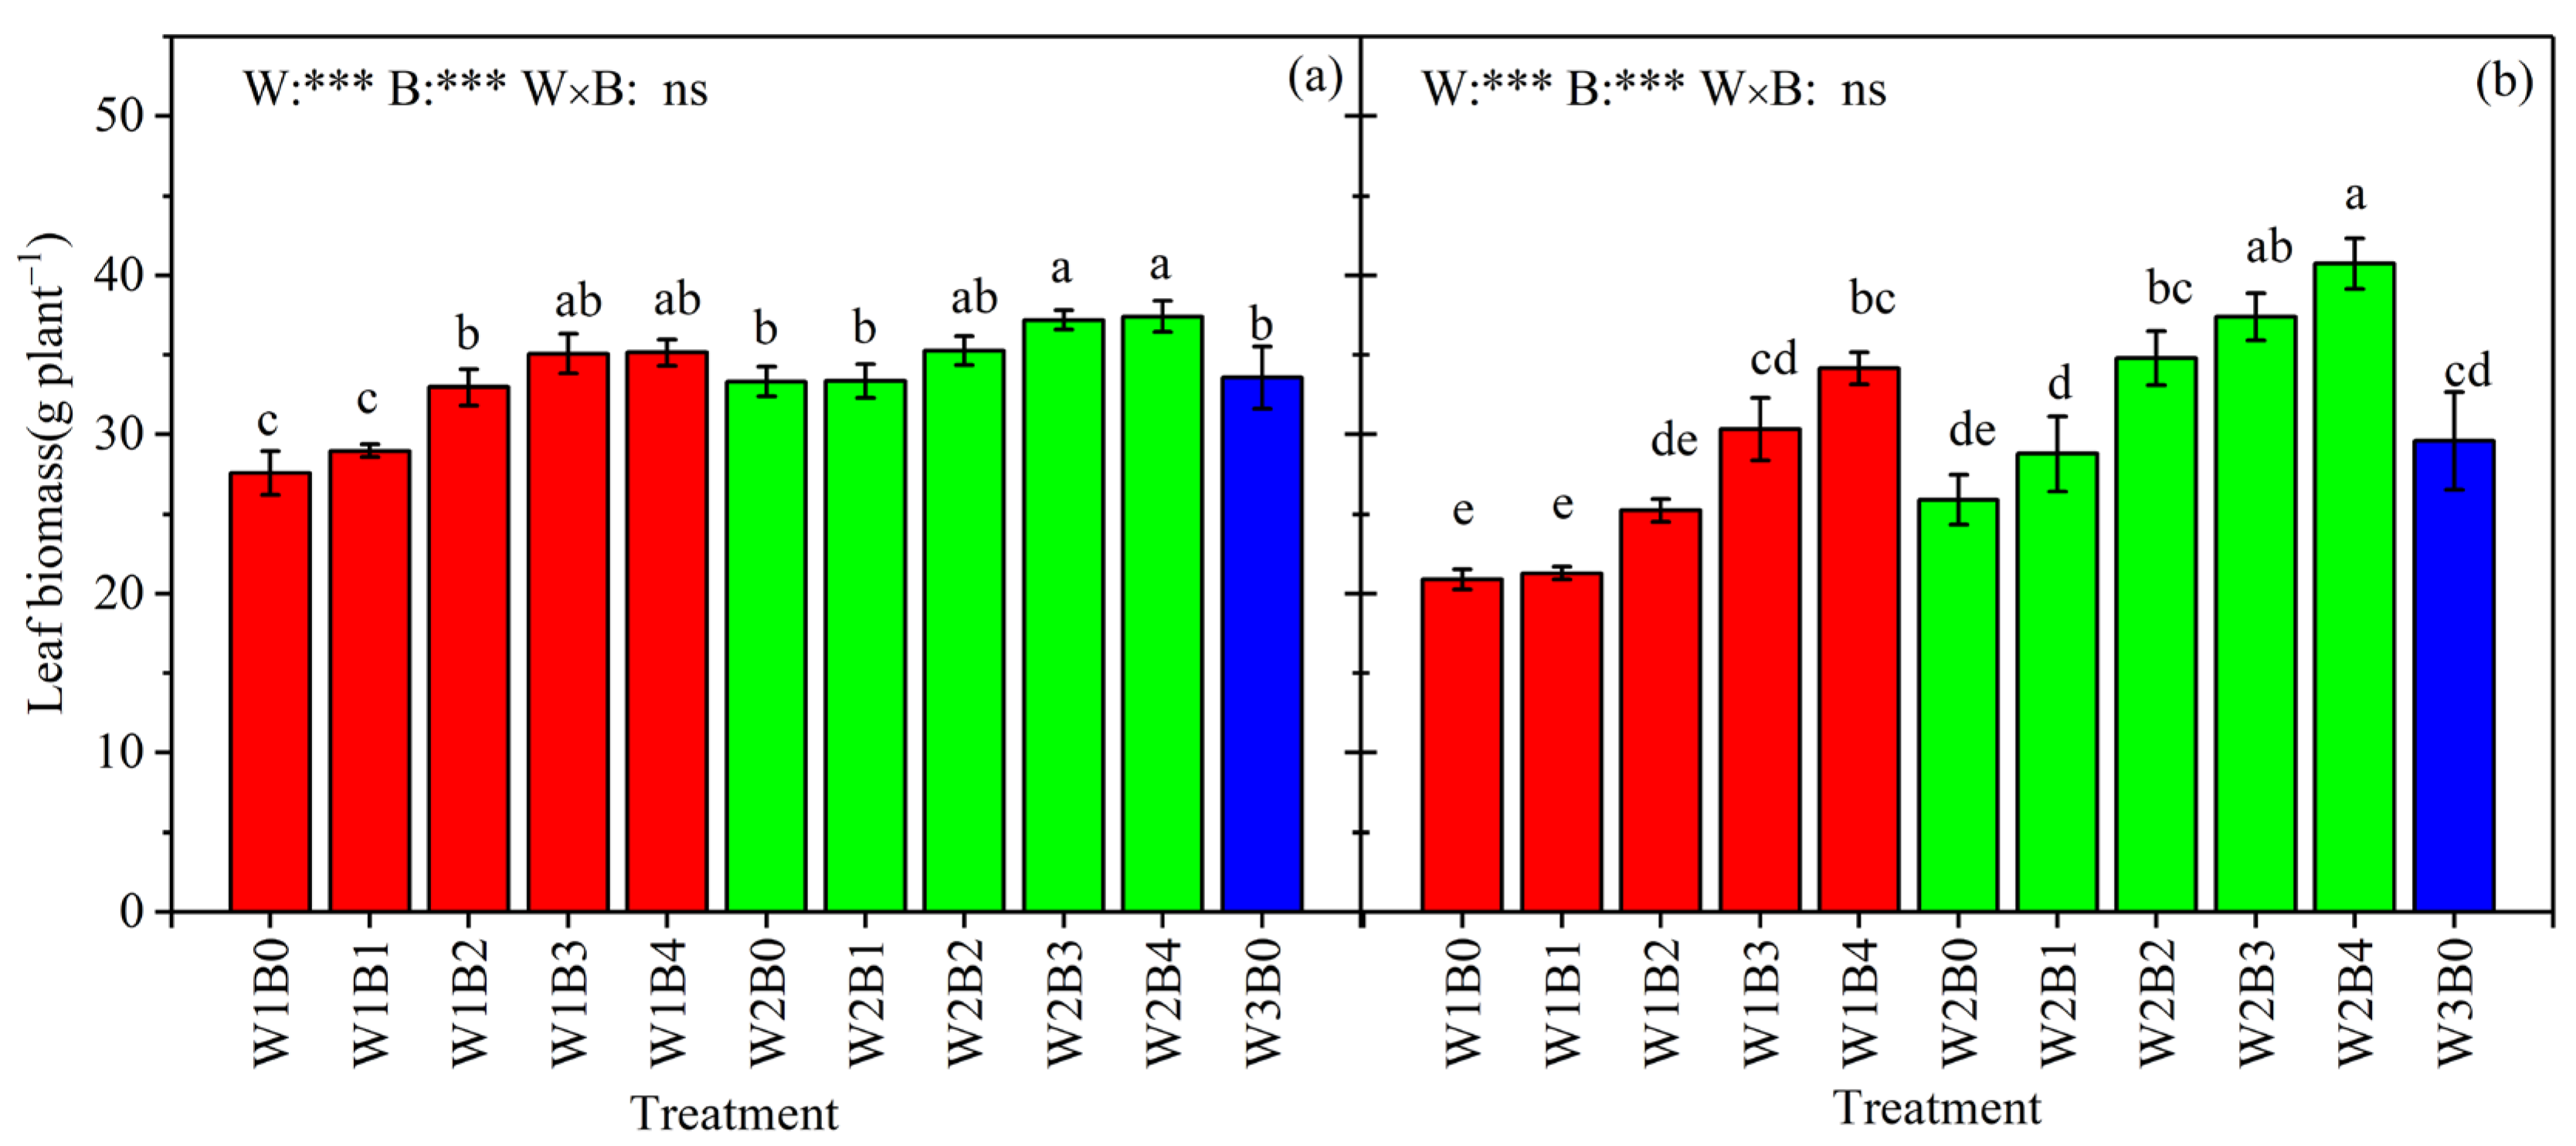
3.1.4. Leaf Weight per Plant (LWPP)

The levels of irrigation and biochar addition had extremely significant effects (p < 0.001) on LWPP at the fruit expansion stage in 2021 (Figure 4a) and 2022 (Figure 4b), but there was no significant interaction effect on LWPP (p > 0.05). LWPP accounted for 26–34% of total biomass under each of the different treatments. With reductions in the irrigation level, the LWPP of tomato showed a decreasing trend, and the LWPP of the W1B0 and W2B0 treatments decreased by 18–29% and 1–12% compared with CK, respectively. With the same level of irrigation, compared with B0, the B1, B2, B3 and B4 treatments showed LWPP values increased by 0.1–10%, 5–26%, 10–31% and 11–39%, respectively. Except for in the W1B1 and W1B0 treatments, the LWPP value under deficit-irrigation was not significantly lower than that derived under W3B0.

3.2. Effects of Biochar on Tomato Sink Characteristics under Deficit-Irrigation

3.2.1. Stem Weight per Plant (SWPP) and Root Weight per Plant (RWPP)

The SWPP and RWPP values of tomatoes in 2021 (a) and 2022 (b), subjected to different levels of irrigation and biochar addition, are shown in Figure 5. Under the same conditions of biochar addition, water deficiency reduced the SWPP and RWPP values by 2–26% and 6–48%, respectively. Under the conditions of deficit-irrigation, the addition of biochar increased the average SWPP and RWPP values by 0.1–26% and 0.8–50%, respectively, compared with the addition of no biochar. The sum values of SWPP and RWPP achieved by W1B3, W1B4, W2B2, W2B3, and W2B4 tomatoes were increased by 0.6–4%, 2–6%, 2–17%, 4–20% and 5–24% compared with W3B0, respectively. The results indicate that the addition of 45–60 t ha−1 and 30–60 t ha−1 biochar under the W1 and W2 irrigation conditions could compensate for the adverse effects of water deficit on tomato root and stem growth.

3.2.2. Fruit Weight per Plant (FWPP) and its Composition

Table 3 shows the effects of biochar on the values of weight per fruit (WPF), fruit number per plant (FNPP) and fruit weight per plant (FWPP) achieved by greenhouse tomatoes under different irrigation conditions. The effects of the levels of irrigation and biochar addition, and their interaction, on WPF in 2022 were more significant than those in 2021, and no significant difference was seen in the FNPP values of tomatoes under different treatments, indicating that WPF is an important factor affecting FWPP. There were no significant differences in WPF or FWPP between the W2B0 and CK treatments in either year, while the WPF and FWPP values of W1B0 decreased by 24–26% and 26–28%, respectively, compared to CK. Under the W2 level, both the WPF and the FWPP first increased and then decreased with the increase in biochar addition. Under the W1 level, both the WPF and FWPP values showed an increasing trend with the increase in biochar addition. Compared with CK, the addition of 45–60 t ha−1 and 30–60 t ha−1 biochar improved both WPF and FWPP under the W1 and W2 irrigation conditions, respectively. The maximum values of WPF achieved in 2021 (W2B3) and 2022 (W1B4) were 42% and 46% higher than the minimum value achieved (W1B0), respectively. The maximum values of FWPP achieved in the W2B3 treatment were 39% and 47% higher than the minimum value (W1B0 treatment), respectively.

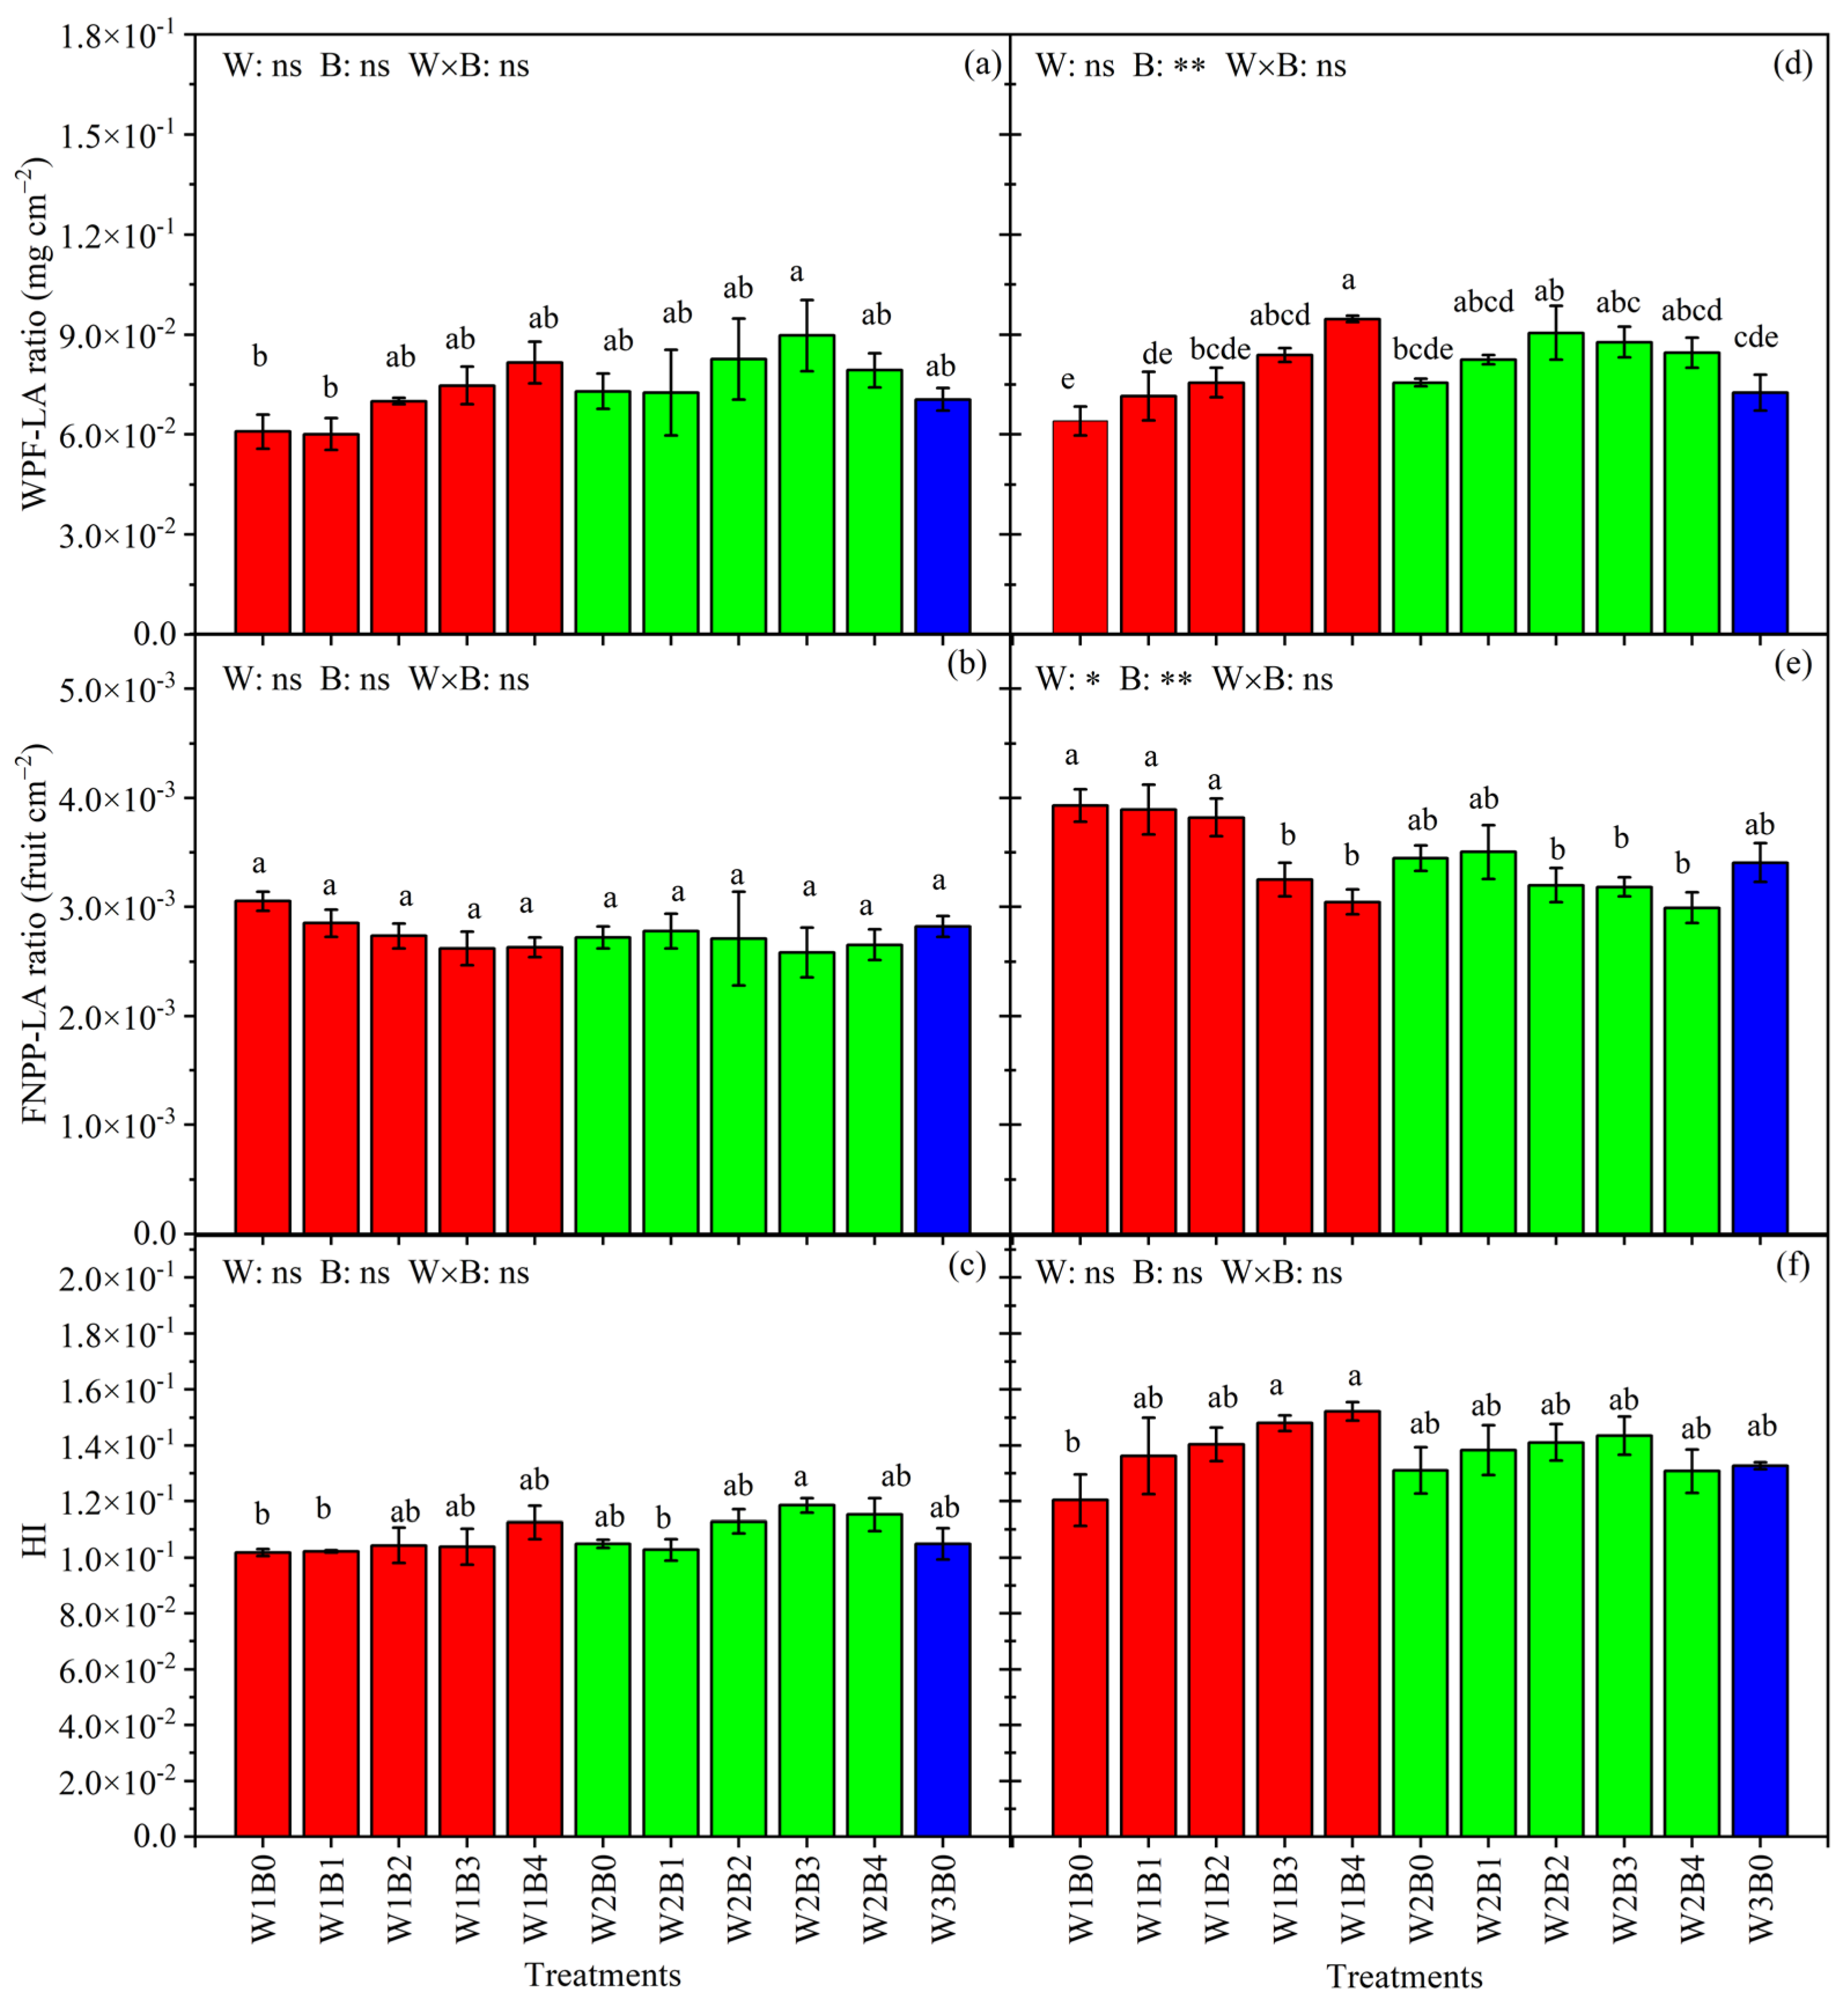
3.3. Effects of Biochar on the Sink–Source Ratio of Tomato under Deficit-Irrigation

The effects of biochar on the sink–source ratio index of tomatoes in 2021 (Figure 6a–c) and 2022 (Figure 6d–f) were different under different irrigation conditions. The amount of biochar added had a significant effect on the WPF–LA value in 2022 (p < 0.01). Under the W1 level, the WPF–LA value showed an increasing trend with the increase in biochar addition, while under W2, this value first showed an increasing trend, and then showed a decreasing trend, with the increase in biochar addition. In 2021 and 2022, WPF–LA reached its maximum values under the W2B3 and W1B4 treatments, which were 33% and 32% higher, respectively, than the minimum values in the two years obtained under the W1B1 and W1B0 treatments. The effects of the levels of irrigation and biochar addition on FNPP–LA reached significance only in 2022, while their interaction had no significant effect on FNPP–LA in either year. Under the W1 level, FNPP–LA showed a decreasing trend with the increase in biochar addition. Under W2, the FNPP–LA value showed a trend of first increasing and then decreasing with the increase in biochar addition, with the maximum value reached under B1. The trend of HI value varied with irrigation level and biochar addition amount in a manner similar to WPF–LA. In 2021 and 2022, the HI values reached their maximum under the W2B3 and W1B4 treatments, which were 14% and 21% higher than the minimum values in the two years, respectively, both of which were obtained under the W1B0 treatment.

3.4. Source–Sink Mechanism of Tomato Yield Formation

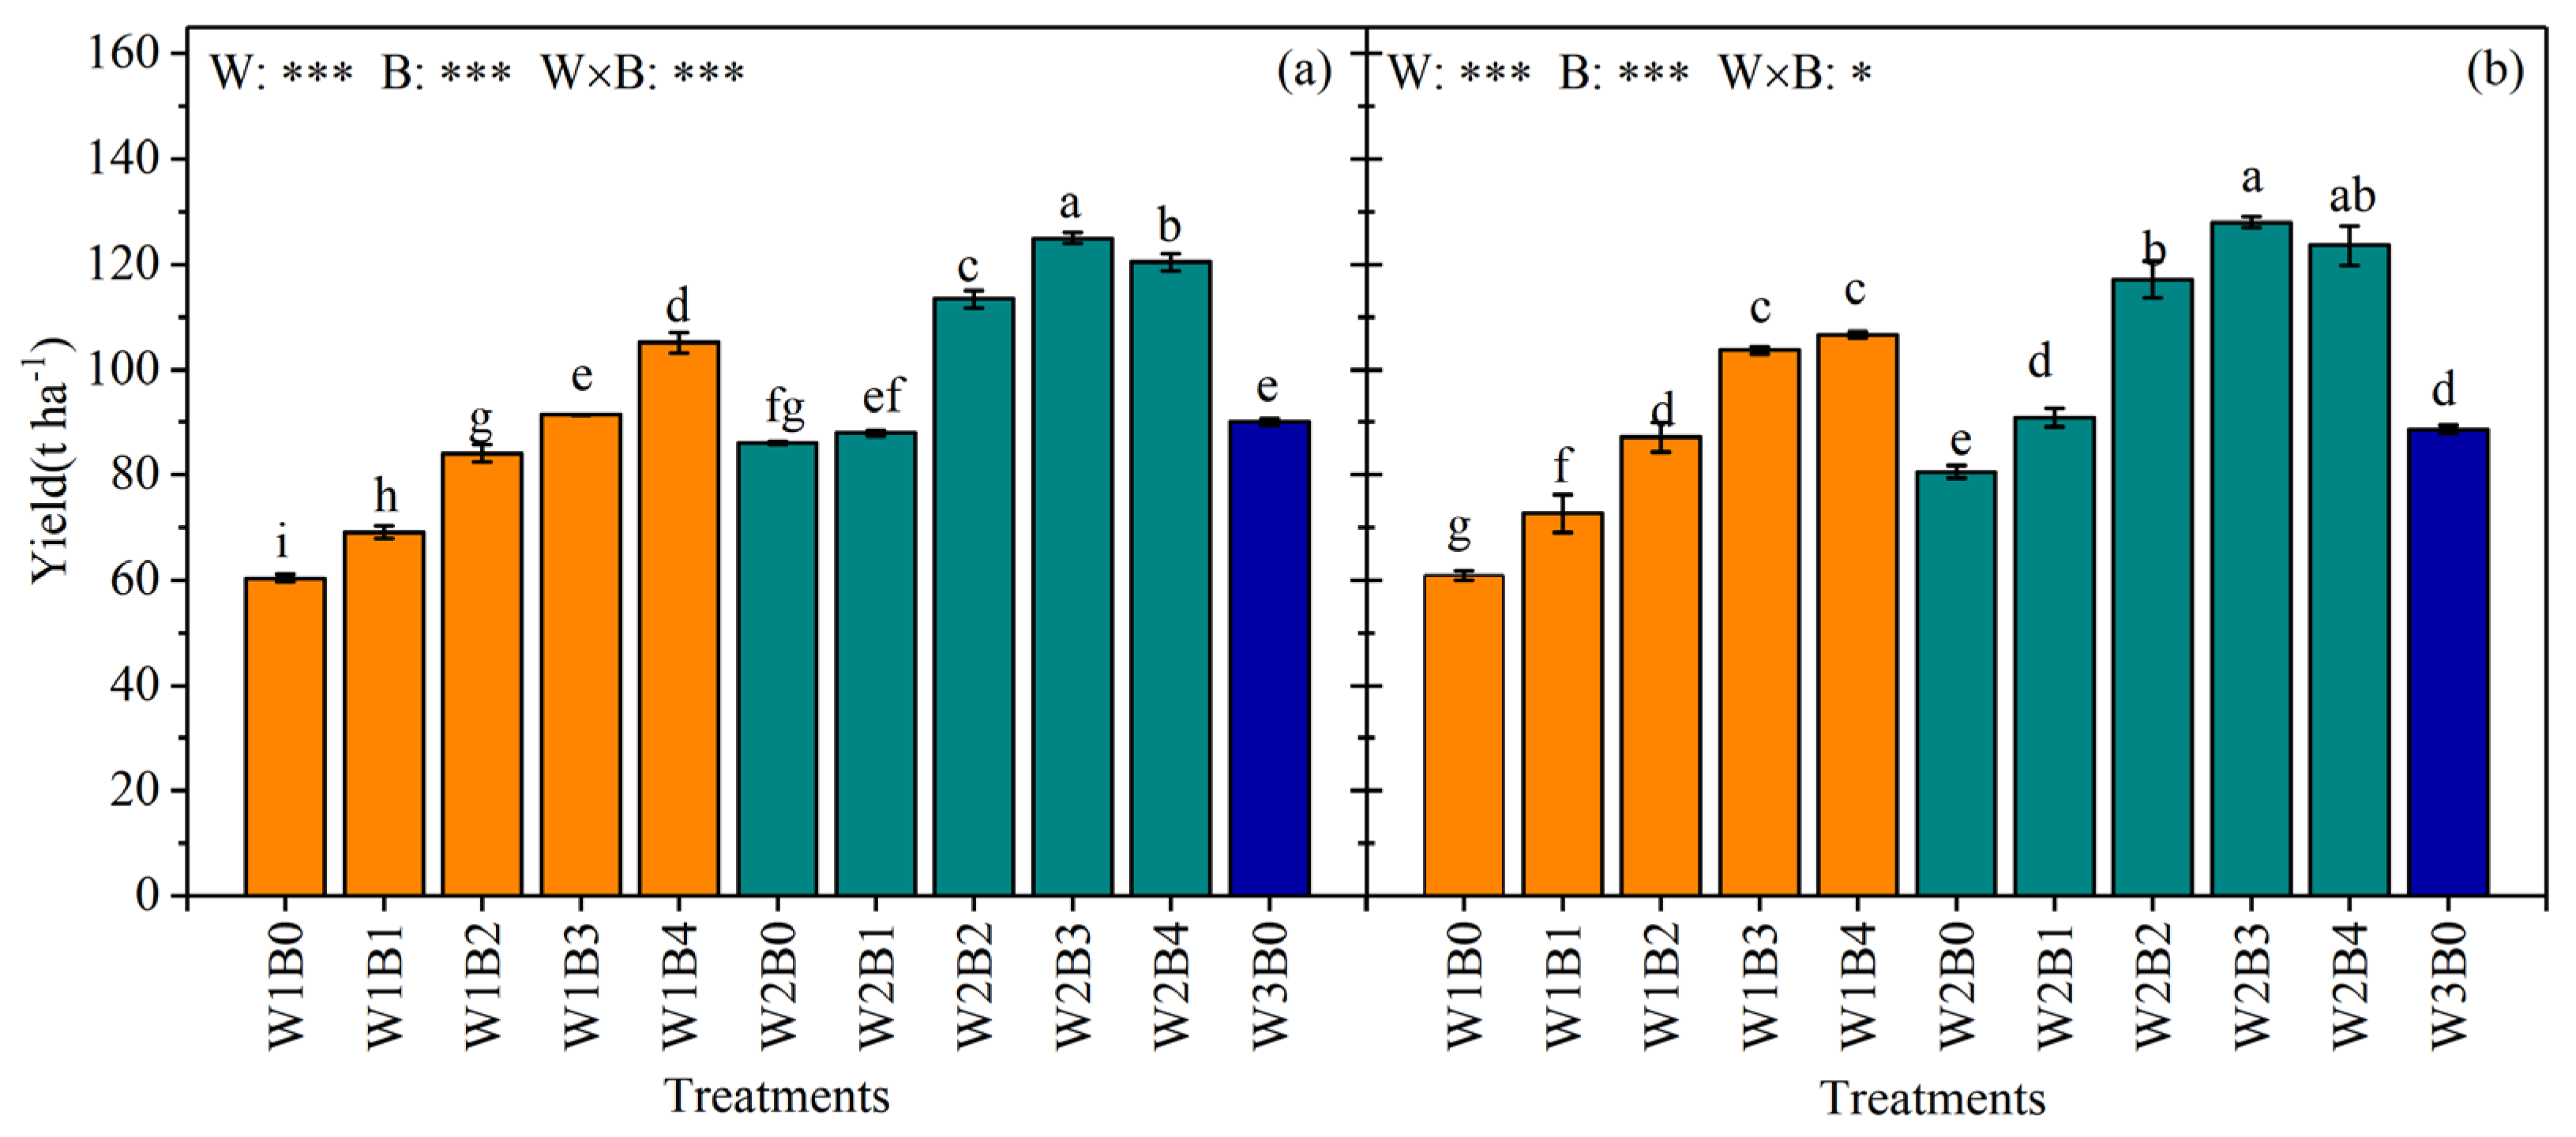
3.4.1. Effects of Biochar on Greenhouse Tomato Yield in Deficit-Irrigation

The effects of the levels of irrigation and biochar addition on greenhouse tomato yield (Figure 7) in the two years were extremely significant (p < 0.001), and their interaction was extremely significant in 2021 (p < 0.001) and significant in 2022 (p < 0.05). When the amount of biochar addition was 0 t ha−1, employing the W1 and W2 irrigation schemes reduced tomato yield by 34–35% and 5–9% compared with CK, respectively. Under the W2 irrigation scheme, tomato yield first increased and then decreased with the increase in biochar addition, and reached its maximum under the B3 level. Under the W1 scheme, the tomato yield increased with the increase in biochar addition, and the tomato yield attained under the W2B3 treatment was the highest, which was 52% higher than the lowest values (attained under W1B0) in 2021 and 2022. In addition, compared with the CK scheme, the yields under W1B3, W1B4, W2B2, W2B3 and W2B4 were increased by 1–15%, 14–17%, 21–24%, 28–31% and 25–28%, respectively. The results indicate that the addition of a suitable biochar could compensate for the adverse effects of deficit-irrigation on tomato yield.

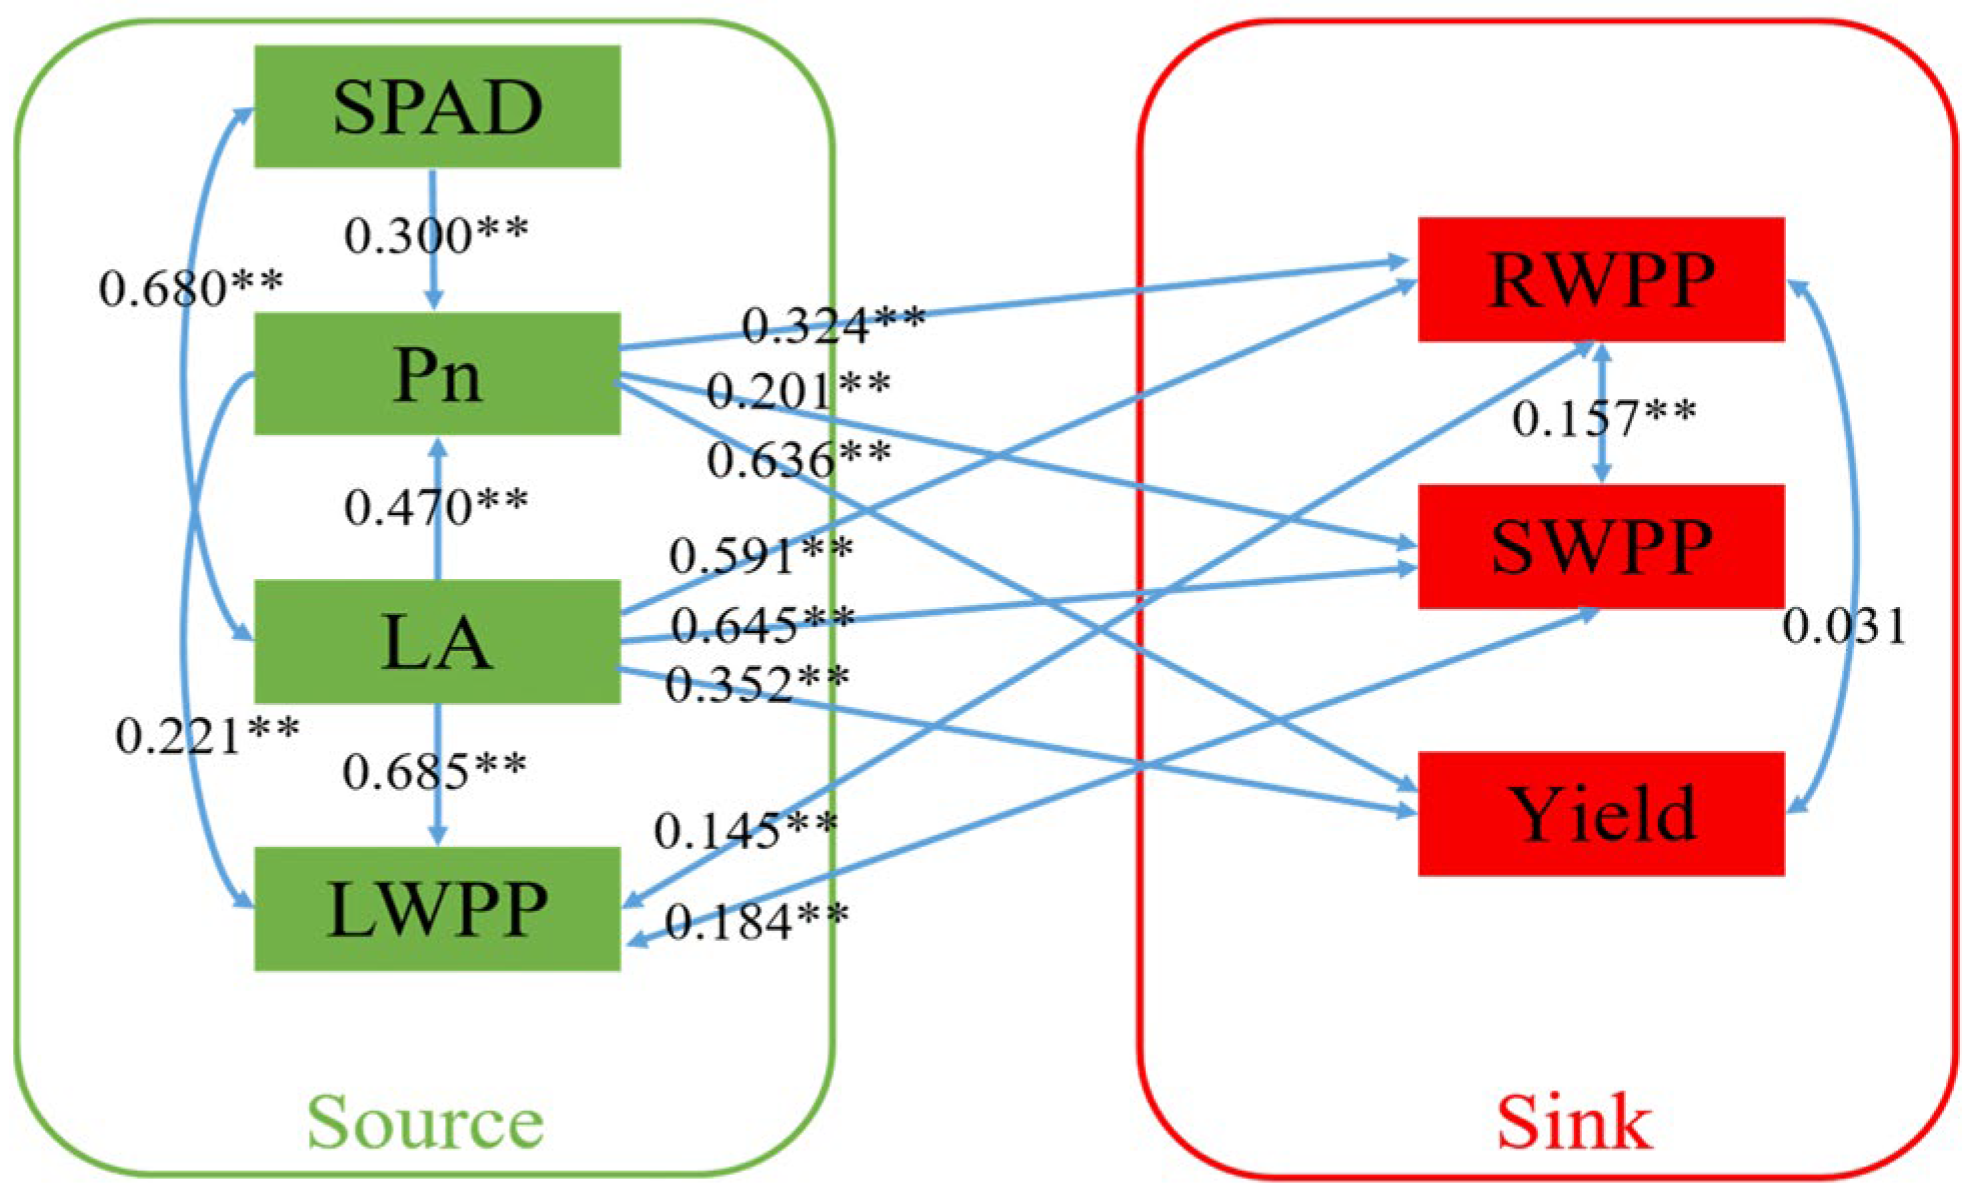
3.4.2. Source and Sink Mechanism Path Analysis for Greenhouse Tomato Yield Formation

With reference to existing studies [5] and with the application of logical inference, a path analysis of the effect of the source–sink relationship on the yield formation of greenhouse tomato was conducted (Figure 8). The simulation showed a goodness-of-fit index (GFI) = 0.962 > 0.9, a comparative fitting index (CFI) = 0.965 > 0.9, and a normalized fitting index (NFI) = 0.957 > 0.9. The approximate error root mean square (RMSEA) was 0.212, which is slightly larger than the criterion (0.10), and this indicates that the proposed model can elucidate the effects of the source–sink relationship on tomato yield. The results of the model show that tomato yield was primarily directly affected by Pn, with a direct path coefficient of 0.636, followed by LA (0.352). SPAD indirectly affected tomato yield, primarily through Pn with an indirect path coefficient of 0.191, and there was a positive correlation between tomato RWPP and yield. However, this correlation did not reach significance. The RWPP, SWPP and LWPP values of the tomato plants were mainly directly affected by LA, and their direct path coefficients were 0.591, 0.645 and 0.685, respectively. There was also a significant positive correlation among the three, indicating a synergistic relationship between RWPP, SWPP and LWPP.

4. Discussion

4.1. The Compensatory Effects of Biochar on the Adverse Effects of Tomato Source and Sink Characteristics under Deficit-Irrigation Conditions

The source organs of crops are those which produce photosynthates, mainly through the net assimilation of CO2, and the sink organs are the tissues used to store the photosynthates [52]. In this study, the addition of 30–60 t ha−1 and 45–60 t ha−1 biochar under W2 and W1 levels, respectively, improved the source characteristics of LA, Pn and LWPP, and the sink characteristics of SWPP, RWPP, WPF, FWPP and yield, compared with full irrigation without biochar (CK). This indicates that the addition of an appropriate amount of biochar can compensate for the adverse effects of deficit-irrigation on a crop’s source and sink characteristics; these results are consistent with those of Yang et al. [53] and Alfadil et al. [54] concerning maize. The reasons for this may be as follows: Biochar, given its small particle size, can enter the large pores between soil particles, thus increasing the water holding capacity of soil and improving the availability of soil water [55]. Then, the presence of a negative charge carried by the abundant oxygen-containing functional groups on the surface of biochar, along with its complex pore structure, means that biochar has a large cation exchange capacity and a strong adsorption capacity, which together improve the potential of soil to absorb available nitrogen in the form of nitrate nitrogen or ammonia nitrogen. At the same time, the application of biochar can facilitate the slow release of soil nutrients, reduce their leaching loss, and increase the content of available nutrients in the soil under deficit-irrigation conditions [56]. In addition, the organic matter and pH values of biochar in this experiment were both higher than the soil’s background values, meaning the application of biochar to soil improves these values; this further explains how biochar can compensate for the adverse effects of deficit-irrigation on a crop’s source and sink characteristics [53,57].

4.2. Response of Tomato Source–Sink Characteristics to Biochar Addition under Different Irrigation Levels

The results of this study show that under different levels of irrigation, tomato LA and vegetative organ biomass increase as biochar amounts increase. Under the W2 level, the tomato WPF, FWPP and yield values showed a trend of first increasing and then decreasing with the increase in the amount of biochar addition, which differs from the results of Singh et al. [58], who showed that biochar had no significant effects on leaf area index, vegetative organ biomass or the yield of maize under different levels of irrigation, which may be due to the different types of biochar used or the soil texture [59,60]. Under the W2 irrigation level, the WPF, FWPP and yield values of tomato reached their maximum when the amount of biochar added was 45 t ha−1, indicating that under the W2 level, excessive biochar supplementation promotes the vegetative growth of greenhouse tomato, but has a reduced promotional effect on its reproductive growth. This may be due to the fact that excessive biochar addition causes the levels of water and nutrients in the soil to exceed their threshold values beyond which the crop cannot absorb them, resulting in the excess vegetative growth of crops in the early growth stage, and weakening reproductive growth in the later growth stage [61]. In addition, studies have shown that the economic values of tomato first increase and then decrease with an increase in the amount of biochar, and adding too much biochar will reduce net income [62].

4.3. Source–Sink Mechanism of Tomato Yield Formation

Tomato yield depends on the two processes of sink capacity building (FNPP) and filling (WPF), and here, no significant difference was seen in the FNPP values achieved under different treatments, indicating that the tomato yield is mainly affected by sink capacity filling. Previous studies have also shown that crop yield is largely determined by photosynthetic production capacity in the later growth stage, the contribution rate of which is about 80%. Furthermore, the accumulation of assimilation products in the later growth stage is the main factor contributing to yield increase [63], which is consistent with the results of this study. This study has shown that tomato source capacity (LA) reached its maximum value under the W2B4 treatment, while FWPP, WPF–LA and HI did not reach their maximum values under this treatment, indicating that the source–sink relationship achieved when adding 60 t ha−1 biochar under the W1 level was of a “source strong and sink small restriction type”, and that the source–sink ratio is non–coordinated [39,64]. As a result, tomato yield did not reach its maximum value. Although the source capacity achieved under the W2B3 treatment was smaller than that achieved under the W2B4 treatment, its sink capacity, WPF–LA and HI values were larger under this condition, and the source–sink relationship achieved here was coordinated, of the “source strong and sink large coordination type”, thus resulting in the maximum yield. However, the source capacity, sink capacity, and WPF–LA and HI values under the W1B0 treatment were the smallest, belonging to the “source weak and sink small restriction type”, resulting in the lowest yield. In addition, the sink–source ratio index FNPP–LA achieved in this study showed a trend of decreasing with an increase in the levels of irrigation and biochar addition, which further proves that the tomato yield was mainly determined by sink filling.
The source and sink characteristics of crops interact in a contradictory manner, both promoting and opposing each other [65]. The insufficient growth of source leaves results in a reduction in the synthesis of photosynthetic products, while the excessive growth of source leaves results in a reduction in the distribution of photosynthetic products to the carbon pool, which affects the carbon pool’s capacity [64]. In this study, it was found that the W1B0 treatment led to the smallest source capacity and weak photosynthesis, resulting in the lowest level of synthesis of photosynthetic products. While the source capacity achieved under the W2B4 treatment was the greatest, the quantity of photosynthetic products allocated to the leaves here was also the greatest, as a result of which the yield of the W2B4 treatment was not the largest. The sink characteristics also engage in a mode of regularity feedback with the source characteristics, resulting in the accumulation of photosynthates at the source end [66]. This is consistent with the results of this study, and it is thus concluded that RWPP and SWPP are significantly correlated with LWPP.

5. Conclusions

Based on the source–sink theory, this study analyzed for the first time the mechanism of the influence of biochar on the yield of greenhouse tomato under deficit-irrigation conditions. The characteristics of source and sink in the tomato plants decreased with an increase in the degree of deficit, and adding the proper amount of biochar can improve the characteristics of tomato source and sink under deficit-irrigation. Biochar can improve the yield mainly by promoting the filling of sink capacity, rather than the building of sink capacity. The yield of the tomato plants treated under the W2B3 scheme was the highest, and this value was 52% higher than the lowest values achieved in both years, respectively, under the W1B0 treatment. The Pn value was the main factor affecting the yield of the tomato plants; this factor was followed in significance by LA, while SPAD mainly affected the yield indirectly through Pn. The RWPP, SWPP and LWPP biomass values of tomato were mainly directly affected by LA, and a synergistic relationship was identified among them. An irrigation level of 60–80% θf and the addition of biochar at 45 t ha−1 achieved the best water–biochar combination under the experimental conditions. In this study, the effects of the source–sink mechanism on tomato yield formation were analyzed by focusing on a single plant, meaning the effects of the source–sink relationship on tomato yield at the population level require further study.

Author Contributions

Edited the original draft, X.L.; reviewed and edited the draft, J.M. and L.Z.; funding acquisition, J.M., L.Z. and X.L. All authors have read and agreed to the published version of the manuscript.

Funding

This research was financially supported by the National Natural Science Foundation of China (52079085, 52109061), the Key Research and Development Projects of Shanxi Province (201903D211011), and the Scientific and Technological Innovation Programs of Higher Education Institutions in Shanxi Province (2022Y180).

Data Availability Statement

Not applicable.

Acknowledgments

The authors are grateful to Zhao Jinjiang, Chen Ruixia, Xu Quanyue, Deng Qian and Wu Hongxiang for their help in the experiment.

Conflicts of Interest

The authors declare no conflict of interest.

References

  1. Wang, H.; Xiang, Y.; Zhang, F.; Tang, Z.; Guo, J.; Zhang, X.; Hou, X.; Wang, H.; Cheng, M.; Li, Z. Responses of yield, quality and water-nitrogen use efficiency of greenhouse sweet pepper to different drip fertigation regimes in Northwest China. Agric. Water Manag. 2022, 260, 107279. [Google Scholar] [CrossRef]
  2. Zhou, X.; Li, J.; Zeng, Y.; Xin, L. Present condition and change of facility agriculture land in China under the background of rural revitalization. Land Nat. Resour. Res. 2019, 1, 15–20. [Google Scholar]
  3. Gorni, P.H.; Lima, G.R.; Pereira, L.M.O.; Spera, K.D.; Lapazc, A.M.; Pacheco, A.C. Increasing plant performance, fruit production and nutritional value of tomato through foliar applied rutin. Sci. Hortic. 2022, 294, 110755. [Google Scholar] [CrossRef]
  4. FAO. Food and Agriculture Organization of the United Nations Statistical Database; FAO: Rome, Italy, 2023. [Google Scholar]
  5. Li, X.; Ma, J.; Zheng, L.; Chen, J.; Sun, X.; Guo, X. Optimization of the regulated deficit irrigation strategy for greenhouse tomato based on the Fuzzy Borda Model. Agriculture 2022, 12, 324. [Google Scholar] [CrossRef]
  6. Ávalos-Sánchez, E.; López-Martínez, A.; Molina-Aiz, F.D.; Reca, J.; Marín-Membrive, P.; Valera-Martínez, D.L. Effect of different substrates, and irrigation with water with different saline concentrations, on the development of tomato Fungal diseases in an Almería-Type greenhouse. Agronomy 2022, 12, 1050. [Google Scholar] [CrossRef]
  7. Chen, X.; Feng, S.; Qi, Z.; Sima, M.W.; Zeng, F.; Li, L.; Cheng, H.; Wu, H. Optimizing irrigation strategies to improve water use efficiency of cotton in Northwest China using RZWQM2. Agriculture 2022, 12, 383. [Google Scholar] [CrossRef]
  8. Li, X.; Ma, J.; Sun, X.; Zheng, L.; Chen, R.; An, J. Estimating the effects of deficit irrigation on water absorption and utilization of tomatoes grown in greenhouse with Hydrus-1D model. Sustainability 2023, 15, 3216. [Google Scholar] [CrossRef]
  9. Lu, J.; Shao, G.; Cui, J.; Wang, X.; Keabetswe, L. Yield, fruit quality and water use efficiency of tomato for processing under regulated deficit irrigation: A meta-analysis. Agric. Water Manag. 2019, 222, 301–312. [Google Scholar] [CrossRef]
  10. Chand, J.B.; Hewa, G.; Hassanli, A.; Myers, B. Deficit irrigation on tomato production in a greenhouse environment: A review. J. Irrig. Drain. Eng. 2021, 147, 04020041. [Google Scholar] [CrossRef]
  11. Qu, Z.; Chen, Q.; Feng, H.; Hao, M.; Niu, G.; Liu, Y.; Li, C. Interactive effect of irrigation and blend ratio of controlled release potassium chloride and potassium chloride on greenhouse tomato production in the Yellow River Basin of China. Agric. Water Manag. 2022, 261, 107346. [Google Scholar] [CrossRef]
  12. Zou, Y.; Saddique, Q.; Ajaz, A.; Xu, J.; Khan, M.I.; Mu, Q.; Azmat, M.; Cai, H.; Siddiqueg, K.H.M. Deficit irrigation improves maize yield and water use efficiency in a semi-arid environment. Agric. Water Manag. 2021, 243, 106483. [Google Scholar] [CrossRef]
  13. Gamareldawla, H.D.A.; She, D.; Liu, Z.; Nazar, A.E.; Shao, G.; Luis, C.T. Effects of deficit irrigation and biochar addition on the growth, yield, and quality of tomato. Sci. Hortic. 2017, 222, 90–101. [Google Scholar]
  14. Zhou, C.; Yu, S.; Zhang, H.; Li, F. Physiological and biochemical responses of Isatis indigotica to deficit irrigation in a cold and arid environment. Front. Plant Sci. 2023, 13, 1094158. [Google Scholar] [CrossRef] [PubMed]
  15. Dariva, F.D.; Pessoa, H.P.; Copa, M.G.F.; de Almeid, G.Q.; de Castro Filho, M.N.; de Toledo Picoli, E.A.; da Cunha, F.F.; Nick, C. Yield and fruit quality attributes of selected tomato introgression lines subjected to long-term deficit irrigation. Sci. Hortic. 2021, 289, 110426. [Google Scholar] [CrossRef]
  16. Ors, S.; Ekinci, M.; Yildirim, E.; Sahin, U.; Turan, M.; Dursun, A. Interactive effects of salinity and drought stress on photosynthetic characteristics and physiology of tomato (Lycopersicon esculentum L.) seedlings. South Afr. J. Bot. 2021, 137, 335–339. [Google Scholar] [CrossRef]
  17. Akhtar, S.S.; Li, G.; Andersen, M.N.; Liu, F. Biochar enhances yield and quality of tomato under reduced irrigation. Agric. Water Manag. 2014, 138, 37–44. [Google Scholar] [CrossRef]
  18. Fan, M.; Qin, Y.; Jiang, X.; Cui, N.; Wang, Y.; Zhang, Y.; Zhao, L.; Jiang, S. Proper deficit nitrogen application and irrigation of tomato can obtain a higher fruit quality and improve cultivation profit. Agronomy 2022, 12, 2578. [Google Scholar] [CrossRef]
  19. Mahmoud, M.M.A.; Fayad, A.M. The effect of deficit irrigation, partial root drying and mulching on tomato yield, and water and energy saving. Irrig. Drain. 2022, 71, 295–309. [Google Scholar] [CrossRef]
  20. Suo, F.; You, X.; Yin, S.; Wu, H.; Zhang, C.; Yu, X.; Sun, R.; Li, Y. Preparation and characterization of biochar derived from co-pyrolysis of Enteromorpha prolifera and corn straw and its potential as a soil amendment. Sci. Total Environ. 2021, 798, 149167. [Google Scholar] [CrossRef]
  21. Javeed, H.M.R.; Ali, M.; Qamar, R.; Shehzad, M.; Rehman, H.; Nawaz, F.; Jamil, M.; Ahmad, A.; Farooq, A.; Masood, N.; et al. Effect of date biochar pyrolyzed at different temperature on physiochemical properties of sandy soil and wheat crop response. Commun. Soil Sci. Plant Anal. 2021, 52, 2110–2124. [Google Scholar] [CrossRef]
  22. Campos, P.; Knicker, H.; López, R.; Rosa, J.M.D. Application of biochar produced from crop residues on trace elements contaminated soils: Effects on soil properties, enzymatic activities and Brassica rapa growth. Agronomy 2021, 11, 1394. [Google Scholar] [CrossRef]
  23. Yan, S.; Zhang, S.; Yan, P.; Aurangzeib, M. Effect of biochar application method and amount on the soil quality and maize yield in Mollisols of Northeast China. Biochar 2022, 4, 56. [Google Scholar] [CrossRef]
  24. Calcan, S.I.; Pârvulescu, O.C.; Ion, V.A.; Răducanu, C.E.; Bădulescu, L.; Madjar, R.; Dobre, T.; Egri, D.; Mot, A.; Iliescu, L.M.; et al. Effects of biochar on soil properties and tomato growth. Agronomy 2022, 12, 1824. [Google Scholar] [CrossRef]
  25. Simiele, M.; Argentino, O.; Baronti, S.; Scippa, G.S.; Chiatante, D.; Terzaghi, M.; Montagnoli, A. Biochar enhances plant growth, fruit yield, and antioxidant content of cherry tomato (Solanum lycopersicum L.) in a soilless substrate. Agriculture 2022, 12, 1135. [Google Scholar] [CrossRef]
  26. Jiang, W.; Xu, L.; Liu, Y.; Su, W.; Yan, J.; Xu, D. Effect of biochar on the growth, photosynthesis, antioxidant system and cadmium content of Mentha piperita ‘Chocolate’ and Mentha spicata in Cadmium-contaminated soil. Agronomy 2022, 12, 2737. [Google Scholar] [CrossRef]
  27. Bai, S.H.; Omidvar, N.; Gallart, M.; Kämper, W.; Tahmasbian, I.; Farrar, M.B.; Singh, K.; Zhou, G.; Muqadass, B.; Xu, C.; et al. Combined effects of biochar and fertilizer applications on yield: A review and meta-analysis. Sci. Total Environ. 2022, 808, 152073. [Google Scholar] [CrossRef]
  28. Li, B.; Huang, W.; Elsgaard, L.; Yang, B.; Li, Z.; Yang, H.; Lu, Y. Optimal biochar amendment rate reduced the yield-scaled N2O emissions from Ultisols in an intensive vegetable field in South China. Sci. Total Environ. 2020, 723, 138161. [Google Scholar] [CrossRef] [PubMed]
  29. Alfadil, A.A.; Shaghaleh, H.; Hamoud, Y.A.; Xia, J.; Wu, T.; Hamad, A.A.A.; Wang, Y.; Abdoulaye, A.O.; Sheteiwy, M.S. Straw biochar-induced modification of the soil physical properties enhances growth, yield and water productivity of maize under deficit irrigation. Commun. Soil Sci. Plant Anal. 2021, 52, 1954–1970. [Google Scholar] [CrossRef]
  30. Douh, B.; Mguidiche, A.; Zouari, I.; Gargouri, K.; Ayachi, M. Impact of different organic amendments on: Hydrodynamic soil properties and olive tree behavior conducted under deficit irrigation. Commun. Soil Sci. Plant Anal. 2021, 52, 2256–2270. [Google Scholar] [CrossRef]
  31. Ramlow, M.; Fostera, E.J.; Del Grossob, S.J.; Cotrufo, M.F. Broadcast woody biochar provides limited benefits to deficit irrigation maize in Colorado. Agric. Ecosyst. Environ. 2019, 269, 71–81. [Google Scholar] [CrossRef]
  32. Liu, J.; Zhang, J.; Zhu, M.; Wan, H.; Chen, Z.; Yang, N.; Duan, J.; Wei, Z.; Hu, T.; Liu, F. Effects of plant growth promoting rhizobacteria (PGPR) strain bacillus licheniformis with biochar amendment on potato growth and water use efficiency under reduced irrigation regime. Agronomy 2022, 12, 1031. [Google Scholar] [CrossRef]
  33. Singh, M.; Saini, R.K.; Singh, S.; Sharma, S.P. Potential of integrating biochar and deficit irrigation strategies for sustaining vegetable production in water-limited regions: A review. HortScience 2019, 54, 1872–1878. [Google Scholar] [CrossRef]
  34. Peng, S.B.; Khush, G.S.; Virk, P.; Tang, Q.Y.; Zou, Y.B. Progress in ideotype breeding to increase rice yield potential. Field Crops Res. 2008, 108, 32–38. [Google Scholar] [CrossRef]
  35. Mason, T.G.; Maskell, E.J. Studies on the transport of carbohydrates in the cotton plant II. The factors determining the rate and the direction of movement of sugers. Ann. Bot. 1928, 3, 571–636. [Google Scholar] [CrossRef]
  36. Hisse, I.R.; D’Andrea, K.E.; Otegui, M.E. Source-sink relations and kernel weight in maize inbred lines and hybrids: Responses to contrasting nitrogen supply levels. Field Crops Res. 2019, 230, 151–159. [Google Scholar] [CrossRef]
  37. Yan, S.; Wu, Y.; Fan, J.; Zhang, F.; Qiang, S.; Zheng, J.; Xiang, Y.; Guo, J.; Zou, H. Effects of water and fertilizer management on grain filling characteristics, grain weight and productivity of drip-fertigated winter wheat. Agric. Water Manag. 2019, 213, 983–995. [Google Scholar] [CrossRef]
  38. Wei, J.; Yu, Q.; Ding, J.; Li, C.; Zhu, X.; Guo, W.; Zhu, M. Physiological and agronomic mechanisms involved in ‘Source–Sink’ relationship in the high-yield population of Weak-Gluten Wheat. Agronomy 2023, 13, 91. [Google Scholar] [CrossRef]
  39. Yan, S.; Wu, Y.; Fan, J.; Zhang, F.; Zheng, J.; Guo, J.; Lu, J.; Wu, L.; Qiang, S.; Xiang, Y. Source-sink relationship and yield stability of two maize cultivars in response to water and fertilizer inputs in northwest China. Agric. Water Manag. 2022, 262, 107332. [Google Scholar] [CrossRef]
  40. Xu, X.; Zhang, Y.; Li, J.; Zhang, M.; Zhou, X.; Zhou, S.; Wang, Z. Optimizing single irrigation scheme to improve water use efficiency by manipulating winter wheat sink-source relationships in Northern China Plain. PLoS ONE 2018, 13, e0193895. [Google Scholar] [CrossRef]
  41. Bonelli, L.E.; Monzon, J.P.; Cerrudo, A.; Rizzalli, R.H.; Andrade, F.H. Maize grain yield components and source-sink relationship as affected by the delay in sowing date. Field Crops Res. 2016, 198, 215–225. [Google Scholar] [CrossRef]
  42. Wu, X.; Liu, M.; Li, C.; Allen, M.; Li, M.; Xiong, T.; Liu, Y.; Tang, Y. Source–sink relations and responses to sink–source manipulations during grain filling in wheat. J. Integr. Agric. 2022, 21, 1593–1605. [Google Scholar]
  43. Shi, W.; Xiao, G.; Struik, P.C.; Jagadish, K.S.V.; Yin, X. Quantifying source-sink relationships of rice under high night–time temperature combined with two nitrogen levels. Field Crops Res. 2017, 202, 36–46. [Google Scholar] [CrossRef]
  44. Wang, R.; Gui, Y.; Zhao, T.; Ishii, M.; Eguchi, M.; Xu, H.; Li, T.; Iwasaki, Y. Determining the relationship between floral initiation and source–sink dynamics of tomato seedlings affected by changes in shading and nutrients. HortScience 2020, 55, 457–464. [Google Scholar] [CrossRef]
  45. Ma, Z.; Tang, H.; Li, W.; Wang, R. Comparative study on the determination method of soil mechanical composition between pipette method and hydrometer method. Chin. J. Inor. Anal. Chem. 2023, 13, 645–651. [Google Scholar]
  46. Liu, G. Soil Physical and Chemical Analysis Description of Soil Pofiles; Standards Press of China: Beijng, China, 1996. [Google Scholar]
  47. Bao, S. Soil Agricultural Chemical Analysis, 3rd ed.; Agriculture Press: Beijing, China, 2000. [Google Scholar]
  48. Kumar, A.; Vinay, S.; Deepika; Priti, S.L.; Vimlesh, B. Turning Leucaena leucocephala bark to biochar for soil application via statistical modelling and optimization technique. Ecol. Eng. 2015, 82, 26–39. [Google Scholar]
  49. Pan, T.; Wang, Y.; Yang, J.; Xi, L.; Ding, J.; Zhang, J.; Zou, Z. Screening and Optimization of Rapid Measurement Method for Leaf Area of Vegetable Seedlings. Chin. Veg. 2018, 8, 64–69. [Google Scholar]
  50. Uddling, J.; Gelang-Alfredsson, J.; Piikki, K.; Pleijel, H. Evaluating the relationship between leaf chlorophyll concentration and SPAD-502 chlorophyll meter readings. Photosynth. Res. 2007, 91, 37–46. [Google Scholar] [CrossRef]
  51. Xu, J.; Meng, J. Research progress and prospect of remote sensing estimation of crop chlorophyll content. Remote Sens. Technol. Appl. 2016, 31, 74–85. [Google Scholar]
  52. Silva, A.J.; Filho, J.R.M.; Sales, C.R.G.; Pires, R.C.M.; Machado, E.C. Source–sink relationships in two soybean cultivars with indeterminate growth under water deficit. Bragantia 2018, 77, 23–35. [Google Scholar] [CrossRef]
  53. Yang, W.; Feng, G.; Jia, Y.; Yang, Y.; Gao, X.; Gao, L.; Qu, Z. Impact of single biochar application on maize growth and water-fertilizer productivity under different irrigation regimes. Front. Plant Sci. 2022, 13, 1006827. [Google Scholar] [CrossRef]
  54. Alfadil, A.A.; Xia, J.; Shaghaleh, H.; Hamoud, Y.A.; Ibrahim, J.N.; Hamad, A.A.A.; Rahim, S.F.; Sheteiwy, M.S.; Wu, T. Wheat straw biochar application improves the morphological, physiological, and yield attributes of maize and the physicochemical properties of soil under deficit irrigation and salinity stress. J. Plant. Nutr. 2021, 44, 2399–2420. [Google Scholar] [CrossRef]
  55. Yan, Q.; Dong, F.; Li, J.; Duan, Z.; Yang, F.; Li, X.; Lu, J.; Li, F. Effects of maize straw-derived biochar application on soil temperature, water conditions and growth of winter wheat. Eur. J. Soil Sci. 2019, 70, 1280–1289. [Google Scholar] [CrossRef]
  56. Faloye, O.T.; Ajayi, A.E.; Alatise, M.O.; Ewulo, B.S.; Horn, R. Nutrient uptake, maximum yield production, and economic return of maize under deficit irrigation with biochar and inorganic fertiliser amendments. Biochar 2019, 1, 375–388. [Google Scholar] [CrossRef]
  57. Jeffery, S.; Verheijen, F.G.A.; Van Der Velde, M.; Bastos, A.C. A quantitative review of the effects of biochar application to soils on crop productivity using meta-analysis. Agric. Ecosyst. Environ. 2011, 144, 175–187. [Google Scholar] [CrossRef]
  58. Singh, M.; Singh, S.; Parkash, V.; Ritchie, G.; Wallace, R.W.; Deb, S.K. Biochar implications under limited irrigation for sweet corn production in a Semi-Arid environment. Front. Plant Sci. 2022, 13, 853746. [Google Scholar] [CrossRef] [PubMed]
  59. Du, B.; Cao, H.; Pei, S.; Zhang, Z.; Li, M. The effects of deficit irrigation combined with biochar amendment on growth and physiological traits of greenhouse tomato. J. Irrig. Drain. Eng. 2021, 40, 43–51. [Google Scholar]
  60. Gou, M.; Qu, Z.; Wang, F.; Gao, X.; Hu, M. Progress in research on biochar affecting soil-water environment and carbon sequestration-mitigating emissions in agricultural fields. Trans. Chin. Soc. Agric. Mach. 2018, 49, 1–12. [Google Scholar]
  61. Zhang, N.; Li, J.; Liu, X.; Liu, Y.; Wang, Y.; Liang, H.; Liao, Y. Effects of biochar on growth and yield of summer maize. J. Agro. Environ. Sci. 2014, 33, 1569–1574. [Google Scholar]
  62. Guo, L.; Yu, H.; Kharbach, M.; Zhang, W.; Wang, J.; Niu, W. Biochar improves soil-tomato plant, tomato production, and economic benefits under reduced nitrogen application in Northwestern China. Plants 2021, 10, 759. [Google Scholar] [CrossRef]
  63. Ye, Y.; Wang, G.; Huang, Y.; Zhu, Y.; Meng, Q.; Chen, X.; Zhang, F.; Cui, Z. Understanding physiological processes associated with yield–trait relationships in modern wheat varieties. Field Crops Res. 2011, 124, 316–322. [Google Scholar] [CrossRef]
  64. Rodrigues, J.; Inze, D.; Nelissen, H.; Saibo, N.J.M. Source–sink regulation in crops under water deficit. Trends Plant Sci. 2019, 24, 652–663. [Google Scholar] [CrossRef] [PubMed]
  65. Zhang, S.; Wang, H.; Fan, J.; Zhang, F.; Cheng, M.; Yang, L.; Ji, Q.; Li, Z. Quantifying source–sink relationships of drip–fertigated potato under various water and potassium supplies. Field Crops Res. 2022, 285, 108604. [Google Scholar] [CrossRef]
  66. Golovko, T.K.; Tabalenkova, G.N. Source–sink relationships in potato plants. Russ. J. Plant Physiol. 2019, 66, 664–671. [Google Scholar] [CrossRef]
Figure 1. Leaf area (LA) as a function of DAT for the five biochar (B0, B1, B2, B3, and B4) application rates and three irrigation levels (W1, W2 and W3) for 2021 (a,b) and for 2022 (c,d). Note: “*” indicates that p < 0.05 was significant, while “ns” indicates that there was no significant difference.
Agronomy 13 02336 g001
Figure 2. SPAD as a function of DAT for the five biochar (B0, B1, B2, B3, and B4) application rates and three irrigation levels (W1, W2 and W3) for 2021 (a,b) and for 2022 (c,d). Note: “*” indicates that p < 0.05 was significant, while “ns” indicates that there was no significant difference.
Agronomy 13 02336 g002
Figure 3. Net photosynthetic rates of leaves of tomato at fruit expansion stage for the five biochar (B0, B1, B2, B3, and B4) application rates and three irrigation levels (W1, W2 and W3) for 2021 (a) and for 2022 (b). Note: Different letters in the figure indicate that the mean values of each treatment are significantly different (p < 0.05). W, B and W × B represent irrigation level, biochar addition and their interaction on Pn, respectively. “***” indicate that significance was reached at p < 0.001.
Agronomy 13 02336 g003
Figure 4. Leaf biomass of tomato at fruit expansion stage for the five biochar (B0, B1, B2, B3, and B4) application rates and three irrigation levels (W1, W2 and W3) for 2021 (a) and for 2022 (b). Note: Different letters in the figure indicate that the mean values of each treatment are significantly different (p < 0.05). W, B and W × B represent irrigation level, biochar addition and their interaction on LWPP, respectively; “*** “indicate that significance was reached at p < 0.001, “ns” indicates no significant effect.
Agronomy 13 02336 g004
Figure 5. Root and stem biomass of tomato at the fruit expansion stage for the five biochar (B0, B1, B2, B3, and B4) application rates and three irrigation levels (W1, W2 and W3) for 2021 (a) and for 2022 (b). Note: Different letters in the figure indicate that the mean values of each treatment are significantly different (p < 0.05).
Agronomy 13 02336 g005
Figure 6. Sink-source ratio of tomato for the five biochar (B0, B1, B2, B3, and B4) application rates and three irrigation levels (W1, W2 and W3) for 2021 (ac) and for 2022 (df). Note: Different letters in the figure indicate that the mean values of each treatment are significantly different (p < 0.05). W, B and W × B represent irrigation level, biochar addition and their interaction on sink–source ratio, respectively; “*” and “**” indicate that significance was reached at p < 0.05 and p < 0.01, respectively, “ns” indicates no significant effect.
Agronomy 13 02336 g006
Figure 7. Greenhouse tomato yield for the five biochar (B0, B1, B2, B3, and B4) application rates and three irrigation levels (W1, W2 and W3) for 2021 (a) and for 2022 (b). Note: Different letters in the figure indicate that the mean values of each treatment are significantly different (p < 0.05). W, B and W × B represent irrigation level, biochar addition and their interaction on yield, respectively; “*” and “***” indicate that significance was reached at p < 0.05 and p < 0.001, respectively.
Agronomy 13 02336 g007
Figure 8. Comprehensive path analysis of source–sink relationship for tomato yield formation for the five biochar (B0, B1, B2, B3, and B4) application rates and three irrigation levels (W1, W2 and W3) for 2021 and for 2022. Note: The one-way arrow represents the influence relationship, the two-way arrow represents the correlation relationship, and the corresponding number represents the path coefficient or correlation coefficient. “**” indicates that p < 0.05 was significant.
Agronomy 13 02336 g008
Table 1. Measured average physical and chemical properties of the biochar and soil at the experiment site.
PropertiesSoilBiochar
TextureSilty loam
Field capacity (cm3 cm−3)0.38 ± 0.13
Bulk density (g cm−3)1.45 ± 0.01
pH8.39 ± 0.079.00 ± 0.06
Organic matter (g/kg)26.86 ± 5.45925.70 ± 5.03
Total N (g/kg)1.44 ± 0.22
Total P (g/kg)0.67 ± 0.06
Total K (g/kg)42.98 ± 0.41
Mass fraction of carbon (%)47.20 ± 2.49
Mass fraction of nitrogen (%)0.70 ± 0.05
Mass fraction of hydrogen (%)3.80 ± 0.35
C/N67.87 ± 4.89
Table 2. Combination schemes of different irrigation levels and biochar application rates.
Irrigation LevelBiochar Application Rate/t ha−1
W1B050–70% θf0
W1B150–70% θf15
W1B250–70% θf30
W1B350–70% θf45
W1B450–70% θf60
W2B060–80% θf0
W2B160–80% θf15
W2B260–80% θf30
W2B360–80% θf45
W2B460–80% θf60
W3B070–90% θf0
Table 3. Average values ± standard deviation of weight per fruit (WPF), fruit number per plant (FNPP) and fruit weight per plant (FWPP) for 2021 and 2022.
20212022
WPF
(g Fruit−1)
FNPPFWPP
(g Plant−1)
WPF
(g Fruit−1)
FNPPFWPP
(g Plant−1)
W1B00.4 ± 0.02 b20.9 ± 0.97 a8.6 ± 0.12 e0.4 ± 0.02 e23.9 ± 0.64 a9.3 ± 0.76 d
W1B10.4 ± 0.03 b20.6 ± 1.02 a8.8 ± 0.16 e0.5 ± 0.03 de24.4 ± 0.23 a10.9 ± 0.71 cd
W1B20.5 ± 0.01 ab20.5 ± 1.07 a10.7 ± 0.74 d0.5 ± 0.02 cd25.0 ± 1.26 a12.3 ± 0.40 c
W1B30.6 ± 0.03 ab20.4 ± 1.41 a11.7 ± 0.49 bcd0.6 ± 0.03 ab24.2 ± 0.64 a15.1 ± 0.37 b
W1B40.6 ± 0.02 a20.5 ± 1.55 a12.9 ± 0.63 abc0.7 ± 0.02 a23.1 ± 0.67 a16.5 ± 0.57 ab
W2B00.6 ± 0.02 ab20.4 ± 0.59 a11.2 ± 0.17 cd0.5 ± 0.01 cd23.1 ± 0.54 a11.6 ± 0.40 c
W2B10.5 ± 0.06 ab21.0 ± 1.04 a11.2 ± 0.83 cd0.6 ± 0.02 bc23.4 ± 0.99 a13.0 ± 0.51 c
W2B20.7 ± 0.12 a20.9 ± 2.63 a13.0 ± 0.58 ab0.7 ± 0.04 a24.2 ± 0.60 a16.6 ± 1.31 ab
W2B30.7 ± 0.08 a20.3 ± 1.38 a14.2 ± 0.72 a0.7 ± 0.03 a25.3 ± 0.54 a17.6 ± 0.84 a
W2B40.7 ± 0.05 a21.53 ± 0.68 a13.8 ± 0.62 a0.7 ± 0.03 a24.5 ± 1.52 a16.8 ± 0.46 ab
W3B00.5 ± 0.03 ab21.5 ± 0.64 a11.6 ± 0.52 bcd0.5 ± 0.05 cd24.6 ± 0.90 a12.9 ± 0.66 c
W*ns******ns***
B**ns******ns***
W × Bnsnsns*nsns
Note: Values are given as the means ± standard error of the mean. The same letters following the values within the same column indicate nonsignificant differences between treatments, whereas different letters indicate a significant difference (p ≤ 0.05). “*”, “**” and “*** “indicate that significance was reached at p < 0.05, p < 0.01 and p < 0.001, respectively, “ns” indicates no significant effect.
Disclaimer/Publisher’s Note: The statements, opinions and data contained in all publications are solely those of the individual author(s) and contributor(s) and not of MDPI and/or the editor(s). MDPI and/or the editor(s) disclaim responsibility for any injury to people or property resulting from any ideas, methods, instructions or products referred to in the content.

