Abstract
The use of living mulch (LM) in corn (Zea mays L.) production must be evaluated under different N fertilization levels. The objective of this study was to determine the optimum amount of N fertilization in white clover (Trifolium repens L. (WC)) LM in corn. The study was conducted in Spring Hill, TN, from 2020 to 2021. The treatments were [C-0] no LM + no N, [C-135] no LM + 135 kg/ha N, [CLM-0] LM + no N, [CLM-45] LM + 45 kg/ha N, [CLM-90] LM + 90 kg/ha N, and [CLM-135] LM + 135 kg/ha N. We evaluated the LM mass and corn production (silage and grain). In general, the LM mass was higher with CLM-45, CLM-90, and CLM-135 during both years. Corn silage production was higher in 2020 compared with 2021 (6.8 and 2.8 Ton/ha, respectively), and showed differences among treatments. The production of corn grain showed the same response pattern with a higher value in 2020 than in 2021 (1.8 and 0.1 Ton/ha, respectively). Thus, the use of LM did not increase corn silage or grain production, even receiving a high N rate as in conventional systems.
1. Introduction
Nitrogen (N) is an important nutrient for plant growth [1,2,3,4], and the suggested N requirement for corn (Zea mays L.) can be as high as 280 kg/ha, depending on the yield goal [5]. The use of legumes intercropped with corn can reduce the reliance on synthetic N fertilization [6] due to the N release from these legumes, such as white clover (WC) (Trifolium repens L.) [7]. The living mulch (LM) system is a strategy in which forages are grown simultaneously with the main crop, serving as a living cover throughout the growing season [8], and generally the use of legumes in this system increases its benefits. The adoption of LM systems has shown a significant reduction in water runoff [9], which can decrease NO3 leaching and overall N losses compared with conventional systems. In addition, another advantage of LM systems is increased weed suppression, which may favor the crop of interest in the field [10]. The most common mechanisms to increase suppression are competition for water, available nutrients in the soil (especially N), and light [11]. Therefore, hindering weed germination throughout the season without limiting growth resources for the crop is highly beneficial [11].
The use of WC as a legume LM species can not only confer good soil coverage due to its stolon and rhizomes [12], but also provide N source by biological N fixation (BNF) [13]. Biological N fixation is a natural process performed by legumes with the function of fixing atmospheric N into available N, occurring in the roots by N-fixing bacteria such as rhizobia [14]. White clover also has the potential to increase the total soil N availability [15] through BNF. A study conducted with WC mixed with perennial ryegrass (Lolium perenne L.) showed a contribution of 151 kg N/ha [16]; thus, this can result in increased grain and whole plant corn yield [17]. Corn is commonly fertilized during its establishment phase and at the V6 and V7 stages of growth [18], when it is growing rapidly. Legume LM systems can provide additional N, but the timing of N availability is unknown. In addition, it is likely that legume LM alone will not provide sufficient N necessary for optimum productivity in corn [19]. The authors of [20] applied N at 45 kg/ha between the V3 and V5 stages to avoid resource limitation for corn growth, and the authors of [21] observed that side dressing N to LM grown with corn increased the whole-plant corn yield.
Although legumes can provide up to 10% of their symbiotically fixed N to the root zone [22], the addition of synthetic N can suppress the persistence of WC in the field [3]; thus, no more than 120 kg/ha of N should be applied to fields containing WC [23]. Therefore, the level of N fertilization in systems containing WC must be assessed to avoid competition between species. The objectives of this study were to determine the amount of synthetic N fertilization in WC LM to sustain silage or grain production compared with conventional systems. The hypothesis is that adding 90 kg/ha of N to WC LM can be as productive as conventional corn with 135 kg/ha of N.
2. Materials and Methods
2.1. Study Site
The research was conducted at the Middle Tennessee AgResearch and Education Center (MTREC) in Spring Hill, TN (35°71′ N, 86°94′ W) from March 2020 to April 2021; the two experimental years were carried out in the same location. Initial soil levels on the experiment site were pH = 6.5, P = 30 kg P/ha, K = 78 kg K/ha, Ca = 2564 kg Ca/ha, and Mg = 216 kg Mg/ha (the mineral nutrients are shown in total content). The area consisted of two well drained soil types with elevation ranging from 152 to 366 m. The soil types were Braxton series (fine, mixed, active, thermic Typic Paleudalfs) silt loam soil complex with 0 to 5% slopes, and Maury series (fine, mixed, active, mesic Typic Paleudalfs) silt loam with 2 to 5% slopes (NRCS, 2022). Following the soil test recommendations, on 22 April 2020 and 25 May 2021, K was applied at 157 kg/ha, and P was applied on 27 April 2020 at 82 kg/ha, and on 28 May 2021 at 76 kg/ha.
Two experiments were performed—experiment one with corn silage and experiment two with corn grain. The LM system used in both experiments used WC legume as a cover crop between the corn lanes. In both experiments, the treatments were as follows: (1) corn only + 0 N (C-0), (2) corn only + 135 kg/ha N (C-135), (3) corn and LM + 0 N (CLM-0), (4) corn and LM + 45 kg/ha N (CLM-45), (5) corn and LM + 90 kg/ha N (CLM-90), and (6) corn and LM + 135 kg/ha N (CLM-135). Both C-0 and C-135 were considered as the control plots. In both experiments, all of the treatments were replicated three times in a randomized complete block design, totaling 18 experimental units per experiment. Each experimental unit measured 25 by 32 m.
2.2. Measurements and Management
On 7 March 2020, the field (previously growing crabgrass (Digitaria sanguinalis) cv. Red River) was sprayed with 0.84 kg/ha a.i. of paraquat (Gramoxone SL 2.0, Syngenta, UK) and 35 mL/ha of surfactant (Surf 80, Cannon packaging Co., Inc., Humboldt, TN, USA) using a 210 Redball 8-row hooded sprayer (Wilmar, Benson, MN, USA). On 9 March 2020, “Durana” WC pre-inoculated with Rhizobia strains was planted at 2.2 kg/ha with a Great Plains 38 cm drill (Manufacturing Inc., Salina, KS, USA).
On 15 May 2020 and 18 May 2021, 90 cm lanes were created for corn seeding by spraying 0.5 kg/ha a.i. of glyphosate (N-(phosphonomethyl) glycine; Cornerstone Plus, Agrisolutions, St. Paul, MN) and 0.16 kg/ha a.i. of 2,4-D ammine 4 (Loveland, Greeley, CO, USA) using a 210 Redball 4-row and 8-row hooded sprayer (Wilmar, Benson, MN, USA). The second spraying was conducted on 29 May 2020 and 31 May 2021, with 0.5 kg/ha a.i. of paraquat (Paraquat concentrate, Solera, Yuma, AZ, USA), 0.62 kg/ha a.i. of atrazine (Atrazine 4L, Drexel, Memphis, TN, USA), 0.3 kg/ha a.i. of s-metolachlor (Charger Max, Agrisolutions, St. Paul, MN, USA), and 35 mL/ha of surfactant (Surf 80, Cannon packaging Co., Inc.) using a 210 Redball 4-row and 8-row hooded sprayer (Wilmar, Benson, MN, USA). Meanwhile, the control plots were sprayed on 28 May 2020, with 1.3 kg/ha a.i. of paraquat (Paraquat concentrate, Solera, Yuma, AZ, USA) and 35 mL/ha surfactant (Surf 80, Cannon packaging Co., Inc.), and on 20 May 2021, 0.5 kg/ha of paraquat (Paraquat concentrate, Solera, Yuma, AZ, USA) and 35 mL/ha surfactant (Surf 80, Cannon packaging Co., Inc.) using a RM 200 plot sprayer (AgSpray, Hopkinsville, KY, USA).
On 1 June of both years (2020 and 2021), corn silage (Dekalb DKC67-44) and corn grain (Croplan 5887VT2P/RIB) were planted at 77,000 seeds per ha with 90 cm spacing using a 4-row planter (John Deere, Lewisburg, TN, USA). Because of wildlife animal damage, grain and silage hybrids were replanted in the affected areas on 10 June 2020. Split applications of urea (46-0-0) were applied by hand on 9 June and 10 July 2020; on 3 June and 1 July 2021, half of each treatment rate (45, 90, and 135 kg/ha) was applied each day.
The corn silage was harvested on 19 August 2020 and 25 August 2021 using a T100 chopper (New Holland, Racine, WI, USA) and a feeder mixer (Helm Welding, Lucknow, ON, Canada). The corn grain was harvested on 14 October 2020 and 2021 using a plot combine (Almaco and Allis-chalmers Gleaner K2), and a Ford F600 grain truck.
In both years, LM samples were collected monthly from May to September. The samples were collected by clipping the forage using two randomly placed 0.1 m2 quadrats within each experiment unit within random corn lanes (above ground). These samples were then separated into botanical components (LM and weeds) and placed in a drier until reaching a constant weight at 60 °C (~72 hr). After drying, the samples were weighed to determine the total dry matter (DM) LM mass and the botanical composition.
The corn yield of the silage and grain was determined by harvesting the two middle rows of each plot. The length of the plot and the number of plants per harvested row were measured before harvesting, dried in the oven until constant weight (60 °C by ~72 h), and the weight was recorded for the determination of the yield per kg/ha.
2.3. Statistical Analysis
Mixed model analyses of variance were performed using the PROC GLIMMIX procedure in SAS 9.4 (Cary, NC, USA). The fixed effects were considered N rates and year, with replication as the random effects. Given the differences in years (2020 and 2021), the analyses were performed separately for LM mass, botanical composition, and corn production (silage and grain). The fixed effects were N rates, sampling month, and their two-way interactions with sampling month as the repeated measures, and with random effects as the replications.
3. Results
3.1. Weather
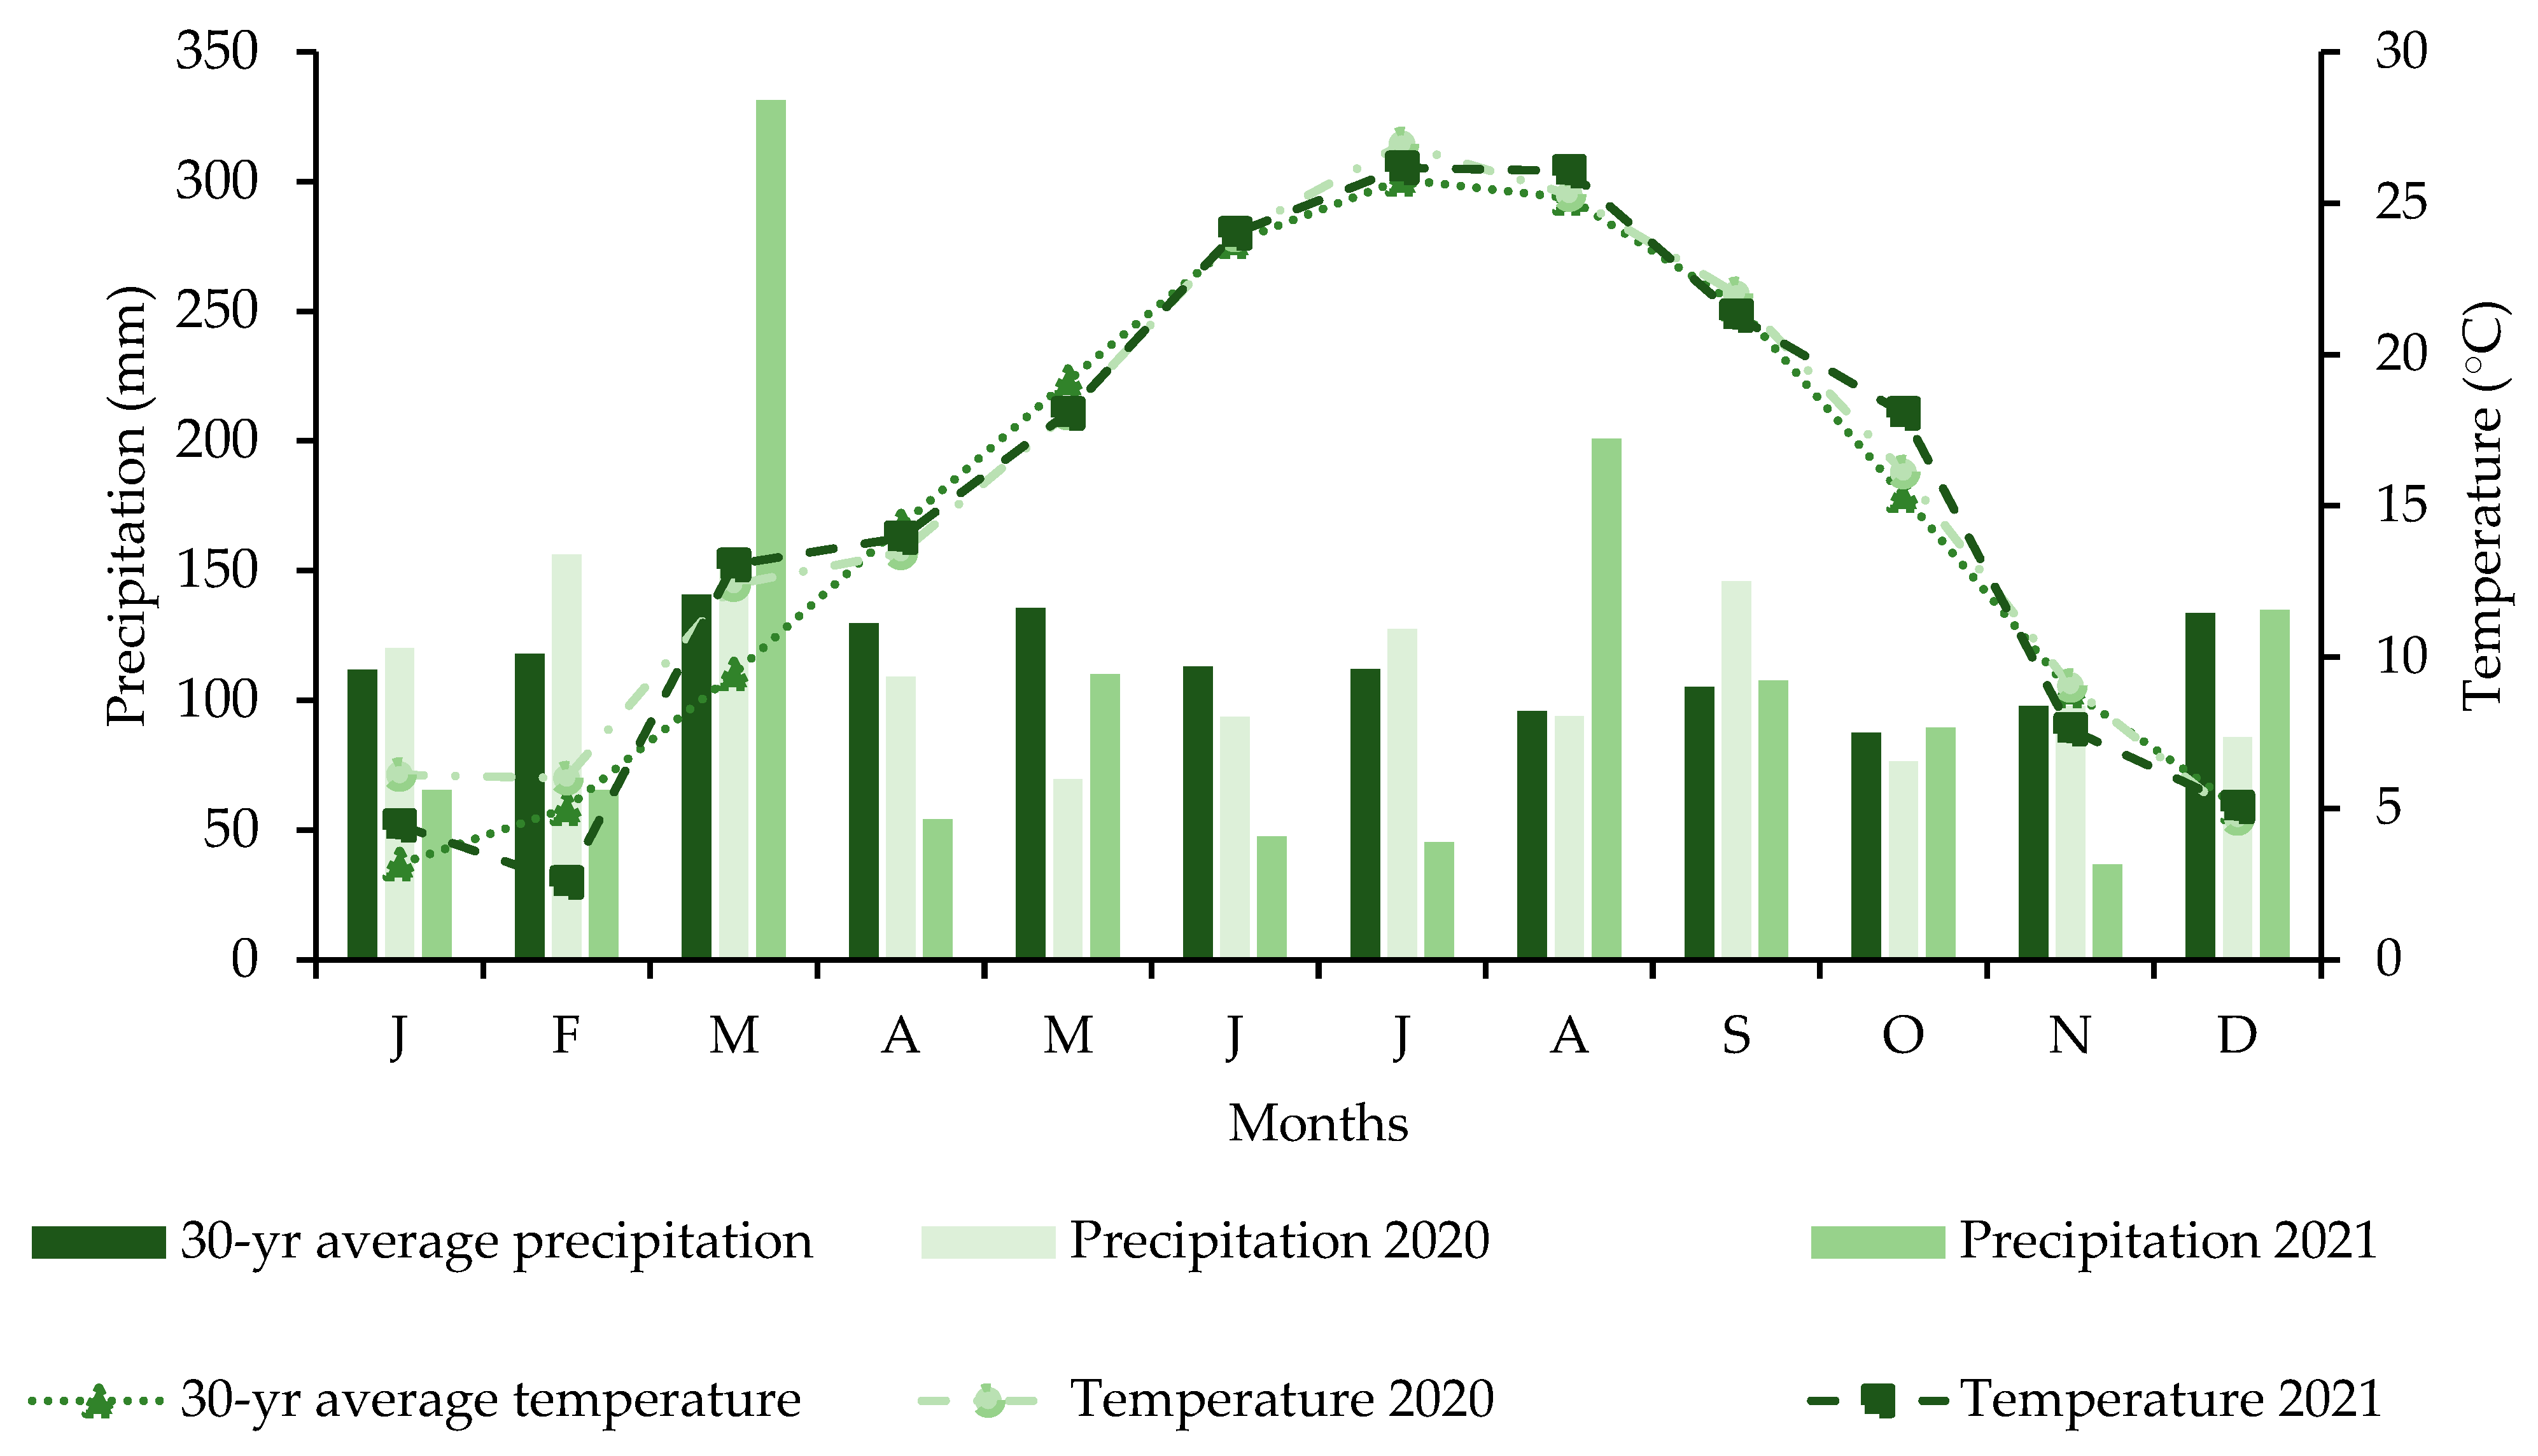
The data of weather conditions were obtained from the National Weather Service (National Oceanic and Atmospheric Administration). The temperature followed the same pattern as the 30-year average, with the highest temperature recorded in July (26 °C). The mean temperature during the 2020 growing season was 2% lower than the 30-year average, and 3% lower in 2021. Monthly precipitation from May to September was slightly different from the 30-year average. In July and August 2020, precipitation was higher than the 30-year average and 2021. In March, precipitation was higher in 2021 compared to the 30-year average and for 2020. In 2020, precipitation was lower in March, while other months were similar to the 30-year average. In 2021, precipitation was lower than the 30-year average and for 2020, especially in June and July, this directly affected corn germination, establishment, and further development. The total precipitation during the experimental period in 2020 was 607 mm and 2021 was 601 mm, while the 30-year average for the same period was 649 mm (Figure 1).
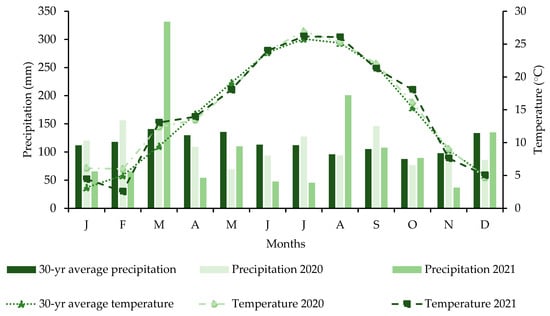
Figure 1.
Precipitation (mm) and temperature (°C) from 2020 to 2021 for the field preparation and growing season, and 30-year average in Spring Hill, TN, USA.
3.2. Experiment I—Corn Silage
3.2.1. Living Mulch Botanical Composition
There was a month × treatment interaction between botanical composition (LM and weed) in 2020 (p < 0.0001 for both variables; Table 1). Among the plots containing LM, only in May the presence of LM did not differ among the treatments; however, this pattern shifted as the growing season progressed, reducing the amount of LM across treatments. For weed proportion, treatments C-0 and C-135 had the highest values in July, August, and September, increasing as the season progressed (Table 1).

Table 1.
Living mulch (LM) botanical composition (%) grown with silage corn during two consecutive growing seasons (2020 and 2021) in Spring Hill, TN.
In 2021, the main effect of month and treatment (p < 0.0001; Table 1) was found for the LM. The LM proportion remained constant until August, decreasing in September. There were no differences among LM treatments, with an average of 85.8% (Table 1). Meanwhile, there was a month × treatment interaction (Table 1) in the weed proportion. In May and June, there were no differences among treatments. The weed proportion did not differ among LM treatments, and a greater weed proportion was observed in September. Overall, a lower proportion of weeds was observed in 2021 than in 2020.
3.2.2. Living Mulch Total Mass
In 2020, there was a month × treatment interaction (p = 0.0430; Table 2). The LM mass did not differ, except in May; however, there was an increase in LM mass as the season progressed, until August. In 2021, there was a month × treatment interaction (p < 0.0001; Table 2). All of the treatments had a higher LM mass in May, decreasing with time. Treatments C-0 and C-135 had a greater LM mass in August and September, while treatments with LM had higher values in May (Table 2).
Table 2.
Total living mulch (LM) mass (DM kg/ha) grown with silage corn during two consecutive growing seasons (2020 and 2021) in Spring Hill, TN.
3.2.3. Corn Silage Production
The corn silage production differed between years (p < 0.0001) and treatments (P = 0.0025). Greater silage production was observed in 2020 than in 2021—about 143% higher. Among the LM treatments, C-135 had a higher corn silage production while CLM-0 had a lower value; however, the control treatment that received 135 kg N/ha had the highest corn silage production (Table 3).
Table 3.
Corn silage production (DM Ton/ha) during two consecutive growing seasons (2020 and 2021) in Spring Hill, TN.
3.3. Experiment II—Corn Grain
3.3.1. Living Mulch Botanical Composition
There was a month × treatment interaction in both years for the LM and weed proportions (p <0.0001; both variables) (Table 4). In 2020, the LM proportion for the LM treatments differed in July and August; however, the LM proportion was high in May, June, and July, and decreased in August and September. The weed proportion increased throughout the season, from May to September (Table 4).
Table 4.
Living mulch (LM) botanical composition (%) grown with grain corn during two consecutive growing seasons (2020 and 2021) in Spring Hill, TN.
In 2021, the LM proportion was similar among all LM treatments from May to August, and decreased in September. In September, C-0 had the highest LM proportion and CLM-45 the lowest (Table 4). As for weed proportion, the LM proportion increased in July, with a slight decrease in August, increasing again by September for all LM treatments (Table 4). There were no plants growing in the control plots in May in June, as the herbicide was applied before corn planting.
3.3.2. Living Mulch Total Mass
An interaction between month × treatment was observed in both years (P = 0.0381 and p = 0.0337, respectively; Table 5). In 2020, the LM mass did not differ among LM treatments in May, June, and July; and the month that had a high LM production was August for all treatments, followed for a drop in September. In 2021, CLM-135 was the one that had the highest value in May; however, for the other months, there were no differences among all of the treatments (Table 5).
Table 5.
Total living mulch (LM) mass (DM kg/ha) grown with grain corn during two consecutive growing seasons (2020 and 2021) in Spring Hill, TN.
3.3.3. Corn Grain Production
There was a treatment × year interaction (p < 0.0001) found for corn production, and greater production was observed in the no LM treatments in 2020, while in 2021, no differences among treatments were observed. In 2020, the corn production was high than 2021 for all of the treatments (Table 6).
Table 6.
Corn grain production (DM Ton/ha) during two consecutive growing seasons (2020 and 2021) in Spring Hill, TN.
4. Discussion
4.1. Experiment I—Corn Silage
4.1.1. Botanical Composition
The botanical composition of forage and cropping systems is essential to increase plant diversity, which is beneficial for intercropping systems [24]. When intercropping forages with different seasonal growth patterns, the botanical composition changes throughout the year. White clover is a cool-season perennial legume that has a high growing rate during spring and fall, and is thus ideal to use as LM [25]. As observed, in 2020, there was a high LM proportion in May and June, with a sharp decline thereafter, while the weed proportion increased from July to September (Table 1). Therefore, the weed proportion in the plots tended to increase with the growing season, as also observed by [25]. This is a result of corn shading the LM as it grew in the field [21], likely decreasing the competitive ability of LM and allowing the weed species to grow. Meanwhile, the weed proportion in the control plots (C-0 and C-135) was greater than in all of the remaining treatments in early July, but in August and September, all of the treatments had a high proportion of weeds (Table 1). In the plots without N application (CLM-0), LM had to rely solely on its N fixing ability, which provided a competitive advantage against other species. On the other hand, it was observed that for plots with N application, in addition to the warm season favoring the growth of the weeds, N application contributed to this increase. N and other nutrients could be responsible for the risk of increased competition with weeds [26], which might increase their proportion in forage mass.
The process from the implementation to the establishment of a pasture takes time. In 2021, although there was a decrease in LM proportion during late spring and early summer, this decrease was less pronounced than in 2020, which was the establishment year. Research found that in the second year, the WC LM suppressed weeds more effectively, likely due the fact that they were previously established in the field [27]. In addition, the authors of [28] observed that in cover crops, weed control was greater when more plant residue was present, confirming the fact that during the second year after LM establishment, the greater LM accumulation could reduce the weed biomass.
4.1.2. Total LM Mass
In intercropping systems, the LM mass will change as the season progresses. In this study, in 2020, the LM mass varied among treatments in each month; however, overall, the LM mass increased in August for all treatments. For non-LM, this biomass increase occurred after corn planting (July); therefore, the high LM mass for all treatments was documented by increased weed competition. This increase is associated with the greater weed proportion during this period (Table 1), mainly the warm season species pigweed (Amaranthus spp.), which is considered a very invasive weed [29]; therefore, an effect on the overall LM mass was observed.
Studies have shown pigweed to be a large weed that needs control, especially in the summer, when the best conditions for its growth occur [25,26]. The highest LM mass along with the highest weed proportion was likely due the N fertilization, which might have stimulated the germination and emergence of weeds in the soil bank [26]. Meanwhile, the lowest LM mass was observed in May and June, likely because 2020 was the WC establishment year, and in many instances, it could take up to a year for its complete establishment in the field [30].
The year 2021 was the second year after establishment, and this made the plants more stable in the field. A cool-season perennial legume such as WC has a high growth in late winter, but it also has considerable growth in spring, which was demonstrated in this study (Table 2). The WC in the LM systems had a forage mass of 1600 kg DM/ha, similar to the present study at the same time [25]. The LM mass (Table 2) decreased throughout the months due to the decrease in the proportion of LM proportion (Table 1); on the other hand, the weed proportion in the LM mass remained unchanged. The N fertilization in the LM treatments did not affect the overall productivity; showing that N biologically fixed by the legume favored an increase in mass [31]. The LM mass was similar among the different rates of synthetic N fertilizer, meaning that its application was not essential. Therefore, the diversification of farm activities could reduce the business risk of agricultural production [32], especially regarding synthetic N fertilizer.
4.1.3. Corn Silage Production
Corn silage is an important food source for cattle production [33] and is becoming increasingly popular among cattle producers [34]. To ensure successful corn silage production, weather conditions are very important, especially during the establishment and germination phases. In this study, corn was planted in the first week of June in both years; however, in 2021, there was lower precipitation in June (Figure 1). This lack of precipitation in early June directly affected corn germination and further development, resulting in a lower than expected corn silage production. In addition, the study corn was planted in early June. In the Southeast U.S., the best time for planting corn is between April and May [33].
Corn silage production usually requires high N fertilizer rates [35], due to N fertilizer being a very important input necessary to increase corn production [25]. C-135 had the highest corn silage production, because, in addition to a high amount of N fertilizer, the control treatment did not have to compete for resources with LM. Comparing the conventional control plot with the LM plot, both with 135 kg N/ha, the corn silage production in C-135 was 47% higher compared with CLM-135 (Table 3). However, among the LM treatments, there was greater corn silage production in the CLM-135 than CLM-0, and both were not different from CLM-45, CLM-90, and C-0 (Table 3). This occurred because the presence of WC LM likely led to increased competition for soil resources that could affect the emergence and development of corn [6], and interspecies competition can be as detrimental as a lack of synthetic N fertilizer.
The choice of forage grown in intercropping systems is important in order to avoid this reduction in corn production [36]. According to [37], studying the intercropping of alfalfa with corn, showed that alfalfa is more competitive than corn; therefore, they recommended two lanes of corn and five lanes of alfalfa for a more consistent yield. The use of WC as a LM between the corn lanes could have impacted corn silage production; however, LM can significantly reduce weed competition, decreasing the reliance on herbicides and increasing the overall sustainability of the system. The use of LM can be considered a more sustainable production practice, with greater water use efficiency, decreased use of synthetic fertilizer, and increased biodiversity being documented [38,39]. Thus, the use of LM in the systems should be evaluated in its entirety, not only as a way to increase crop production.
4.2. Experiment II—Corn Grain
4.2.1. Botanical Composition
In 2020, the LM proportions were similar from May to July, followed by a drop in August; this reduction in WC was expected by the end of the season. This was attributed to the increased shading originated from corn [24], thus reducing the proportion of WC in the plots. However, in addition to shading [40], temperature increase could be another contributing factor to the decrease in the proportion of LM and the increase in the proportion of weeds. Other studies have shown a decrease in LM composition throughout of season [25] and over the years [3]. Thus, not only LM management between corn lanes need attention, but soil preparation and field history are also important for the success of this sustainable practice.
For the LM to remain in the system, it is necessary to control the proportion of weeds [41], which are often opportunistic plants; however, controlling these plants can be very complicated and challenging. In 2021, the proportion of LM was similar among all of the LM treatments from May to August, and there was an increase in weed proportion, but it was not as evident as the previous year (Table 4). An alternative to suppressing weeds in the systems is to use more cover crops as LM plants [41]. According to the same authors, the use of diverse cover crops offers advantages, such as the ability to compete with weeds, resulting in a reduction in weeds and increase in cover crop production. Thus, the LM between corn lanes provides cover for the soil, as well as environmental benefits [42].
4.2.2. Total LM Mass
Cool-season legumes, e.g., WC, slow down productivity in summer, which coincided with the appearance of summer weeds in the LM treatments (Table 4). In 2020, May and June had less LM mass compared with August. Despite the high LM mass in August, it was composed mostly of weeds (Table 4). This response pattern was registered by [25], who studied crimson clover-cereal rye and WC as LM, where the LM mass increased simultaneously with the increase in the proportion of weed. According to the same authors, the most common summer weeds were crabgrass and pigweed (Amaranthus spp.), and they were favored due the summer conditions (high temperature and precipitation). Another factor that favored the increase in weeds was the N rate, mainly CLM-90 and CLM-135 in August and September (Table 5).
According to the 2021 results, although the addition of synthetic N did not affect the presence of the LM as much as expected, LM appeared to be more uniform. Although there were no differences in LM mass among LM treatments, CLM-135 and CLM-0 had similar results in August (Table 5). Nitrogen is essential for plant growth; however, for legume species, excessive amounts of N can decrease the potential for biological nitrogen fixation (BNF) [43,44]. A study evaluated white clover mixed with perennial ryegrass and an additional 250 kg synthetic N/ha for three consecutive years, and concluded that forage mass decreased throughout the years [3]. Thus, it is likely that the added synthetic N fertilizer did not contribute to the WC BNF, resulting in a lower forage production over time.
4.2.3. Corn Grain Production
Corn grain is the most popular cereal in the world [45] and it is widely used as feed for both human and animal consumption [46], contributing to the overall system’s economic balance; however, if production and use are not well planned, it can be costly for farmers [25]. In addition to soil preparation, fertilization, and seed cost, weather conditions can greatly affect production and profitability, and it is a factor that cannot be controlled. In 2020, the precipitation in early June (Figure 1) was adequate for seed germination. However, in 2021, there was much lower precipitation in early June 2021 (Figure 1), which negatively impacted seed germination and consequently corn grain production, with an average of 0.1 DM Ton/ha in all treatments. The corn grain was an early maturity hybrid, and the authors of [47] found that when using early maturing hybrids, it was important to increase the plant population in order to have equivalent yields as the late-maturing hybrids.
Corn grain growth can be affected by competition with LM, which contributes to lesser production; however, in some situations, the suppression of LM is necessary, as demonstrated by [15]. This was observed in the present study, where the LM treatments even with a low and high N rate had the same corn grain production (Table 6). On the other hand, when corn was grown without LM and with a high N rate, the overall production was greater (e.g., C-135 in 2020; Table 6). Therefore, corn grain production using LM resulted in lower productivity than conventional systems, but this system brought benefits such as increased sustainability, increased soil coverage, and improved plant diversity.
5. Conclusions
White clover LM did not increase corn silage or corn grain production when compared with conventional systems, even when receiving a high N fertilization rate (90 and 135 kg/ha N). Due to the extreme weather conditions during the experimental period, which resulted in a very low yield during the second year, we could not accurately test the study hypothesis. In order to avoid the detrimental effects caused by environmental factors such as drought, irrigation may be necessary, especially during germination. Weed pressure increased as the growing season progressed, but it was higher during the establishment year. Therefore, the use of WC as LM reduced weed competition, which is considered a good strategy against noxious weeds that negatively impact corn growth and development.
Author Contributions
M.P.Q.—conceptualization, data curation, formal analysis, methodology, project administration, validation, visualization, writing—original draft, writing—review and editing. R.L.G.N.—conceptualization, funding acquisition, investigation, methodology, project administration, resources, supervision, validation, visualization, writing—original draft, writing—review and editing. V.S.—conceptualization, methodology, writing—review and editing. G.B.—conceptualization, methodology, visualization. C.S.—conceptualization, visualization, writing—review and editing. O.G.d.A.—data curation, writing—review and editing. All authors have read and agreed to the published version of the manuscript.
Funding
This research received no external funding.
Data Availability Statement
The data that support this research are available from the corresponding author upon reasonable request.
Acknowledgments
We thank the staff at the Middle Tennessee AgResearch and Education Center for their help during the conduction of the experiment.
Conflicts of Interest
The authors declare that there is no conflict of interest.
References
- Nave, R.L.G.; Barbero, R.P.; Boyer, C.N.; Corbin, M.D.; Bates, G.E. Nitrogen rate and initiation date effects on stockpiled tall fescue during fall grazing in Tennessee. Crop. Forage Turf. Manag. 2016, 2, 1–8. [Google Scholar] [CrossRef]
- Corbin, M.D.; Nave, R.L.G.; Bates, G.E.; Butler, D.M.; Hawkins, S.A. Alternatives to conventional nitrogen fertilization on tall fescue and bermudagrass. Agron. J. 2019, 111, 275–286. [Google Scholar] [CrossRef]
- Guy, C.; Hennessy, D.; Gilliland, T.J.; Coughlan, F.; McClearn, B.; Dineen, M.; McCarthy, B. White clover incorporation at high nitrogen application levels: Results from a 3-year study. Anim. Prod. Sci. 2020, 60, 187–191. [Google Scholar] [CrossRef]
- Almeida, O.G.; Pedreira, C.G.S.; Assis, J.A.; Pedreira, B.C.; Gomes, F.J.; Nave, R.L.G. Defoliation management and nitrogen fertiliser rate affect canopy structure traits of grazed guineagrass (Megathyrsus maximus) cv. Zuri under rotational stocking. Crop. Pasture Sci. 2023. [Google Scholar] [CrossRef]
- Vanotti, M.B.; Bundy, L.G. Corn nitrogen recommendations based on yield response data. J. Prod. Agric. 1994, 7, 249–256. [Google Scholar] [CrossRef]
- Martin, R.C.; Greyson, P.R.; Gordon, R. Competition between corn and a living mulch. Can. J. Plant Sci. 1999, 79, 579–586. [Google Scholar] [CrossRef]
- Peters, S.J.; Saikawa, E.; Markewitz, D.; Sutter, L.; Avramov, A.; Sanders, Z.P.; Yosen, B.; Wakabayashi, K.; Martin, G.; Andrews, J.A.; et al. Soil trace gas fluxes in living mulch and conventional agricultural systems. J. Environ. Qual. 2020, 49, 268–280. [Google Scholar] [CrossRef]
- Hartwig, N.L.; Ammon, H.U. Cover crops and living mulches. Weed Sci. 2002, 50, 688–699. [Google Scholar] [CrossRef]
- Siller, A.R.; Albrecht, K.A.; Jokela, W.E. Soil erosion and nutrient runoff in corn silage production with kura clover living mulch and winter rye. Agron. J. 2016, 108, 989–999. [Google Scholar] [CrossRef]
- Bhaskar, V.; Westbrook, A.S.; Bellinder, R.R.; DiTommaso, A. Integrated management of living mulches for weed control: A review. Weed Technol. 2021, 35, 856–868. [Google Scholar] [CrossRef]
- Westbrook, A.S.; Bhaskar, V.; DiTommaso, A. Weed control and community composition in living mulch systems. Weed Res. 2021, 62, 12–23. [Google Scholar] [CrossRef]
- Hayes, R.C.; Ara, I.; Badgery, W.B.; Culvenor, R.A.; Haling, R.E.; Harris, C.A.; Li, G.D.; Norton, M.R.; Orgill, S.E.; Penrose, B.; et al. Prospects for improve perennial legume persistence in mixed grazed pastures of south-eastern Australia, with particular reference to white clover. Crop. Pasture Sci. 2019, 70, 1141–1162. [Google Scholar] [CrossRef]
- Shi, S.; Villamizar, L.; Gerard, E.; Ronson, C.; Wakelin, S.; Ballard, R.; Caradus, J.R.; O’Callaghan, N. Increasing biological nitrogen fixation by white clover-rhizobia symbiosis. J. N. Z. Grassl. 2019, 81, 231–234. [Google Scholar] [CrossRef]
- Soumare, A.; Diedhiou, A.G.; Thuita, M.; Hafidi, M.; Ouhdouch, Y.; Gopalakrishnan, S.; Kouisni, L. Exploiting biological nitrogen fixation: A route towards a sustainable agriculture. Plants. 2020, 9, 1011. [Google Scholar] [CrossRef] [PubMed]
- Sanders, Z.P.; Andrews, J.S.; Saha, U.K.; Vencill, W.; Lee, R.D.; Hill, N.S. Optimizing agronomic practices for clover persistence and corn yield in a white clover–corn living mulch system. Agron. J. 2017, 109, 2025–2032. [Google Scholar] [CrossRef]
- Guy, C.; Hennessy, D.; Gilliland, T.F.; Coughlan, F.; McCarthy, B. Growth, morphology and biological nitrogen fixation potential of perennial ryegrass-white clover swards throughout the grazing season. J. Agric. Sci. 2018, 156, 188–199. [Google Scholar] [CrossRef]
- Sheaffer, C.C.; Halgerson, J.L.; Jung, H.G. Hybrid and N fertilization affect corn silage yield and quality. J Agron. Crop. Sci. 2006, 192, 278–283. [Google Scholar] [CrossRef]
- Sripada, R.P.; Heiniger, R.W.; White, J.G.; Meijer, A.D. Aerial color infrared photography for determining early in-season nitrogen requirements in corn. Agron. J. 2006, 98, 968–977. [Google Scholar] [CrossRef]
- Reberg-Horton, S.C.; Grossman, J.M.; Kornecki, T.S.; Meijer, A.D.; Price, A.J.; Place, G.T.; Webster, T.M. Utilizing cover crop mulches to reduce tillage in organic systems in the southeastern USA. Renew. Agric. Food Syst. 2012, 27, 41–48. [Google Scholar] [CrossRef]
- Affeldt, R.P.; Albrecht, K.A.; Boerboom, C.M.; Bures, E.J. Integrating herbicide-resistant corn technology in a kura clover living mulch system. Agron. J. 2004, 96, 247–251. [Google Scholar] [CrossRef]
- Zemenchik, R.A.; Albrecht, K.A.; Boerboom, C.M.; Lauer, J.G. Corn production with kura clover as a living mulch. Agron. J. 2000, 92, 698–705. [Google Scholar] [CrossRef]
- Brophy, L.S.; Heichel, G.H. Nitrogen release from roots of alfalfa and soybean grown in sand culture. Plant Soil. 1989, 116, 77–84. [Google Scholar] [CrossRef]
- Enriquez-Hidalgo, D.; Gilliland, T.J.; Hennessy, D. Herbage and nitrogen yields, fixation and transfer by white clover to companion grasses in grazed swards under different rates of nitrogen fertilization. Grass Forage Sci. 2016, 71, 559–574. [Google Scholar] [CrossRef]
- Mercier, K.M.; Teutsch, C.D.; Fike, J.H.; Munsell, J.F.; Tracy, B.F.; Strahm, B.D. Impact of increasing shade levels on the dry-matter yield and botanical composition of multispecies forage stands. Grass Forage Sci. 2020, 75, 291–302. [Google Scholar] [CrossRef]
- Quinby, M.P.; Nave, R.L.G.; Hill, N.S.; Boyer, C.N.; Sykes, V.R.; Bates, G.E.; Levi, M.R. Diversifying corn production systems with living mulches in the southeastern United States. Agron. J. 2023, 115, 1320–1334. [Google Scholar] [CrossRef]
- Little, N.G.; DiTommaso, A.; Westbrook, A.S.; Ketterings, Q.M.; Mohler, C.L. Effects of fertility amendments on weed growth and weed-crop competition: A review. Weed Sci. 2021, 69, 132–146. [Google Scholar] [CrossRef]
- Nakamoto, T.; Tsukamoto, M. Abundance and activity of soil organisms in fields of maize grown with a white clover living mulch. Agric. Ecosyst. Environ. 2006, 115, 34–42. [Google Scholar] [CrossRef]
- Osipitan, O.A.; Dille, J.A.; Assefa, Y.; Knezevic, S.Z. Cover crop for early season weed suppression in crops: Systematic review and meta-analysis. Agron. J. 2018, 110, 2211–2221. [Google Scholar] [CrossRef]
- Steckel, L.E. The dioecious Amaranthus spp.: Here to stay. Weed Technol. 2007, 21, 567–570. [Google Scholar] [CrossRef]
- Brock, J.L.; McKenzie, J.; Pound, S. Towards improving white clover establishment on farms. Proc. N. Z. Grassl. Assoc. 2005, 67, 35–39. [Google Scholar] [CrossRef]
- Chapman, D.F.; Lee, J.M.; Rossi, L.; Edwards, G.R.; Pinxterhuis, J.B.; Minnee, M.K. White clover: The forgotten component of high-producing pasture? Anim. Prod. Sci. 2017, 57, 1269–1276. [Google Scholar] [CrossRef]
- Lewis, C.D.; Ho, C.K.M.; Cullen, B.R.; Malcolm, B. Pasture and the theory of diversification. Anim. Prod. Sci. 2017, 57, 1210–1218. [Google Scholar] [CrossRef]
- Nave, R.L.G.; Corbin, M.D. Forage warm-season legumes and grasses intercropped with corn as an alternative for corn silage production. Agronomy 2018, 8, 199. [Google Scholar] [CrossRef]
- Ferraretto, L.F.; Shaver, R.D.; Luck, B.D. Silage review: Recent advances and future technologies for whole-plant and fractionated corn silage harvesting. J. Dairy Sci. 2018, 101, 3937–3951. [Google Scholar] [CrossRef]
- Osterholz, W.; Ruark, M.D.; Renz, M.; Grabber, J.H. Benefits of alfalfa interseeding include reduced residual soil nitrate following corn production. Agric. Environ. Lett. 2021, 6, e20053. [Google Scholar] [CrossRef]
- Borghi, E.; Crusciol, C.A.C.; Mateus, G.P.; Nascente, A.S.; Martins, P.O. Intercropping time of corn and palisadegrass or guineagrass affecting grain yield and forage production. Crop. Sci. 2013, 53, 629–636. [Google Scholar] [CrossRef]
- Zhang, G.; Yang, Z.; Dong, S. Interspecific competitiveness affects the total biomass yield in an alfalfa and corn intercropping system. Field Crop. Res. 2011, 124, 66–73. [Google Scholar] [CrossRef]
- Andrews, J.S.; Sanders, Z.P.; Cabrera, M.L.; Saha, U.K.; Hill, N.S. Nitrogen dynamics in living mulch and annual cover crop corn production systems. Agron. J. 2018, 110, 1309–1317. [Google Scholar] [CrossRef]
- Sanders, Z.P.; Andrews, J.S.; Hill, N.S. Water use efficiency in living mulch and annual cover crop corn production systems. Agron. J. 2018, 110, 1128–1135. [Google Scholar] [CrossRef]
- Humphreys, M.T.; Freeman, K.W.; Mullen, R.W.; Keahey, D.A.; Teal, R.K.; Raun, W.R. Canopy reduction and legume interseeding in irrigated continuous corn. J. Plant Nutr. 2003, 26, 1335–1343. [Google Scholar] [CrossRef]
- MacLaren, C.; Swanepoel, P.; Bennett, J.; Wright, J.; Dehnen-Schmutz, K. Cover crop biomass production is more important than diversity for weed suppression. Crop. Sci. 2019, 59, 733–748. [Google Scholar] [CrossRef]
- Noland, R.L.; Wells, M.S.; Sheaffer, C.C.; Baker, J.M.; Martinson, K.L.; Coulter, J.A. Establishment and function of cover crop interseeded into corn. Crop. Sci. 2018, 58, 863–873. [Google Scholar] [CrossRef]
- Simms, E.L.; Taylor, D.L. Partner choice in nitrogen-fixation mutualisms of legumes and rhizobia. Integr. Comp. Biol. 2002, 42, 369–380. [Google Scholar] [CrossRef]
- Naudin, C.; Corre-Hellou, G.; Pineau, S.; Crozat, Y.; Jeuffroy, M.H. The effect of various dynamics of N availability on winter pea-wheat intercrops: Crop growth, N partitioning and symbiotic N2 fixation. Field Crop. Res. 2010, 119, 2–11. [Google Scholar] [CrossRef]
- García-Martínez, H.; Flores-Magdaleno, H.; Ascencio-Hernádez, R.; Khalil-Gardezi, A.; Tijerina-Chávez, L.; Mancilla-Villa, O.R.; Vázquez-Peña, M.A. Corn grain yield estimation from vegetation indices, canopy cover, plant density, and a neutral network using multispectral and RGB images acquired with unmanned aerial vehicles. Agriculture 2020, 10, 277. [Google Scholar] [CrossRef]
- Weaver, A.C.; Weaver, D.M.; Adams, N.; Yiannikouris, A. Co-occurrence of 35 mycotoxins: A seven-year survey of corn grain and corn silage in the United States. Toxins 2021, 13, 516. [Google Scholar] [CrossRef]
- Larson, E.J.; Clegg, M.D. Using corn maturity to maintain grain yield in the presence of late-season drought. J. Prod. Agric. 1999, 12, 400–405. [Google Scholar] [CrossRef]
Disclaimer/Publisher’s Note: The statements, opinions and data contained in all publications are solely those of the individual author(s) and contributor(s) and not of MDPI and/or the editor(s). MDPI and/or the editor(s) disclaim responsibility for any injury to people or property resulting from any ideas, methods, instructions or products referred to in the content. |
© 2023 by the authors. Licensee MDPI, Basel, Switzerland. This article is an open access article distributed under the terms and conditions of the Creative Commons Attribution (CC BY) license (https://creativecommons.org/licenses/by/4.0/).