Article

Assessing Roles of Aggregate Structure on Hydraulic Properties of Saline/Sodic Soils in Coastal Reclaimed Areas

1
Key Laboratory for Geographical Process Analysis and Simulation of Hubei Province, College of Urban and Environmental Sciences, Central China Normal University, Wuhan 430079, China
2
College of Agricultural Science and Engineering, Hohai University, Nanjing 210098, China
3
College of Soil and Water Conservation, Hohai University, Changzhou 213022, China
*
Author to whom correspondence should be addressed.
Agronomy 2024, 14(12), 2877; https://doi.org/10.3390/agronomy14122877
Submission received: 22 October 2024 / Revised: 17 November 2024 / Accepted: 25 November 2024 / Published: 3 December 2024
(This article belongs to the Special Issue Soil Evolution, Management, and Sustainable Utilization)

Abstract

:
During coastal reclamation processes, land use conversion from natural coastal saline/sodic soils to agricultural land changes the soil’s physicochemical properties. However, the impact of soil structure evolution on soil hydraulic properties (SHPs, e.g., hydraulic conductivity and soil water retention curves) during long-term reclamation has rarely been reported. In this study, we aimed to evaluate the effect of reclamation duration and land use types on the soil aggregate stability and SHPs of coastal saline/sodic soils and incorporate the aggregate structures into the SHPs. In this study, a total of 90 soil samples from various reclaimed years (2007, 1960, and 1940) and land use patterns (cropland, grassland, forestland, and wasteland) were taken to analyze the quantitative effects of soil saline/sodic characteristics and the aggregate structure on SHPs through pedotransfer functions (PTFs). We found that soil macroaggregate contents in the old reclaimed areas (reclaimed in 1940 and 1960) were significantly larger than those in the new reclamation area (reclaimed in 2007). The soil saturated hydraulic conductivity (Ks) of forestland was larger than that of grassland in each reclamation year. Soil structure contributed to 22.13%, 24.52%, and 23.93% of the total variation in Ks and soil water retention parameters (α and n). The PTFs established in our study were as follows: log(Ks) = 0.524 − 0.177 × Y k 3 − 0.093 × Y k 1 + 0.135 × Y k 4 − 0.054 × Y k 2 , 1/α = 477.244 − 91.732 × Y α 2 − 81.283 × Y α 4 + 38.106 × Y α 3 , and n = 1.679 − 0.086 × Y n 2 + 0.045 × Y n 1 − 0.042 × Y n 3   ( Y a r e p r i n c i p a l c o m p o n e n t s ) . The mean relative errors of the prediction models for log(Ks), 1/α, and n were 79.30%, 36.1%, and 9.89%, respectively. Our findings quantify the vital roles of the aggregate structure on the SHPs of coastal saline/sodic soils, which will help us understand related hydrological processes.

1. Introduction

The scientific improvement and utilization of coastal saline–alkali land play an irreplaceable role in expanding China’s coastal development space, making up for the lack of cultivated land and ensuring food security. From the 11th century to the end of 2008, about 2 × 10⁴ km2 of coastal beaches was utilized in Jiangsu Province in China [1]. From 1951 to the end of 2008, about 2747 km2 of the coastal land was reclaimed, forming a total of 207 reclamation areas [1]. Based on remote sensing data, a total area of 1074 km2 was reclaimed in Jiangsu coastal areas from 2000 to 2017 [2]. Saline/sodic soils are intensively used immediately after seawall construction. Land use conversion from natural coastal saline/sodic soils to agricultural land has changed the soil’s physicochemical properties [3]. Obstacle factors, namely, seawater immersion and the short timespan of land formation, shallow groundwater levels, high soil salinity, and a shortage of freshwater resources, have always been the main limiting factors of soil water use and land agricultural utilization [4,5].
Soil aggregation involves the cementing of soil particles into secondary units. It helps form the soil structure and create high water penetration, and these properties directly affect water and soil conservation and help determine soil quality [6,7]. Many studies have found that soil aggregate stability changes with soil organic matter (SOM), land use patterns, and tillage methods [8,9]; however, the development of aggregate stability in saline/sodic soils following reclamation in coastal areas has rarely received attention. Furthermore, the interaction between soil physical/chemical properties and aggregates is unclear due to the extensive size range and various influencing attributes [10]. Soil hydraulic properties (SHPs, including hydraulic conductivity, soil water retention curves (SWRCs), water diffusivity, and dispersion) are essential for water and solute movement and heat transfer processes near the soil surface. Soil saturated hydraulic conductivity (Ks) and SWRCs vary among soils because they have a causal relationship with the particle size distribution and soil structure, which determine the bulk density (BD) and, in turn, are determined by many factors, e.g., vegetation, land use, climate, and terrain [5,11,12].
Generally, a direct measurement of SHPs is relatively costly and time- and labor-consuming. Indirect estimation methods, for instance, pedotransfer functions (PTFs), have been applied extensively to predict SHPs [13,14,15,16]. Generally, PTFs are established and include soil BD, soil texture, SOM, etc. [11,17]. In recent decades, some new descriptors have also appeared in PTFs, such as micropore geometry [18], the soil infiltration rate [19], topographic properties [20], and soil depth [21]. However, few researchers have integrated the soil structure or soil saline/sodic properties into PTFs [18,22]. The soil structure has been widely regarded as a very important hydrological function [23,24]; especially under saturated and near-saturated conditions, a few large pores can be responsible for 90% of soil infiltration [25]. Some studies have pointed out that a soil’s structure has a non-negligible impact on its SHPs, and adding soil structure factors to the traditional PTFs can improve the accuracy of the models [16,23]. As confirmed by Yao et al. (2015) [22], soil salinity has an adverse impact on soil Ks, but those authors’ research lacked information on the soil structure in terms of the PTFs. Kutílek (2004) [26] reported the role of soil structure in soil hydrology on a pedon scale. The addition of soil structure parameters into PTFs for SHPs will help improve accuracy [16]. Although there is some research studying soil saline–alkali characteristics or SHPs in this region [4,22], the soil aggregate structure has rarely been studied.
In this study, we hypothesized that reclamation duration and land use types have a significant effect on the aggregate stability and SHPs of saline/sodic soils and that the addition of saline/sodic soil structure parameters would help improve the accuracy of prediction models for soil Ks and SWRC parameters. Based on this hypothesis, we collected saline/sodic soil samples corresponding to three reclamation durations, four land use patterns, and three soil depths to study the aggregate structure evolution of saline/sodic soils. We also established PTFs to analyze the quantitative effect of soil saline/sodic characteristics and the aggregate structure on SHPs. Hence, the objectives of this research were (1) to evaluate the evolution characteristics of aggregate stability and SHPs of coastal saline/sodic soils subjected to various reclamation durations and land use types and (2) to quantify the impact of soil saline/sodic characteristics and aggregate structure on SHPs by establishing PTFs.

2. Materials and Methods

2.1. Study Area

A field test was performed in a reclaimed area (32°12′–32°36′ N, 120°42′–121°22′ E) in Rudong County, Nantong City, Jiangsu Province (Figure 1a). It is a low-lying area with an average altitude of 3.5–4.5 m. The mean annual temperature, sunshine duration, and rainfall are 15 °C, 2421.6 h, and 1026 mm, respectively. The annual potential evapotranspiration is 1343.5 mm. The water infiltration is significantly limited; this is due to the high soil salt content and poor structure. The soils in this research area have developed from marine sediment parent material with silt loam as the main soil texture. According to the World Reference Base for Soil Resources [27], the soil type is Solonchaks (SC). The soil organic matter content (SOM) ranges from 1.89 to 24.72 g/kg and the total soil salt content varies from 0.28 to 18.03 g/kg. Since 2007, the Yudong reclamation area, which is located near the coast, has experienced approximately 20.67 km2 of land reclamation. The planting area, aquaculture area, and abandoned area account for approximately 70%, 5%, and 25% of the total area, respectively. The planting and aquaculture areas in the 1960 reclamation area account for approximately 40% and 60%, respectively. The planting and aquaculture area reclaimed in 1940 account for approximately 70% and 30%, respectively. In this study area, the reclamation and development have a long history. As early as the Song Dynasty, the Fangong Dam was constructed to reclaim the land from the sea. From 1951 to the end of 2008, a total area of 2747 km2 was reclaimed with 207 reclamation areas [1], and about 1074 km2 was reclaimed from 2000 to 2017 [2].

2.2. Experimental Design

In May 2015, 36 soil samples were collected once in the 2007 reclamation area, and 27 soil samples were selected for field investigation in the 1960 and 1940 reclamation areas (3 different depths and 3 replications) to analyze the soil structure evolution characteristics under different reclamation durations and land use types. A total of 36 sampling points with four land use patterns (cropland, grassland, forestland, and wasteland) were randomly selected in the area reclaimed in 2007. Twenty-seven sampling points with three land use patterns (cropland, grassland, and forestland) were randomly selected around the public service center of Jiulong Village in the 1960 reclamation area and the public service center of Liuzong Village in the 1940 reclamation area, respectively. Disturbed soils were taken at 0–20, 20–40, and 40–60 cm soil depths with three replicates.
Disturbed soil samples (approximately 2 kg) were taken at each sampling point and analyzed at Hohai University (31°86′ N, 118°60′ E) for soil physicochemical properties. The soil electrical conductivity (EC1:5) was analyzed using a conductivity meter (DDS-307, REX, Shanghai, China). Soil particle composition was obtained using a laser particle size analyzer (Mastersizer 2000, Malvern Instruments Ltd., Worcestershire, UK) and classified using the USDA system. The SOM was measured using the wet-burning method through potassium dichromate [28]. To measure the soil BD and Ks, undisturbed surface soils were taken using sampling rings with a diameter and length of 5 cm. Simultaneously, undisturbed topsoils were taken using steel sampling rings (2 cm in length and 5 cm in diameter) to acquire SWRCs.

2.3. Soil Saline−Alkali Characteristic Measurements

Soil Na+, Ca2+, K+, and Mg2+ were acquired using an inductively coupled plasma-optical emission spectrometer (ICP-OES, Optima 8000, Perkin-Elmer, Waltham, MA, USA). Soil H C O 3 was obtained using the double- indicator approach (phenolphthalein and methyl orange), and soil Cl and SO 4 2 were analyzed using silver nitrate titration and EDTA titration methods, respectively [28]. The soil cation exchange capacity was obtained using the ammonium acetate method. The soil saline–alkali characteristics are represented by the following formulas [28]:
SAR = C Na C Ca + C Mg 2
ESP = C Na CEC
Here, SAR is the sodium adsorption ratio, (g/kg)0.5; ESP is the exchangeable sodium percentage, %; C is the ion concentration, g/kg; and CEC is the cation exchange capacity, cmol/kg.

2.4. Soil Water Stable Aggregate Measurements

Approximately 50 g of dried soil was collected and gently screened using a 5 mm sieve. The soils were placed in a 2 mm sieve and immersed in pure water. Then, the soils were shaken up and down in a shallow plate 50 times for 2 min at a height of 3 cm [5,29]. During this process, the soil materials were kept below the water surface [29]. The shallow plate was then moved to 0.25 and 0.053 mm sieves, and the shaking procedure was repeated. Floating impurities were removed during this screening process. Finally, soil fractions with four aggregate sizes (0–53, 53–250, 250–2000, and 2000–5000 μm) were obtained. The mass of each soil fraction was measured using the oven-drying method. The soil aggregate stability can be characterized by Equation (3) [30]:
MWD = i = 1 n X i W i / W T
Here, MWD is the mean weight diameter, mm; Xi is the average diameter of the soil aggregates, mm; Wi is the mass of soil aggregates corresponding to Xi, g; and WT is the total mass of the soil samples, g.

2.5. SHP Measurements

Soil Ks was measured using the constant-head method with Markov bottles. The bottom of the soil columns was wrapped with permeable gauze and then placed in distilled water (the water level did not exceed the soil column surface). The soil samples were saturated for 24 h until water films appeared on the surface. Then, filter papers were placed on the soil surface to prevent damage from the initial water flow to the soil surface. The same empty sampling ring was placed above the soil sample, and their interface was tightly wrapped with a rubber sleeve to prevent the leakage of distilled water. Soil Ks could be obtained using Darcy’s law.
The SWRC was measured using the pressure membrane instrument. The matric potentials were set as 0, −0.1, −0.3, −0.5, −1, −3, −5, −10, and −15 bar. After the water content was stable at each matric potential, the soils were taken out, and the excess water outside the steel sampling rings was gently removed. The relationship between soil volume water content ( θ ) and matric potential ( Ψ ) can be determined using the van Genuchten (1980) −Mualem model [31]:
θ = θ r + θ s θ r [ 1 + ( α Ψ ) n ] m
Here,   θ s is the saturated water content, cm3 cm−3; θ r is the residual water content, cm3 cm−3; and n and m (m = 1 – 1/n) are shape parameters. The obtained water contents under each matric potential were put into RETC software (version: 6.02) and fitted with the classical unimodal van Genuchten model to obtain   θ s ,   θ r , α, and n [32]. The soil equivalent pore distribution was obtained from the fitted SWRC using the Young−Laplace Equation:
d = 3 h
Here, d is the equivalent pore diameter in mm and h is the soil water suction (cm H2O).

2.6. Data Analysis

In this study, principal component analysis (PCA) was used to reduce the data dimensions and obtain the correlation between variables by simplifying many complex explanatory variables into several easier ones. Descriptive statistical analysis, the significance test, PCA, and multiple linear regression were calculated using SPSS 22.0. Before the PCA was carried out, the variables were transformed to follow normal distributions. A Kolmogorov–Smirnov test was performed at p = 0.05 to judge whether a variable obeyed a normal distribution. The explanatory variables and dependent variables followed normal distributions after logarithmic transformation, square root transformation, or reciprocal transformation. In PCA, the absolute values of the factor load matrix can reflect the relationship between the original variables and principal components. The greater the absolute values are, the more information the principal component contains. The Akaike information criterion (AIC) and the Bayesian information criterion (BIC) were used to estimate the quality of each model. The lower the AIC and BIC values and the higher the likelihood function (Loglik) values were, the better the model in question was [33]. Taking the soil properties (soil BD, water stable aggregates, soil saline–alkali characteristic parameters (EC1:5, SAR, ESP), CEC, SOM, clay, and silt content) or principal components as input variables, PTFs were established using a multiple regression method to evaluate the quantitative impact of the soil saline–alkali characteristics and aggregation structure on SHPs. Randomly taking 75% of the datasets as calibration datasets and the remaining 25% as validation datasets, the prediction results were compared with the original data to verify the model errors.

3. Results

3.1. Effects of Reclamation Duration and Land Use Types on Aggregate Stability and SHPs of Saline/Sodic Soils

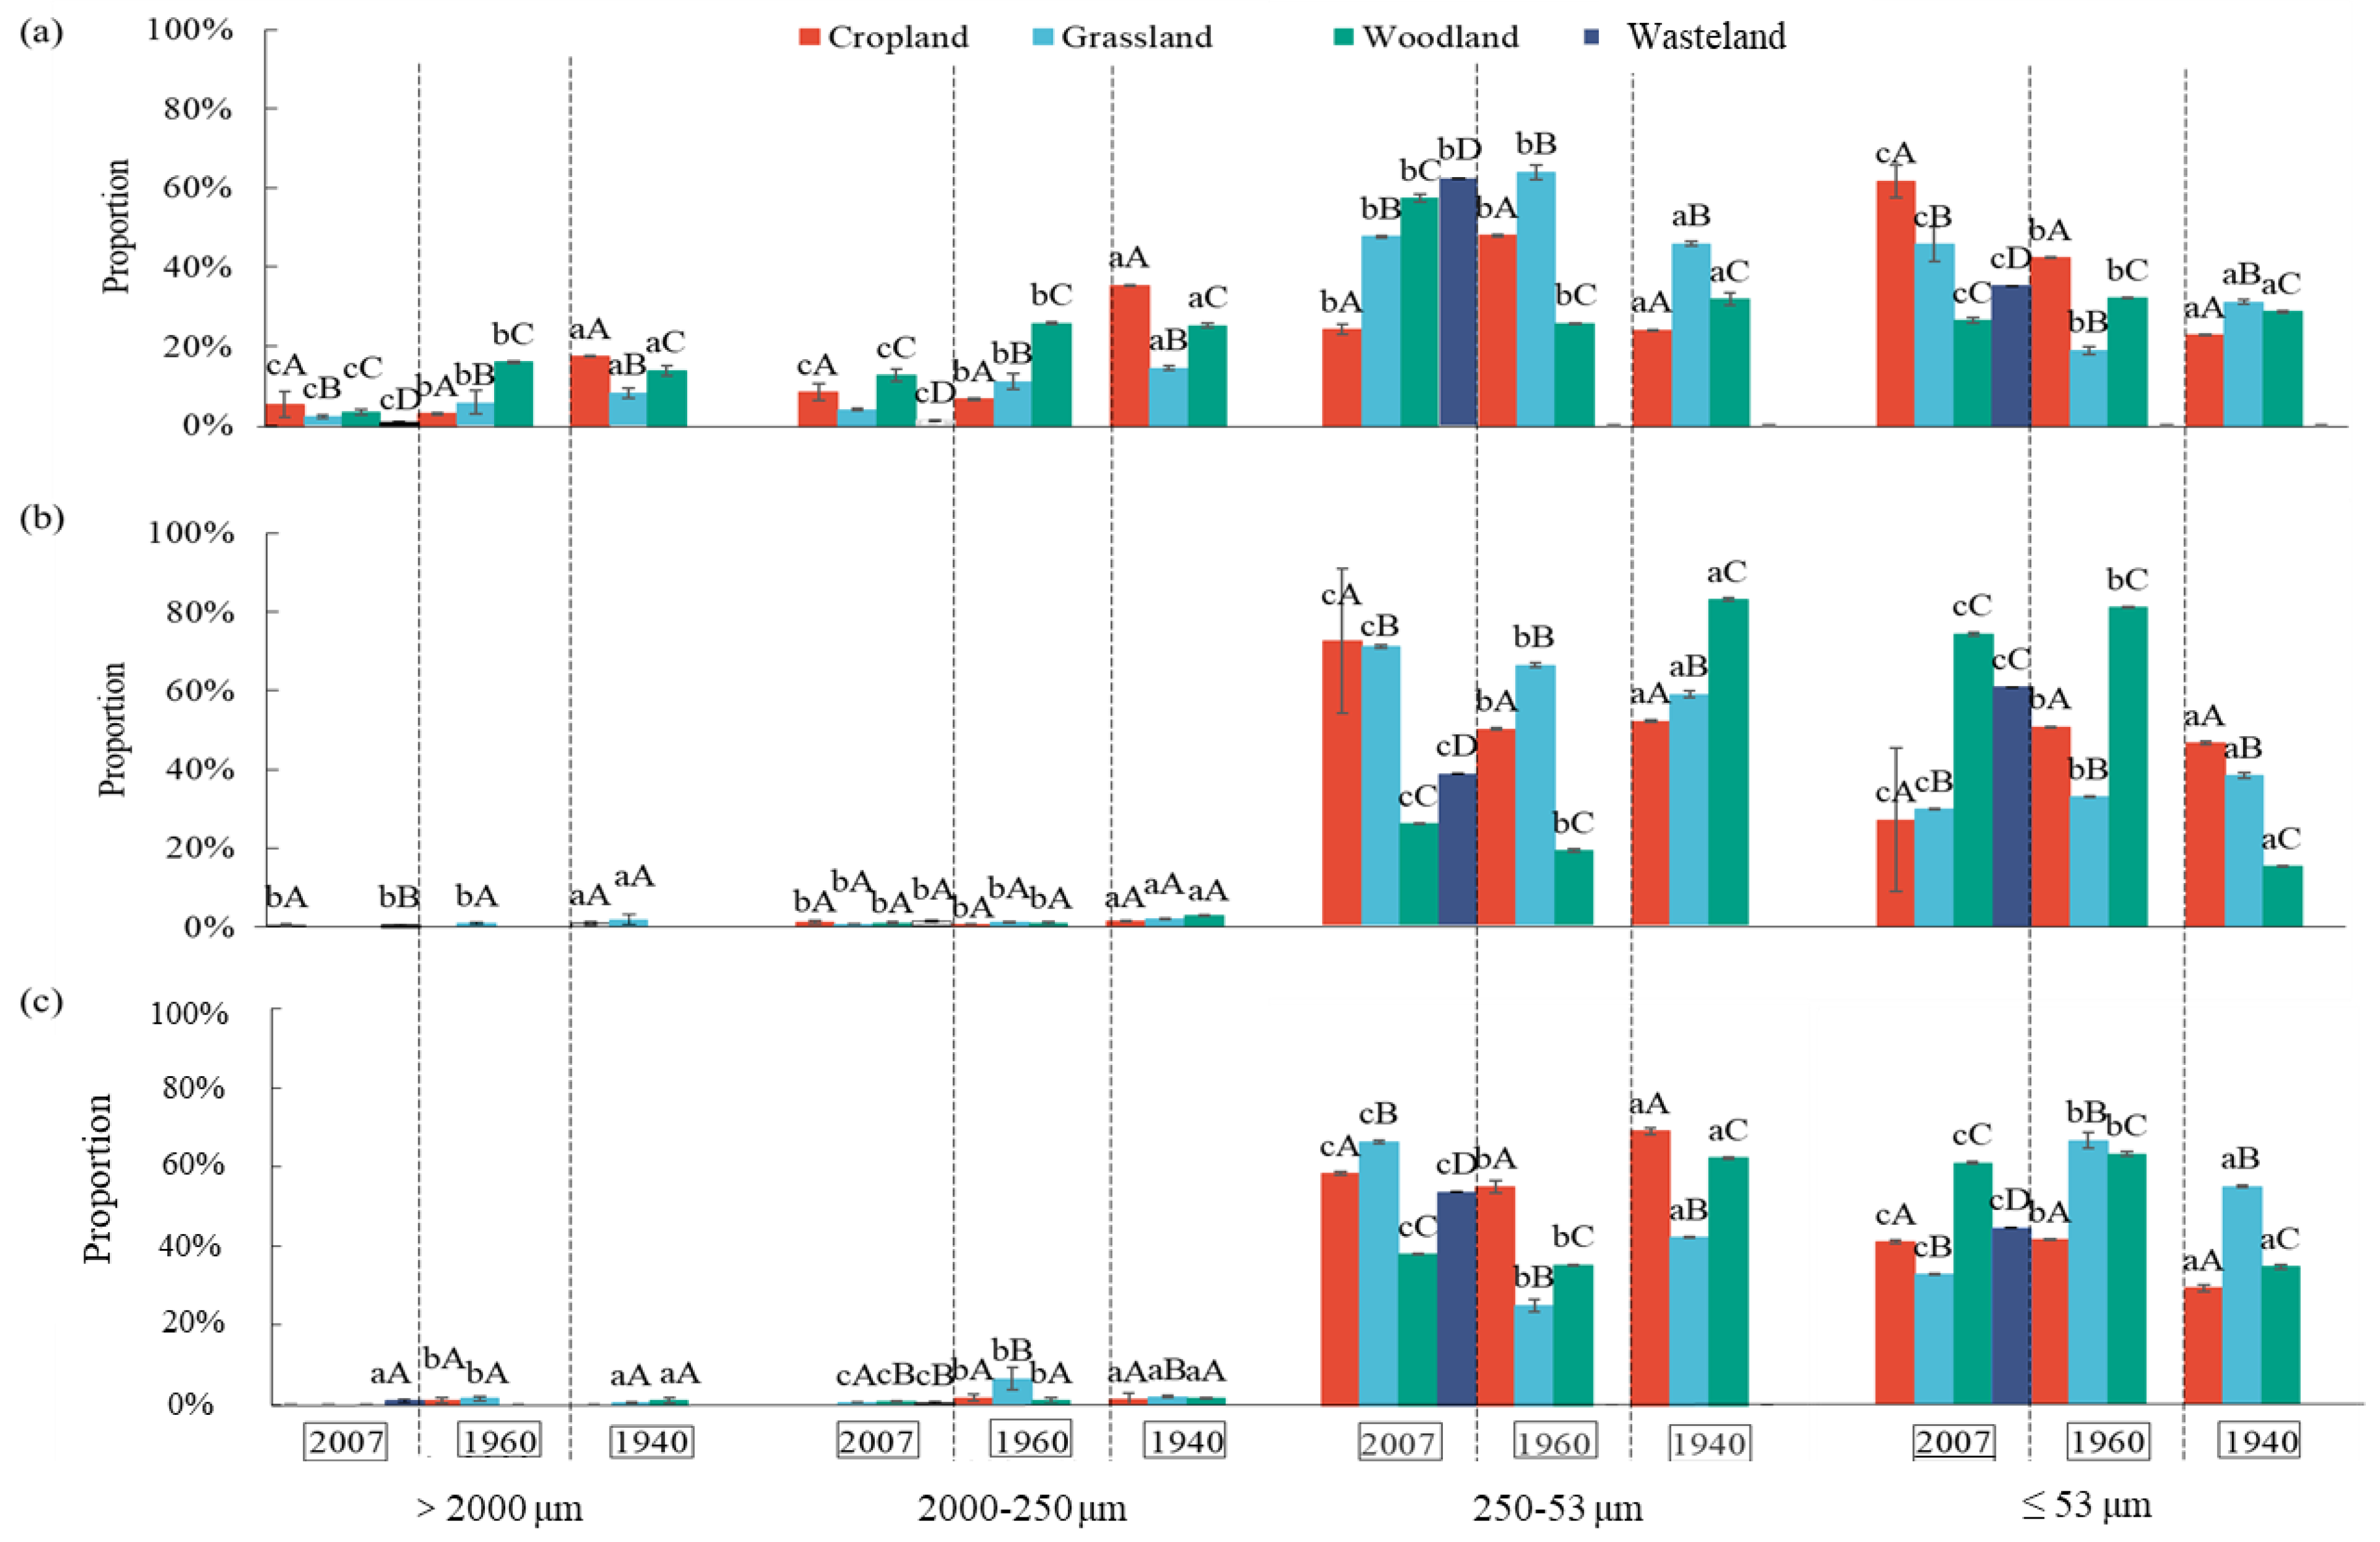
As shown in Figure 2, our results demonstrated that the contents of soil water stable aggregates with sizes of >2000 μm (with a 2.82% mean value) and 250–2000 μm (with a 5.71% mean value) were significantly lower than the sizes of 53–250 μm (with a 49.09% mean value) and ≤53 μm (with a 42.38% mean value) at each soil depth. The contents of macroaggregates (>250 μm) at the 0–20 cm soil depth varied from 2.02% to 39.21% with a mean value of 22.16% and were significantly larger than the second and third soil depths with large aggregates, accounting for 1.49% and 1.95%, respectively. The proportion of surface soil macroaggregates in the old reclamation area (reclaimed in 1940 and 1960 with mean values of 9.17% and 14.37%, respectively) was significantly larger than that in the new reclamation area (reclaimed in 2007 with a mean value of 3.67%). In the reclamation year of 2007, the content of large aggregates in the surface soils of the wasteland was the lowest among all the land use patterns. The variance analysis showed that the distribution of soil aggregates at each soil depth was significantly affected by the reclamation duration and land use (Table S1).
Compared with the reclamation years of 1960 and 1940, soil Ks was significantly larger in the reclamation year of 2007 (Table 1), and it showed no difference between the different soil depths (Table S2). A significant difference existed in the soil CK and silt content between the three reclamation years (p < 0.05). According to the classification criteria of Davis et al. (2007) [34], saline, high-pH, saline/sodic, and sodic soils accounted for 16.67%, 50.0%, 23.33%, and 10.0% of the topsoil, respectively. At the 20–40 cm soil depth, saline, high-pH, saline/sodic, and sodic soils accounted for 0%, 26.66%, 36.67%, and 36.67%, respectively, and they accounted for 0%, 43.33%, 30.0%, and 26.67% at 40–60 cm soil depths, respectively (Figure S1). As can be seen in Table 2, the coefficient of correlation between the SOM and MWD was the largest (0.57), indicating that the SOM was dominant in terms of stability of the soil aggregates. The CNa exhibited a negative connection with soil Ks, BD, and MWD while the CCa showed a positive relationship with soil BD and MWD. For the saline soil, the CNa presented a negative connection with the proportion of soil macroaggregates (R2 = 0.26).

3.2. Factor Screening Based on PCA

A Pearson correlation analysis of the explanatory variables revealed that a significant relationship existed between the explanatory variables (Table 2); thus, a PCA could be carried out. The PCA of the soil Ks showed that the extracted principal components had high degrees of interpretation for each variable, and the variable commonality of the extracted data was greater than 0.5. The same conclusion could be reached for the parameters n and α. The eigenvalues of the first, second, third, and fourth principal components were 5.167, 3.099, 2.120, and 1.083, respectively, and four principal components contributed to 81.921% of the total variance (Figure 3). Similarly, the four eigenvalues of the principal components for α were 4.976, 3.433, 1.914, and 1.091, respectively, and the four principal components accounted for 81.520% of the total variation. The four eigenvalues of the principal components for n were 5.068, 3.353, 1.894, and 1.019, and the four principal components accounted for 80.959% of the total variation (Figure 3).
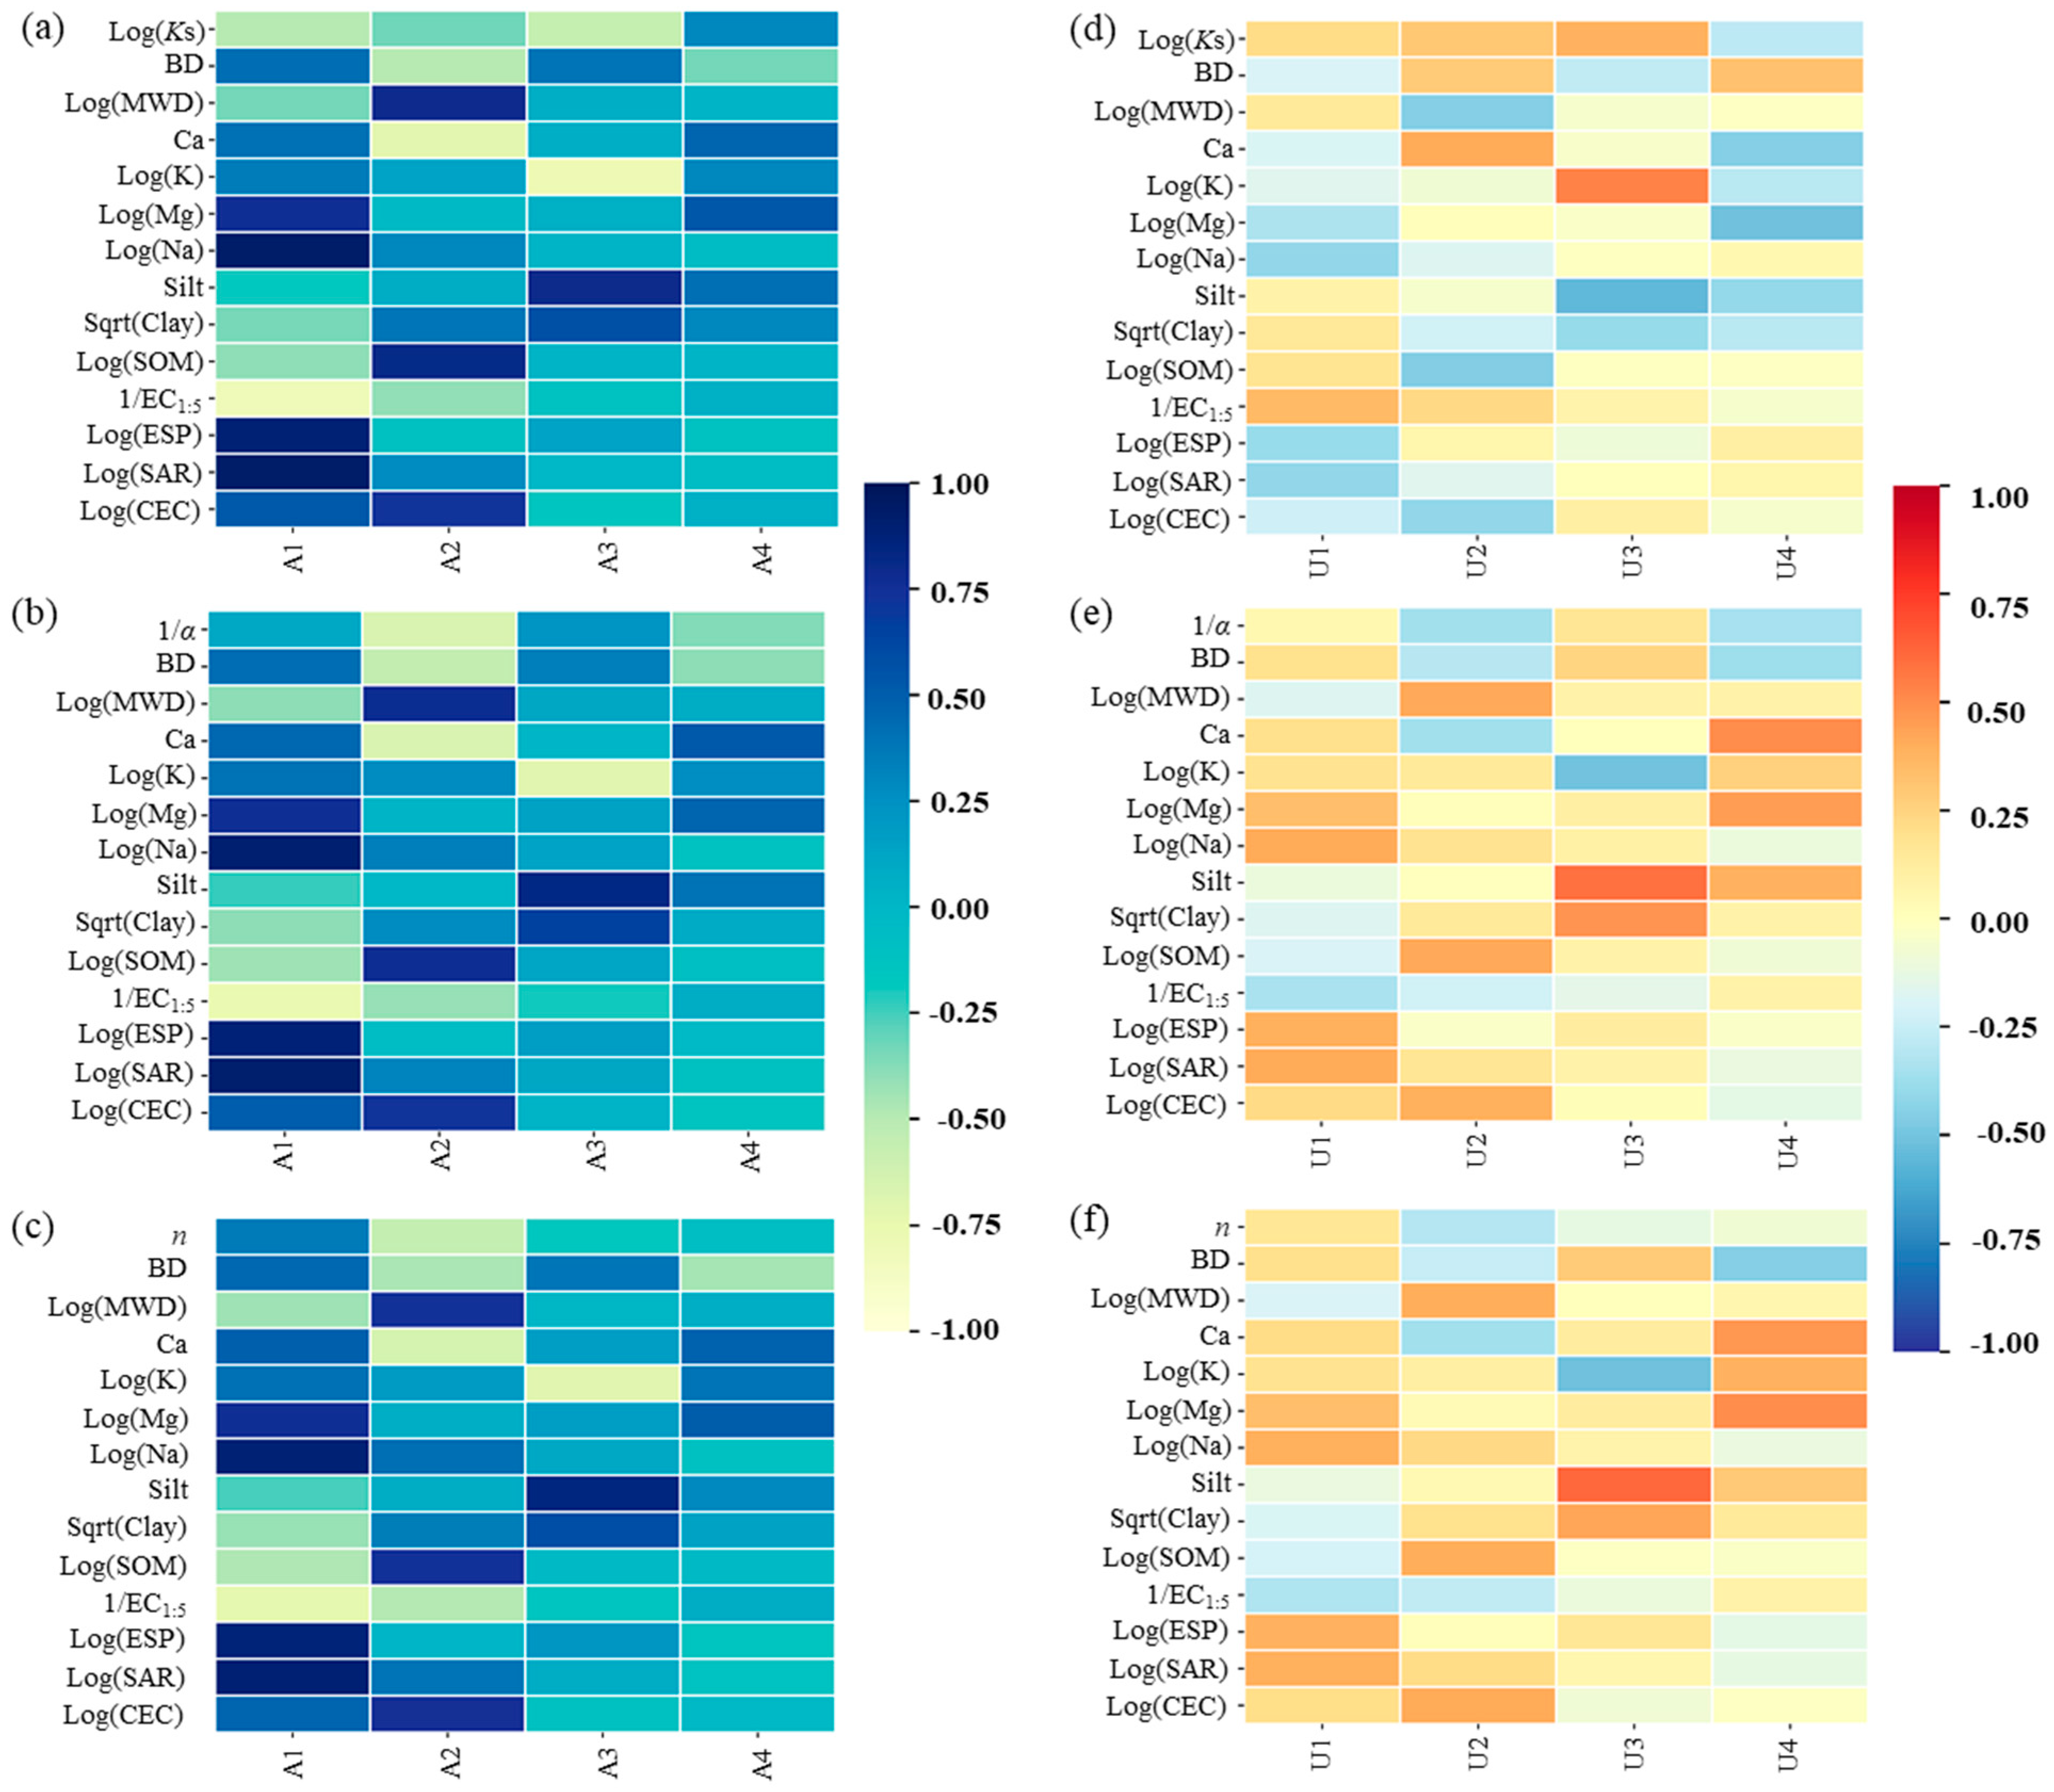
The factor load matrix and principal component load matrix based on PCA are presented in Figure 4. Figure 4a shows that the first principal component (PC1) of the soil Ks mainly covered the information on CNa, CMg, EC1:5, ESP, SAR, and CEC, which mainly reflected the information on the soil saline–alkali characteristics. Similarly, the second principal component (PC2) mainly covered the information on the soil MWD, CCa, SOM, and CEC, which mainly reflected the information on the soil structure. The third principal component (PC3) mainly covered the information on the CK, silt content, and clay content, which mainly reflected the information on the soil texture. The fourth principal component (PC4) mainly covered the information on CMg. In the factor load matrix, the coefficient of correlation between the soil Ks and its PC3 was the largest, followed by its PC1.
As can be seen in Figure 4b, the PC1 of α mainly covered the information on CMg, CNa, EC1:5, ESP, SAR, and CEC, which mainly reflected the information on the soil saline–alkali characteristics. Similarly, the PC2 mainly covered the information on the soil BD, MWD, CCa, SOM, and CEC, which mainly reflected the information on the soil structure. The PC3 mainly covered the information on the CK, silt content, and clay content, which mainly reflected the information on the soil texture. The PC4 mainly covered the information on CCa. In the factor load matrix, the coefficient of correlation between α and its PC2 was the largest, followed by its PC4.
Similarly, the PC1 of n mainly covered the information on CMg, CNa, EC1:5, ESP, and SAR and mainly reflected the information on the soil saline–alkali characteristics (Figure 4c). The PC2 mainly covered the information on the soil MWD, CCa, SOM, and CEC, which reflected the information on the soil structure. The PC3 mainly covered the information on the CK, silt content, and clay content, which mainly reflected the information on the soil texture. The PC4 mainly covered the information on CMg. In the factor load matrix, the related coefficient between n and its PC2 was the largest, followed by its PC1. This result showed that the soil structure was one of the important factors that affected the retention parameters α and n. Figure 4d–f show the principal component load matrices for Ks, α, and n, which were the related coefficients between the principal components and original variables.
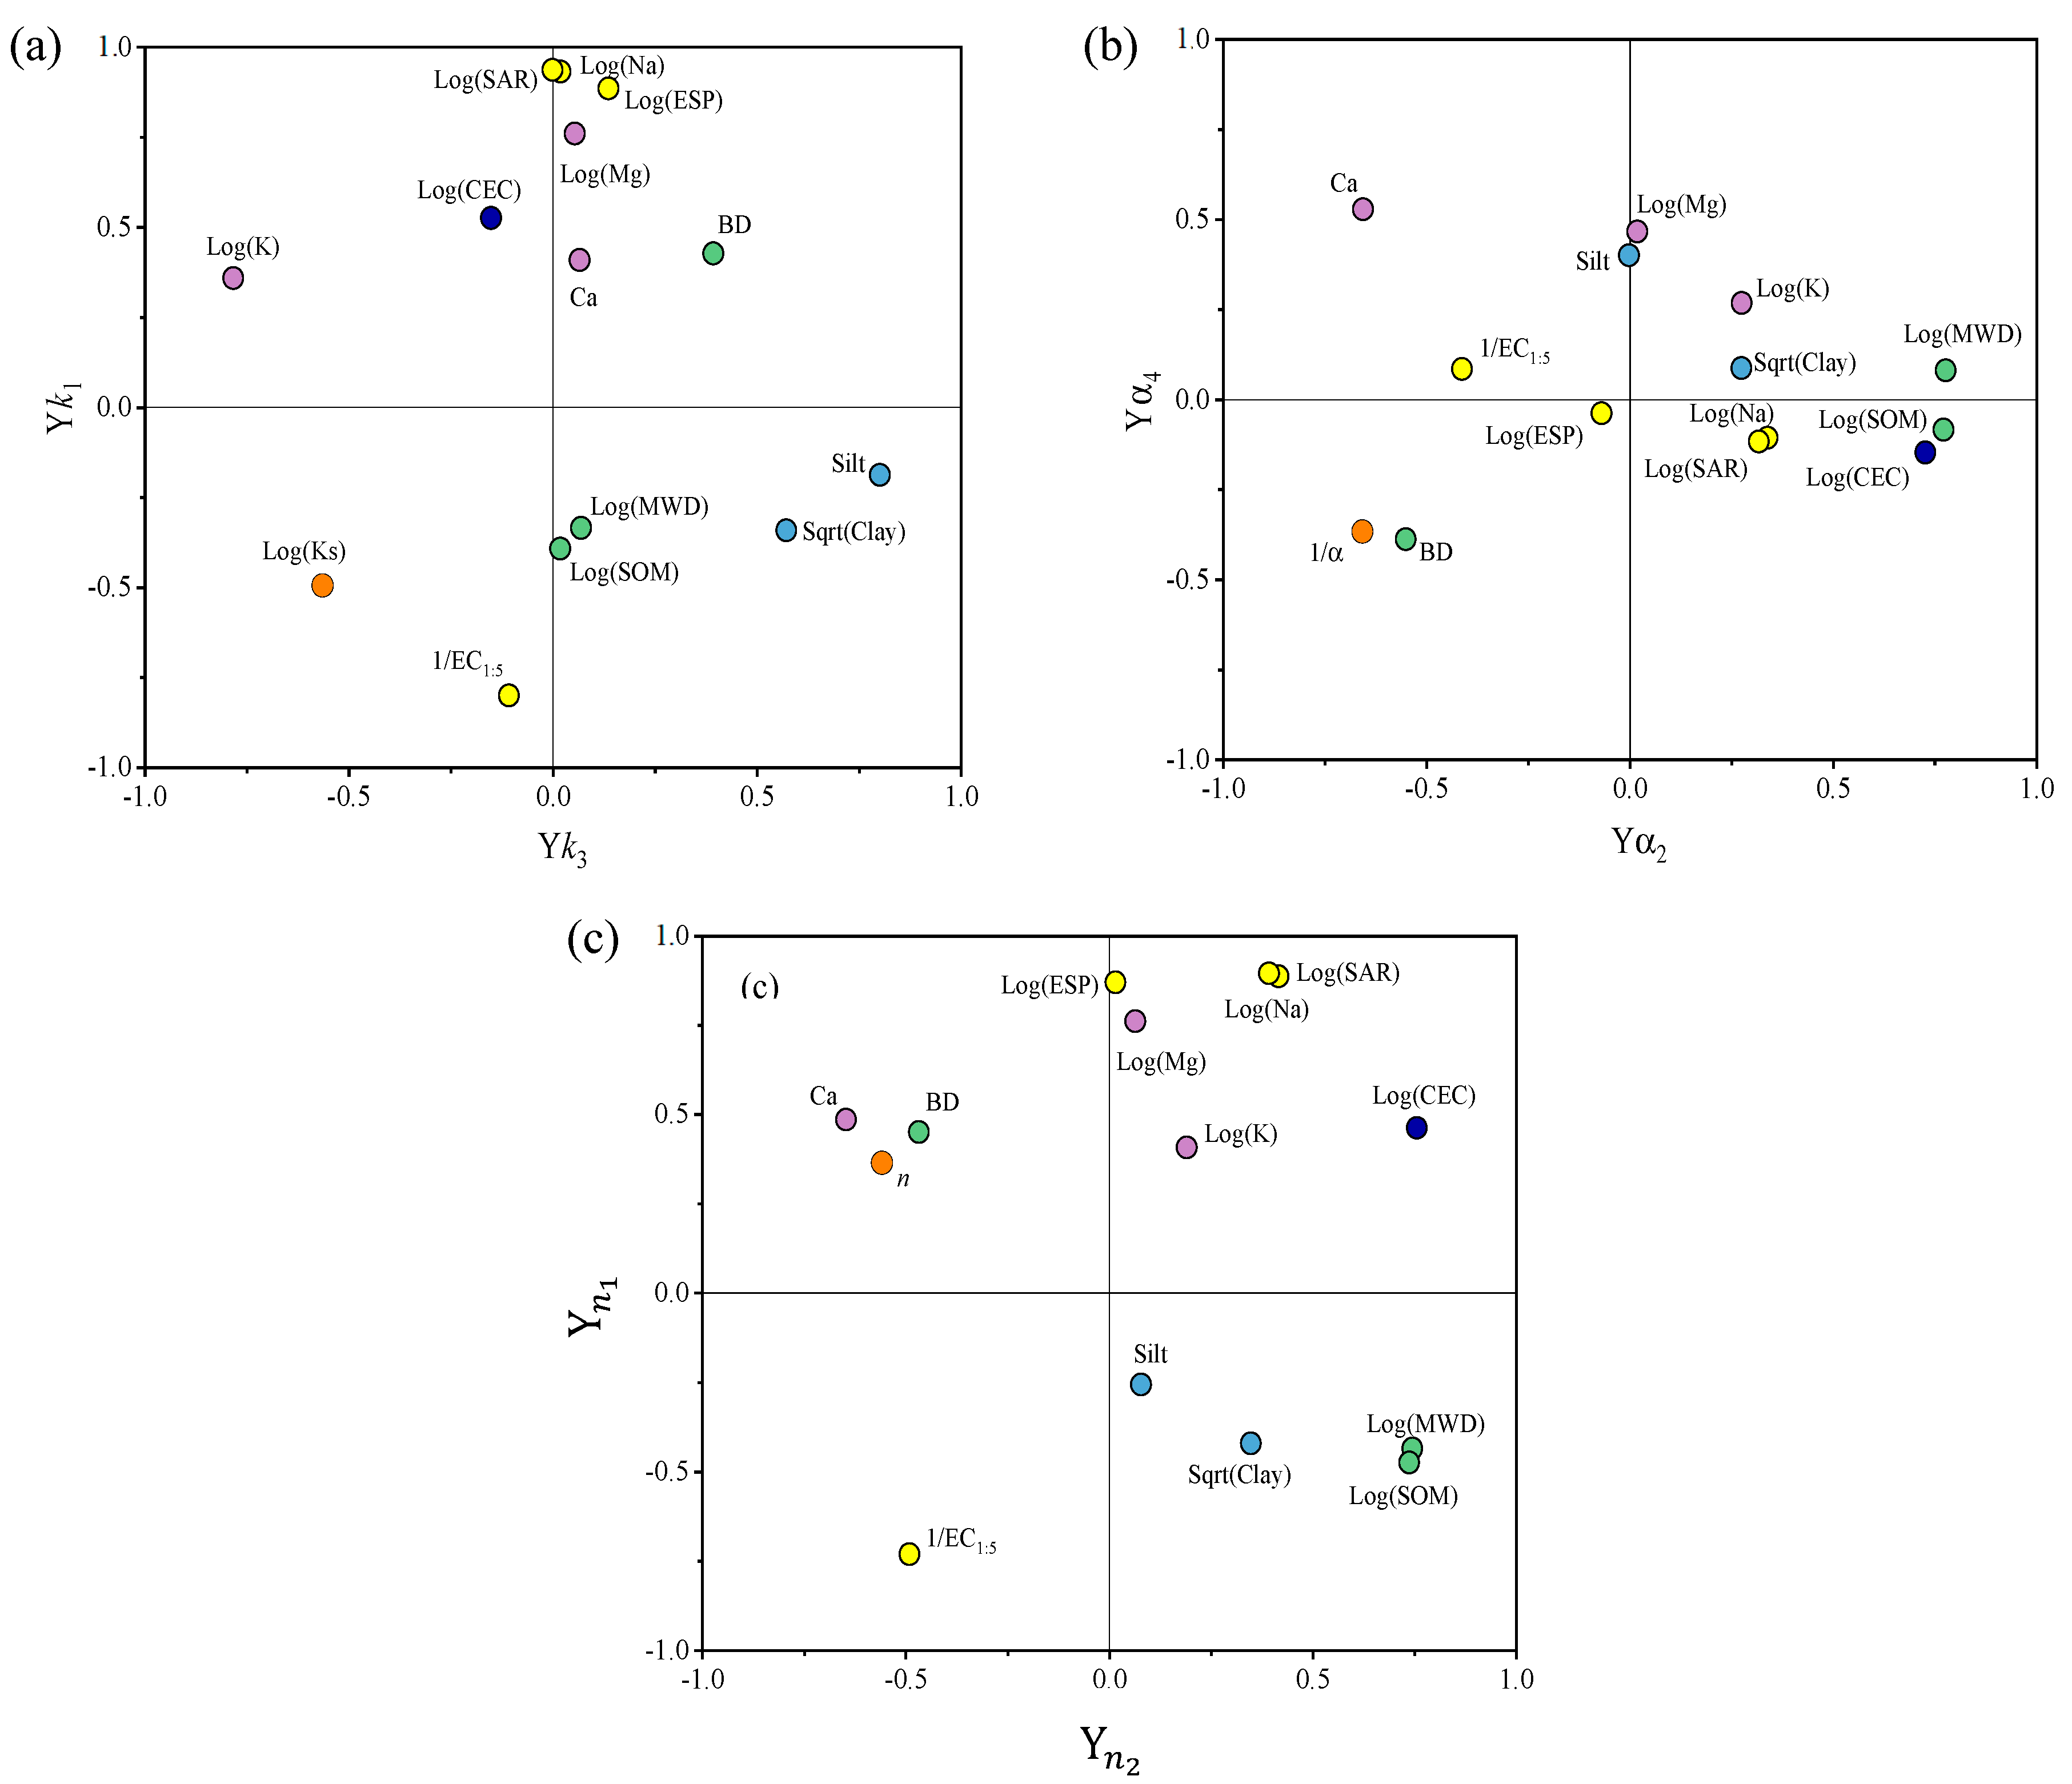
As shown in Figure 5a, two principal components were most relevant to soil Ks, α, and n. Soil CNa, CMg, ESP, SAR, and CEC were positively correlated with the PC1 of soil Ks and negatively associated with soil EC1:5. The silt content and clay content were positively correlated with the PC3 of soil Ks, while CK was negatively associated with the PC3. There was a significantly positive relationship between the PC2 for α and soil MWD, SOM, and CEC (Figure 5b). Soil BD and CCa were negatively correlated with the PC2, and the PC4 was positively correlated with CCa. The PC1 of n was positively correlated with CMg, CNa, ESP, and SAR and was negatively correlated with soil EC1:5 (Figure 5c). Similarly, the PC2 of n was positively correlated with soil MWD, SOM, and CEC and was negatively correlated with CCa.

3.3. PTFs of SHPs in the Reclamation Area

Multiple linear regression equations (forward stepwise regression) were obtained before and after PCA. The coefficients, standard errors, and corresponding t-values and p-values of the multiple regression models are given in Table 3, and Formulas (6)–(8) can be obtained:
log(Ks) = 2.567 + 2.351/EC1:5 + 0.453 × log(K) − 1.854 × BD − 0.412 × log(MWD)
1/α = −89.502 − 470.599 × log(MWD) − 335.691 × log(K)
n = 1.64 0.44   ×   log ( MWD ) 0.088   × Clay
Here, BD is the bulk density, K is the potassium content, MWD is the average weight diameter of the soil water stable aggregates, EC1:5 is the electrical conductivity, and Clay is the clay content.
In the multiple regression equations of soil Ks, BD, MWD, EC1:5, and CK were entered into the regression models (Table 3). The regression coefficient and t-value of soil EC1:5 were the largest, indicating that soil EC1:5 was a vital factor affecting soil Ks. In the multiple regression equation for 1/α, only MWD and CK were entered. The regression coefficient and the absolute t-value of soil MWD were the largest (Table 3), indicating that one of the important factors affecting 1/α was soil MWD. In the multiple regression equation for n, only MWD and clay were entered into the regression model. The regression coefficient of soil MWD and the absolute t-value were the largest, indicating that the MWD of soil aggregates was also a crucial influencing factor affecting n (Table 3).
The principal components affecting SHPs were extracted using PCA; then, the PTFs of SHPs were established based on these principal components. The coefficients, standard errors, corresponding t-values, and p-values of the multiple regression models are shown in Table 3, from which Formulas (9)–(11) can be obtained:
log ( K s ) = 0.524 0.177   ×   Y k 3 0.093   ×   Y k 1 + 0.135   ×   Y k 4 0.054   ×   Y k 2
1 / α = 477.244 91.732   ×   Y α 2 81.283   ×   Y α 4 + 38.106   ×   Y α 3
n = 1.679 0.086   ×   Y n 2 + 0.045   ×   Y n 1 0.042   ×   Y n 3
Here, Y k 1 , Y k 2 , Y k 3 , and Y k 4 are principal components corresponding to log(Ks); Y α 1 , Y α 2 , Y α 3 , and Y α 4 are principal components corresponding to 1/α; Y n 1 , Y n 2 , Y n 3 , and Y n 4 are principal components corresponding to n.
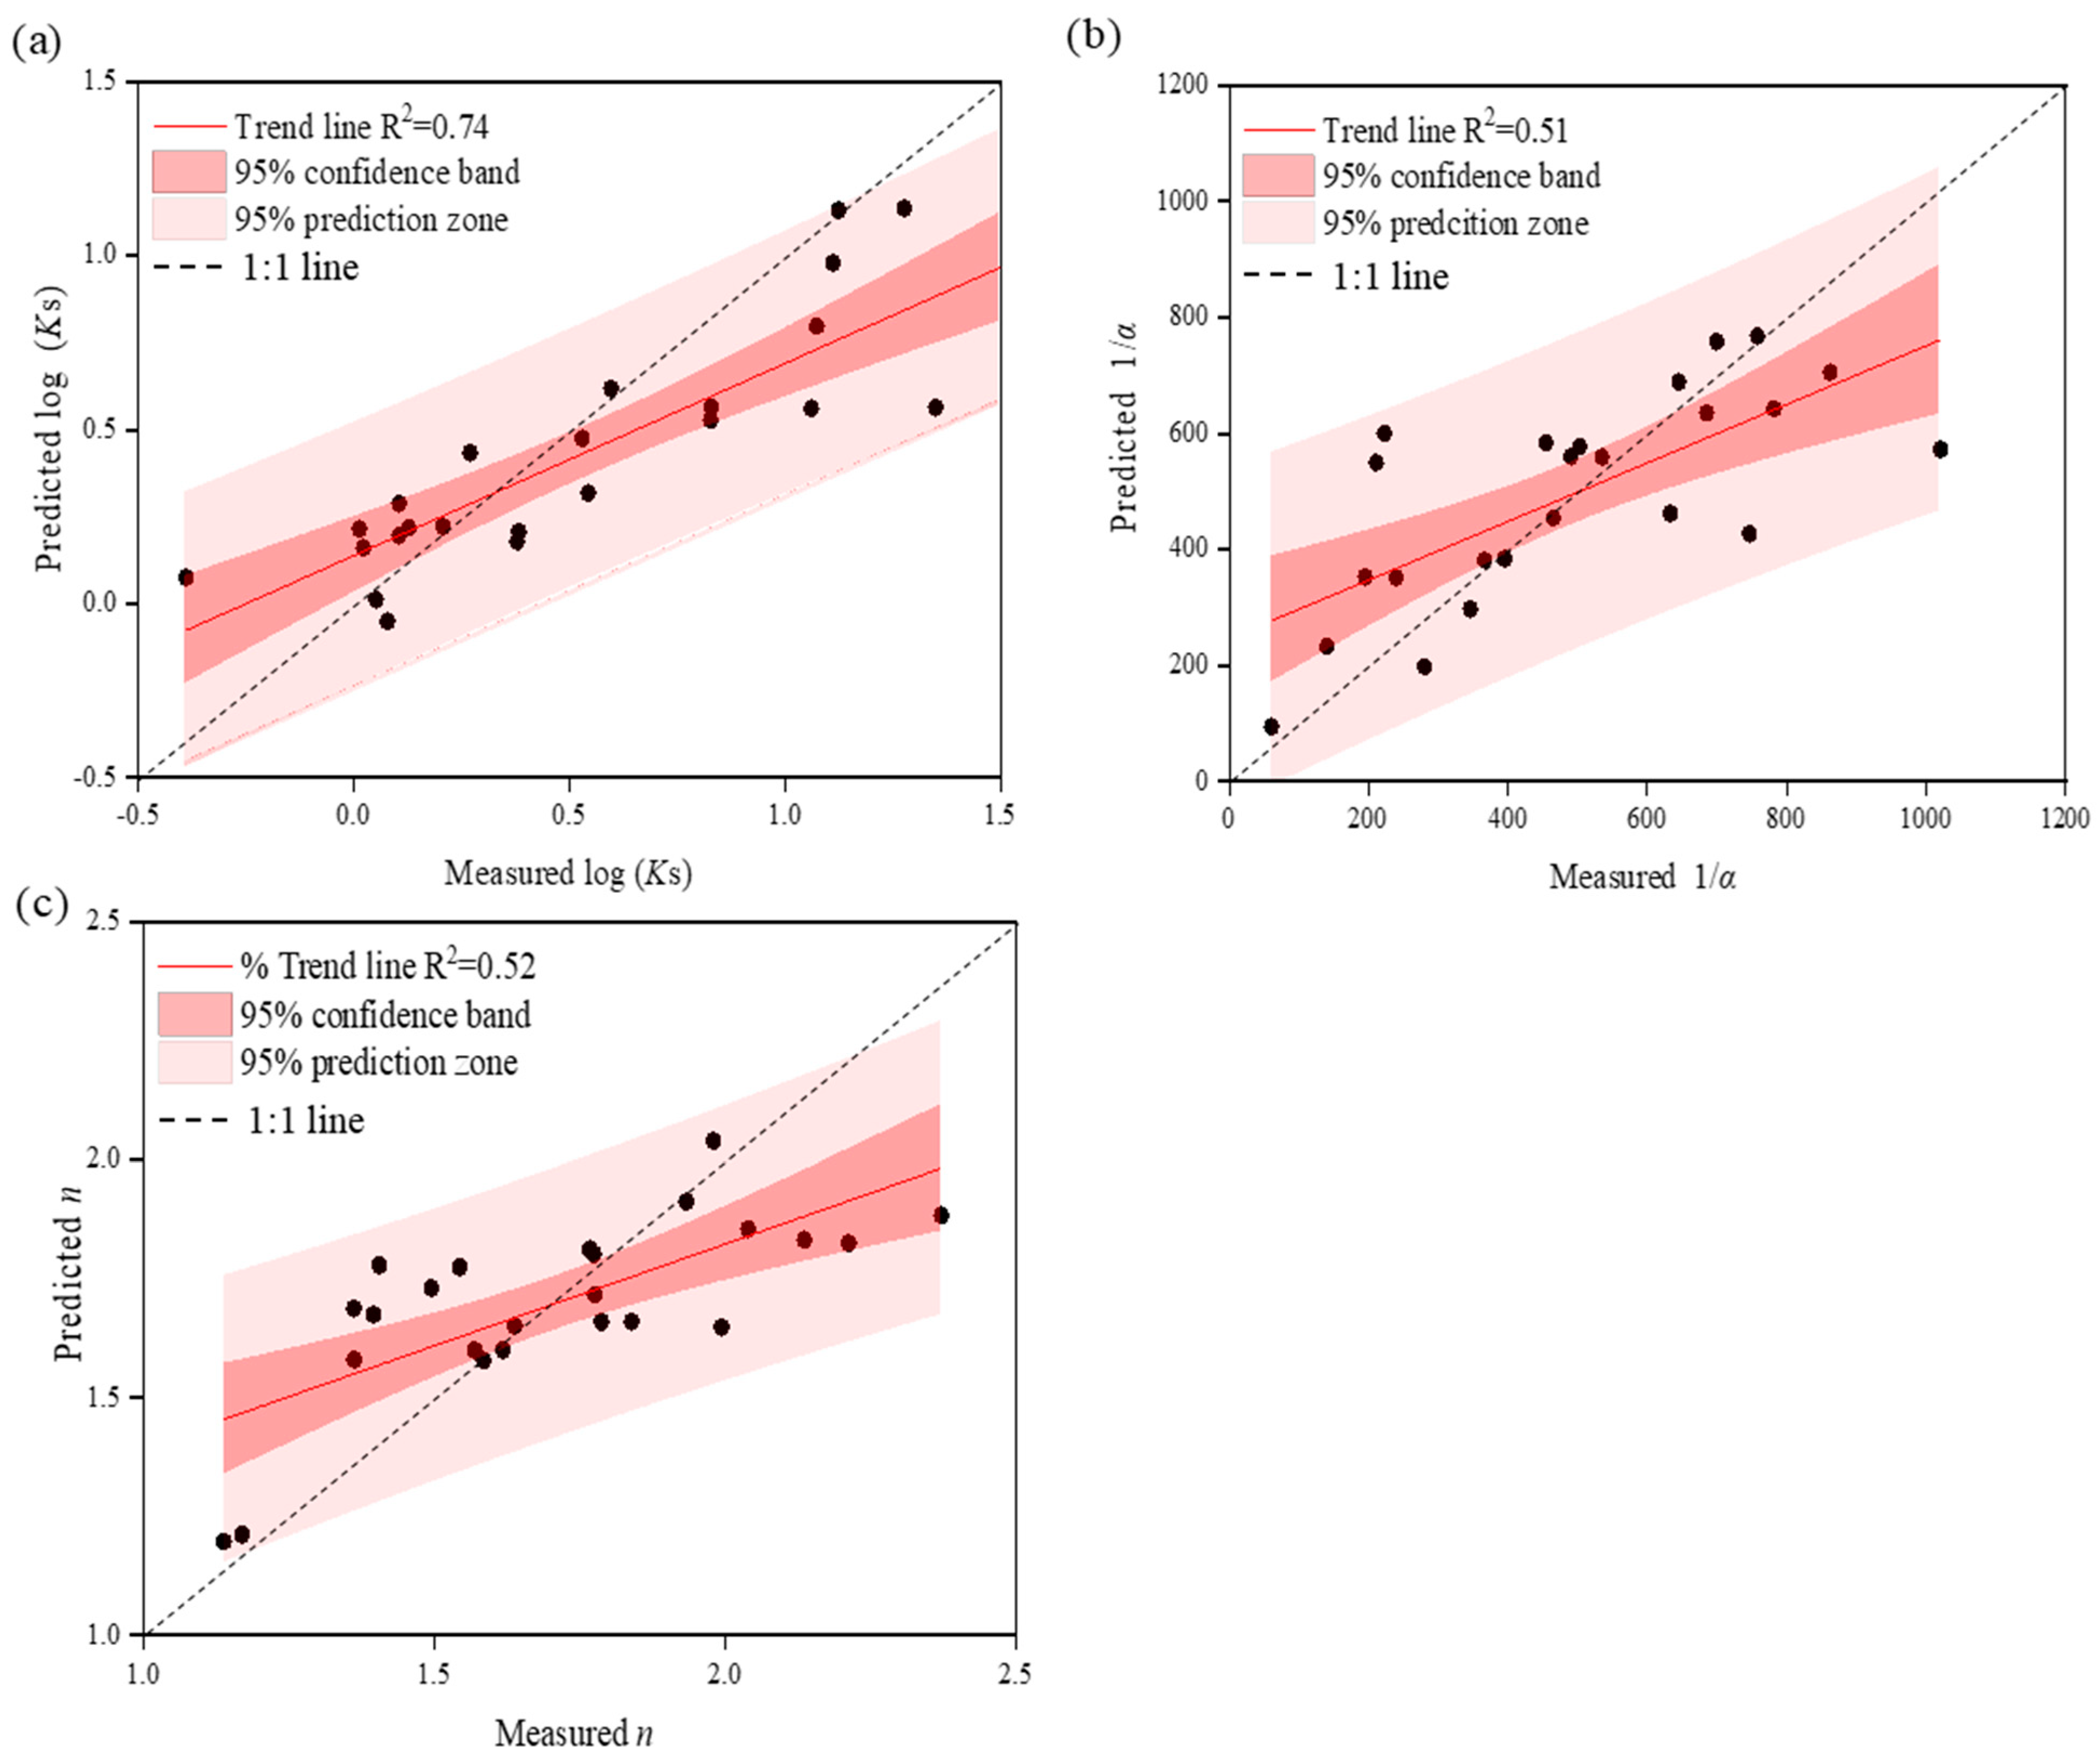
The evaluation indicators of the models are given in Table 4. The AIC and BIC values of the regression models for log(Ks), 1/α, and n after PCA were lower than those without PCA, and the corresponding Loglik values of the regression models after PCA were higher than those without PCA. This result indicated that the regression models for soil log(Ks), 1/α, and n with PCA were better than those without PCA. The mean relative errors of the prediction models for log(Ks), 1/α, and n were 79.3%, 36.1%, and 9.89%, respectively, and the root mean square errors of the models were 0.305, 173.83 and 0.221, respectively. In the scatter diagrams of the measured and predicted values, the determination coefficients were 0.74, 0.51, and 0.52, respectively. The PTFs constructed in our study exhibited a good prediction effect (Figure 6).

4. Discussion

4.1. Factors That Affect Soil Aggregate Stability and SHPs of Saline/Sodic Soils

In our study, the soil MWD in the reclamation years of 2007 and 1960 was significantly smaller than in the reclamation year of 1940; this might indicate that long-term reclamation has promoted a better soil aggregate structure (Table 1). Soil aggregation is a vital soil property due to its correlation with water infiltration and resistance to erosion [35]. The reclamation duration significantly affected the evolution of the soil physicochemical properties; this might have been because the construction of the seawall intercepted the seawater recharge, resulting in a reduction in the groundwater table and high soil salt through reclamation [36]. After years of reclamation, fertilization, and continuous cultivation, the total nitrogen, phosphorus, and SOM increased [36,37], and the soil salt content showed a decreasing trend [36,38]. The increasing SOM might help form soil macroaggregates [38]. An increase in reclamation duration had a significant impact on soil water content, soil salinity, pH, etc. At the same time, Na+ and Cl decreased, and Ca2+ and SO42− increased [39,40].
Our results showed that the content of large aggregates (>250 μm) in the wasteland was the lowest (Figure 2); this might have been due to soil management and the impacts of weather events and the soluble salt ions migrating and being retained on the surface. Accordingly, the soil pores of >2000 μm were the smallest (Table S3). During the reclamation processes, the land use conversion from natural coastal saline/sodic soils to agricultural land has changed the soil physicochemical properties, e.g., soil aggregate stability and SHPs. In this research, this evolution was studied in saline/sodic soils; such a study had rarely been reported before.
Our results showed that soil MWD was significantly associated with SOM (Table 2). According to the hierarchical theory, soil aggregate stabilization benefits from cementing agents, including multi-valent cations, clay minerals, SOM, and microbial biomass [41]. It has generally been acknowledged that Ca2+ is a vital cementing agent in neutral soils during the aggregation procedure [42]. However, the effect of these binders on the aggregate stabilization of saline/sodic soils remains unclear [43]. In our study, the relationship between Ca2+ and MWD was not significant (Table 2), and this might have been because the Ca2+ content was not high enough to be a cementing agent in the saline/sodic soils.

4.2. Effects of Soil Salinity and Alkalinization Characteristics on SHPs

In our study, soil Ks had negative correlations with CNa, SAR, EC1:5, and ESP (Table 2). This might have been because high soil salinity may hinder root interspersion and crop growth, leading to a reduction in soil infiltration. Our results were similar to the results of Yao et al. (2015) [22], who found that soil salinity, porosity, unavailable water, water retention, and organic matter influenced coastal saline/sodic soil Ks and that soil salinity had a negative impact on soil Ks in PTFs. Small soil pores (<30 μm) accounted for 27.49% in the reclamation of 2007, which was significantly higher than in the years 1960 and 1940 (18.77% and 23.17%, respectively; see Table S3). Klopp et al. (2021) predicted saline/sodic SHPs with various clay mineralogy and incorporated clay mineralogy and solution composition into PTFs [44]. The high variation in soil salinity might have been due to seawater intrusion, intense evaporation, and field cultivation practices, e.g., straw return, plowing, irrigation, and fertilization after reclamation [45,46].
Previous studies have found that the effects of soil saline–alkali conditions on SHPs are contradictory. Firstly, an increase in the ESP causes a degradation of the soil structure and decreases the soil Ks due to an increase in clay swelling [47]. Secondly, there is a critical threshold of salt cations that affect soil water-holding capacity. A study by Xing et al. (2017) [48] confirmed that soil water-holding capacity reduced with an increase in CNa at a high level while it increased with an increase in CNa at a low level. Furthermore, She et al. (2015) [49] showed that the impact of saline soil salt content on its hydraulic conductivity was not significant due to its poor soil structure. This was because the soil texture was dominant in the impact of soil salinity on its SHPs [49]. The influence of soil structure, soil texture, CEC, gypsum content, and calcium carbonate content was larger than that of soil salt on SHPs [50]. The roles of soil salinity/alkalinization characteristics on SHPs varied with the soil texture, soil porosity, pore connectivity, soil aggregate size, organic matter, kinds of ions, tillage, and irrigation water quality [44,51].

4.3. Incorporate Soil Structure into PTFs for SHPs

The PTFs established in our study showed that the soil aggregate ability (MWD) was a dominant factor that affected SHPs (Table 3). The traditional PTFs normally include the soil texture, BD, and SOM, which can better characterize the correlation between readily available soil properties and SHPs [52]. To improve the accuracy of PTFs, many researchers have introduced factors such as soil salinity [44], wilting water content, field capacity [53], and terrain attributes [20] into the PTFs based on the characteristics of each research area. Lebron et al. (1999) [18] used soil pore morphology parameters, such as the surface area, perimeter, roughness, roundness, and maximum diameter, to establish a PTF that effectively predicted the Ks of silty loam. Bonetti et al. (2021) incorporated soil structure corrections into PTFs while the soil structure was replaced by remote sensing vegetation metrics and the local soil texture [23]. Soil pore morphology has a non-negligible impact on SHPs; however, it was constrained by parameter acquisition. Non-destructive technologies, such as computed tomography and nuclear magnetic resonance, have provided reliable technical methods for the rapid acquisition of the soil pore structure [54,55]; however, it is too expensive to collect sufficient soil samples and then incorporated them into PTFs for SHPs. To date, few studies have incorporated the soil aggregate structure into PTFs; this might have been due to the high heterogeneity of the soil aggregate structure. In this study, we tried to integrate MWD into PTFs, although the equations were somewhat complicated, and confirmed that the soil aggregate structure significantly affected SHPs. In addition, soil saline–alkali characteristics were incorporated into our PTFs. Some researchers have confirmed that the SHPs of saline/sodic soils have been influenced by soil texture, soil structure, saline–alkali characteristics, and other factors [22,53]. Gamie and De Smedt (2018) [53] found that soil structure, soil texture, and the sodium adsorption ratio influenced saline soil Ks and that soil structure was more notable than soil texture with regard to the forecasting of soil Ks.
New methods developed in recent years, such as the nearest-neighbor method, artificial neural network, support vector machine, and multi-level Bayesian neural network, have been widely applied in PTFs. For example, Bayat et al. (2011) used fractal models to obtain fractal parameters of soil particle or aggregate size distributions and estimated soil SWCC parameters using multi-objective group data processing methods and neural network methods [56]. Soil Ks and SWRC are highly variable; thus, it is difficult to explain their influencing factors. In this study, we used PCA to reduce the data dimensions and to simplify many complex explanatory variables into several easier ones. Similarly, Duffera et al. (2007) [57] used PCA and determined the relationship between soil Ks and soil porosity. Rogiers et al. (2012) [58] predicted soil Ks using particle size distribution based on PCA. We found that the prediction of SHPs based on PCA was a useful method due to the complex influencing factors of SHPs.
The construction of PTFs requires a large number of measured soil characteristic databases to support it. Compared with mature soil characteristic databases in Europe and America, as well as relatively abundant research results on other soil types in China, coastal reclamation areas still lack such research. In coastal agricultural areas, high soil salinity and poor soil structure have greatly affected SHPs. Therefore, adding soil aggregation structure and saline–alkali characteristics will help improve the prediction accuracy of the model, especially for high-sodium saline soils with strong spatial and temporal variability in soil structure. Our PTFs can be applied to forecast the alteration of SHPs with the evolution of soil aggregate stability and the saline/sodic properties induced by reclamation years and land use types. However, further research will be needed to obtain sufficient soil samples to certify whether the PTFs established in this study will be also valuable over scales and times and different scales in various land use patterns and management systems.

5. Conclusions

To evaluate the quantitative influences of soil saline/sodic characteristics and the aggregate structure on SHPs, we collected 90 soil samples of different reclamation durations and land uses. Our results showed that the soil aggregate stability was enhanced and that the soil macroaggregate (>250 μm) contents increased with an increase in the reclamation year. In the reclamation year of 2007, the content of large aggregates of surface soils in the wasteland was the lowest among all the land use types. The reclamation duration and land use have significantly affected the distribution of the soil aggregate structure. The soil Ks of forestland was larger than the soil Ks of grassland in each reclamation year. The soil structure contributed to 22.13%, 24.52%, and 23.93% of the total variations in Ks, α, and n. Our PTFs predicted that soil Ks, α, and n included four principal components as surrogate properties, which could account for ~80% of the total variation in soil Ks, α, and n. These functions predicted Ks, α, and n with a lower mean square error compared to the PTFs without PCA. The PTFs established in our study were as follows: log(Ks) = 0.524 − 0.177 × Y k 3 − 0.093 × Y k 1 + 0.135 × Y k 4 − 0.054 × Y k 2 , 1/α = 477.244 − 91.732 × Y α 2 − 81.283 × Y α 4 + 38.106 × Y α 3 , and n = 1.679 − 0.086 × Y n 2 + 0.045 × Y n 1 − 0.042 × Y n 3 . Our PTFs can be applied to forecast the alteration of SHPs if the soil aggregate stability and saline/sodic properties are changed by land use and the reclamation duration.

Supplementary Materials

The following supporting information can be downloaded at: https://www.mdpi.com/article/10.3390/agronomy14122877/s1, Figure S1: Classification of saline, high-pH, saline/sodic, and sodic soils; Table S1: Analysis of variance of reclamation duration, land use types, and their interaction on water stable aggregates of saline/sodic soils (F-value); Table S2: Soil physical and chemical properties for different reclamation years; Table S3: Effects of reclamation duration and land use types on soil equivalent pore distribution of saline/sodic soils.

Author Contributions

Conceptualization, Y.F. and D.S.; methodology, Y.F. and D.S.; software, Y.F. and S.T.; validation, S.T. and H.W.; formal analysis, Y.F.; investigation, S.T. and X.H.; resources, D.S.; data curation, H.W.; X.S.; and X. H.; writing—original draft preparation, Y.F.; writing—review and editing, Y.F.; D.S.; S.T.; H.W.; X.S.; X.H., and D.L.; visualization, Y.F. and D.L.; supervision, D.S.; project administration, Y.F. and D.S.; funding acquisition, Y.F. and D.S. All authors have read and agreed to the published version of the manuscript.

Funding

This study was financially supported by the National Natural Science Foundation of China (42177393, 42407430), the China Postdoctoral Science Foundation (2022M721290), the Natural Science Foundation of Hubei Province (2022CFB828), Research Projects on Natural Resources in Jiangsu Province (2024003), and self-determined research funds of CCNU from the colleges’ basic research and operation of MOE (CCNU22JC013).

Data Availability Statement

The raw data supporting the conclusions of this article will be made available by the authors on request.

Conflicts of Interest

The authors have no conflicts of interest to declare.

References

  1. Xie, T. Study on Salt Characteristics and Changes of Soil Profile in Coastal Beach with Different Reclamation Years-A Case Study of Rudong County, Jiangsu Province; Nanjing University: Nanjing, China, 2013. (In Chinese) [Google Scholar]
  2. Wang, G.; Xu, C.; Huang, R.; Han, X.; Zhao, J.; She, D. Research on driving forces of reclamation dynamics and land use change in coastal areas of Jiangsu Province. J. Hohai Univ. 2020, 48, 163–170. (In Chinese) [Google Scholar]
  3. Xie, X.; Pu, L.; Wang, Q.; Zhu, M.; Xu, Y.; Zhang, M. Response of soil physicochemical properties and enzyme activities to long-term reclamation of coastal saline soil, Eastern China. Sci. Total Environ. 2017, 607–608, 1419–1427. [Google Scholar] [CrossRef]
  4. Yao, R.; Yang, J.; Zhao, X.; Chen, X.; Han, J.; Li, X.; Liu, M.; Shao, H. A new soil sampling design in coastal saline region using EM38 and VQT method. Clean Soil Air Water 2012, 40, 972–979. [Google Scholar] [CrossRef]
  5. Fei, Y.; She, D.; Yi, J.; Sun, X.; Han, X.; Liu, D.; Liu, M.; Zhang, H. Roles of soil amendments in the water and salt transport of coastal saline soils through regulation of microstructure. Land Degrad. Dev. 2024, 35, 2382–2394. [Google Scholar] [CrossRef]
  6. Ghosh, B.N.; Meena, V.S.; Singh, R.J.; Alam, N.M.; Patra, S.; Bhattacharyya, R.; Sharma, N.K.; Dadhwal, K.S.; Mishra, P.K. Effects of fertilization on soil aggregation, carbon distribution and carbon management index of maize-wheat rotation in the north-western Indian Himalayas. Ecol. Indic. 2019, 105, 415–424. [Google Scholar] [CrossRef]
  7. Halder, M.; Islam, M.U.; Liu, S.; Guo, Z.; Zhang, Z.; Peng, X. Organic materials quality to control soil aggregation: A meta-analysis. J. Soil Sci. Plant Nutr. 2024, 24, 1857–1870. [Google Scholar] [CrossRef]
  8. Kasper, M.; Buchan, G.D.; Mentler, A.; Blum, W.E.H. Influence of soil tillage systems on aggregate stability and the distribution of C and N in different aggregate fractions. Soil Tillage Res. 2009, 105, 192–199. [Google Scholar] [CrossRef]
  9. Spohn, M.; Giani, L. Impacts of land use change on soil aggregation and aggregate stabilizing compounds as dependent on time. Soil Biol. Biochem. 2011, 43, 1081–1088. [Google Scholar] [CrossRef]
  10. Mohammed, A.K.; Hirmas, D.R.; Nemes, A.; Giménez, D. Exogenous and endogenous controls on the development of soil structure. Geoderma 2020, 357, 113945. [Google Scholar] [CrossRef]
  11. Vereecken, H.; Diels, J.; Van orshoven, J.; Feyen, J.; Bouma, J. Functional evaluation of pedotransfer functions for the estimation of soil hydraulic properties. Astron. Astrophysical 1992, 446, 747–771. [Google Scholar] [CrossRef]
  12. Zhang, J.; Chen, H.; Fu, Z.; Wang, K. Effects of vegetation restoration on soil properties along an elevation gradient in the karst region of southwest China. Agric. Ecosyst. Environ. 2021, 320, 107572. [Google Scholar] [CrossRef]
  13. van Genuchten, M.T.; Leij, F.J. Indirect methods for estimating the hydraulic properties of unsaturated soils. Soil Sci. 1992, 157, 615–627. [Google Scholar]
  14. Schaap, M.G.; Leij, F.J.; van Genuchten, M.T. Rosetta: A computer program for estimating soil hydraulic parameters with hierarchical pedotransfer functions. J. Hydrol. 2001, 251, 163–176. [Google Scholar] [CrossRef]
  15. Wösten, J.H.M.; Pachepsky, Y.A.; Rawls, W.J. Pedotransfer functions: Bridging the gap between available basic soil data and missing soil hydraulic characteristics. J. Hydrol. 2001, 251, 123–150. [Google Scholar] [CrossRef]
  16. Vereecken, H.; Weynants, M.; Javaux, M.; Pachepsky, Y.; Schaap, M.G.; van Genuchten, M.T. Using pedotransfer functions to estimate the van Genuchten-Mualem soil hydraulic properties: A review. Vadose Zone J. 2010, 9, 795–820. [Google Scholar] [CrossRef]
  17. Looy, V.K.; Bouma, J.; Herbst, M.; Koestel, J.; Minasny, B.; Mishra, U.; Montzka, C.; Nemes, A.; Pachepsky, Y.; Padarian, J.; et al. Pedotransfer functions in Earth system science: Challenges and perspectives. Rev. Geophys. 2017, 55, 1199–1256. [Google Scholar] [CrossRef]
  18. Lebron, I.; Schaap, M.G.; Suarez, D.L. Saturated hydraulic conductivity prediction from microscopic pore geometry measurements and neural network analysis. Water Resour. Res. 1999, 35, 3149–3158. [Google Scholar] [CrossRef]
  19. Arrington, K.E.; Ventura, S.J.; Norman, J.M. Predicting saturated hydraulic conductivity for estimating maximum soil infiltration rates. Soil Sci. Soc. Am. J. 2013, 77, 748–758. [Google Scholar] [CrossRef]
  20. Szabó, B.; Szatmári, G.; Takács, K.; Laborczi, A.; Makó, A.; Rajkai, K.; Pásztor, L. Mapping soil hydraulic properties using random-forest-based pedotransfer functions and geostatistics. Hydrol. Earth Syst. Sci. 2019, 23, 2615–2635. [Google Scholar] [CrossRef]
  21. Cao, T.; She, D.; Zhang, X.; Yang, Z.; Wang, G. Pedotransfer functions developed for calculating soil saturated hydraulic conductivity in check dams on the Loess Plateau in China. Vadose Zone J. 2022, 21, e20217. [Google Scholar] [CrossRef]
  22. Yao, R.; Yang, J.; Wu, D.; Li, F.; Gao, P.; Wang, X. Evaluation of pedotransfer functions for estimating saturated hydraulic conductivity in coastal salt-affected mud farmland. J. Soils Sediments 2015, 15, 902–916. [Google Scholar] [CrossRef]
  23. Bonetti, S.; Wei, Z.; Or, D. A framework for quantifying hydrologic effects of soil structure across scales. Commun. Earth Environ. 2021, 2, 107. [Google Scholar] [CrossRef]
  24. Fatichi, S.; Or, D.; Walko, R.; Vereecken, H.; Young, M.H.; Ghezzehei, T.A.; Hengl, T.; Kollet, S.; Agam, N.; Avissar, R. Soil structure is an important omission in earth system models. Nat. Commun. 2020, 11, 522. [Google Scholar] [CrossRef] [PubMed]
  25. Pires, L.F.; Roque, W.L.; Rosa, J.A.; Mooney, S.J. 3D analysis of the soil porous architecture under long term contrasting management systems by X-ray computed tomography. Soil Tillage Res. 2019, 191, 197–206. [Google Scholar] [CrossRef]
  26. Kutílek, M. Soil hydraulic properties as related to soil structure. Soil Till. Res. 2004, 79, 175–184. [Google Scholar] [CrossRef]
  27. IUSS Working Group WRB. World Reference Base for Soil Resources. In International Soil Classification System for Naming Soils and Creating Legends for Soil Maps, 4th ed.; International Union of Soil Sciences (IUSS): Vienna, Austria, 2022. [Google Scholar]
  28. Bao, S.D. Soil Analysis in Agricultural Chemistry; Agricultural Press: Beijing, China, 2005. (In Chinese) [Google Scholar]
  29. Elliott, E.T. Aggregate structure and carbon, nitrogen, and phosphorus in native and cultivated soils. Soil Sci. Soc. Am. J. 1986, 50, 627–633. [Google Scholar] [CrossRef]
  30. Wang, Y.; Zhang, J.; Zhang, Z. Influences of intensive tillage on water-stable aggregate distribution on a steep hillslope. Soil Till. Res. 2015, 151, 82–92. [Google Scholar] [CrossRef]
  31. van Genuchten, M.T. A closed-form equation for predicting the hydraulic conductivity of unsaturated soils. Soil Sci. Soc. Am. J. 1980, 44, 892–898. [Google Scholar] [CrossRef]
  32. van Genuchten, M.T.; Leij, F.J.; Yates, S.R. The RETC Code for Quantifying the Hydraulic Functions of Unsaturated Soils; Version 1.0. EPA Report 600/2-91/065; U.S. Salinity Laboratory, USDA, ARS: Riverside, CA, USA, 1991.
  33. Akaike, H. Information Theory and an Extension of the Maximum Likelihood Principle. 2nd International Symposium. Information Theory; Akademia Kiado: Budapest, Hungary, 1973; pp. 267–281. [Google Scholar]
  34. Davis, J.G.; Woscom, R.M.; Boulder, T.A.; Cardam, G.E. Managing Sodic Soils. Extension Document No 0.504; Colorado State University Extension: Fort Collins, CO, USA, 2007. [Google Scholar]
  35. Franzluebbers, A.J. Soil mean-weight diameter and stability index under contrasting tillage systems for cotton production in North Carolina. Soil Sci. Soc. Am. J. 2022, 86, 1327–1337. [Google Scholar] [CrossRef]
  36. Liu, C.; Xu, J.; Ding, N.; Fu, Q.; Guo, B.; Lin, Y.; Li, H.; Li, N. The effect of long-term reclamation on enzyme activities and microbial community structure of saline soil at Shangyu, China. Environ. Earth Sci. 2013, 69, 151–159. [Google Scholar] [CrossRef]
  37. Xie, X.; Pu, L.; Zhu, M.; Wu, T.; Xu, Y.; Wang, X. Effect of long-term reclamation on soil quality in agricultural reclaimed coastal saline soil, Eastern China. J. Soils Sediments 2020, 20, 3909–3920. [Google Scholar] [CrossRef]
  38. Fei, Y.; She, D.; Yao, Z.; Li, L.; Ding, J.; Hu, W. Hierarchical Bayesian models for predicting soil salinity and sodicity characteristics in a coastal reclamation region. Ecol. Eng. 2017, 104, 45–56. [Google Scholar] [CrossRef]
  39. Li, J.; Yang, W.; Li, Q.; Pu, L.; Xu, Y.; Zhang, Z.; Liu, L. Effect of reclamation on soil organic carbon pools in coastal areas of eastern China. Front. Earth Sci. 2018, 12, 339–348. [Google Scholar] [CrossRef]
  40. Yin, A.; Zhang, M.; Gao, C.; Yang, X.; Xu, Y.; Wu, P.; Zhang, H. Salinity evolution of coastal soils following reclamation and intensive usage, Eastern China. Environ. Earth Sci. 2016, 75, 1281. [Google Scholar] [CrossRef]
  41. Tisdall, J.M.; Oades, J.M. Organic matter and water-stable aggregates in soils. Eur. J. Soil Sci. 1982, 33, 141–163. [Google Scholar] [CrossRef]
  42. Erktan, A.; Balmot, J.; Merino-Martín, L.; Monnier, Y.; Pailler, F.; Coq, S.; Abiven, S.; Stokes, A.; Le Bissonnais, Y. Immediate and long-term effect of tannins on the stabilization of soil aggregates. Soil Biol. Biochem. 2017, 105, 197–205. [Google Scholar] [CrossRef]
  43. Feng, H.; Wang, S.; Gao, Z.; Pan, H.; Zhuge, Y.; Ren, X.; Hu, S.; Li, C. Aggregate stability and organic carbon stock under different land uses integrally regulated by binding agents and chemical properties in saline-sodic soils. Land Degrad. Dev. 2021, 32, 4151–4161. [Google Scholar] [CrossRef]
  44. Klopp, H.W.; Arriaga, F.A.; Daigh, A.L.M.; Bleam, W.F. Development of functions to predict soil hydraulic properties that account for solution sodicity and salinity. Catena 2021, 204, 105389. [Google Scholar] [CrossRef]
  45. She, D.; Fei, Y.; Chen, Q.; Timm, L.C. Spatial scaling of soil salinity indices along a temporal coastal reclamation area transect in China using wavelet analysis. Arch. Agron. Soil Sci. 2016, 62, 1625–1639. [Google Scholar] [CrossRef]
  46. Xie, X.; Pu, L.; Shen, H.; Wang, X.; Zhu, M.; Ge, Y.; Sun, L. Effects of soil reclamation on the oat cultivation in the newly reclaimed coastal land, eastern China. Ecol. Eng. 2019, 129, 115–122. [Google Scholar] [CrossRef]
  47. Ben-Hur, M.; Yolcu, G.; Uysal, H.; Lado, M.; Paz, A. Soil structure changes: Aggregate size and soil texture effects on hydraulic conductivity under different saline and sodic conditions. Aust. J. Soil Res. 2009, 47, 688–696. [Google Scholar] [CrossRef]
  48. Xing, X.; Kang, D.; Ma, X. Differences in loam water retention and shrinkage behavior: Effects of various types and concentrations of salt ions. Soil Till. Res. 2017, 167, 61–72. [Google Scholar] [CrossRef]
  49. She, D.; Gao, X.; Wang, P.; Xu, W.; Liu, Y.; Liu, Y. Comparison of soil hydraulic properties with different levels of soil salinity and sodicity. Arab. J. Geosci. 2015, 8, 5351–5360. [Google Scholar] [CrossRef]
  50. Rezaei, M.; Shahbazi, K.; Shahidi, R.; Davatgar, N.; Bazargan, K.; Rezaei, H.; Saadat, S.; Seuntjens, P.; Cornelis, W. How to relevantly characterize hydraulic properties of saline and sodic soils for water and solute transport simulations. J. Hydrol. 2021, 598, 125777. [Google Scholar] [CrossRef]
  51. Zhang, Y.; Yang, J.; Yao, R.; Wang, X.; Xie, W. Short-term effects of biochar and gypsum on soil hydraulic properties and sodicity in a saline-alkali soil. Pedosphere 2020, 30, 694–702. [Google Scholar] [CrossRef]
  52. Bouma, J.; Lanen, H.V. Transfer functions and threshold values: From soil characteristics to land qualities. In Quantified land evaluation. In Proceedings of the International Workshop on Quantified Land Evaluation Procedures, Washington, DC, USA, 27 April–2 May 1986; pp. 106–110. [Google Scholar]
  53. Gamie, R.; De Smedt, F. Experimental and statistical study of saturated hydraulic conductivity and relations with other soil properties of a desert soil. Eur. J. Soil Sci. 2018, 69, 256–264. [Google Scholar] [CrossRef]
  54. Flarmery, B.P.; Deckman, H.W.; Roberge, W.G.; D’Amico, K.L. Three-dimensional microtomography. Science 1987, 237, 1439–1444. [Google Scholar] [CrossRef]
  55. Spanne, P.; Thovert, J.F.; Jacquin, C.J.; Lindquist, W.B.; Jonea, K.W.; Adler, P.M. Synchrotron computed microtomography of porous media. Phys. Rev. Lett. 1994, 73, 2001–2004. [Google Scholar] [CrossRef]
  56. Bayat, H.; Neyshabouri, M.R.; Mohammadi, K.; Nariman-Zadeh, N. Estimating water retention with Pedotransfer functions using multi-Objective group method of data handling and ANNs. Pedosphere 2011, 21, 107–114. [Google Scholar] [CrossRef]
  57. Duffera, M.; White, J.G.; Weisz, R. Spatial variability of Southeastern U.S. Coastal plain soil physical properties: Implications for site-specific management. Geoderma 2007, 137, 327–339. [Google Scholar] [CrossRef]
  58. Rogiers, B.; Mallants, D.; Batelaan, O.; Gedeon, M.; Huysmans, M.; Dassargues, A. Estimation of hydraulic conductivity and its uncertainty from grain-size data using GLUE and Artificial neural networks. Math. Geosci. 2012, 44, 739–763. [Google Scholar] [CrossRef]
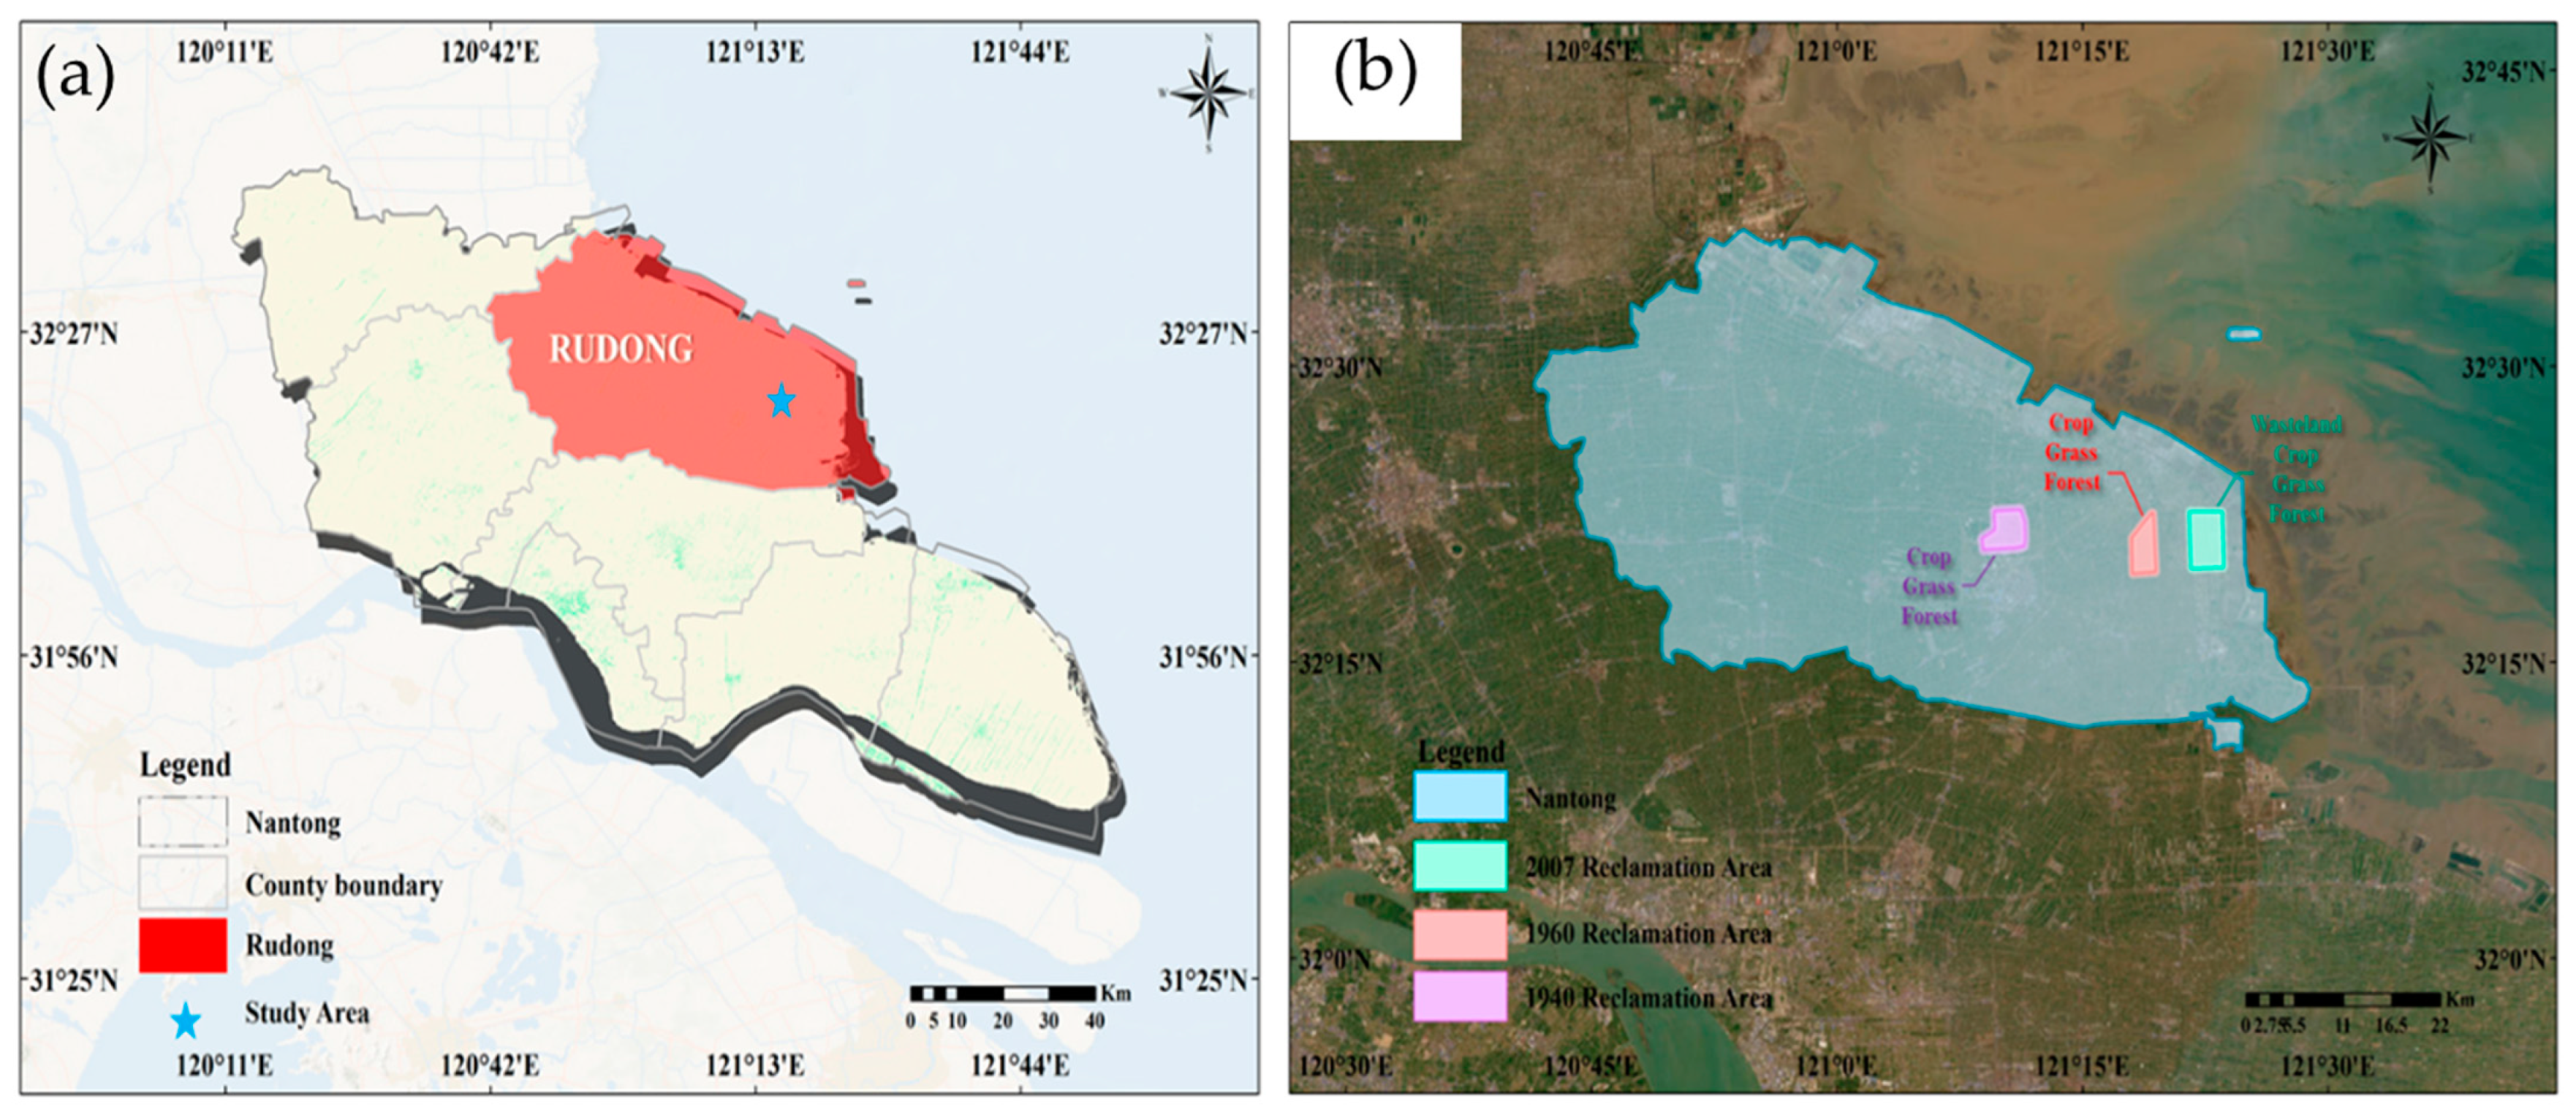
Figure 1. Geographical location of (a) study area in Rudong County, Nantong City of China; (b) soil sampling points in three reclamation areas.
Agronomy 14 02877 g001
Figure 2. Distribution of soil water stable aggregate content at (a) 0–20 cm, (b) 20–40 cm, and (c) 40–60 cm. The cropland within the reclamation area in 2007 was wheat land. In 1960, the cropland within the reclamation area was broad bean land, and in 1940, it was wheat land. Different lowercase letters indicate that there was a significant difference between different reclamation durations under the same land use type (p < 0.05); different capital letters indicate that there was a significant difference between different land use types under the same reclamation duration (p < 0.05).
Agronomy 14 02877 g002
Figure 3. Eigenvalues and the variance contribution rate of soil Ks, a, and n based on principal component analysis. PC1: the first principal component; PC2: the second principal component; PC3: the third principal component; PC4: the fourth principal component.
Agronomy 14 02877 g003
Figure 4. Factor load matrix of (a) soil Ks, (b) 1/α, and (c) n and principal component load matrix of (d) soil Ks, (e) 1/α, and (f) n. Note: Ks, saturated hydraulic conductivity; BD, bulk density; MWD, average weight diameter of soil water stable aggregates; CEC, cation exchange capacity; SOM, soil organic matter; ESP, exchangeable sodium percentage; SAR, sodium adsorption ratio, saturated moisture content; α and n, van Genuchten–Mualem parameters.
Agronomy 14 02877 g004
Figure 5. Correlations of the soil variables with the two main principal components of (a) Ks, (b) α, and (c) n after varimax rotation. Note: Orange points, soil hydraulic properties; yellow points, soil saline–alkali properties; light blue points, soil texture; dark blue points, soil nutrients; green points, soil structure; purple points, soil ions; Ks, saturated hydraulic conductivity; BD, bulk density; MWD, average weight diameter of soil water stable aggregates; CEC, cation exchange capacity; SOM, soil organic matter; ESP, exchangeable sodium percentage; SAR, sodium adsorption ratio, saturated moisture content; α and n, van Genuchten–Mualem parameters.
Agronomy 14 02877 g005
Figure 6. Measured and predicted values of soil hydraulic properties: (a) Ks, (b) 1/α, and (c) n.
Agronomy 14 02877 g006
Table 1. Soil physical and chemical properties for different reclamation years.
Soil PropertiesYear 2007 (N = 36)Year 1960 (N = 27)Year 1940 (N = 27)
Ks (cm/h)2.90 ± 1.91 a1.20 ± 0.85 b1.58 ± 2.83 b
BD (g/cm3)1.37 ± 0.10 a1.40 ± 0.09 a1.39 ± 0.12 a
MWD (mm)0.23 ± 0.10 a0.31 ±0.26 a0.60 ± 0.54 b
CCa (g/kg)1.19 ± 0.21 a1.33 ± 0.28 a0.95 ± 0.31 b
CK (g/kg)0.22 ± 0.10 a0.14 ± 0.05 b0.07 ± 0.02 c
CMg (g/kg)0.033 ± 0.02 a0.035 ±0.01 a0.026 ± 0.01 b
CNa (g/kg)0.48 ± 0.44 a0.27 ± 0.12 b0.24 ± 0.05 b
CEC (cmol/kg)3.64 ± 4.88 a16.95 ± 3.33 b7.95 ± 1.63 ab
Silt (%)62.16 ± 9.50 a74.67 ± 4.54 b80.30 ± 3.37 c
Clay (%)3.63 ± 1.51 a7.89 ± 6.20 b8.63 ± 1.95 b
SOM (g/kg)5.28 ± 3.96 a10.09 ± 14.08 b9.41 ± 7.77 ab
EC1:5 (μs/cm)4397 ± 3100 a3676 ± 808 a3483 ± 734 a
ESP (%)17.88 ± 10.74 ab19.19 ± 9.13 a14.17 ± 3.70 b
SAR (g/kg)0.50.92 ± 0.85 a0.50 ± 0.24 b0.44 ± 0.09 b
θs (cm3/cm3)0.35 ± 0.03 a0.55 ± 0.05 a0.43 ± 0.05 b
Note: Ks, saturated hydraulic conductivity; BD, soil bulk density; MWD, average weight diameter of soil water stable aggregates; CEC, cation exchange capacity; SOM, soil organic matter; EC1:5, electrical conductivity; ESP, exchangeable sodium percentage; SAR, sodium adsorption ratio; θs, saturated moisture content. Values followed by different lowercase letters were significantly different at p < 0.05 according to the LSD test. Values in parentheses indicate the standard deviations of soil properties.
Table 2. Correlation analysis of soil physical and chemical properties in a reclamation area.
KsBDMWDCCaCKCMgCNaCECSiltClaySOMEC1:5ESPSARθsαn
Ks1
BD0.441
MWD0.050.581
CCa−0.0050.140.31
CK0.140.11−0.13−0.211
CMg−0.12−0.080.05−0.150.73 *1
CNa−0.22−0.24−0.15−0.320.74 *0.84 **1
CEC−0.10.070.19−0.060.69 *0.69 *0.76 **1
Silt−0.15−0.030.280.32−0.52−0.19−0.34−0.251
Clay−0.0020.110.370.31−0.28−0.16−0.290.120.471
SOM0.170.470.570.360.04−0.07−0.150.420.070.591
EC1:5−0.290.02−0.07−0.30.360.280.480.51−0.24−0.17−0.041
ESP−0.38−0.38−0.27−0.380.430.580.80 **0.33−0.164−0.35−0.370.41
SAR−0.22−0.24−0.166−0.350.75 **0.83 **0.99 **0.75 **−0.36−0.3−0.160.50.80 **1
θs0.0050.370.580.3−0.060.01−0.120.210.180.360.49−0.04−0.28−0.141
α0.090.40.590.06−0.06−0.07−0.050.20.080.240.490.02−0.19−0.050.171
n−0.2−0.41−0.54−0.170.140.130.2−0.05−0.25−0.37−0.390.090.220.2−0.31−0.431
Note: Ks, saturated hydraulic conductivity; BD, bulk density; MWD, average weight diameter of soil water stable aggregates; CEC, cation exchange capacity; SOM, soil organic matter; ESP, exchangeable sodium percentage; SAR, sodium adsorption ratio; θs, saturated moisture content; α and n, van Genuchten–Mualem parameters; **, the correlation is significant at p = 0.01; *, the correlation is significant at p = 0.05.
Table 3. Pedotransfer functions for log(Ks), 1/α, and n obtained using stepwise linear regression and fitted using residual maximum likelihood: Equations (6)–(8) with measured predictors and Equations (9)–(11) with principal components.
ParameterEquationVariableCoefficientSDt-Valuep-Value
log(Ks)(6)(Intercept)2.5670.5984.2920
1/EC1:52.3510.3676.4080
log(K)0.4530.1632.7820.007
BD−1.8540.482−3.8470
log(MWD)−0.4120.164−2.5090.014
(9)(Intercept)0.5240.03415.4750
Y k 3 −0.1770.024−7.4050
Y k 1 −0.0930.016−5.8970
Y k 4 0.1350.0314.3160
Y k 2 −0.0540.019−2.9240.005
1/α(7)(Intercept)−89.50285.761−1.0440.299
log(MWD)−470.59967.615−6.960
log(K)−335.69180.25−4.1830
(10)(Intercept)477.24417.91126.6450
Y α 2 −91.7329.374−9.7860
Y α 4 −81.28316.744−4.8550
Y α 3 38.10613.0422.9220.005
n(8)(Intercept)1.640.10915.0330
log(MWD)−0.440.09−4.8860
Sqrt(Clay)−0.0880.033−2.6710.009
(11)(Intercept)1.6790.02664.2880
Y n 2 −0.0860.014−6.1940
Y n 1 0.0450.0123.6250.001
Y n 3 −0.0420.019−2.2210.03
Note: K, potassium; BD, unit weight; MWD, average weight diameter of soil water stable aggregates; Y k 1 , Y k 2 , Y k 3 , and Y k 4 are principal components corresponding to log(Ks); Y α 1 , Y α 2 , Y α 3 , and Y α 4 are principal components corresponding to 1/α; Y n 1 , Y n 2 , Y n 3 , and Y n 4 are principal components corresponding to n.
Table 4. Evaluation parameters of pedotransfer functions.
Evaluation ParametersEquation
(6)(9)(7)(10)(8)(11)
AIC−193.58−265.151016.83938.86−262.95−315.48
BIC−180.76−252.331024.52949.11−255.26−305.22
Loglik100.79136.57−506.41−466.43133.47160.74
MRE80.91%79.30%37.20%36.10%10.26%9.89%
RMSE0.4120.305184.23173.830.2510.221
R20.680.740.500.510.50.52
Note: AIC, Akaike information criterion; BIC, Bayesian information criterion; Loglik, likelihood function; MRE, mean relative error; RMSE, root mean square error.
Disclaimer/Publisher’s Note: The statements, opinions and data contained in all publications are solely those of the individual author(s) and contributor(s) and not of MDPI and/or the editor(s). MDPI and/or the editor(s) disclaim responsibility for any injury to people or property resulting from any ideas, methods, instructions or products referred to in the content.