Article

Enzymatic Activity in Different Crop Succession Systems in the Cerrado Region

by
Vanessa Brenda Souza Chaves
,
Tiara Moraes Guimarães
,
Aracy Camilla Tardin Pinheiro Bezerra
,
Claudio Hideo Martins da Costa
* and
Simério Carlos Silva Cruz
Faculty of Agronomy, Federal University of Jataí, Jataí 75801-615, Brazil
*
Author to whom correspondence should be addressed.
Agronomy 2024, 14(4), 810; https://doi.org/10.3390/agronomy14040810
Submission received: 7 March 2024 / Revised: 30 March 2024 / Accepted: 9 April 2024 / Published: 13 April 2024

Abstract

:
The enzymatic activity of soil arylsulfatase and β-glucosidase enzymes are biological parameters used to measure the biological activity of soils, an important tool for identifying disturbances in agricultural systems, as they are more sensitive to differentiate changes in soil management when compared to physical and chemical attributes. Thus, the aim was to evaluate arylsulfatase and β-glucosidase levels in different succession systems. Soil samples were collected in agricultural areas with 5 years of experimentation, with four treatments: (1) soybean/corn + brachiaria (Urochloa ruzizienses), (2) soybean/corn, (3) soybean/brachiaria (Urochloa ruzizienses) and (4) soybean/millet. Routine chemical analyses were performed, and the determination of β-glucosidase and arylsulfatase was carried out according to the p-nitrophenyl colorimetric method. As a result, both enzymes presented higher average values in treatment 3. In the biological IQS, treatment 3 differed from treatments 1 and 2. Under the study circumstances, the use of soil with soybean, corn, millet and brachiaria crops provided adequate sustainability conditions, providing high arylsulfatase and β-glucosidase levels.

1. Introduction

Soil quality is a determining factor in maintaining productivity in agricultural systems. Physicochemical properties are clearly useful in assessing the ecological state of soils; however, most processes that occur in soils are driven by their biota [1]. In soils, enzymes are produced by microorganisms, secreted by plants or created by the decomposition of plant, animal and microbial biomass. Reactions catalyzed by these enzymes act in the cycle of nutrients essential for plant development, such as carbon, phosphorus, nitrogen and sulfur [2]. Thus, the enzymatic activity is considered an indicator of biological balance, fertility and quality, being described as “biological fingerprints” of soil management [3].
In soils, enzymes act as catalysts for biogeochemical cycles, related to the decomposition and synthesis of organic matter, cycling and availability of nutrients [4]. Due to its indicative nature of soil ecological stress [5], the enzymatic activity can be used to demonstrate early soil changes related to the production system adopted, such as, for example, the imbalance between organic matter levels and biological activity, when compared to chemical and physical indicators [6,7].
The construction of a more biologically active edaphic environment had as a fundamental milestone the expansion and continuous use of conservation management systems, such as the tillage system [8]. The straw accumulated by cultural remains and cover plants from commercial crops provided a favorable environment for the recovery and maintenance of soil attributes [9].
The main production systems present in the Cerrado region use soybean (Glycine max L.) cultivation in the harvest and corn (Zea mays L.) cultivated in the second harvest [10], which can be planted in consortium with Urochloa spp. In years of late planting or under conditions of water deficit, there is the alternative of millet (Pennisetum glaucum) being cultivated in the second harvest due to its high biomass production and nutrient cycling, with greater tolerance to drought periods [11]. It is important to emphasize that the cultivation of these grasses in the second harvest provides crop remains that decompose more slowly when compared to soybean [12], which helps to preserve soil moisture and increases the stability of aggregates and organic carbon accumulation, directly influencing the activity of microbial communities in soils, enzymatic activity, cycling and release of nutrients [13].
However, the expansion and long-term adoption of conservation management systems have allowed increases in crop productivity or the maintenance of production in the face of adverse environmental situations, which are often not explained by the results of chemical soil analyses [14,15,16,17]. This finding that chemically similar soils may present different performances demonstrates the need to include parameters related to the biological functioning of the soil (bioindicators) in routine analyses.
Arylsulfatases are enzymes that are present in the biochemical cycle of sulfur release (S), which are responsible for catalyzing the hydrolysis of sulfated esters to release SO42−, since around 95% of S present in the soil is in the organic form [18], thus making it available to plants and microorganisms [19,20] to be used in processes such as synthesis of amino acids (cysteine and methionine), coenzyme A, and chlorophyll. The activity of arylsulfatase may depend on the species of cultivated plants, type and use of soil, changes in pH, fertility management, and contamination with heavy metals [21], which makes soil enzymology of practical importance as it highlights aspects inherent to this change [3]. Soil enzymes have a direct relationship with the rate of SOM decomposition and nutrient cycling [22].
β-glucosidase is an enzyme present in most soils, acting as a catalyst in the final stage of the cellulose decomposition process, hydrolyzing the cellobiose residue to release simple sugars at the end of the process. Free glucose molecules as a product are essential energy sources used for the growth and survival of many microorganisms that perform relevant functions in soils [2]. Studies have demonstrated that the process of degradation of organic matter has a strong relationship with the activity of β-glucosidase [23], and its activity is reduced depending on the availability of plant residues [24]. Thus, due to its association with the carbon cycle (C), β-glucosidase is considered an indicator of soil quality; however, the challenge for the use of bioindicators in soil quality assessments consists in the interpretation of the analyzed values [6].
These two enzymes have a close relationship with SOM, a basic parameter for soil quality and grain yield, a parameter that reflects the economic aspect of crops, which is fundamental for the sustainability of agricultural business [25,26,27].
The Bioanalysis technology (BioAS) developed by the Brazilian Agricultural Research Corporation [28] emerged as a bias to this problem and consisted of the analysis and interpretation of β-glucosidase and arylsulfatase activities, in addition to traditional fertility analyses [8]. An important innovation linked to the use of BioAS was the creation of an index to evaluate soil quality (Fertibio IQS) based on the soil chemical quality index (chemical IQS) and the soil biological quality index (biological IQS), as areas with similar levels of nutrients can present different productivity, which highlights the importance of the biological component [8]. Thus, the sum of physical, chemical and biological factors defines the potential of the soil’s capacity to maintain sustainability [29].
Thus, the aim was to evaluate the activity of arylsulfatase and β-glucosidase enzymes in different succession systems and their correlation with Fertibio IQS. Therefore, under the study circumstances, the use of soil with soybean, corn, millet and brachiaria provided adequate sustainability conditions and high arylsulfatase and β-glucosidase levels.

2. Materials and Methods

2.1. Location and Experimental Design

Soil samples were collected from an experiment that was established five years ago at the School Farm of the Federal University of Jataí—Jatobá campus, located in the southwestern state of Goiás. According to Köppen, the region’s climate is characterized as being of the Aw type, tropical Savannah, with rain in summer and drought in winter. The average annual minimum and maximum temperatures are 17.4 °C and 29.3 °C, respectively, and the average precipitation is 1541 mm.
With the aim of increasing the diversification of species used in agricultural systems, maintaining profitability with production and increasing the contribution of straw in the SPD, farmers have been adopting the simultaneous cultivation of corn with brachiaria in succession to soybeans in the summer harvest. The introduction of grass species into the SPD favors the performance of crops used in succession and enables productivity gains in soybean cultivation. Therefore, the choice of succession systems in the present study took into account their great expression in grain-producing areas in the Brazilian Cerrado.
Treatments were composed of four crop succession systems: the first system was formed by soybean planting in harvest, and in the second harvest, corn was intercropped with brachiaria (Urochloa ruzizienses); the second soybean in harvest and only corn in the second harvest; the third soybean in harvest and brachiaria (Urochloa ruzizienses) in the off-season; and the fourth system was composed of soybean with millet in the off-season (Table 1).
The test was carried out in a block design with four replicates, and the dimensions of experimental units were 22.5 m2 (4.5 m × 5.0 m). Millet and corn were planted at a spacing of 0.45 cm, and brachiaria was sown between corn planting rows.

2.2. Sampling

The collection of soil samples to determine the chemical parameters and activity of β-glucosidase and arylsulfatase enzymes was carried out with the aid of a motorized soil sampler on 26 October 2022. Four points were collected within each plot to form a composite sample in each experimental unit, with a total of 16 samples. Samples were collected at the 0–0.1 m layer, which is the diagnostic layer for carrying out bioanalysis tests, as described in the study, being prepared for chemical and biological analysis. Samples were air-dried, crushed and sieved through an ABNT N° 10 sieve (2 mm). To carry out BioAS, samples were sent to the laboratory of soil analysis (Grupo Exata Brasil-Unidade Jataí), where analyses were carried out. Subsequently, results were sent to the Embrapa BioAS Network so that, based on values found, chemical IQS, biological IQS and Fertibio IQS could be established.
During this same period, undisturbed samples were collected for physical characterization of the treatments, and soil density (SD) and total soil porosity (TP) were determined (Table 2).

2.3. Assessments

2.3.1. Determination of Soil β-Glucosidase Activity

β-glucosidase analyses were carried out according to the method of colorimetric determination of p-nitrophenyl released by soil β-glucosidases when samples are incubated with a buffered p-nitrophenyl-β-glucopyranosidium (PNG) solution, according to the methodology described in studies [30,31].
For β-glucosidase analyses, 50-mL Erlenmeyer flasks were identified according to the numbering corresponding to collection areas. Each sample was analyzed in triplicate, the first flask being the control and the other two for enzyme determination. The soil weight used was 1 ± 0.005 g per sample. In all flasks, 4 mL of MUB pH 6.0 solution, previously prepared, was added. About 1 mL of 0.025 M PNG solution was added only to samples used to determine the enzymatic activity, but this solution was not added to the Erlenmeyer flask containing the control sample. Erlenmeyer flasks were covered and incubated in an oven for 1 h at 37 °C, with stabilized temperature.
After the incubation time, only 1 mL of 0.5 M CaCl2 and 4 mL of THAM pH 12 solution were added to the samples for enzymatic determination. In the control sample, 1 mL of 0.025 M PNG solution was added. Samples were filtered using qualitative filter paper, and the filtrate was collected in 15 mL Falcon tubes. Solutions collected in tubes were read on a previously calibrated UV-Vis spectrophotometer at a wavelength of 420 nm, and data were collected in absorbance. To read the samples, the analytical curve was previously prepared.

2.3.2. Calculation of the β-Glucosidase Activity

To calculate the β-glucosidase activity in p-nitrophenyl g−1 h−1, two Equations were used, and the formulas are described below:
S a m p l e   c o n c e n t r a t i o n   ( µ g   p n f / g   h ) = ( ( a b s + b ) / α ) / M s a m p l e
where:
Sample concentration is the sample β-glucosidase concentration;
abs is the absorbance read on the equipment;
α is the angular coefficient of the analytical curve linear regression equation;
b is the linear coefficient of the analytical curve regression equation;
Msample is the sample mass in grams.
β g l u c o s i d a s e   a c t i v i t y = [ ( ( R e p .   1   c o n c + R e p .   2   c o n c ) / 2 ) C o n t r o l   c o n c e n t r a t i o n ] / D W
where:
β-glucosidase activity is the result of β-glucosidase analysis in the unit of µg of p-nitrophenyl g−1 h−1;
Rep. 1 conc is the replicate 1 concentration;
Rep. 2 conc is the replicate 2 concentration;
Control conc is the control sample concentration;
DW is the sample dry weight.

2.3.3. Dry Weight

The dry weight to be used in the enzymatic activity calculation was determined by weighing 1 g of the sample in an aluminum capsule suitable for this analysis, with the sample being taken to an oven with forced air circulation at a temperature of 105 °C for 16 h; after removal, the capsule + sample set was weighed to calculate the dry weight of samples.

2.3.4. Determination of the Arylsulfatase Activity

Arylsulfatase activity analyses were carried out according to the method of colorimetric determination of p-nitrophenyl released by arylsulfatase when samples are incubated in a buffered p-nitrophenyl sulfate (PNS) solution, respectively, as well as the methodology described in studies [30,31].
To analyze the arylsulfatase activity, Erlenmeyer flasks were identified according to the number of samples analyzed. As with the β-glucosidase determination, each sample was analyzed in triplicate, the first flask being the control and the other two for enzyme determination. The soil weight used was 1 ± 0.005 g per sample. Four ml of 0.05 M acetate buffer solution pH 5.8 were added to all flasks. Then, 1 mL of 0.05 M PNS solution was added to samples used to determine the enzymatic activity. In the flask containing the control sample, this solution was not added. Erlenmeyer flasks were covered and incubated in an oven for 1 h at 37 °C.
After removing samples from the oven, only 1 mL of 0.5 M CaCl2, 4 mL of 0.5 M NaOH solution and 1 mL of 0.025 M PNS solution were added to the control sample. Samples were filtered, and solutions were collected in Falcon tubes and read on a previously calibrated UV-Vis spectrophotometer at a wavelength of 410 nm.

2.3.5. Calculation of the Arylsulfatase Activity

To calculate the arylsulfatase activity in p-nitrophenol g−1 h−1, the two Equations presented below were used:
S a m p l e   c o n c e n t r a t i o n   ( µ g   p n f / g   h ) = ( ( a b s + b ) / α ) / M s a m p l e
where:
Sample concentration is the sample arylsulfatase concentration;
abs is the absorbance read on the equipment;
α is the angular coefficient of the analytical curve linear regression equation;
b is the linear coefficient of the analytical curve regression equation;
Msample is the sample mass in grams.
A r y l s u l f a t a s e   a c t i v i t y = [ ( ( R e p .   1   c o n c + R e p .   2   c o n c ) / 2 ) C o n t r o l   c o n c e n t r a t i o n ] / D W
where:
Arylsulfatase activity is the result of the arylsulfatase analysis in the unit of µg of p-nitrophenyl g−1 h−1;
Rep. 1 conc is the replicate 1 concentration;
Rep. 2 conc is the replicate 2 concentration;
Control conc is the control sample concentration;
DW is the sample dry weight.

2.3.6. Physicochemical Characterization of Samples

Soil acidity determination was carried out as described [32] through pH readings represented by the activity of the H+ ion in the soil solution, corresponding to dissociated hydrogen in a 0.01 mol L−1 CaCl2 solution with the aid of electrodes immersed in the soil suspension.
Potential acidity (H + Al) was extracted using the SMP buffer method, where pH was determined in a soil suspension using a CaCl2 solution. Subsequently, an SMP buffer solution was added, and the equilibrium pH of the suspension was read again, which allows estimating H + Al using a calibrated curve for the region, as proposed [32]. Aluminum (Al3+), calcium (Ca2+) and magnesium (Mg2+) were determined in ammonium chloride extract (NH4Cl) according to methodology [32], and the sample reading technique consisted of inductively coupled plasma optical emission spectrometry (ICP-OES), in which it is possible to perform multi-element analyses.
Potassium (K), phosphorus (P), copper (Cu), iron (Fe), manganese (Mn), zinc (Zn), sodium (Na) and boron (B) were extracted using the Mehlich 1 acid extractor, which is based on the principle of dissolution of minerals retained on the soil solid surfaces into the solution by anions capable of competing with these elements for retention sites, also read in ICP-OES. The organic matter (OM) content of soils was determined using the colorimetric method, which was based on colorimetric reading in a sodium dichromate (Na2Cr2O7) and sulfuric acid (H2SO4) solution with the aid of a spectrophotometer, as described in studies [32].
The particle size analysis to determine the clay, silt and sand fractions was carried out using the densimeter method, consisting of reading the sedimentation of the clay fraction dispersed in sodium hydroxide (NaOH). Sulfur was determined using 0.5 N ammonium acetate and 0.25 N acetic acid extractor, which was developed to simulate the plant’s S removal from the soil. After extraction, samples were analyzed by ICP-OES, and their quantification was presented in the unit of mg dm−3, according to methodology [33].

2.3.7. Determination of IQS

The IQS calculations of BioAS technology (IQS Fertibio, IQS chemical and IQS biological) are based on the concept proposed by [34], which takes into account the capacity of the soil to function to provide important environmental services. In BioAS, based on determinations of enzymatic activity and chemical properties, three functions related to the soil’s ability to promote plant nutrition are evaluated: (F1) the soil’s ability to cycle nutrients; (F2) the soil’s capacity to store nutrients; and (F3) the soil’s ability to supply nutrients [34]. Like IQS, function scores also vary from 0 to 1, with the closer to 1 being, the better the function performance (function indices F1, F2 and F3). Similar to the strategy used to interpret enzyme activity values, all IQS and the scores of the three functions are calibrated in relation to grain yield and SOM [35].
F1 aims to estimate the performance of the biological activity and processes derived from it, directly or indirectly, such as nutrient cycling and the formation and decomposition of SOM. F2 aims to quantify the “reservoir” of soil nutrients, which is mainly related to texture, clay quality and SOM content and quality. F3 assesses the quality of the soil nutrient “reservoir” content, involving both aspects related to soil acidity and the soil’s capacity to make the main macronutrients available. The performance of these three functions is measured by indicators obtained from chemical and biological analyses of the soil, which are individually interpreted using algorithms defined according to the soil texture [35].

2.3.8. Statistical Analyses

The results of chemical and biological indicators were submitted to analysis of variance and Tukey’s test at 5% probability, with the aid of the Agroestat statistical software 1.1.0.712 [36]. Correlations were verified between Fertibio IQS, chemical IQS, biological IQS and the other soil properties using Pearson’s linear correlation coefficient (r).

3. Results

Soil Chemical and Physical Attributes

Soil chemical and physical attributes were assessed only to allow assessing soil quality. Based on the determinations of chemical fertility attributes (pH, H + Al, Ca, K, P, Mg and SOM) and the levels of arylsulfatase and β-glucosidase enzymes, it was possible to determine the soil quality index (FERTIBIO IQS). This index integrates the BioAS Technology and soil fertility results. Results regarding chemical and physical characteristics are presented in Appendix A Table A1, Table A2, Table A3 and Table A4, respectively.
Table 3 shows the average results of soil quality indices calculated based on the enzymatic activity and the soil physicochemical attributes and their classification according to the state in which each system is found.
Both soil quality indices and functions receive scores ranging from 0 to 1, and the closer to 1, the better the results. Values close to 1 were found for soil quality indices, and the average results were found for β-glucosidase and arylsulfatase, both parameters considered high and very high.
In the β-glucosidase activity results, treatment 3 presented a value of 238 µg of p-nitrophenyl g−1 h−1, similar to treatment 4 (177 µg of p-nitrophenyl g−1 h−1) and higher than treatments 1 and 2 (130 and 139 µg of p-nitrophenyl g−1 h−1, respectively). β-glucosidase catalyzes the breakdown of oligosaccharides to be a source of energy for microorganisms present in the soil, so their activity correlates with the organic carbon content, which can be confirmed with the highest average organic matter content found in this treatment (Appendix ATable A3). The correlation between soil organic carbon (SOC) content and β-glucosidase (BETA) (Figure 1) was r = 0.73. For arylsulfatase, the highest values found were also for treatment 3, with 128.75 µg of p-nitrophenyl g−1 h−1, similar to treatment 4 and higher than treatments 1 and 2.
Pearson’s correlation coefficient between arylsulfatase and soil S content was r = −0.64 (Figure 2), that is, a moderate and inversely proportional correlation, in accordance with the increase in S content, arylsulfatase activity tends to decrease. The correlation coefficient between organic matter (SOM) content and arylsulfatase activity was r = 0.77 (Figure 3), a value that indicates a strong correlation between these variables.
The biological IQS results of treatment 3 differed significantly from those of treatments 1 and 2, with 0.94 on the proposed scale from 0 to 1 for indicator performance, being classified as high. The treatment 4 was similar to other treatments. The chemical IQS showed no statistical difference between succession systems. The Pearson’s correlation coefficient between chemical IQS and Fertibio IQS was r = 0.49 (Figure 4).
The results found for Fertibio IQS did not differ between succession systems (Table 3), being classified as very high, with values ranging from 0.81 to 1.0. The correlation between biological IQS and Fertibio IQS was 0.9, which indicates a strong correlation between biological variables in the systems and the balance of the system used (Figure 5).
Table 4 presents the results regarding the representation of functions to which soil attributes, whether physical or chemical, are related. For the nutrient cycling function, treatment 3 differed statistically from treatments 1 and 2 and was similar to treatment 4, which result is in accordance with what was observed for parameters arylsulfatase, β-glucosidase and biological IQS. To determine nutrient cycling, the enzymatic activity found relating the biological aspect to the mineralization processes is taken into account.
Regarding nutrient storage, no statistical difference was found between production systems. To determine this function, the values found for organic matter and CEC are considered in the analysis. Regarding the nutrient supply function, treatment 2 was statistically different from treatment 4. Nutrient supply considers the other analytes determined in the soil analysis, such as exchangeable bases and P content.

4. Discussion

Enzymes have an effect on soil quality and health, performing fundamental functions in the biological process, whose supply of nutrients and catalytic reactions depend on the activity mediated by such enzymes, serving as a means of evaluating microbial activity, detecting changes in the soil environment, acting as soil quality indicators, being directly related to the organic matter content [37].
Previous studies with bioindicators in the Brazilian Cerrado have demonstrated that these two soil enzymes can act as early warning indicators of soil change in response to different management practices [28,38]. Since 2019, it has been recommended in Brazil to assist producers in making environmentally and economically sustainable soil and crop management decisions [28,38].
Other characteristics that made the use of arylsulfatase and β-glucosidase advantageous are precision, coherence, sensitivity, simple analytical determination and reproducibility. Furthermore, the two enzymes are related to SOM cycling, are not influenced by the application of fertilizers and limestone and adapt to the Fertibio concept of soil sampling [39]. These enzymes are also correlated with several other microbiological attributes (microbial carbon biomass, basal respiration, acid phosphatase, cellulase, dehydrogenase, etc.), which allowed the selection of just two indicators to express the functioning of the soil biological machinery.
Both soil quality indices and functions receive scores ranging from 0 to 1, and the closer to 1, the better the results. In the present study, arylsulfatase and β-glucosidase levels were classified between high and very high. These extracellular enzymes are used as soil quality bioindicators, aggregate to substrates such as clay and organic matter, acting as catalysts for chemical processes, decomposing these substrates and releasing mineral compounds to plants [37]. According to studies [8], such indices were calibrated in tests that aimed to correlate organic matter contents with enzymatic activities, as well as the accumulated yields of soybean and corn grains.
It was possible to observe that both enzymes showed greater activity in treatment 3 followed by treatment 4, treatments that also presented the highest OM content, which certainly increased the soil microbiota and, consequently, the enzymatic activity. Over time, this increase in biological activity can result in an increase in SOM, positively impacting the chemical (e.g., better storage of nutrients) and physical quality of the soil (e.g., better structure, reflected in storage and water infiltration). In the escalation of soil improvement, microbiological attributes are the first to be impacted. More biological activity means, over time, more SOM and, consequently, greater soil structuring and aggregation, which results in better infiltration and water retention.
The greater arylsulfatase activity in the succession system containing Urochloa followed by millet (treatments 3 and 4) may be related to greater production and maintenance of biomass since these crops were used for this purpose in the off-season. Also, sampling was performed prior to the crop desiccation, which may have directly influenced the greater activity for Urochloa since it is a perennial grass, allowing the maintenance of the humidity and temperature conditions necessary for the microorganism community, as described by [40], who cite humidity, temperature, pH and type of vegetation present in the soil as factors that influence enzymatic activity.
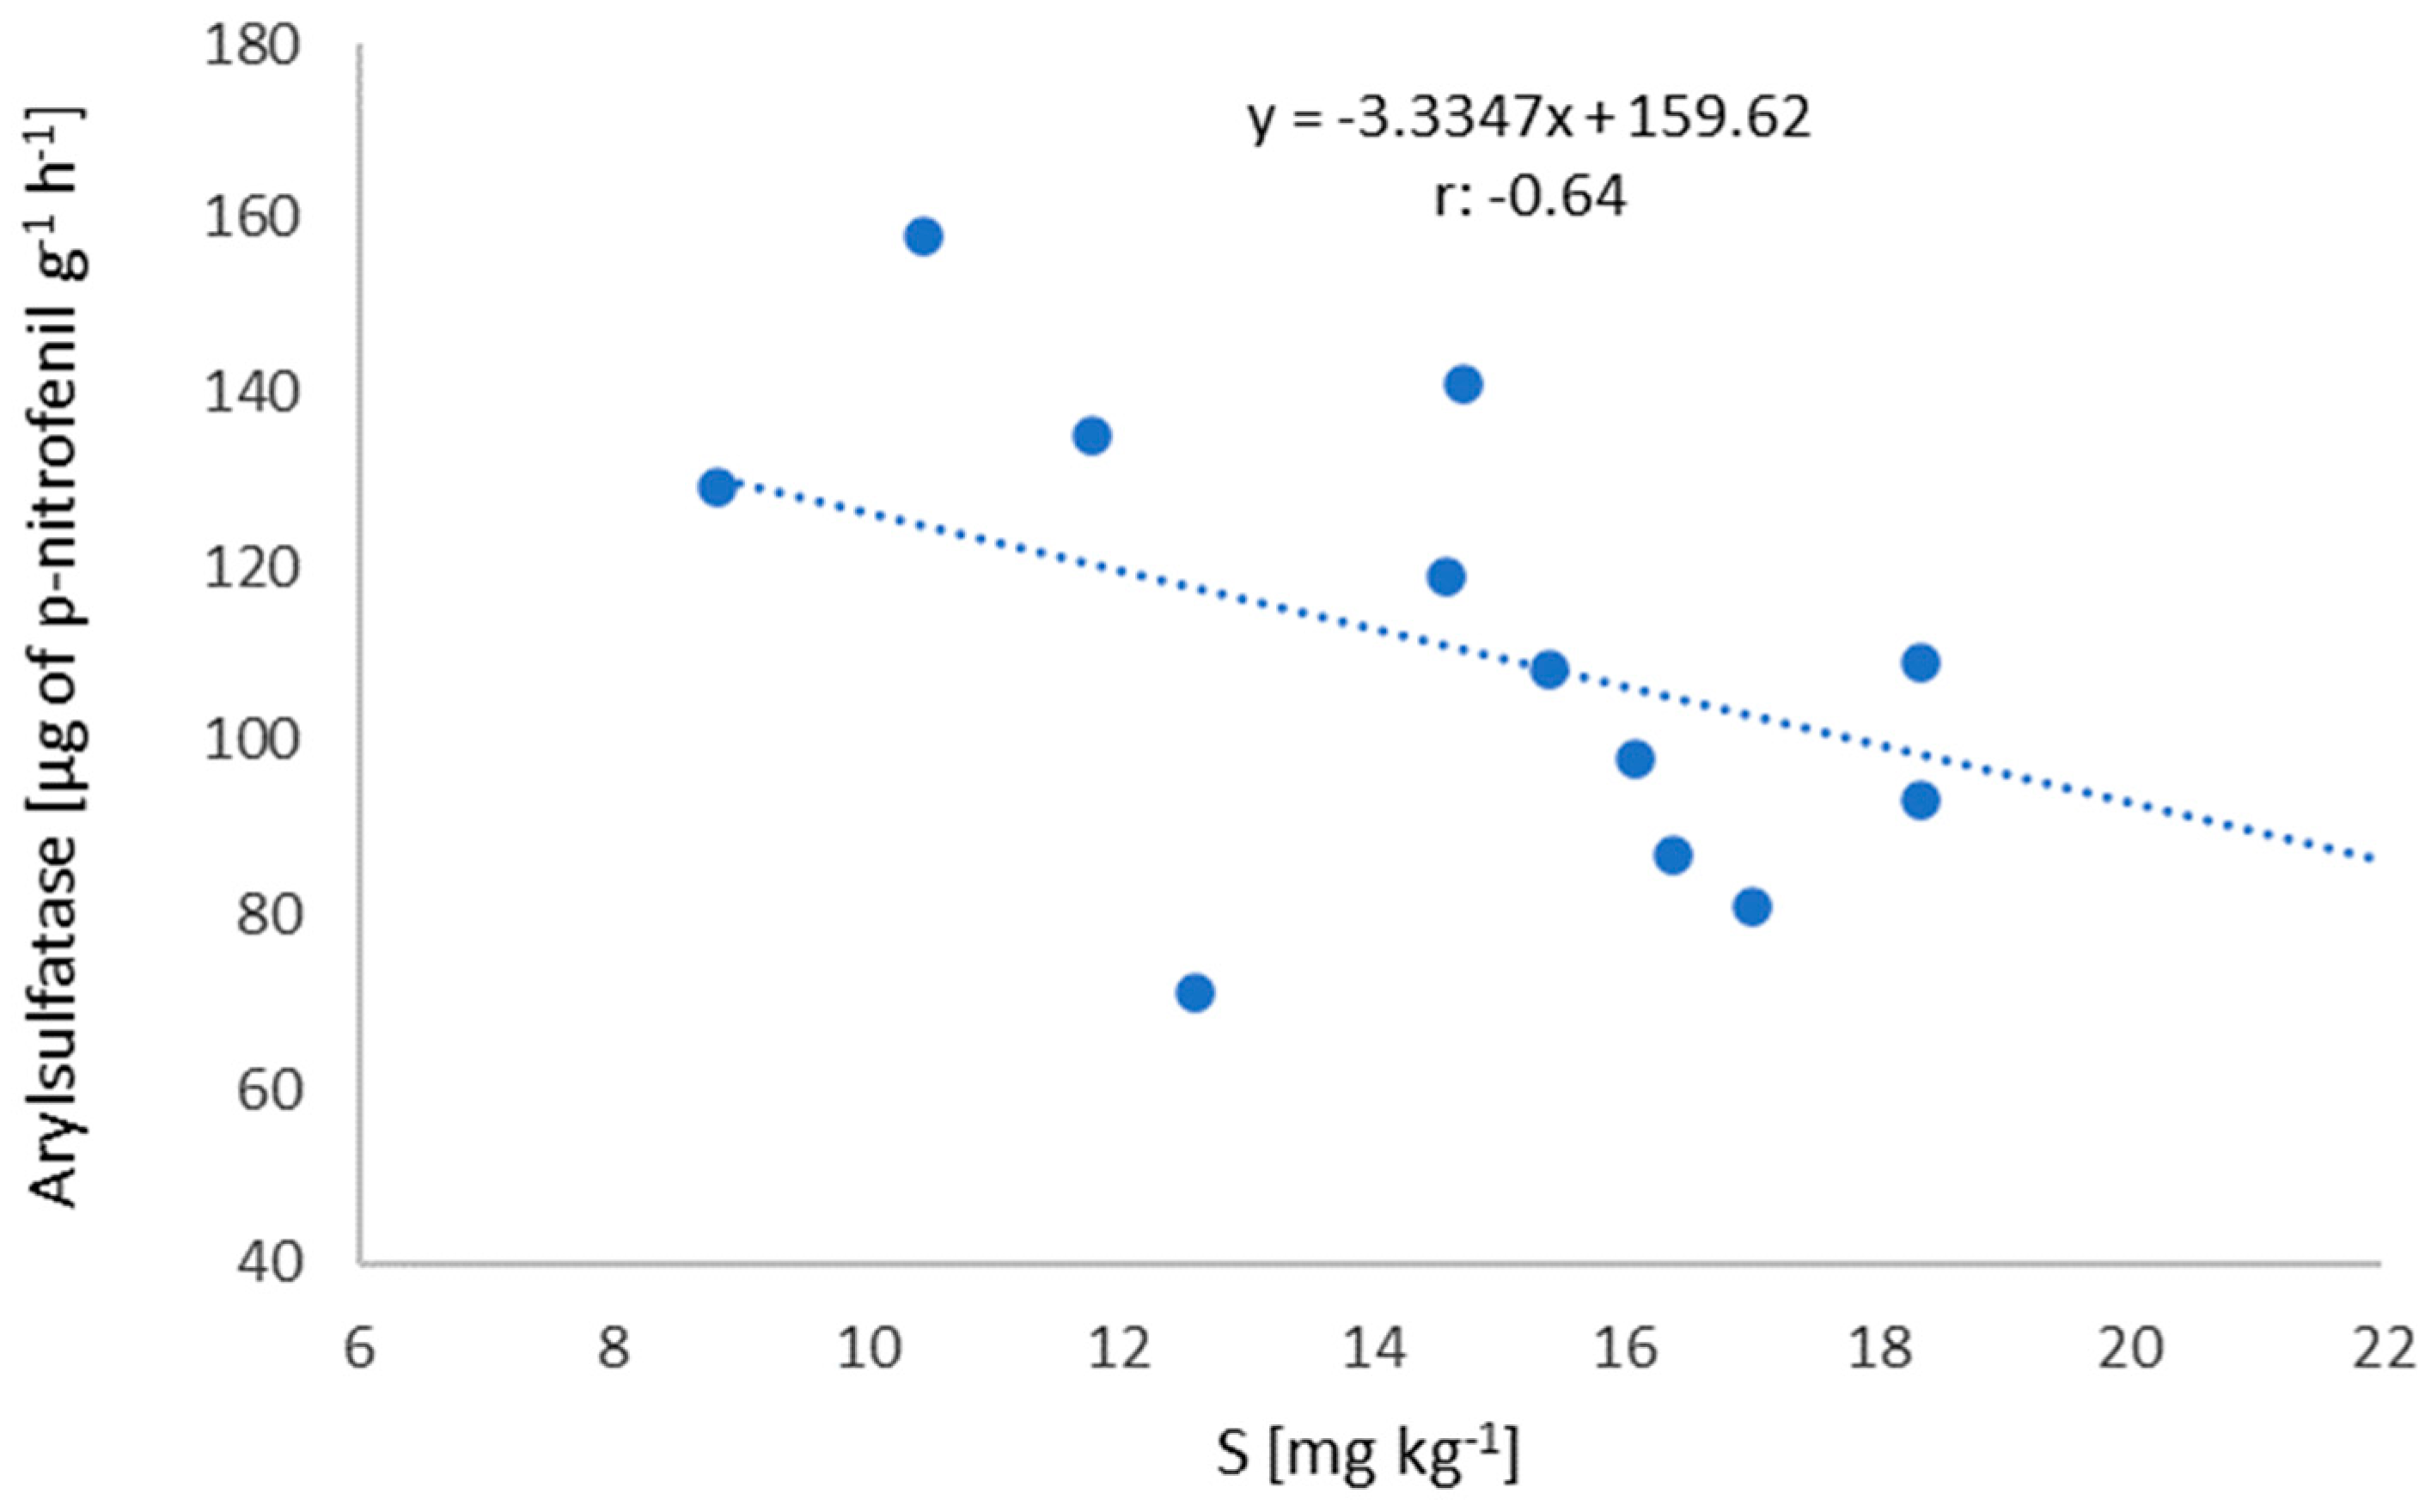
Evaluating the Pearson’s correlation coefficient between arylsulfatase and S content (Figure 2), a moderate and inversely proportional correlation (r = −0.64) is observed, i.e., as the S content increases, arylsulfatase activity tends to decrease. Similar results were found by [41], where simple correlation analyses between S and arylsulfatase activity indicated a negative relationship between variables; however, with low correlation coefficients. In soil, S is predominantly found in the organic form, so the soil’s ability to meet the plant’s demand for nutrients is closely related to the organic matter content and its mineralization [42].
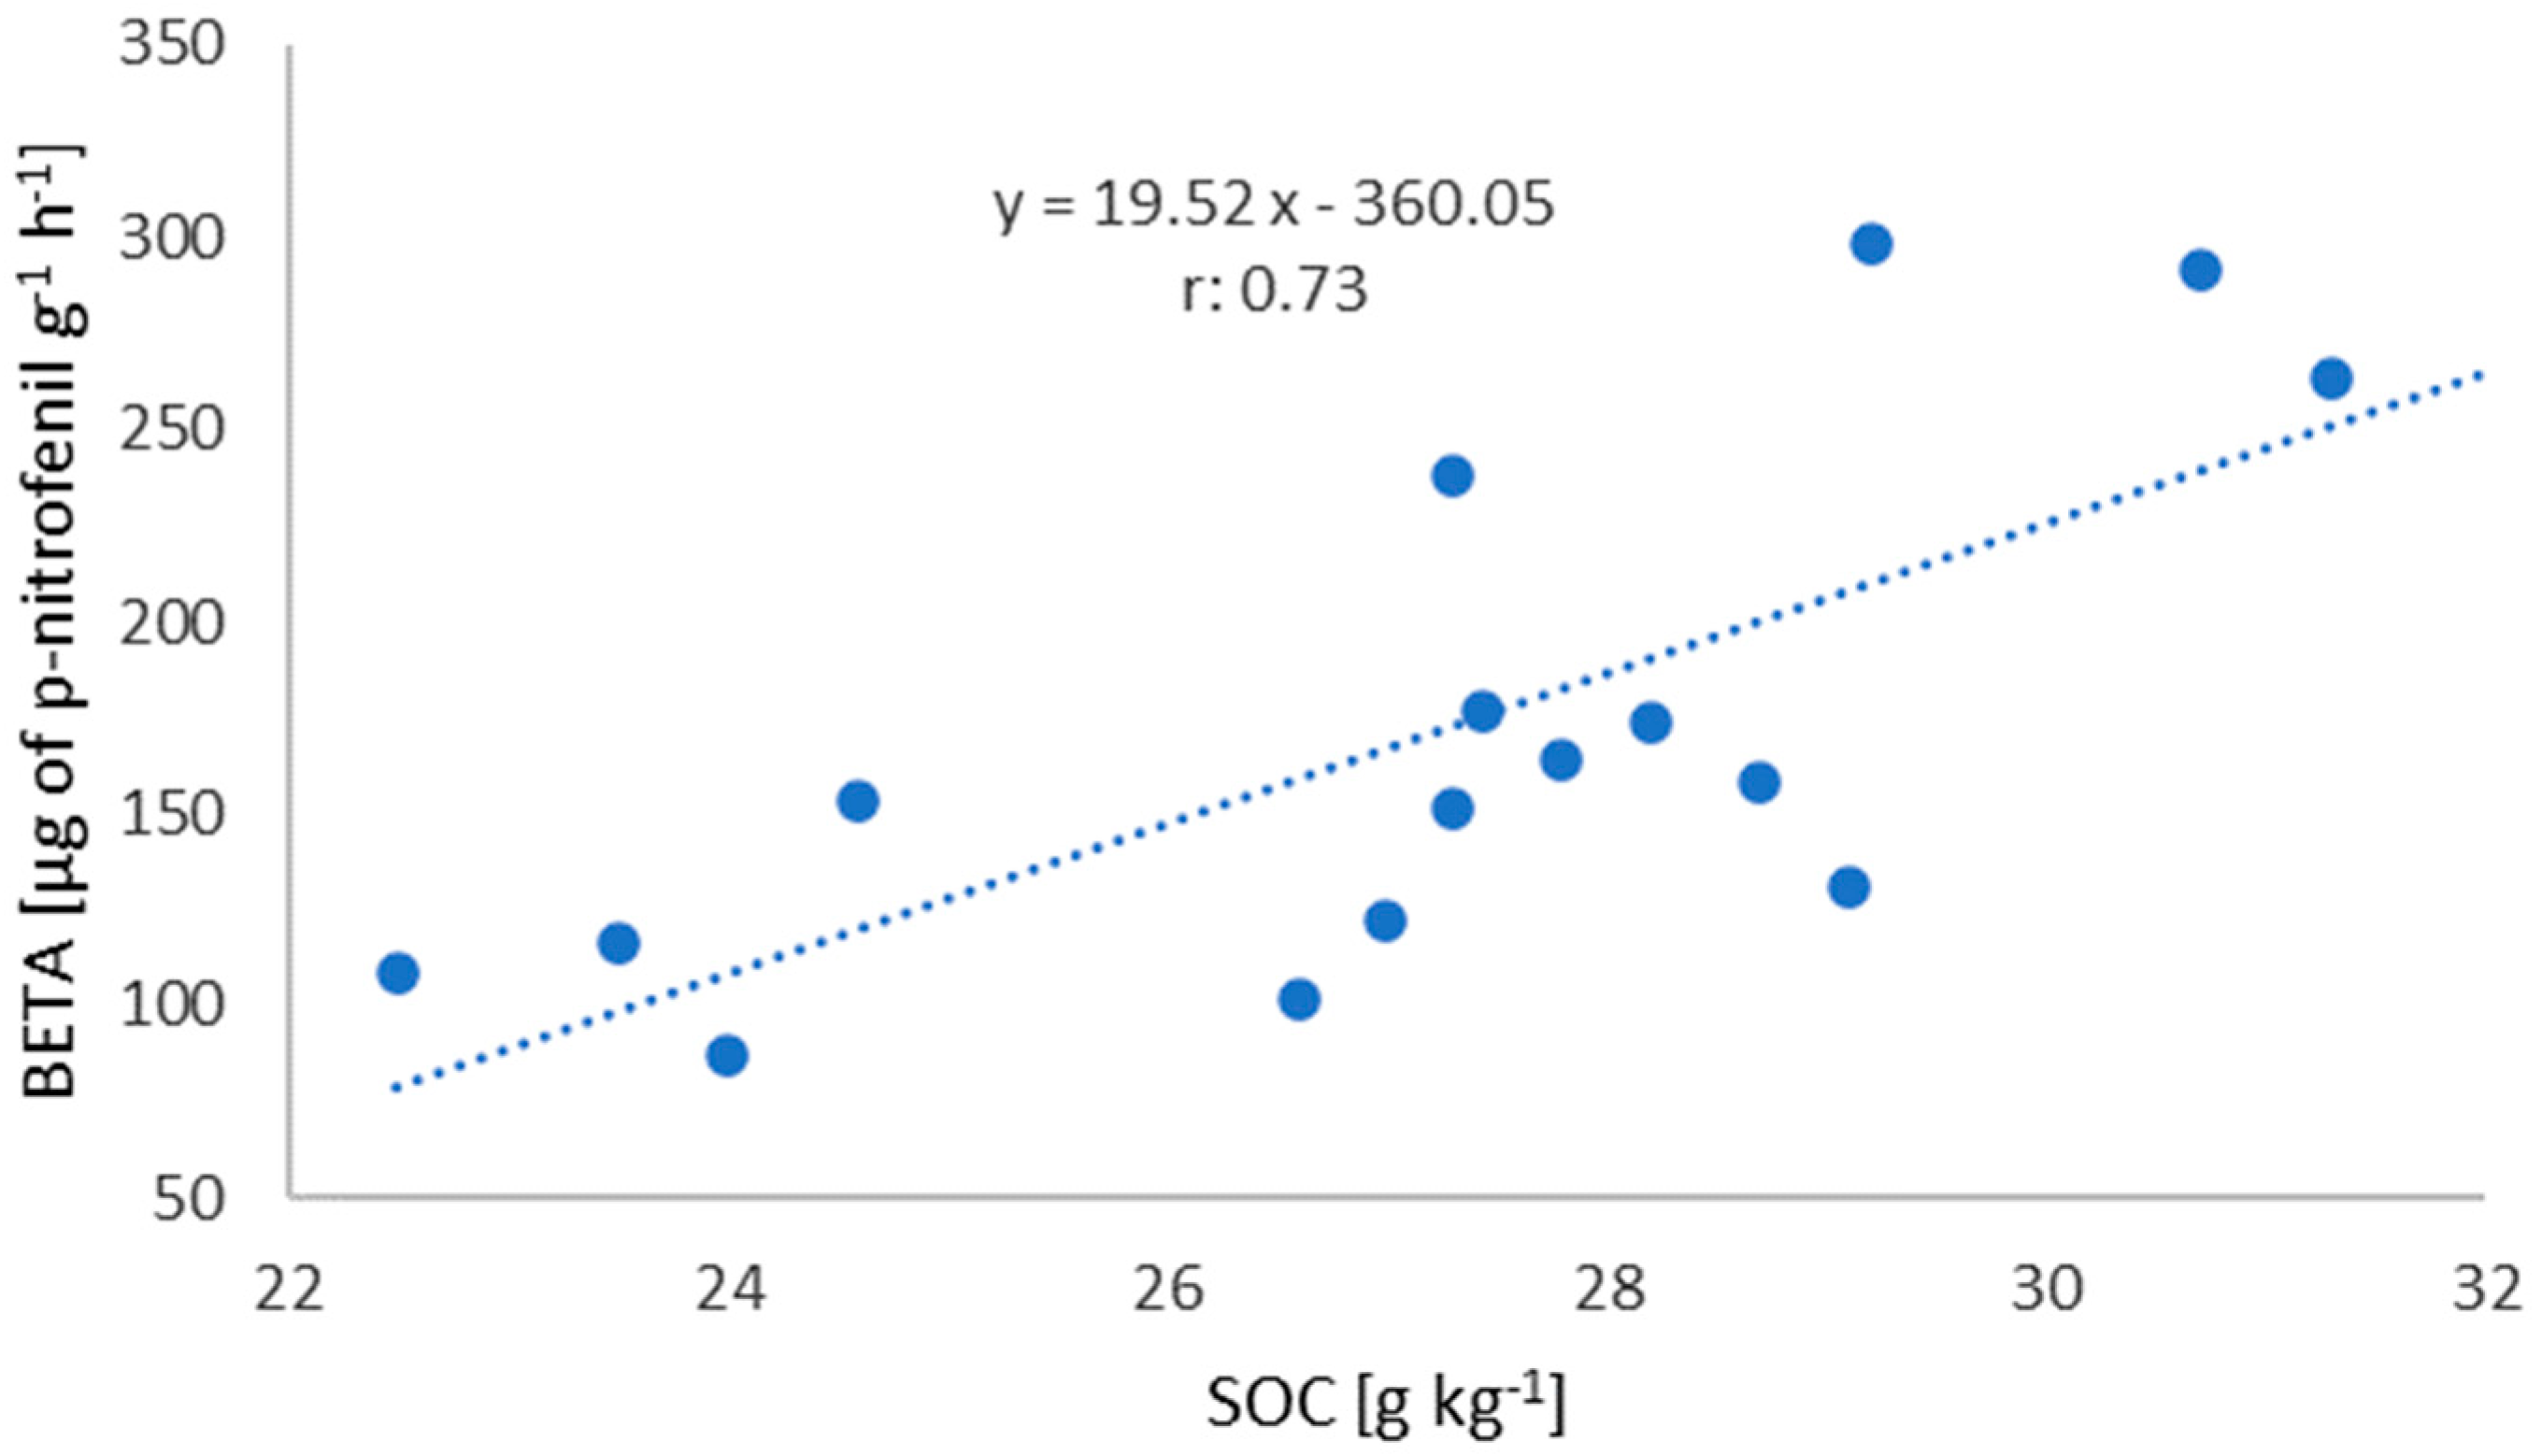
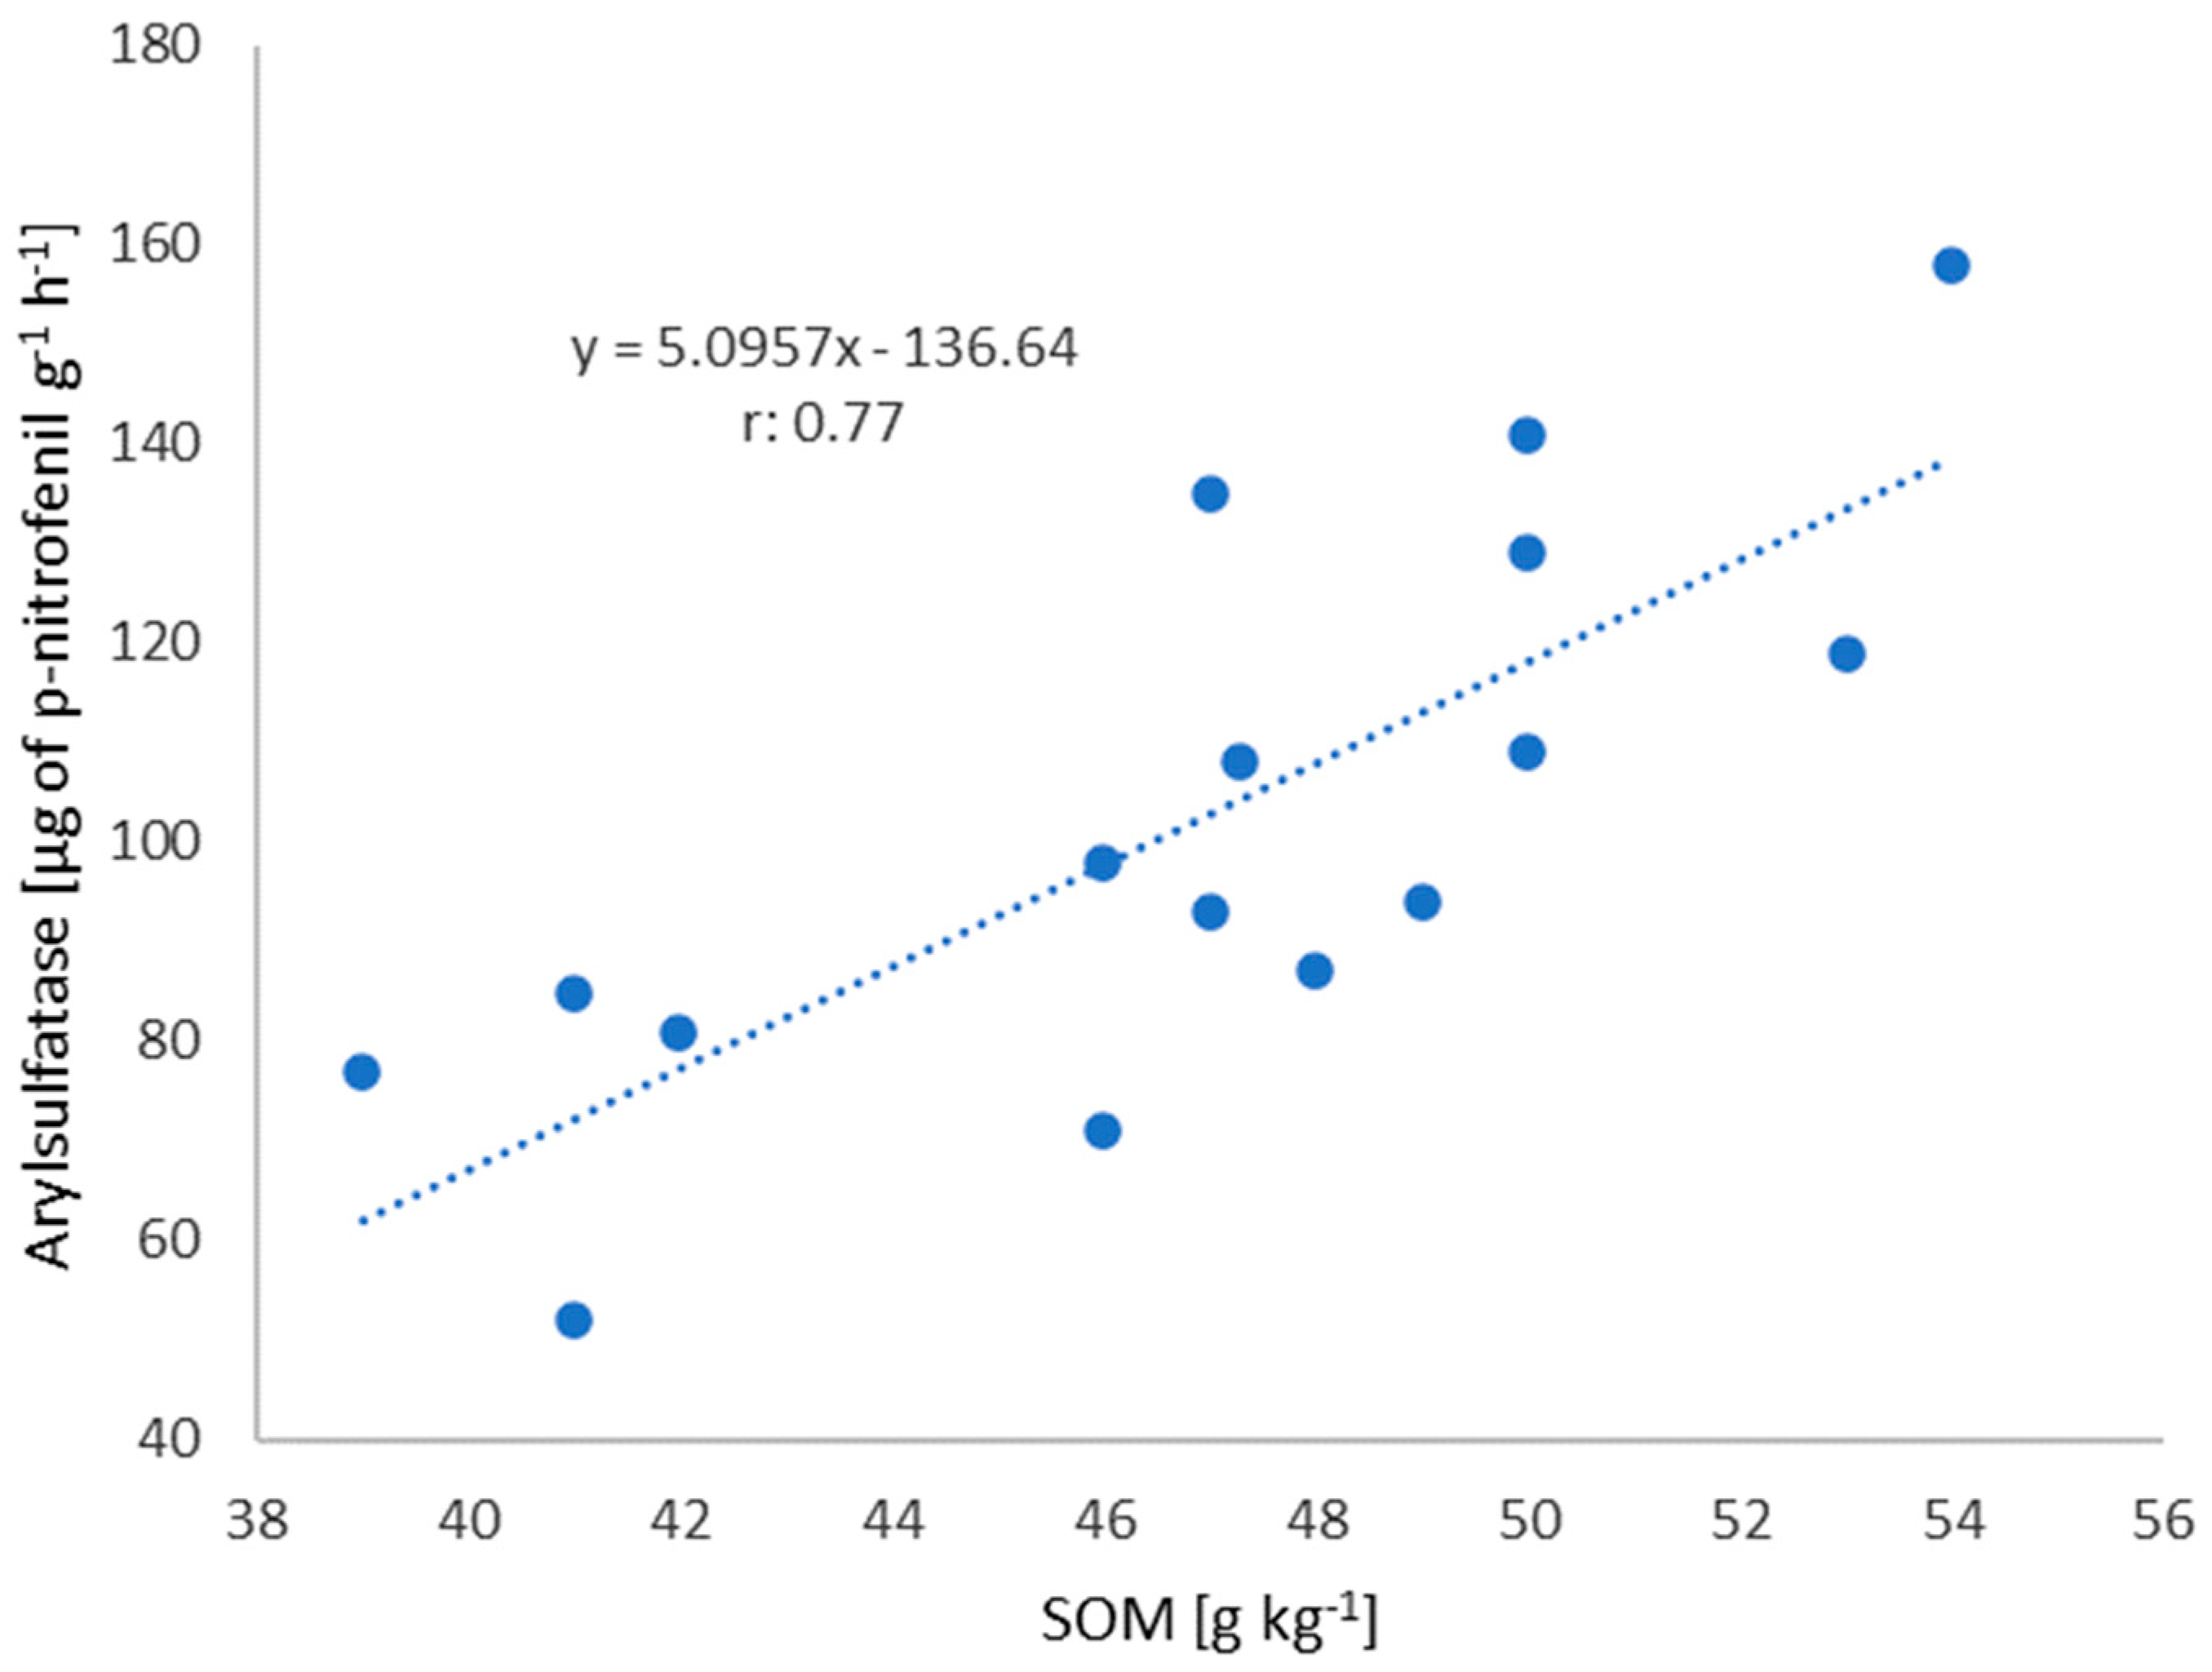
Analyzing the correlation between arylsulfatase activity and organic matter content and organic carbon content and β-glucosidase activity, there was a strong correlation between these variables (r = 0.77 and r = 0.73, respectively), as well as the influence of soil organic matter on the activities of these enzymes. According to studies [41], arylsulfatase activity decreases with the decrease in organic matter content since OM is the main reserve of sulfate esters, which are substrates for the enzyme. Similar results were found by [22], who evaluated the relationship between pH, OM and soil texture with the activity of arylsulfatase and β-glucosidase enzymes [6], aiming to develop a proposal for interpreting microbiological attributes, used three long-term experiments and different organic matter levels in soil, which showed a strong positive correlation with the soil microbiological attributes soil and organic matter content.
In a study of soil enzymatic activity in different production systems, ref. [43] found that high organic matter values correlated with greater enzymatic activity in the areas under study since organic matter maintains soil enzymes in their active forms due to the interaction between humic substances and enzyme molecules. Increases in β-glucosidase activity in cultivated areas have also been reported by [34] due to the biological peculiarities of the Cerrado soil, and the high values for the activity of this enzyme in agricultural areas can largely be explained by the lower complexity and lignification of residues present in agricultural systems.
It is noteworthy that the OM content did not differ between treatments (Appendix ATable A3), and all showed high enzymatic activity values, indicating that the production systems and soil management practices used are adequate and sustainable. Soils with greater OM increment show increased microbiological activity, improving their structure and proving the resilience of biologically active soils compared to conventional cultivation [43].
Another important innovation linked to the use of BioAS was the creation of an index to evaluate soil quality (FERTIBIO IQS) based on determinations of chemical fertility attributes (pH, H + Al, Ca, K, P, Mg and SOM) and the levels of arylsulfatase and β-glucosidase enzymes. This index integrates the results of BioAS Technology and soil fertility, generating a score (from 0 to 1), which expresses soil quality/health. The IQS calculations of BioAS technology (IQS Fertibio, IQS chemical and IQS biological) are based on the concept proposed by [44], which takes into account the capacity of the soil to function to provide important environmental services. In BioAS, based on determinations of enzymatic activity and chemical properties, three functions related to the soil’s ability to promote plant nutrition are evaluated: (F1) the soil’s ability to cycle nutrients; (F2) the soil’s capacity to store nutrients; and (F3) the soil’s ability to supply nutrients [35]. Like IQS, function scores also vary from 0 to 1, with the closer to 1 being, the better the function performance (function indices F1, F2 and F3). Similar to the strategy used to interpret enzyme activity values, all IQS and the scores of the three functions are calibrated in relation to grain yield and SOM [35].
F1 aims to estimate the performance of biological activity and processes derived from it, directly or indirectly, such as nutrient cycling and the formation and decomposition of SOM. F2 aims to quantify the “reservoir” of soil nutrients, which is mainly related to texture, clay quality and SOM content and quality. F3 assesses the quality of the soil nutrient “reservoir” content, involving both aspects related to soil acidity and the soil’s capacity to make the main macronutrients available. The performance of these three functions is measured by indicators obtained from chemical and biological analyses of the soil, which are individually interpreted using algorithms defined according to the soil texture [35].
Despite the difference observed, the biological IQS results presented values classified as high or very high on the proposed scale from 0 to 1 for indicator performance. This indicator estimates the performance of biological activity and of processes directly or indirectly derived from it, such as nutrient cycling and the formation and decomposition of organic soil matter. The highest arylsulfatase and β-glucosidase values, together with the high organic matter content, justify the behavior of this indicator. In a study that sought to evaluate the sustainability conditions of different succession systems, ref. [45] found the greatest results in crop-livestock integration systems and permanent pastures.
Although no statistical difference was observed for chemical IQS between succession systems, this is an indicator that estimates the soil “reservoir” of nutrients, which is mainly related to texture, number of charges and OM present in the soil, as well as its acidity and ability to make the main macronutrients available.
For Fertibio IQS, it was observed that all succession systems are classified as very high, with values ranging from 0.81 to 1.0, which demonstrates stable patterns characteristic of use and management systems practiced over a long period of time in a given area, generally over 3 to 5 years, as described by [8].
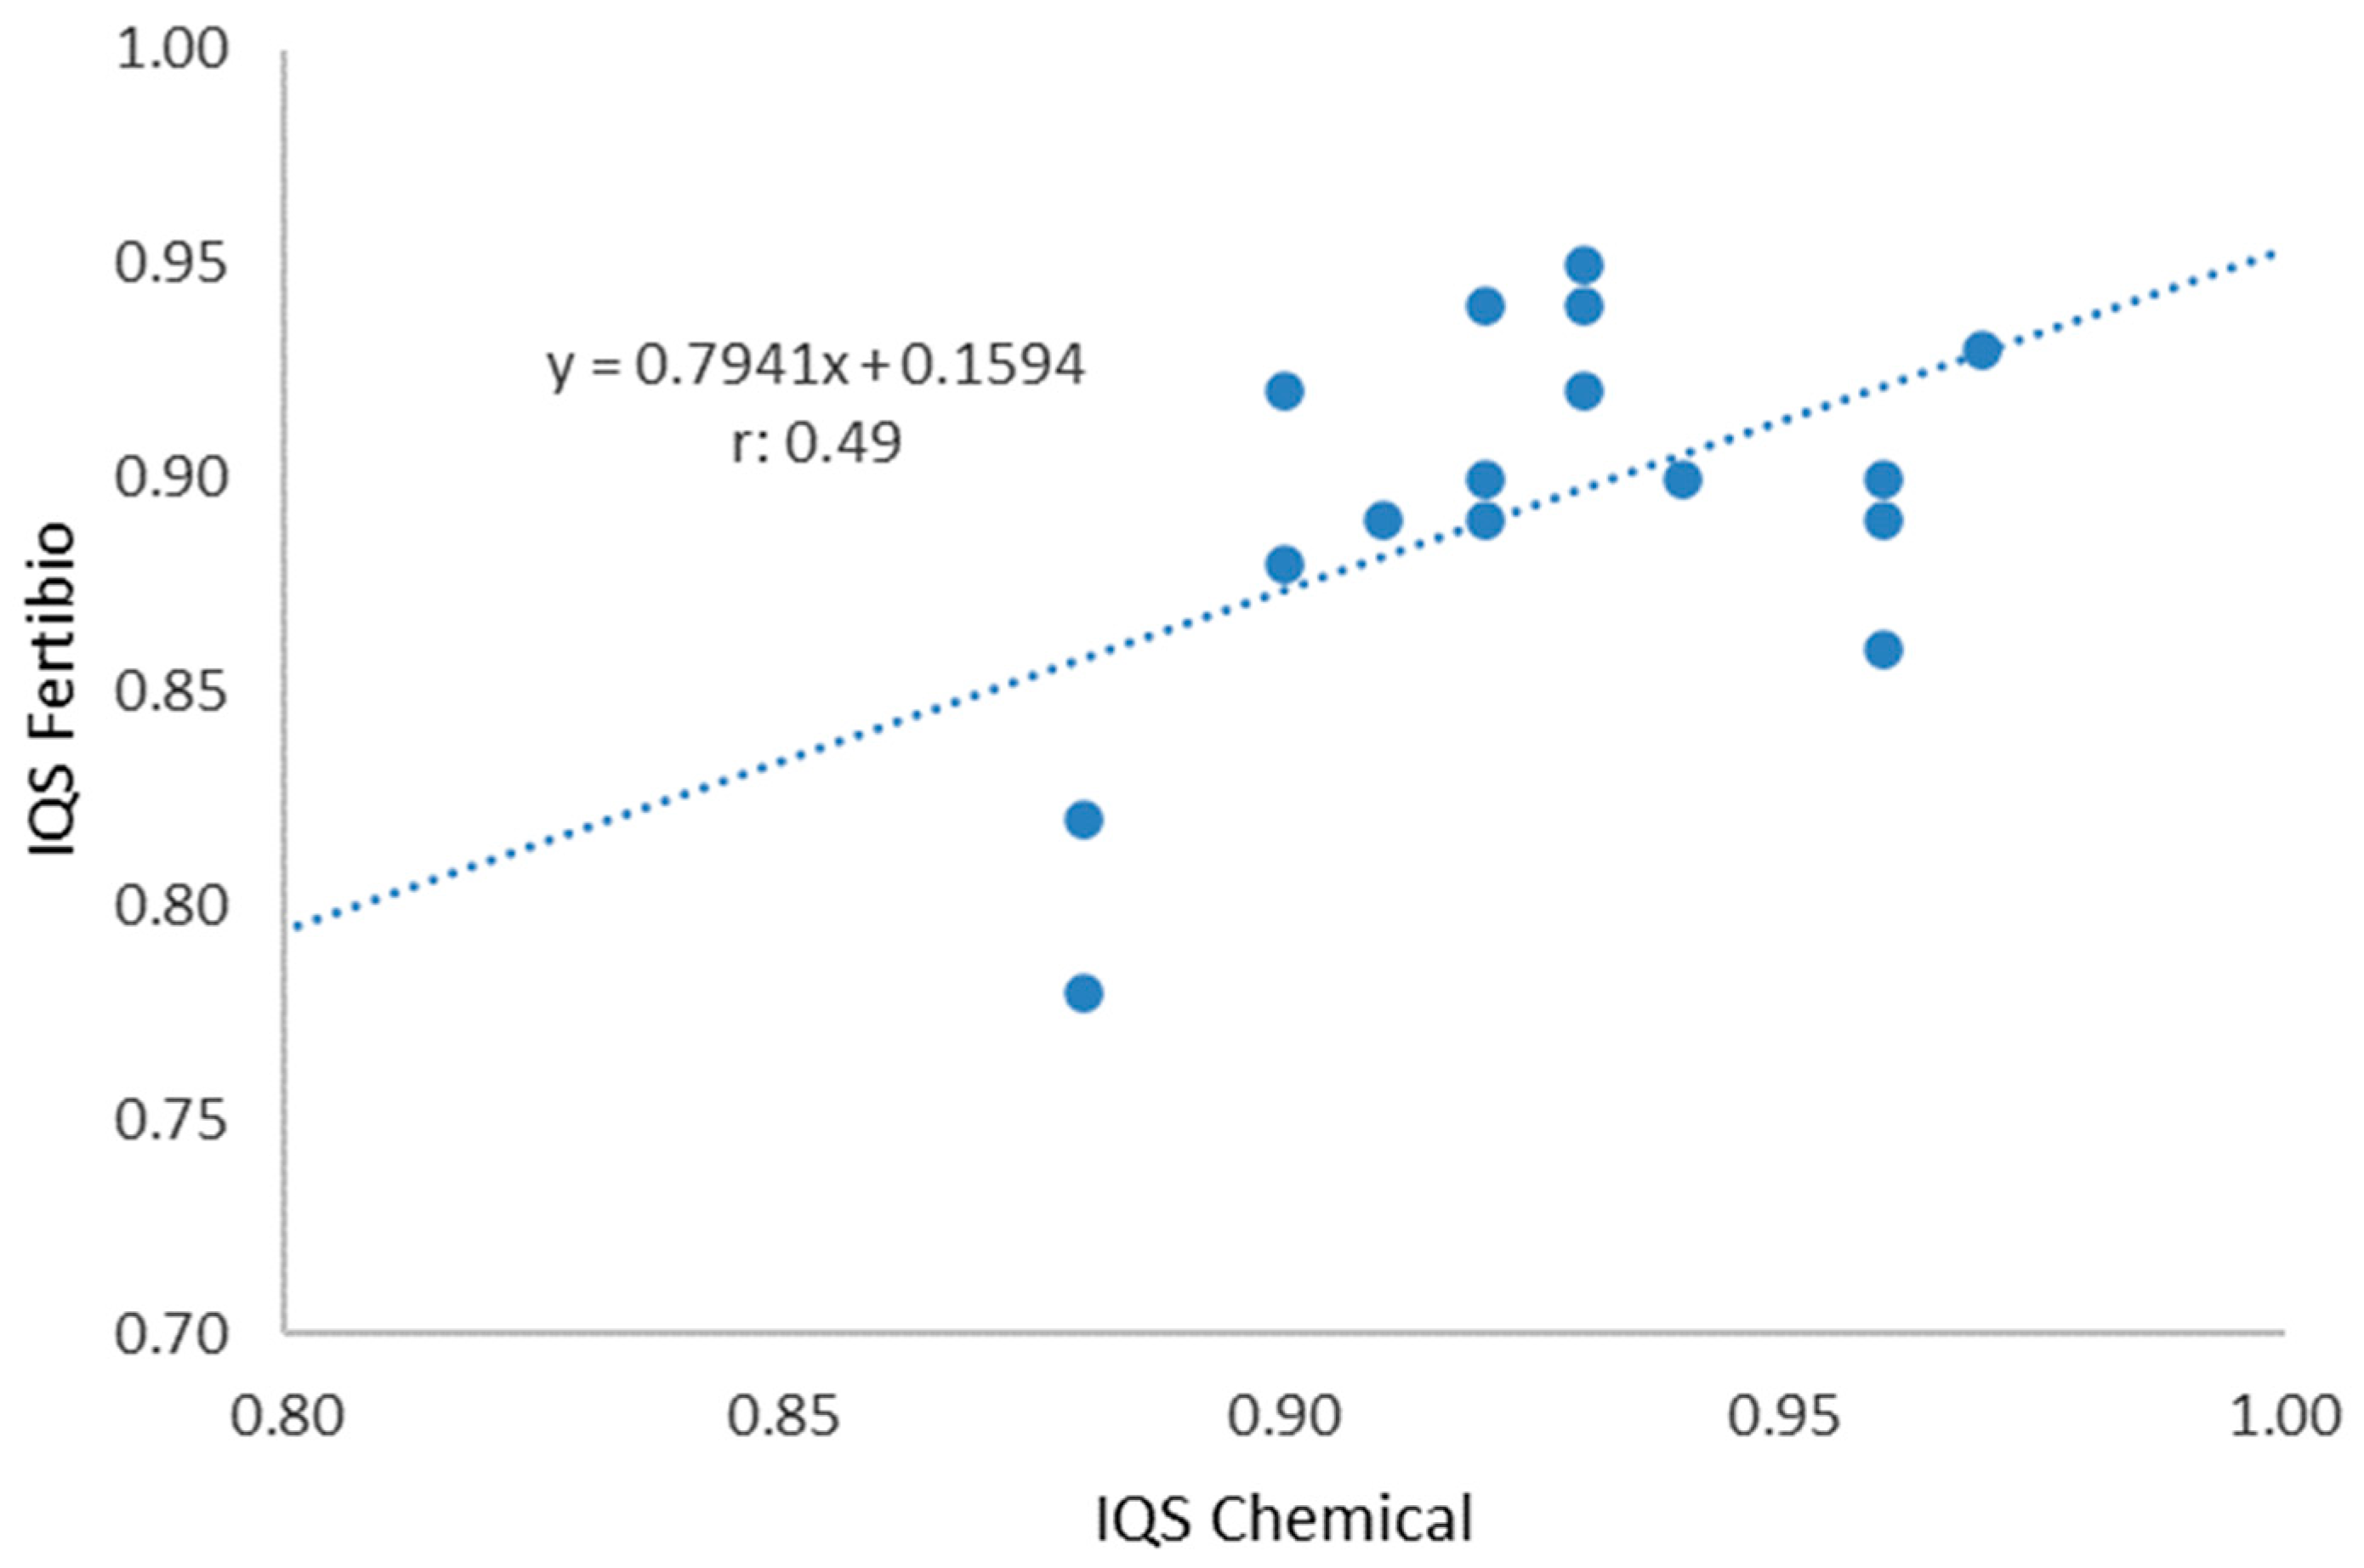
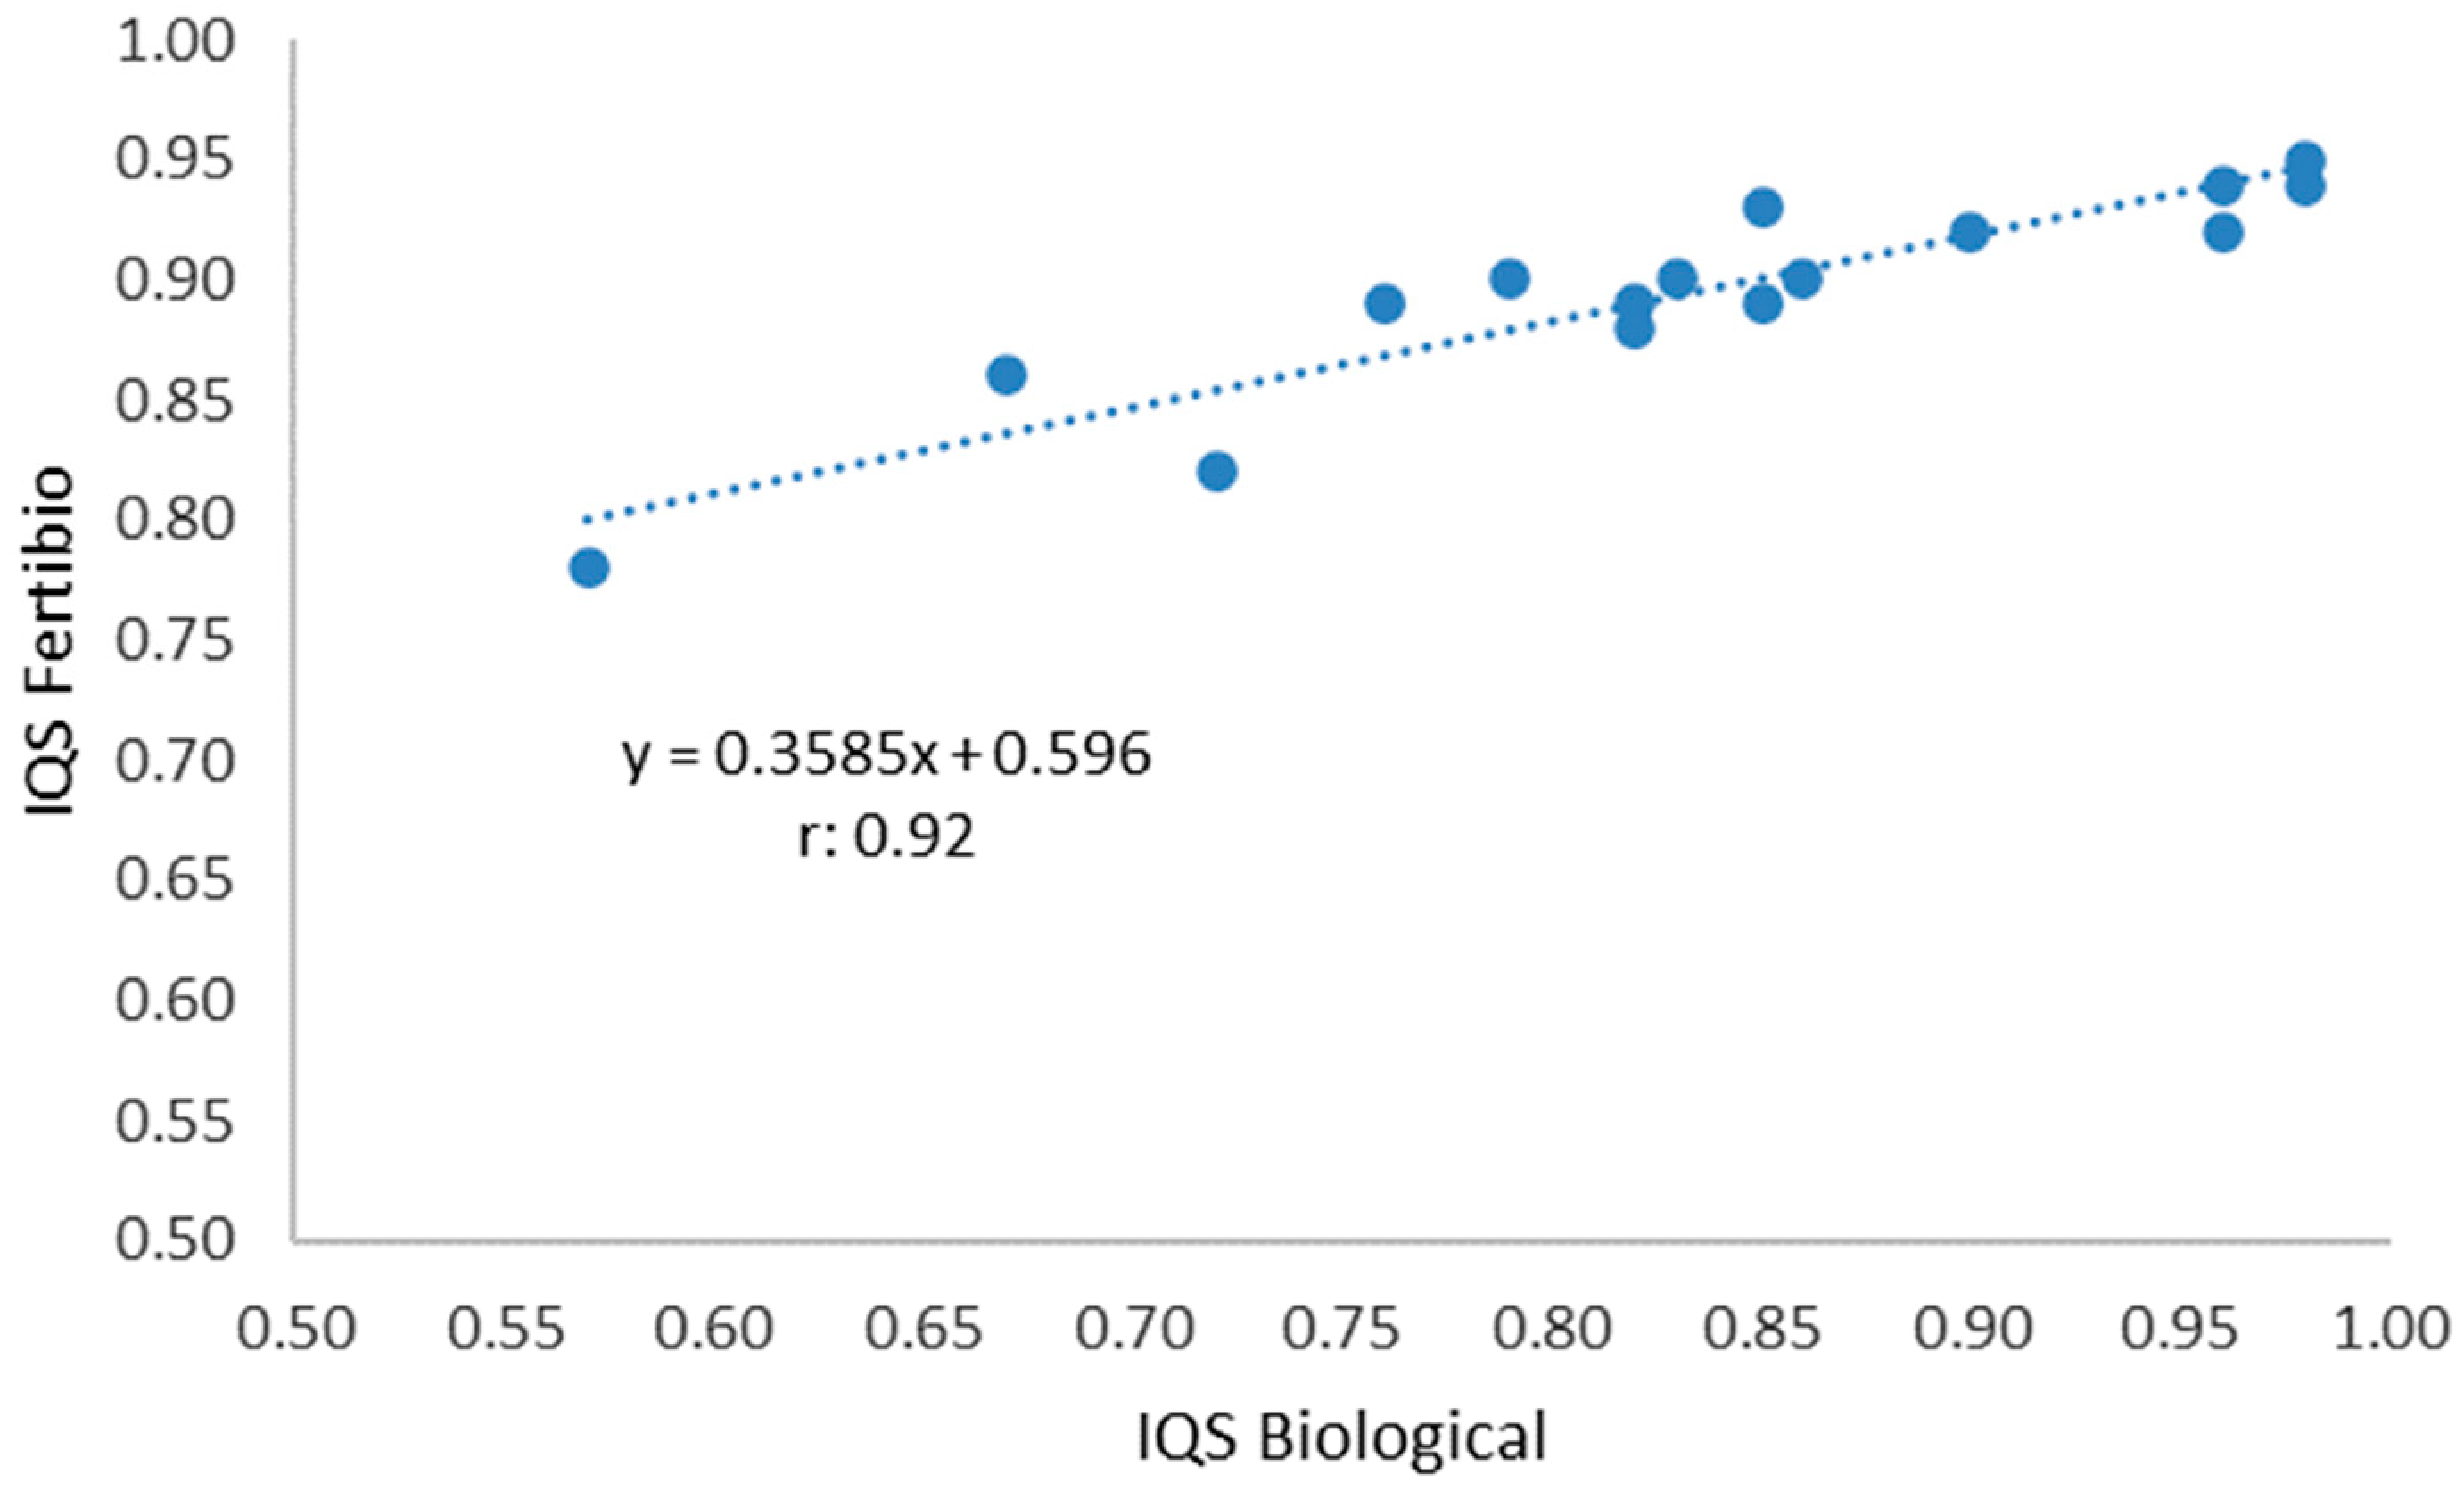
Fertibio IQS, when classified as high and very high, demonstrates conditions of stability and sustainability of systems adopted. It is worth highlighting that the knowledge of critical levels of quality indicators makes it possible to better understand soil functioning. The correlation between biological IQS and Fertibio IQS was high (r = 0.9), which indicates a strong correlation between the biological variable aspects in systems and the balance of the system used (Figure 5).
Analyzing the nutrient cycling function, treatment 3 was similar to treatment 4 and differed statistically from treatments 1 and 2, which result is in accordance with what was observed for arylsulfatase, β-glucosidase and biological IQS parameters. To determine nutrient cycling, the enzymatic activity relating the biological aspect to mineralization processes is taken into account.
Regarding nutrient storage, no statistical difference was found between production systems. To determine this function, the values found for organic matter and CEC are considered in the analysis because organic matter acts to increase soil CEC when decomposed to a level that exposes its negative charges; consequently, increasing CEC increases nutrient storage capacity. As for the nutrient supply function, treatment 2 was statistically different from treatment 4. The nutrient supply considers the other analytes determined in soil analysis, such as exchangeable bases and P content; thus, the difference found for treatment 2 can be explained by the fertilizer used in corn cultivation.
These results indicate that in crop succession systems with cash crops, they tend to reduce the activity enzymatic of arylsulfatase and β-glucosidase in the medium to long term, which are important enzymes related to biological soil quality evidenced by the biological IQS, parameters that can infer the sustainability of production systems. Therefore, the inclusion of Urochloa or other species intercropped with corn can mitigate the deleterious effect on the biological quality of the soil in the long term.

5. Conclusions

Under the study circumstances, land use with soybean, corn, millet and brachiaria crops provided adequate sustainability conditions, providing high arylsulfatase and β-glucosidase levels. The use of brachiaria showed the highest biological IQS results. Chemical IQS was not influenced by the different succession systems.
BioAS allows the farmer to monitor the health of his soil, knowing exactly what to evaluate (arylsulfatase and β-glucosidase enzymes), how to evaluate (soil collected at a depth of 0 cm–10 cm), when to evaluate (after harvest of crops) and how to interpret what was evaluated (via reference values that allow evaluating, for each type of soil, whether the level of enzymatic activity is low, medium or adequate).
However, at its current stage, the technology is formatted for areas under annual cultivation in the Brazilian Cerrado biome. By inaugurating a more comprehensive way of interpreting soil health going beyond issues of deficiency/excess of nutrients, the launch of BioAS was a success and has had a great impact on Brazilian agriculture.

Author Contributions

Conceptualization, V.B.S.C., T.M.G., A.C.T.P.B., C.H.M.d.C. and S.C.S.C.; methodology, V.B.S.C. and C.H.M.d.C.; validation, V.B.S.C., C.H.M.d.C. and S.C.S.C.; formal analysis, V.B.S.C. and C.H.M.d.C.; investigation, V.B.S.C., T.M.G. and A.C.T.P.B.; data curation, V.B.S.C., T.M.G. and C.H.M.d.C.; wrintig—original draft preparation, T.M.G. and A.C.T.P.B.; writing—review and editing, V.B.S.C., T.M.G., A.C.T.P.B., C.H.M.d.C. and S.C.S.C.; supervision, C.H.M.d.C. and S.C.S.C.; project administration, V.B.S.C. and C.H.M.d.C.; funding acquisition, V.B.S.C. and C.H.M.d.C. All authors have read and agreed to the published version of the manuscript.

Funding

This study was financially supported by the Agrisus Foundation—Sustainable Agriculture: 3150/2021; 2508/2018, Exata Laboratory and Coordination of Superior Level Staff Improvement (CAPES): 001.

Data Availability Statement

Data are contained within the article.

Conflicts of Interest

The authors declare no conflicts of interest.

Appendix A

Table A1. Average values of soil chemical attributes for sampling carried out after crop harvest. Soil pH values in CaCl2 (pH), Ca+ Mg (Calcium + Magnesium), Ca (Calcium), Mg (Magnesium), Al (Aluminum), H + Al (Hydrogen + Aluminum), K (Potassium) and P (Phosphorus) during the 21/22 harvest.
Treatments(cmolc kg−1)(mg kg−1)
pH CaCl2Ca + MgCaMgAlH + AlKP
(1) Corn + Brachiaria6.273.802.470.085.436.27145.5044.53
(2) Corn7.224.462.760.054.987.22157.2570.80
(3) Brachiaria7.204.013.200.034.707.2083.7528.65
(4) Millet7.714.503.220.004.177.7197.6728.80
Table A2. B (Boron), Cu (Copper), Fe (Iron), Mn (Manganese), Zn (Zinc) and Na (Sodium) values present in the soil for sampling carried out after crop harvest for testing conducted during the 21/22 harvest.
Treatments(mg kg−1)
BCuFeMnZn
(1) Corn + Brachiaria0.336.3822.8038.123.65
(2) Corn0.355.9021.8044.083.92
(3) Brachiaria0.295.9820.7544.103.75
(4) Millet0.315.7021.3745.433.90
Table A3. Average sulfur (S), organic carbon (SOC), organic matter (SOM), cation exchange capacity (CEC) and base saturation (V%) values in the 0–10 cm layer for sampling carried out after crop harvest for testing conducted during the 21/22 harvest.
Treatmentsmg kg−1cmolc kg−1%
SSOCSOMCECV
(1) Corn + Brachiaria19.2626.7546.1312.0554.60
(2) Corn20.5826.5345.7512.6360.28
(3) Brachiaria13.5028.1048.4512.1061.00
(4) Millet15.4027.4347.3012.1365.20
Table A4. Average soil clay, silt and sand values in the 0–10 cm layer for sampling carried out after crop harvest for testing conducted during the 21/22 harvest.
Treatmentsg kg−1
ClaySiltSand
(1) Corn + Brachiaria562.5062.50375.00
(2) Corn568.7556.25375.00
(3) Brachiaria537.5062.50400.00
(4) Millet550.0066.67383.33

References

  1. Ritz, K.; Black, H.I.; Campbell, C.D.; Harris, J.A.; Wood, C. Selecting biological indicators for monitoring soils: A framework for balancing scientific and technical opinion to assist policy development. Ecol. Indic. 2009, 6, 1212–1221. [Google Scholar] [CrossRef]
  2. Almeida, R.F.; Naves, E.R.; da Mota, R.P. Soil quality: Enzymatic activity of soil β-glucosidase. Glob. J. Agric. Res. Rev. 2015, 2, 146–150. [Google Scholar]
  3. Utobo, E.B.; Tewari, L. Soil enzymes as bioindicators of soil ecosystem status. Appl. Ecol. Environ. Res. 2015, 1, 147–169. [Google Scholar] [CrossRef]
  4. Moghimian, N.; Hosseini, S.M.; Kooch, Y.; Darki, B.Z. Impacts of changes in land use/cover on soil microbial and enzyme activities. Catena 2017, 157, 407–414. [Google Scholar] [CrossRef]
  5. Kizilkaya, R.; Dengiz, O. Variation of land use and land cover effects on some soil physico-chemical characteristics and soil enzyme activity. Zemdirbyste-Agriculture 2010, 2, 15–24. [Google Scholar]
  6. de Mendes, I.C.; de Sousa, D.M.G.; dos Reis Junior, F.B. Bioindicadores de qualidade de solo: Dos laboratórios de pesquisa para o campo. Cad. Ciênc. Tecnol. 2017, 32, 191–209. [Google Scholar]
  7. Zaninetti, R.A.; Moreira, A.; Moraes, L.A.C. Atributos físicos, químicos e biológicos de Latossolo Amarelo na conversão de floresta primária para seringais na Amazônia. Pesqui. Agropecu. Bras. 2016, 51, 1061–1068. [Google Scholar] [CrossRef]
  8. de Mendes, I.C.; Chaer, G.M.; de Sousa, D.M.G.; dos Reis Junior, F.B.; de Lopes, A.A.C.; de Souza, L.M. Bioanálise de solo: A mais nova aliada para a sustentabilidade agrícola. Nutr. Plantas Ciênc. Tecnol. 2020, 8, 1–11. [Google Scholar]
  9. Costa, N.R.; Andreotti, M.; de Ulian, N.A.; Costa, B.S.; Pariz, C.M.; Cavasano, F.A.; Teixeira Filho, M.C.M. Produtividade da soja sobre palhada de forrageiras semeadas em diferentes épocas e alterações químicas no solo. Rev. Bras. Ciênc. Agrár. 2015, 1, 8–16, 2015. [Google Scholar] [CrossRef]
  10. Rocha, L.; Rodrigues, C.; Santana, L.; Silva, A.; Araújo, M. Análise econômica de soja e milho safrinha em sucessão de culturas. Enciclopédia Biosf. 2019, 16, 29. [Google Scholar] [CrossRef]
  11. Herrada, R.M.; Leandro, M.W.; Ferreira, B.P.E. Leguminosas isoladas e consorciadas com milheto em diferentes sistemas de manejo do solo no feijão orgânico. Terra Lat.-Am. 2017, 35, 293–299. [Google Scholar] [CrossRef]
  12. de Gazola, N.R.; De Melo, M.M.L.; Dinalli, P.R.; Teixeira Filho, M.C.M.; de Celestino, S.T. Cultura da soja em sucessão ao cultivo de milho em consórcio com braquiárias. Rev. Cult. Agronômica 2017, 3, 225–236. [Google Scholar] [CrossRef]
  13. Tyler, H.L. Winter cover crops and no till management enhance enzyme activities in soybean field soils. Pedobiologia 2020, 81–82, 150666. [Google Scholar] [CrossRef]
  14. Drinkwater, L.E.; Snapp, S.S. Nutrients in agroecosystems: Re-thinking the management paradigm. Adv. Agron. 2007, 92, 163–186. [Google Scholar] [CrossRef]
  15. Nicolodi, M.; Gianello, C.; Anghinoni, I.; Marré, J.; Mielniczuk, J. Insuficiência do conceito mineralista para expressar a fertilidade do solo percebida pelas plantas cultivadas no sistema plantio direto. Rev. Bras. Ciênc. Solo 2008, 32, 2735–2741. [Google Scholar] [CrossRef]
  16. Mendes, I.C.; Sousa, D.M.G.; Reis Junior, F.B.; Kappes, C.; Ono, F.B.; Semler, T.D.; Zancanaro, L.; Lopes, A.A.C. Qualidade biológica do solo: Por que e como avaliar. Bol. Pesqui. Fundação MT 2017, 1, 98–105. [Google Scholar]
  17. Mendes, I.C.; Ono, F.B.; Oliveira, M.I.; Silva, R.G.; Kappes, C.; Reis Junior, F.B.; Zancanaro, L. Rotação de culturas, bioindicadores e saúde do solo. In Rotação de Culturas, Bioindicadores e Saúde do Solo, 19th ed.; Silva, P.A., Oliveira, L.C., Org.; Fundação: Rondonópolis, MT, Brazil, 2020; Volume 19, pp. 102–110. [Google Scholar]
  18. Piotrowska-Długosz, A.; Siwik-ziomek, A.; Długosz, J.; Gozdowski, D. Spatio-temporal variability of soil sulfur content and arylsulfatase activity at a conventionally managed arable field. Geoderma 2017, 295, 107–118. [Google Scholar] [CrossRef]
  19. Batista, E.R.; Zanchi, C.S.; Ferreira, D.A.; Santiago, F.L.A.; Pinto, F.A.; dos Santos, J.V.; Paulino, H.B.; Carneiro, M.A.C. Atributos biológicos do solo em sistema integrado de produção agropecuária. In Sistemas Integrados de Produção Agropecuária no Brasil; de Souza, E.D., da Silva, F.D., Assmann, T.S., Carneiro, M.A.C., de Faccio Carvalho, P.C., Paulino, H.B., Eds.; Copiart: Tubarão, SC, Brazil, 2018; Chapter 5; pp. 71–90. ISBN 978-85-8388-111-7. [Google Scholar]
  20. Silva, L.C.; Mesquita, J.A.; da Silva, J.A.; Ferreira, K.A.L.; Ferreira, P.F.A.; Barros, J.R.S. Influência do sistema de cultivo na atividade da sulfohidrolase em cultivo de feijão (Phaseolus vulgaris). Cad. Agroecol. 2020, 15, 2. [Google Scholar]
  21. Wyszkowska, J.; Wieczorek, K.; Kucharski, J. Resistance of Arylsulfatase to Contamination of Soil by Heavy Metals. Pol. J. Environ. Stud. 2016, 25, 1. [Google Scholar] [CrossRef]
  22. Chen, H.; Liu, J.; Li, D.; Xiao, K.; Wang, K. Controls on soil arylsulfatase activity at a regional scale. Eur. J. Soil Biol. 2019, 90, 9–14. [Google Scholar] [CrossRef]
  23. Stieven, A.C.; Mendes, W.M.; Wruck, F.; Couto, E.G.; Campos, D.T.S. Atributos do Solo em Sistemas Diferenciados de Uso e Manejo do Solo. Colloq. Agrar. 2020, 16, 1–15. [Google Scholar] [CrossRef]
  24. Trannin, I.C.D.B.; Siqueira, J.O.; Moreira, F.M.D.S. Características biológicas do solo indicadoras de qualidade após dois anos de aplicação de biossólido industrial e cultivo de milho. Rev. Bras. Ciênc. Solo 2007, 31, 1173–1184. [Google Scholar] [CrossRef]
  25. Lopes, A.A.C.; Sousa, D.M.G.; Chaer, G.M.; Reis Junior, F.B.; Goedert, W.J.; Mendes, I.C. Interpretation of microbial soil indicators as a function of crop yield and organic carbon. Soil Sci. Soc. Am. 2013, 77, 461–472. [Google Scholar] [CrossRef]
  26. Lopes, A.A.C.; Sousa, D.M.G.; Reis Junior, F.B.; Figueiredo, C.C.; Malaquias, J.V.; Souza, L.M.; Mendes, I.C. Temporal variation and critical limits of microbial indicators in oxisols in the Cerrado, Brazil. Geoderma Reg. 2018, 12, 72–82. [Google Scholar] [CrossRef]
  27. Mendes, I.C.; Sousa, D.M.G.; Reis Junior, F.B.; Lopes, A.A.C.; Souza, L.M. Bioanálise de solo: Aspectos teóricos e práticos. Tóp. Ciênc. Solo 2019, 10, 399–462. [Google Scholar]
  28. Embrapa. BioAS—Tecnologia de Bioanálise de Solo. 2021. Available online: https://www.embrapa.br/busca-de-solucoes-tecnologicas/-/produtoservico/6047/bioas--tecnologia-de-bioanalise-de-solo- (accessed on 24 November 2021).
  29. de Silva, M.O.; dos Santos, M.P.; da Paz Sousa, A.C.; da Silva, R.L.V.; de Moura, I.A.A.; da Silva, R.S.; da Silva Costa, K.D. Qualidade do solo: Indicadores biológicos para um manejo sustentável. Braz. J. Dev. 2021, 1, 6853–6875. [Google Scholar] [CrossRef]
  30. de Mendes, I.C.; Chaer, G.M.; de Sousa, D.M.G.; dos Reis Junior, F.B.; da Silva, O.D.D.; de Oliveira, M.I.L.; de Lopes, A.A.C. Bionálise do Solo Como Acessar e Interpretar a Saúde do Solo; Embrapa Cerrados: Planaltina, DF, Brazil, 2018; p. 24. [Google Scholar]
  31. Tabatabai, M.A. Soil enzymes. In Methods of Soil Analysis. Part 2. Microbiological and Biochemical Properties; Bottomley, P.J., Scott Angle, J.S., Weaver, R.W., Eds.; Soil Science Society of America: Madison, WI, USA, 2018; Chapter 37; pp. 775–834. ISBN 978-0-891-18865-0. [Google Scholar]
  32. Van Raij, B.; de Andrade, J.C.; Cantarella, H.; Quaggio, J.A. Análise Química para Avaliação da Fertilidade de Solos Tropicais; Instituto Agronômico: Campinas, SP, Brazil, 2001; 285p. [Google Scholar]
  33. Vitti, G.C. Avaliação e Interpretação do Enxofre no Solo E Planta; FUNEP: Jaboticabal, SP, Brazil, 1989; pp. 1–37. [Google Scholar]
  34. Mendes, I.C.; Souza, L.V.; Resck, D.V.S.; Gomes, A.C. Biological properties of aggregates from a Cerrado Oxisol under conventional and no-till management systems. Rev. Bras. Ciênc. Solo 2003, 27, 435–443. [Google Scholar] [CrossRef]
  35. Mendes, I.C.; Sousa, D.M.G.; Dantas, O.D.; Lopes, A.A.C.; Junior, F.B.R.; Oliveira, M.I.; Chaer, G.M. Soil quality and grain yield: A win-win combination in clayey tropical Oxisols. Geoderma 2021, 388, 114880. [Google Scholar] [CrossRef]
  36. Barbosa, J.C.; Maldonado Junior, W. AgroEstat—Sistema para Análises Estatísticas de Ensaios Agronômicos; Universidade Estadual Paulista “Júlio de Mesquita Filho”: Jaboticabal, SP, Brazil, 2015. [Google Scholar]
  37. Sobucki, L.; Ramos, R.F.; Meireles, L.A.; Antoniolli, Z.I.; Jacques, R.J.S. Contribution of enzymes to soil quality and the evolution of research in Brazil. Rev. Bras. Ciênc. Solo 2021, 45, 1–18. [Google Scholar] [CrossRef]
  38. Mendes, I.C.; Sousa, D.M.G.; Reis Junior, F.B.; Lopes, A.A.C. Indicadores de qualidade biológica para manejo sustentável de solos arenosos. Bol. Inf. Soc. Bras. Ciênc. Solo 2018, 44, 20–25. [Google Scholar]
  39. Mendes, I.C.; Souza, L.M.; Sousa, D.M.G.; Lopes, A.A.C.; Reis Junior, F.B.; Lacerda, M.P.C.; Malaquias, J.V. Critical limits for microbial indicators in tropical Oxisols at post-harvest: The FERTBIO soil sample concept. Appl. Soil Ecol. 2019, 139, 85–93. [Google Scholar] [CrossRef]
  40. Longo, R.M.; Ribeiro, A.Í.; Melo, W.J.D. Recuperação de solos degradados na exploração mineral de cassiterita: Biomassa microbiana e atividade da desidrogenase. Bragantia 2011, 70, 132–138. [Google Scholar] [CrossRef]
  41. Nogueira, M.A.; Melo, W.J. Enxofre disponível para a soja e atividade de arilsulfatase em solo tratado com gesso agrícola. Rev. Bras. Ciênc. Solo 2003, 27, 655–663. [Google Scholar] [CrossRef]
  42. Fois, D.A.F.; do Carmo Lana, M.; Vera, L.R.Q.; Alvarez, J.W.R.; Rojas, C.A.L.; Tiecher, T. Efeito do gesso agrícola na disponibilidade de enxofre e no rendimento da soja e milho safrinha. Rev. Cultiv. Saber 2017, 10, 35–47. [Google Scholar]
  43. Zago, L.D.M.S.; Oliveira, R.N.; Bombonatto, A.K.G.; De Oliveira Moreira, L.M.; De Paiva Melo, E.N.; Caramori, S.S. Enzimas Extracelulares de Solos de Cerrado como Bioindicadores de Qualidade em Áreas Agricultáveis em Goiás, Brasil. Front. J. Soc. Technol. Environ. Sci. 2016, 5, 104–127. [Google Scholar] [CrossRef]
  44. Karlen, D.L.; Stott, D.E. A framework for evaluating physical and chemical indicators of soil quality. In Defining Soil Quality for a Sustainable Environment; Doran, J.W., Coleman, D.C., Bezdicek, D.R., Stewart, B.A., Eds.; Soil Science Society of America: Madison, WI, USA, 1994; pp. 53–72. [Google Scholar] [CrossRef]
  45. Mendes, I.C.; Marchão, R.L.; Junior, F.B.R.; Chaer, G.M.; Salton, J.C.; Vilela, L.; Benites, V.M. Saúde do solo em sistemas de integração lavoura pecuária. In Manejo do Solo em Sistemas Integrados de Produção; Martins, A.G., Batista, A.H., Wendling, B., Pereira, M.G., Santos, W.O., Eds.; Atena: Ponta Grossa, PR, Brazil, 2022; Chapter 7; pp. 189–223. ISBN 978-65-258-0445-3. [Google Scholar]
Figure 1. Pearson’s correlation coefficient (r) between β-glucosidase activity in µg of p-nitrophenyl g−1 h−1 and soil organic carbon content (g kg−1) for all production systems.
Agronomy 14 00810 g001
Figure 2. Pearson’s correlation coefficient (r) between arylsulfatase activity in µg of p-nitrophenyl g−1 h−1 and S content (mg·dm−3).
Agronomy 14 00810 g002
Figure 3. Pearson’s correlation coefficient (r) between arylsulfatase activity in µg of p-nitrophenyl g−1 h−1 and soil matter content (g kg−1).
Agronomy 14 00810 g003
Figure 4. Pearson’s correlation coefficient (r) between Fertibio IQS and chemical IQS.
Agronomy 14 00810 g004
Figure 5. Pearson’s correlation coefficient (r) between Fertibio IQS and biological IQS.
Agronomy 14 00810 g005
Table 1. Succession systems in which the samples to conduct the experiment were collected.
TreatmentsCrop Succession Systems
1Soybean/Corn + Brachiaria
2Soybean/Corn
3Soybean/Brachiaria
4Soybean/Millet
Table 2. Soil density (SD) and total soil porosity (TP) testing conducted in October 2022.
Treatmentskg dm−3%
SDTP
(1) Corn + Brachiaria1.3445.0
(2) Corn1.4043.3
(3) Brachiaria1.3447.9
(4) Millet1.2851.5
Table 3. Average activity values of ARIL in µg of p-nitrophenyl g−1 h−1 (arylsulfatase) and BETA in p-nitrophenyl g−1 h−1 (β-glucosidase), biological quality index (biological IQS), chemical quality index (chemical IQS), soil quality index (FERTIBIO IQS) of areas cultivated under different succession systems.
Production System* ARIL [µg of p-Nitrophenyl g−1 h−1]BETA [µg of p-Nitrophenyl g−1 h−1]Biological IQSChemical IQSFERTIBIO IQS
(1) Corn + Brachiaria88.00 b129.50 b0.77 b0.91 a0.87 a
(2) Corn84.25 b139.00 b0.77 b0.95 a0.89 a
(3) Brachiaria128.75 a238.00 a0.94 a0.92 a0.92 a
(4) Millet108.25 ab177.25 ab0.85 ab0.91 a0.88 a
DMS (5%)36.1275.510.140.050.06
CV (%)15.9920.017.662.283.23
Means followed by the same letter in the column are not different from each other at the 5% probability level by the test of Tukey. * BioAS report generated by the Soil Quality Interpretation Module MIQS platform. In the BioAS report, indices are also represented in a “semaphore” chromatic pattern, where dark green or light green mean adequate values (very high and high, respectively), yellow, intermediate values, and orange or red, inadequate values.
Table 4. Average values of cycling, storage, and nutrient supply functions of areas cultivated under different succession systems.
TreatmentsNutrient Cycling **Nutrient StorageNutrient Supply
(1) Corn + Brachiaria0.77 b *0.92 a0.91 ab
(2) Corn0.77 b0.94 a0.96 a
(3) Brachiaria0.94 a0.95 a0.89 ab
(4) Millet0.85 ab0.94 a0.87 b
DMS (5%)0.140.040.07
CV (%)7.662.133.7
* Means followed by the same letter in the column are not different from each other at the 5% probability level by the test of Tukey. ** In the BioAS report, indices are also represented in a “semaphore” chromatic pattern, where dark green or light green mean adequate values (very high and high, respectively).
Disclaimer/Publisher’s Note: The statements, opinions and data contained in all publications are solely those of the individual author(s) and contributor(s) and not of MDPI and/or the editor(s). MDPI and/or the editor(s) disclaim responsibility for any injury to people or property resulting from any ideas, methods, instructions or products referred to in the content.

