Abstract
Determining a suitable “dry sowing and wet emergence” water control program for cotton fields in the arid regions of Northwest China is of great significance in saving water resources, improving economic efficiency, and promoting sustainable development of agriculture. The objective of this study was to analyze the effects of different “dry sowing and wet emergence” water control treatments on dry matter accumulation, chlorophyll fluorescence, yield quality, and water productivity of cotton, and to determine the optimal “dry sowing and wet emergence” water control program for cotton growth in arid areas. A two-year experiment was carried out in 2021 and 2022 in mulched drip-irrigated cotton fields, with a total of 13 treatments of different seedling water quantities (2021: 67.5 mm, 90 mm, 112.5 mm; 2022: 6 mm, 10.5 mm, 15 mm) and different drip frequencies (frequencies means number of drops at seedling stage) (2021: one, two, three times; 2022: two times, four times) in the “dry sowing and wet emergence”. Results indicated a positive correlation between increased seedling water quantity and growth indexes. High seedling water quantity treatment demonstrated a 14.33% higher cotton yield than the low seedling water quantity treatment. In comparison with low-frequency treatment, the high-frequency treatment exhibited significantly larger cotton plant height, dry matter accumulation, and yield. Over two years, the average values increased by 8.69%, 16.4%, and 15.91%, respectively, with a 14.55% increase in the coefficient of photochemical quenching of the leaf blade (qP). The high frequency and larger amount of seedling water quantity treatments showed significantly higher irrigation water productivity, with increases of 39.2% and 70.2% compared to the winter irrigation control treatment. In summary, the appropriate “dry sowing wet emergence” water regulation mode (the first drip: 15 mm, the second drip: 4.5 mm, the third drip: 22.5 mm, the fourth drip: 15 mm) can ensure crop yield quality under the premise of significantly reducing the agricultural irrigation water, which can provide certain theoretical support for the green, efficient, and sustainable development of the local cotton industry.
1. Introduction
Xinjiang is situated in the arid northwestern region of China, grappling with severe freshwater scarcity, limited agricultural water supply, and intense pressure on water allocation [1,2,3]. Serving as a vital high-quality cotton production hub in China and representing a paradigmatic instance of pure irrigated agriculture, Xinjiang utilizes approximately 95% of its water for agriculture. The majority of cotton cultivation necessitates winter irrigation for soil salt removal and spring irrigation to maintain soil moisture pre-planting [4,5]. With the implementation of the “three red lines” water resources management system [6,7], the region faces challenges in meeting water demands for winter and spring irrigation. Consequently, the research and development of innovative agricultural water-saving irrigation technology have emerged as pivotal strategies to enhance water resource utilization in the arid regions of Northwest China, ensuring the sustainable development of the agricultural economy [8,9].
Cotton “dry sowing and wet emergence” technology involves harvesting the previous crop, crushing the straw, and returning it to the field, turning the original winter and spring irrigation water storage and moisture preservation mode into the sowing of mulch moisture preservation and drip irrigation to replenish moisture. In comparison to traditional winter and spring irrigation methods, the innovative water-saving irrigation technique of “dry sowing and wet emergence” eliminates the need for pre-sowing irrigation. Instead, it requires precise dripping of the appropriate seedling water post-sowing, exhibiting characteristics such as high-water utilization, robust seedling emergence, and cost-effectiveness [10]. Utilizing the “dry sowing wet emergence” technology in cotton field production, the Xinjiang Construction Corps can save 2550 m3 of production water per hectare, resulting in cost savings exceeding 60 yuan [11]. The implementation of “double-film mulching” technology proves effective in preventing natural disasters in the southern Xinjiang region, characterized by frequent extreme weather events such as sandstorms, hailstorms, and high winds. This technology offers advantages in water retention, seedling preservation, salt suppression, and salt control [12]. The water control technology of “dry sowing and wet emergence” under the condition of “double-film cover” plays a pivotal role in mitigating regional water scarcity, reducing costs, and increasing the income of cotton farmers.
“Dry sowing and wet emergence” technology mainly uses drip irrigation under the membrane for water conservation, heat preservation, and moisture retention. Drip irrigation under the membrane can effectively utilize water resources, but also reduce soil water evaporation and ground temperature loss, which can provide a good soil and water environment for the growth of cotton seedlings. Yuan, et al. (2023) [13] found that, under the condition of “dry sowing and wet emergence”, a large amount of irrigation is not conducive to the growth of cotton. Yuan, et al. found that too much water will lead to lower ground temperature, affecting the growth of cotton seedlings; 67.5~90 mm irrigation and 2~3 times the frequency of irrigation is more conducive to the growth of cotton. Zheng, et al. (2023), Han, et al. (2023) [14,15], and other studies show that a smaller amount of irrigation cannot keep the fertility of the cotton compared to normal water demand; cotton growth slowed down due to water stress and photosynthesis is significantly reduced. Tang et al. [16] demonstrated that regulating irrigation with root zone water, particularly deficit irrigation in the root zone, decreased above-ground biomass accumulation. Simultaneously, there was a significant increase in the accumulation of root biomass in the below-ground root system. Despite a certain decrease in both reproductive and nutrient growth, no significant reduction in yield was observed. Lokhande and Reddy [17] conducted four irrigation water conditioning treatments and found that under severe water deficit (40% evapotranspiration), seed cotton weight, number of bolls, and total biomass decreased significantly; cotton fiber length and strength decreased linearly with increasing water stress and seed cotton weight; and total biomass increased gradually with decreasing water stress. Brewer et al. and Ünlü et al. [18,19] conducted experiments with different irrigation water gradients in arid regions and found that yield response was sensitive to soil moisture conditions, and that water under-irrigation treatments significantly affected the crop’s seed cotton yield and dry matter accumulation, and progressively decreased with increasing soil water deficit. In summary, crop physiological growth indexes under drip irrigation conditions may be significantly different due to condition factors such as different water irrigation, different number of drips, and different drip zoning, etc. To synthesize the above aspects of the upcoming study, it was hypothesized that (i) the higher the irrigated seedling water quantity, the greater the dry matter accumulation and yield indexes of cotton will be. (ii) The higher the number of irrigations, the smaller the cotton chlorophyll fluorescence physiological indicators. (iii) Changes in cotton fiber quality characteristics are more relevant to irrigation seedling water quantity than drip frequency.
At present, the technology of “dry sowing and wet emergence double-film cover” in the southern border area is not mature, because the “double-film cover” condition of “dry sowing and wet emergence” water regulation affects the physiology of the crop, and the growth characteristics of the crop are complex and variable. In addition, it is important to explore the response mechanism of yield, quality, and water production efficiency to “dry sowing and wet emergence” water regulation, and to determine the appropriate “double-film cover dry sowing and wet emergence” water regulation program. In addition, the previous research on cotton physiology, growth, and water productivity mainly focused on the traditional winter and spring irrigation or under-membrane drip irrigation single-film cover technology. Although the salt pressure effect is better, the utilization rate of agricultural water resources is extremely low. Therefore, this study was carried out in the arid region of Northwest China for a period of two years to study the effect of “dry sowing and wet emergence” water regulation on cotton physiology, growth characteristics, and water production efficiency under the condition of “double-film cover”. The study aimed to realize the following objectives: (i) To study the effects of different “dry sowing and wet emergence” water control on crop physiology (chlorophyll fluorescence parameters) and growth (plant height, stem thickness, dry matter accumulation) characteristics. (ii) To clarify the correlation between chlorophyll fluorescence parameters and dry matter accumulation, construct fitting equations will be used to explore the chlorophyll fluorescence parameters that best fit dry matter accumulation. (iii) Explore the response relationship between the irrigation water quantity and drip frequency of “dry sowing and wet emergence” and the yield, fiber quality, and water production efficiency, and calculate the seedling water quantity and drip frequency required to maximize crop yield, quality, and irrigation water production efficiency.
2. Materials and Methods
2.1. Overview of the Test Site
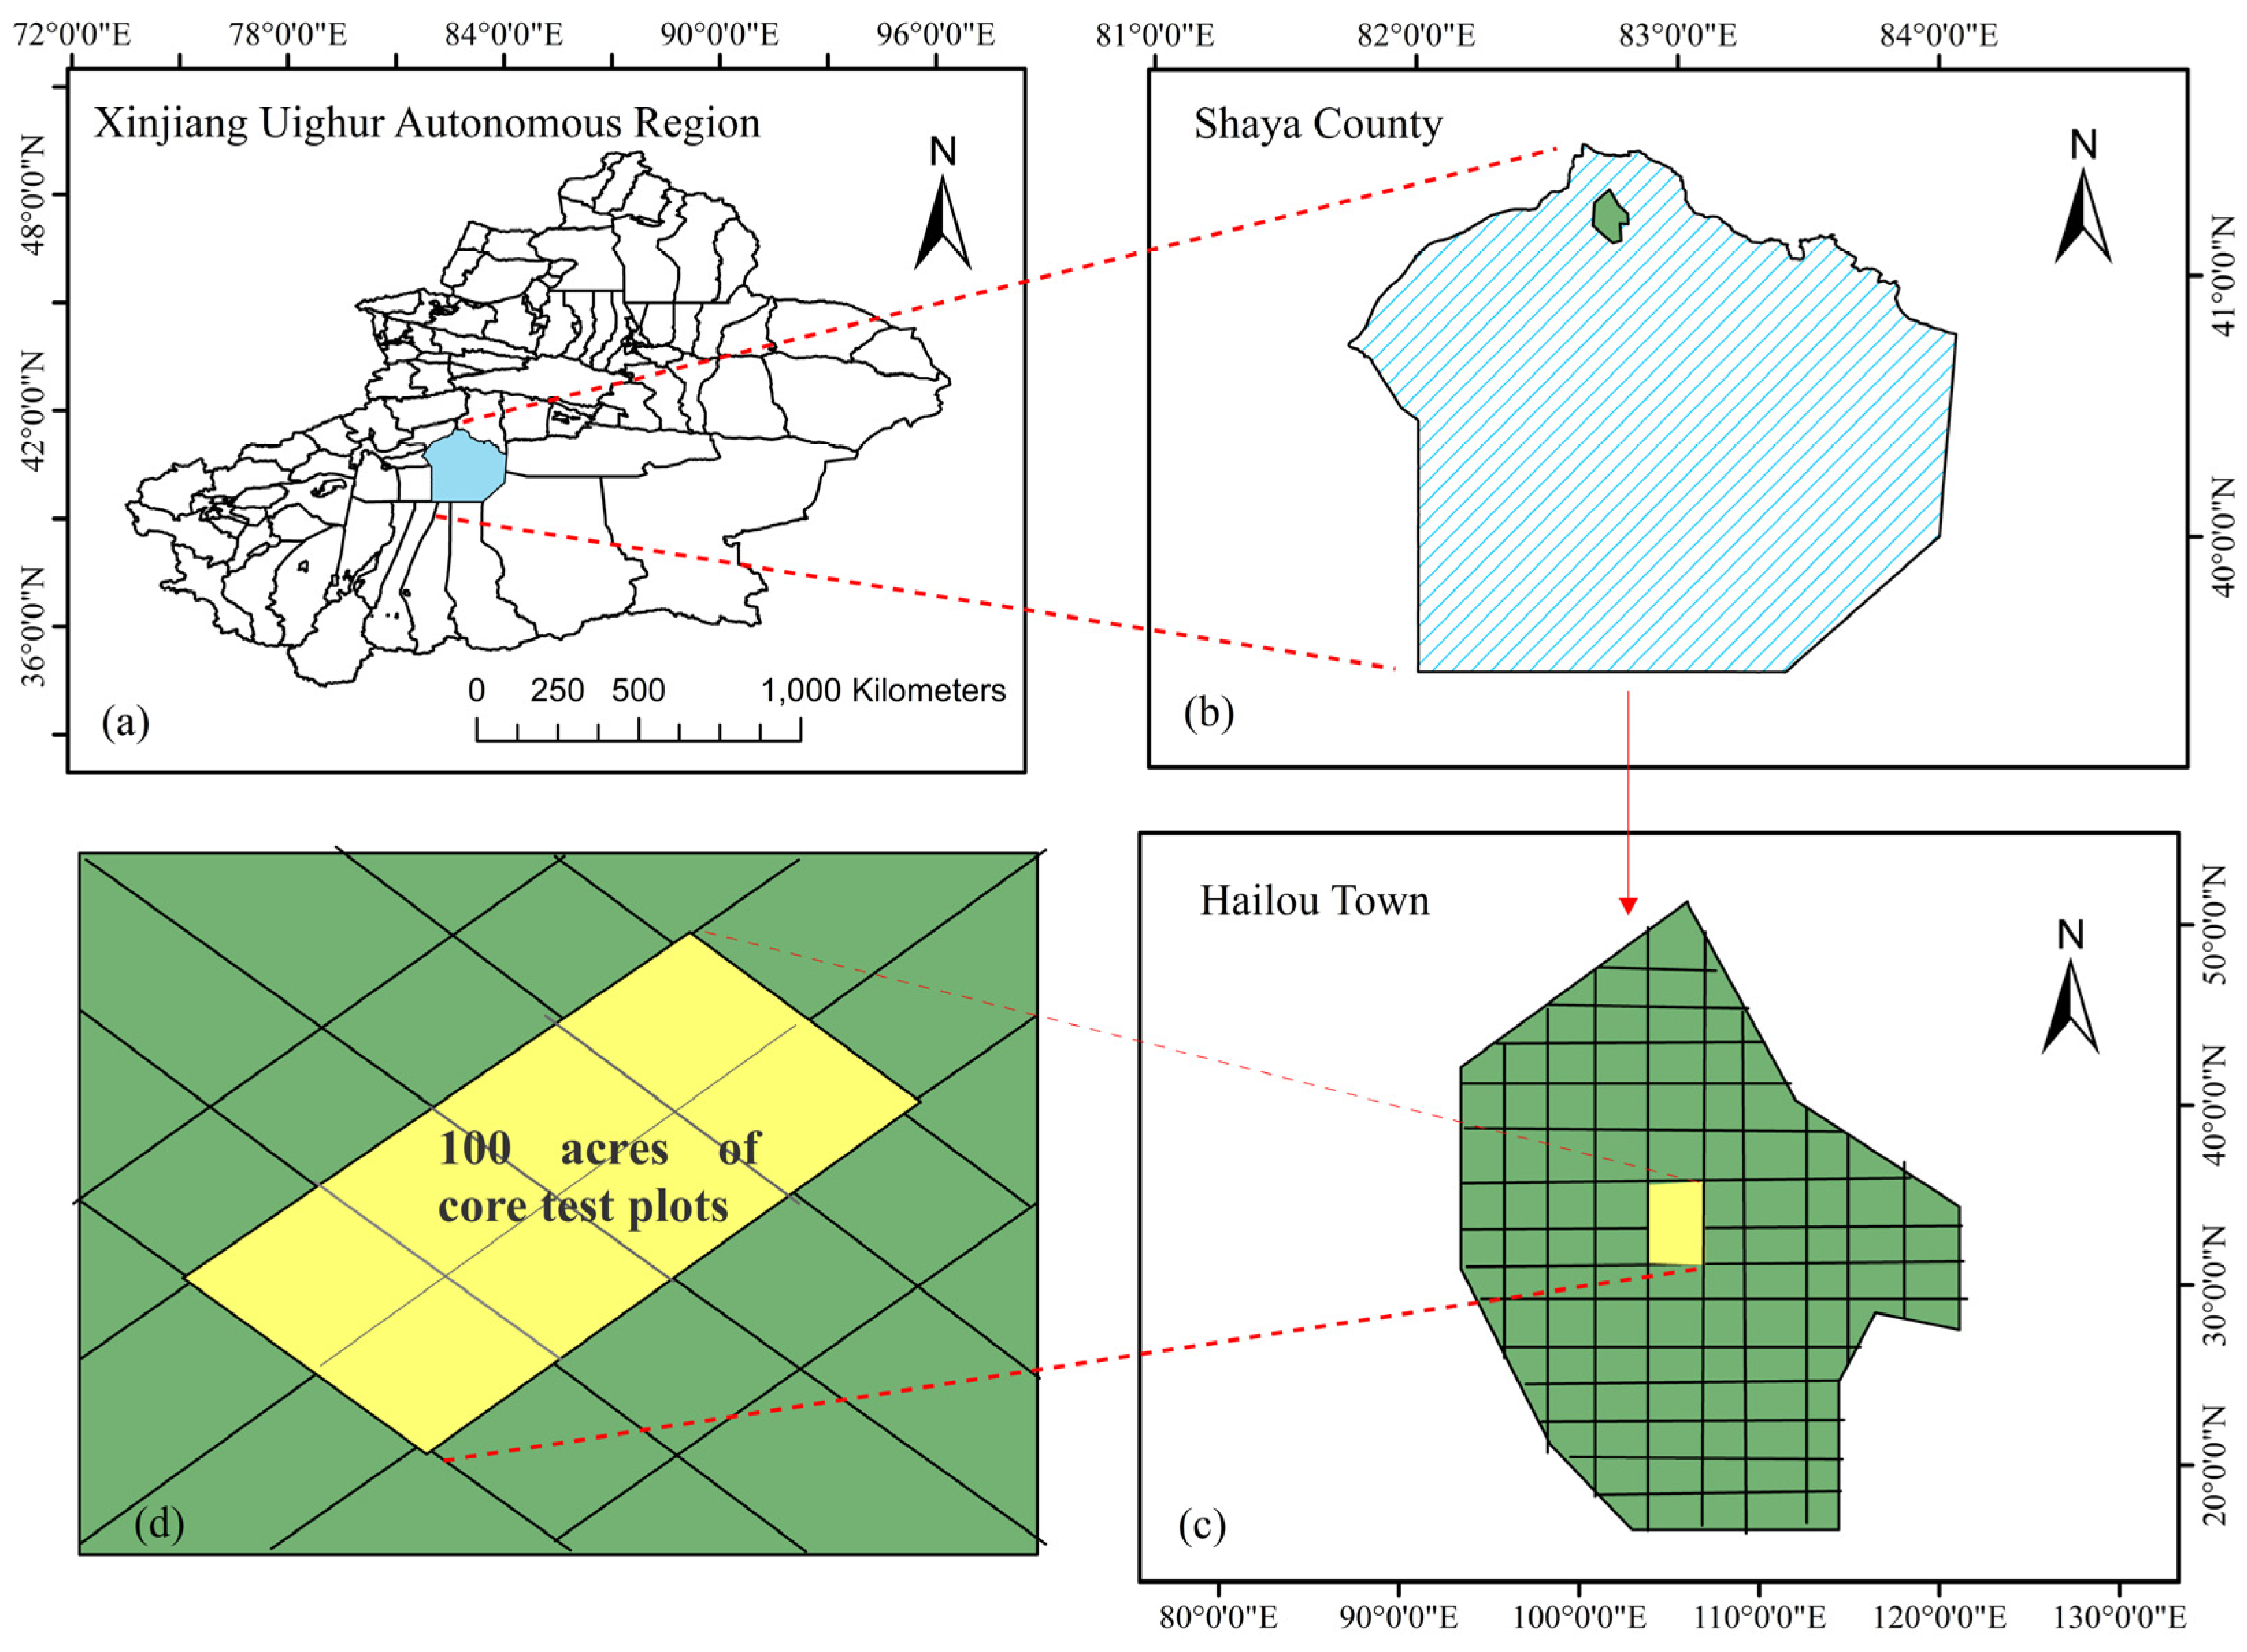
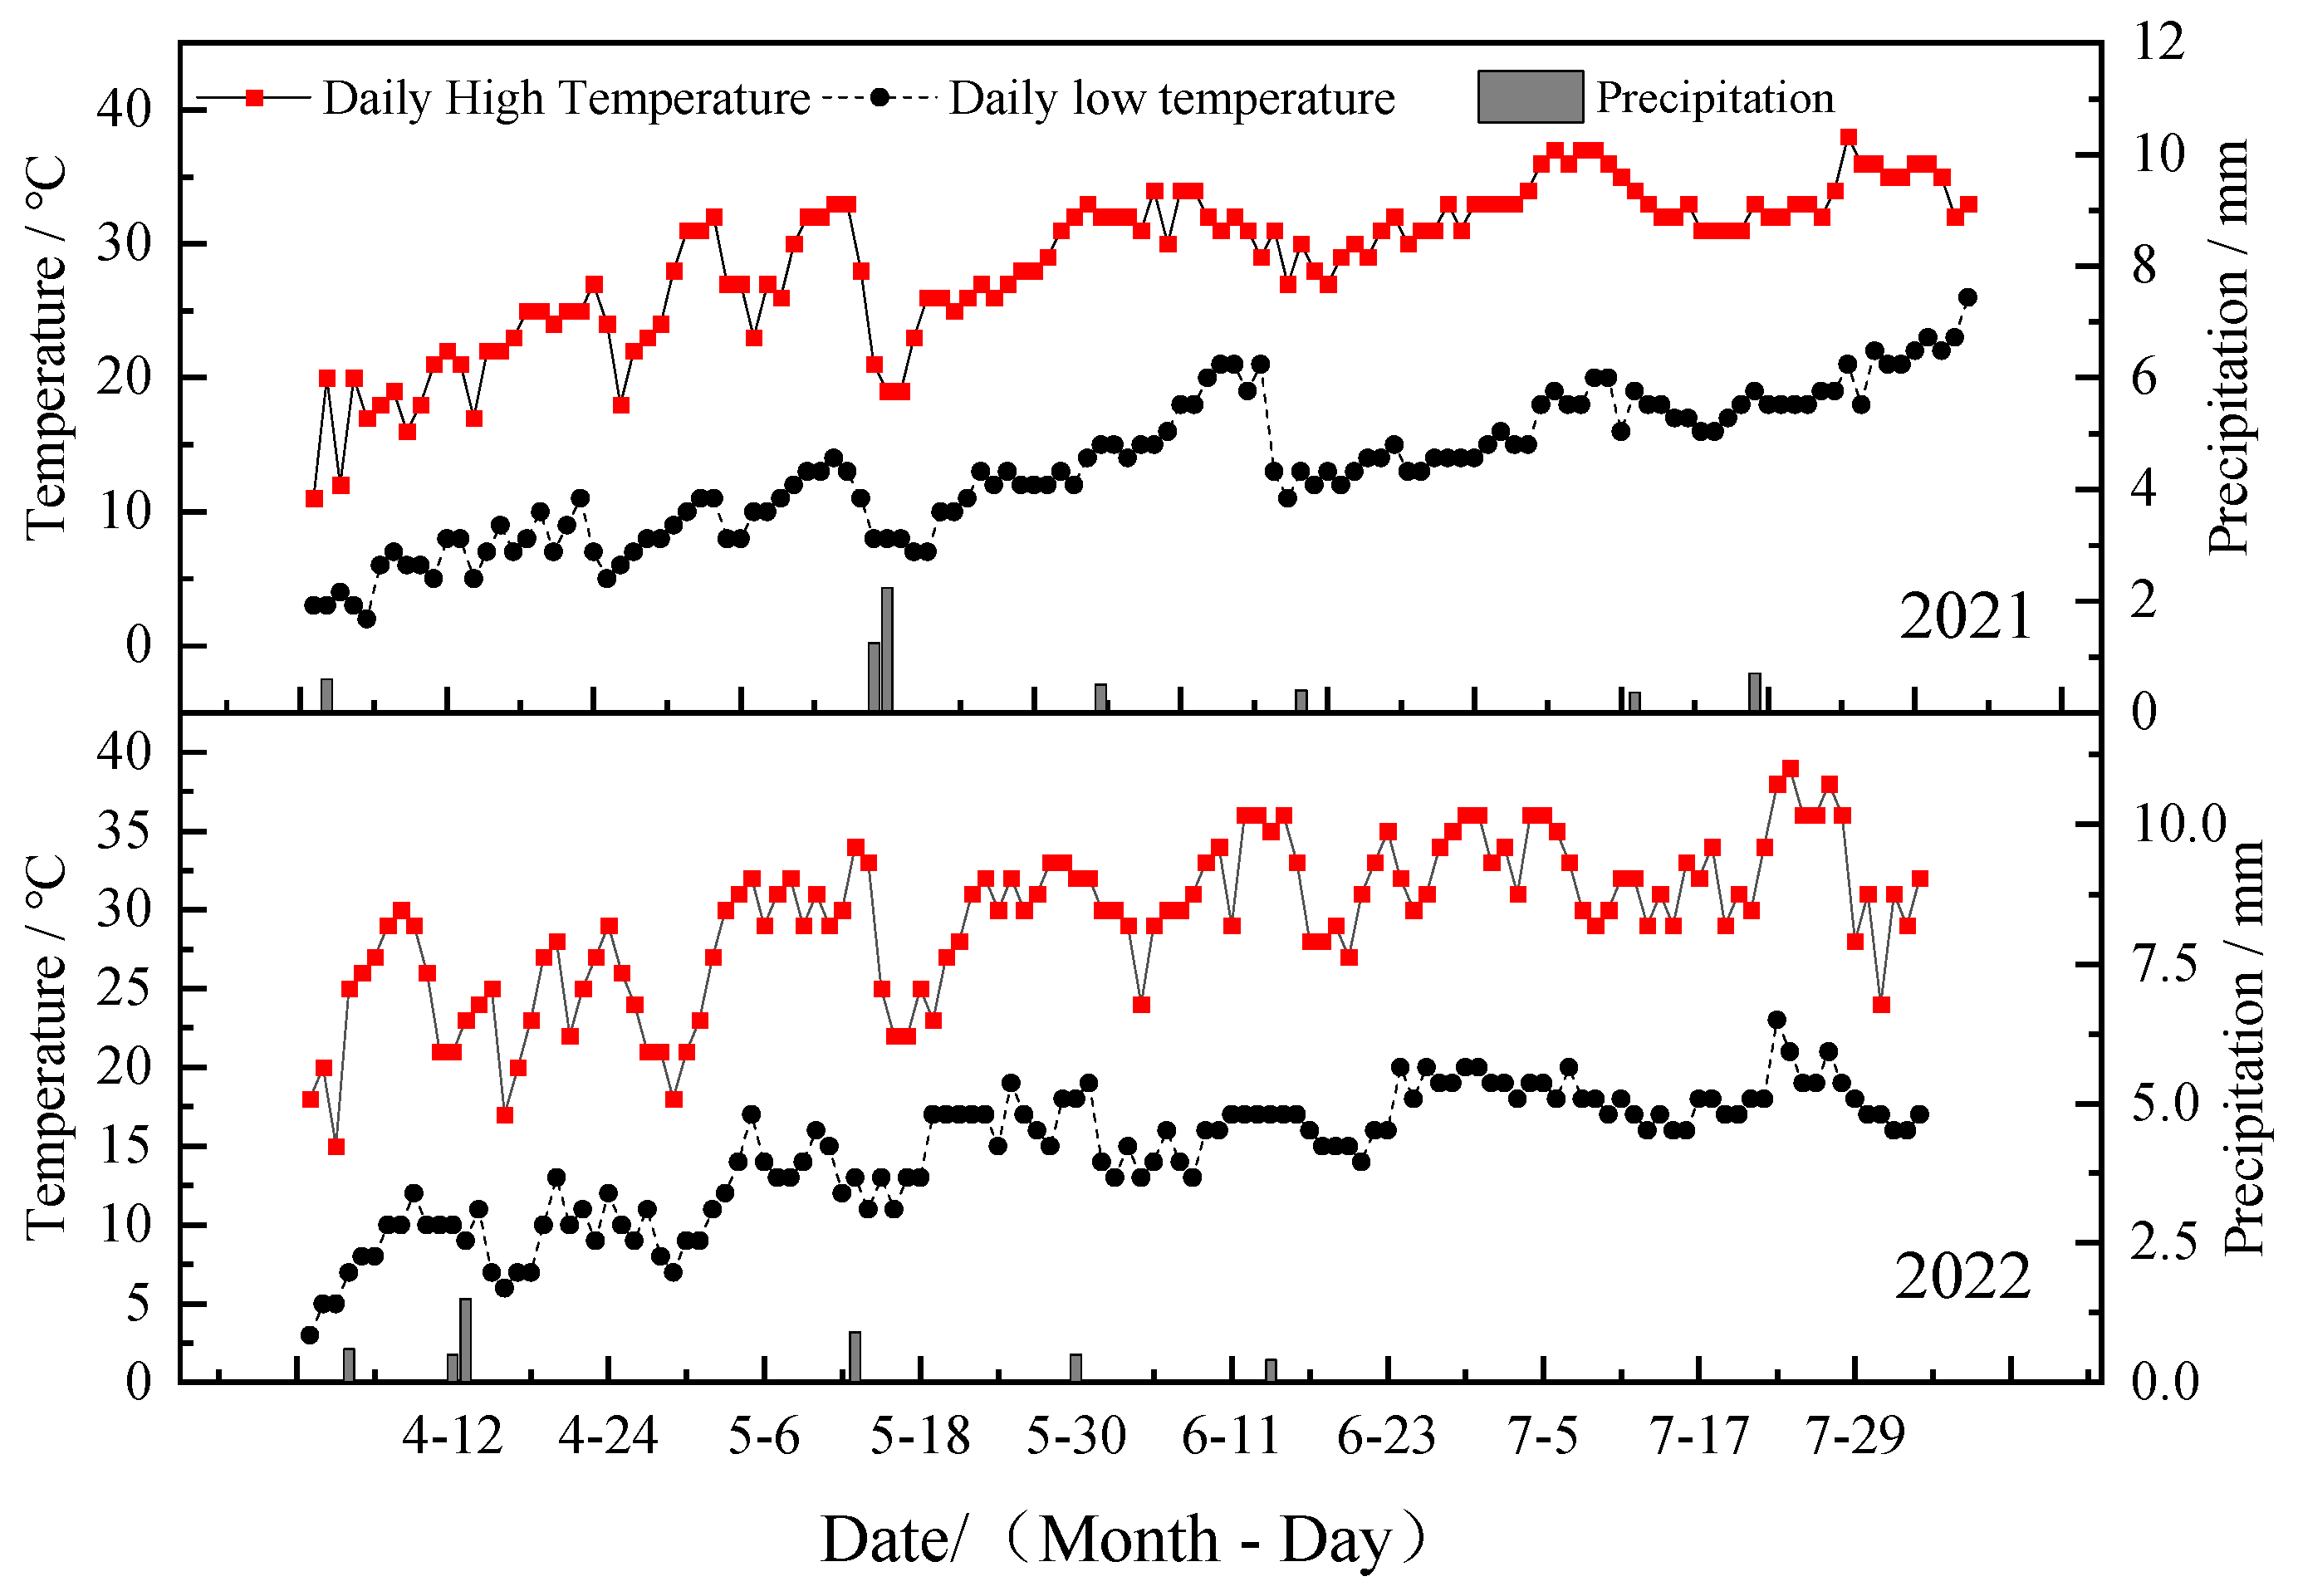
The experiment took place in Hai Lou Town, Shaya County, Xinjiang, China (41.22° N, 82.78° E) from March 2021 to October 2022, as illustrated in Figure 1. The study area features a warm-temperate desert fringe climate with an annual precipitation of only 47.3 mm, a maximum annual evaporation of approximately 2000.7 mm, significant day–night temperature fluctuations, and frequent extreme weather events like wind, sand, and hail [20]. These phenomena are influenced by desert sands from neighboring counties and the Taklamakan Desert. Table 1 presents the physical properties of the soil in the test area, including soil capacity and field water holding capacity measured using the indoor ring knife method. Soil texture is shown in Table 1, with the water table approximately 3.8 m below the surface. Meteorological parameters, such as rainfall, air temperature, wind speed, and barometric pressure, were recorded by an automatic monitoring meteorological station installed in the experimental area. Data were stored in a data logger at 30-min intervals (see Figure 2).
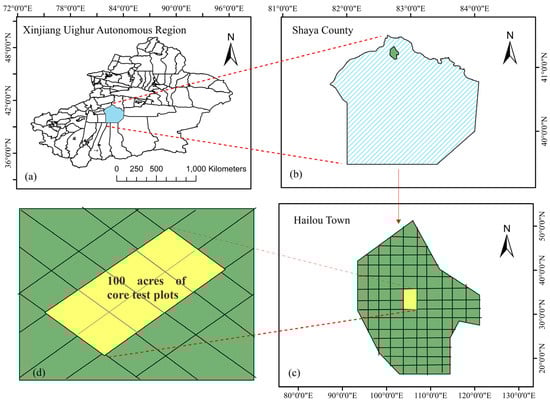
Figure 1.
Location map of the test area. (a) Shows the map of counties in Xinjiang Uygur Autonomous Region (XUAR), China; (b) Map showing the location of Shaya County, Xinjiang Uygur Autonomous Region. (c) Map showing the location of a typical test area for cotton in Hailou Township, Shaya County; (d) shows the location of a typical 100-acre cotton test field in the Town of Hailu.

Table 1.
Physical and chemical properties of soil before irrigation.
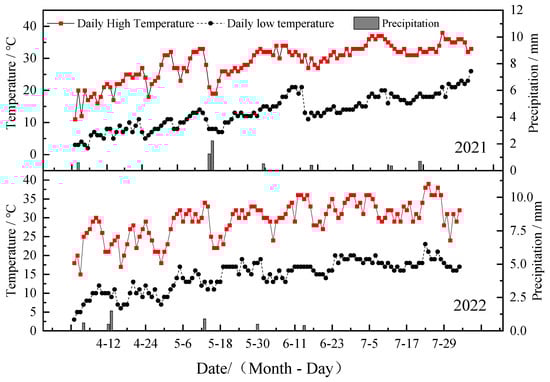
Figure 2.
Meteorological data of cotton growing season in 2021 and 2022 in Shaya, Xinjiang.
2.2. Experimental Design
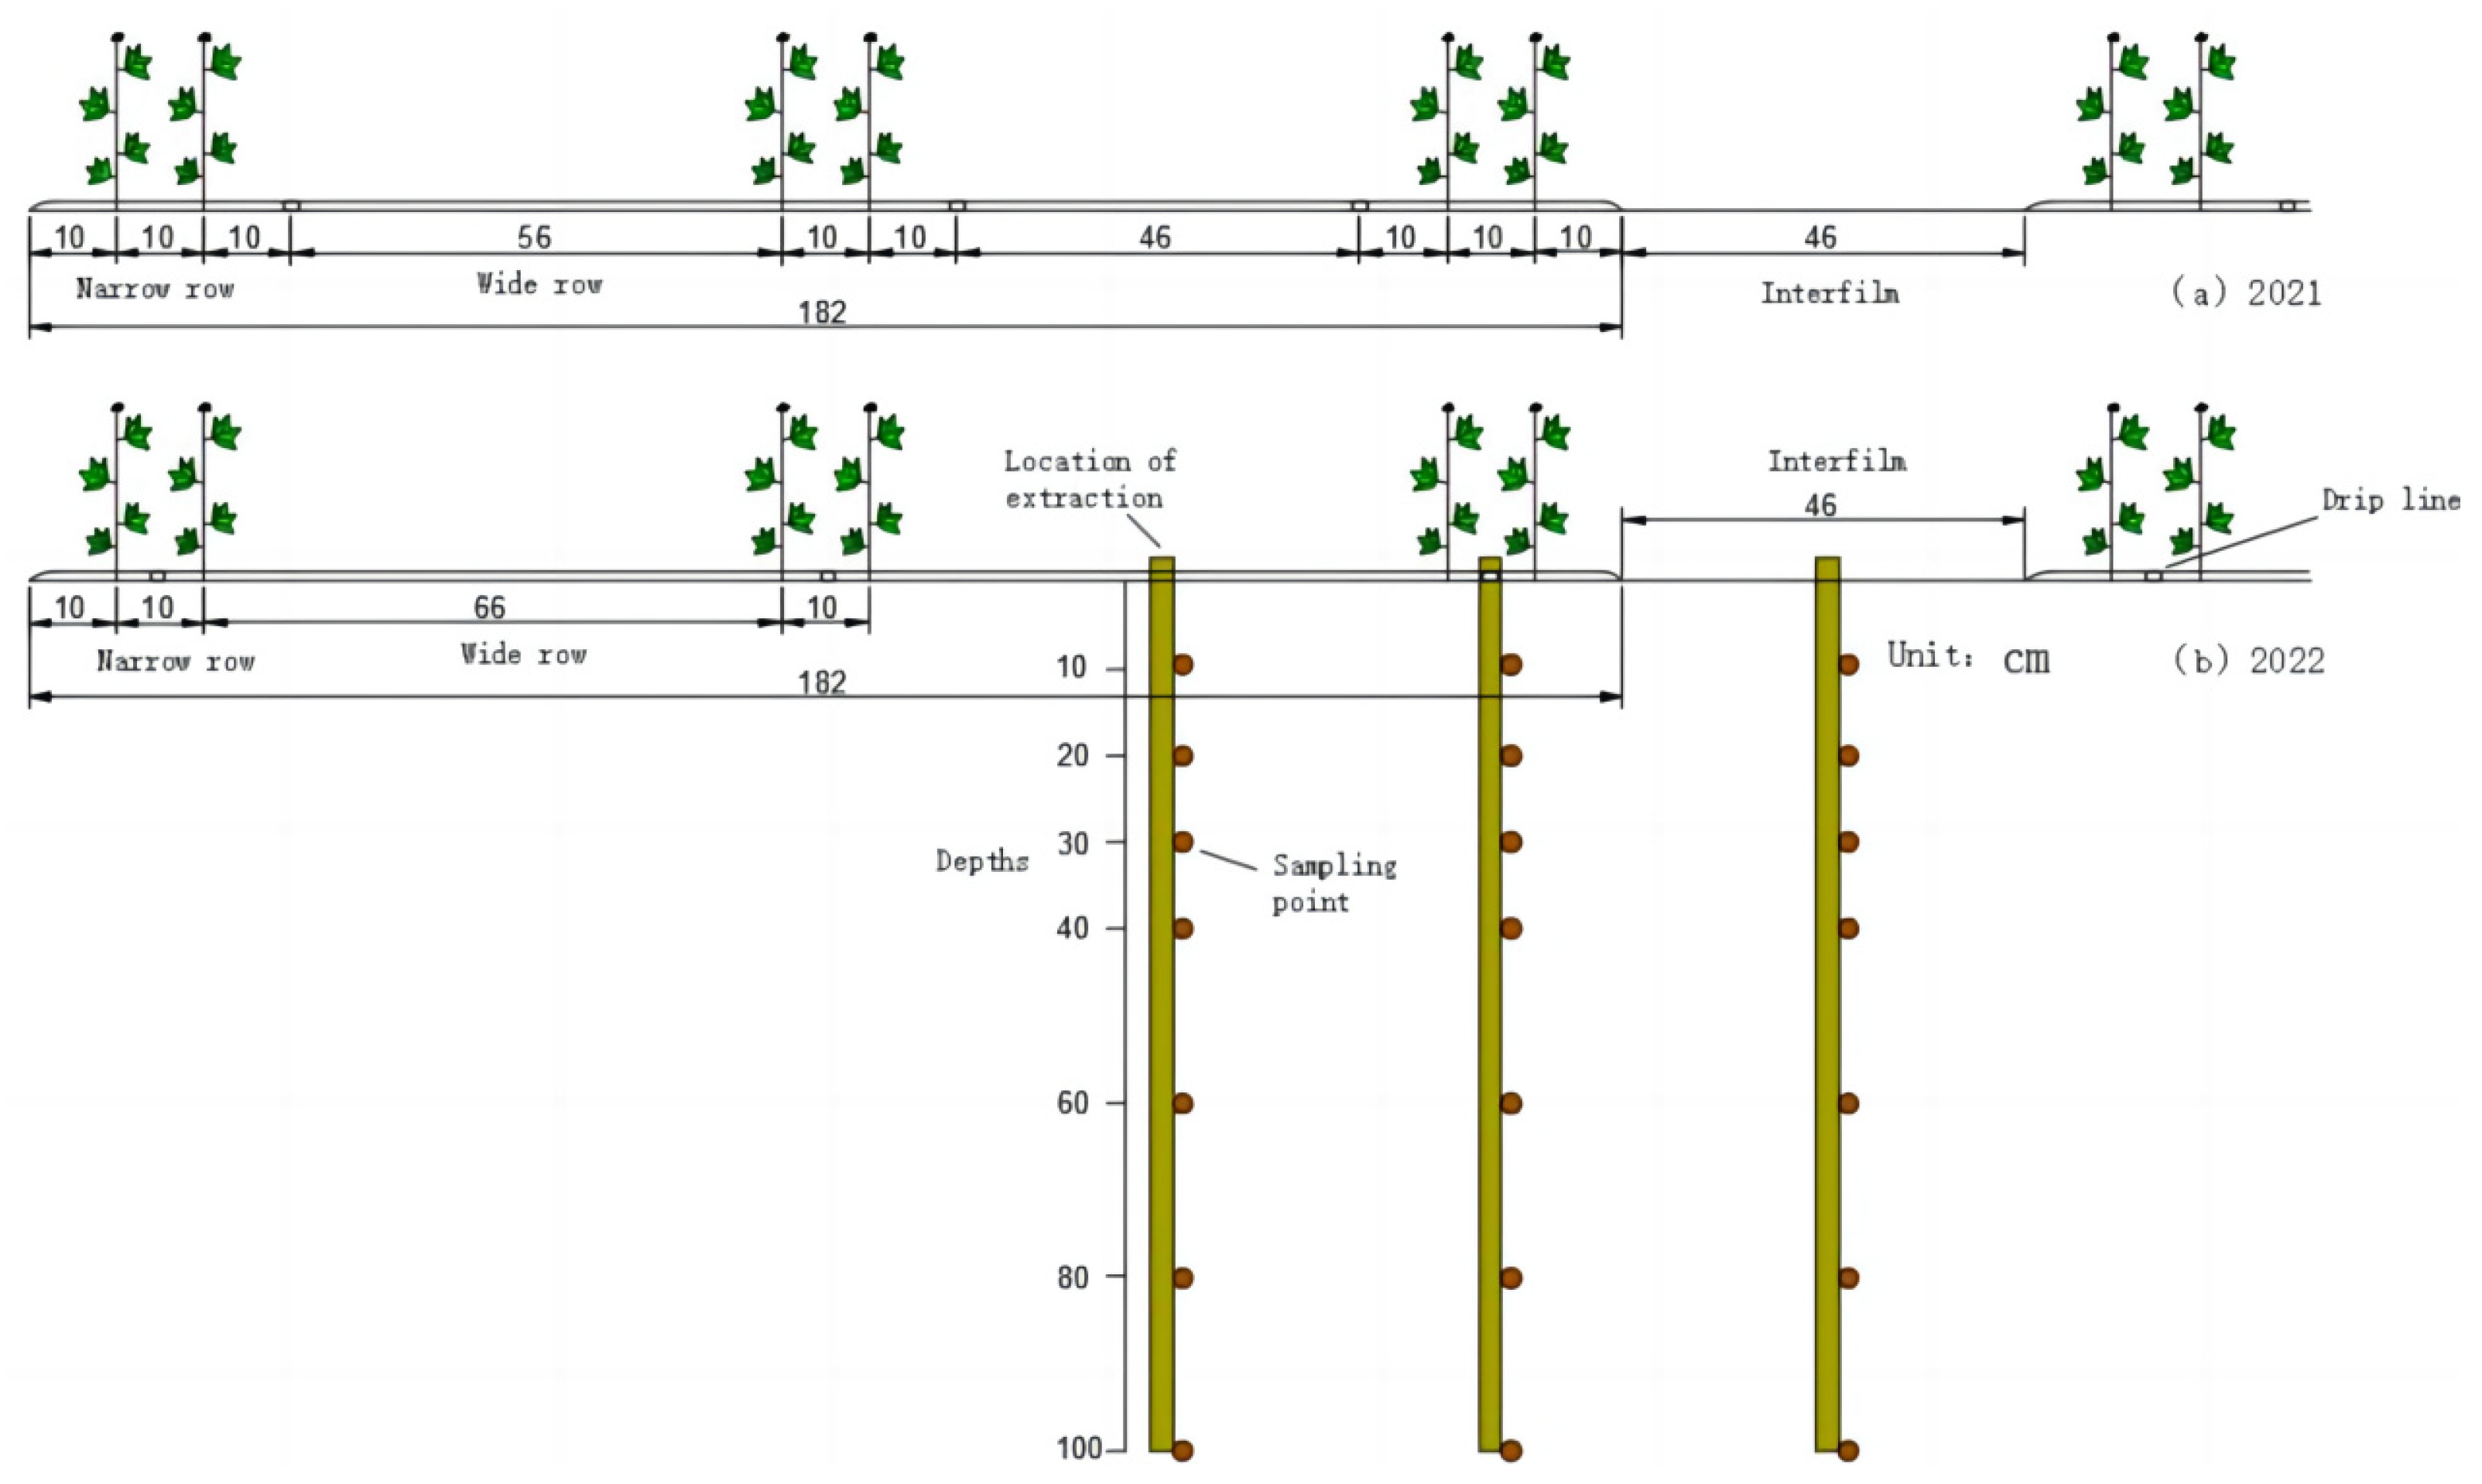
The 2021–2022 experiment utilized the locally prevalent cotton variety “Yuan Cotton No. 11” as the test crop. Planting occurred on 18 April 2021, and 10 April 2022, respectively, employing a planting mode of 1 film, 3 tubes, and 6 rows. Based on the cotton rows and drip irrigation belt placement, the planting area was categorized into wide rows, narrow rows, and bare ground between the film. Distances between wide rows, narrow rows, and film were 66 cm, 10 cm, and 46 cm, with a plant spacing of 10 cm (Figure 3). The 2021 experiment adopted the drip irrigation belt layout commonly used in the local area, positioned between the wide rows of the cotton crop (Figure 3a). This method simplifies the mechanical mulching of the membrane and sowing seedlings in a single integrated operation but necessitates a waiting period for moisture to flow into the membrane holes. The 2022 trial placed drip tape between narrow rows (Figure 3b), where drip irrigation water could flow directly into the membrane holes. In 2021, seven distinct water control treatments were implemented (refer to Table 2), comprising three seedling water levels (67.5, 90, 112.5 mm) and three drip frequencies (frequencies means number of drops at seedling stage) (1, 2, 3 times). The control treatment involved a locally managed double-film-covered winter-irrigated cotton field labeled as CK, with a watering quota of 225 mm and an irrigation scheduled for 15 November 2020. The year 2021 marked the initiation of the “dry sowing and wet emergence” water control trial, devoid of winter and spring subirrigation. To ensure an optimal water and salt environment in the soil, in order to follow the principle of “first water pressure salt”, a larger “dry sowing and wet emergence” water control interval was designed. Building upon the 2021 experiment, additional experiments were conducted in 2022. Seven varied experiments were set up, incorporating three seedling water levels (6, 10.5, 15 mm), two drip frequencies (2 times, 4 times), and a winter irrigation double-film mulching control treatment (CK). The winter irrigation treatment, executed on 20 November 2021, had an irrigation quota of 225 mm. Each treatment underwent replication three times within a 180 m2 area, covered by a double-film. Fertilizer application rates and agronomic measures for cotton were in accordance with local experience.

Figure 3.
Cotton planting pattern and drip irrigation tape placement map, 2021–2022, (a) Drip irrigation tapes were placed between wide rows in 2021, (b) Drip irrigation tapes were placed between narrow rows in 2022, and soil sampling was conducted at the midpoint location of the wide rows, narrow rows, and bare ground between the membranes in 2021–2022, respectively.
Table 2.
Irrigation test plan for 2021–2022.
2.3. Indicators and Methods
2.3.1. Determination of Cotton Plant Height, Stem Thickness, and Dry Matter Accumulation
At various stages of cotton fertility, the plant height (cm) and stem thickness (mm) of five randomly selected cotton plants in each plot were measured using a tape measure and vernier calipers. Surface dust on cotton samples was removed, and plant organs were separated from the stem base and underground portion. Subsequently, the separated parts were subjected to a temperature of 105 °C for 0.5 h to eliminate greening, followed by drying at 75 °C until a constant mass was achieved. After cooling, the specimens were weighed using an electronic balance.
2.3.2. Determination of Chlorophyll Fluorescence Parameters in Cotton Leaves
Selected during clear or less cloudy weather, chlorophyll fluorescence parameters of cotton leaves were determined using a Mini-PAM fluorometer (PD-0178 Portable Datalogger, Inc., Norcross, GA, USA) (F0’: minimum fluorescence yield in light, Fm’: maximum fluorescence yield in light, PQY: photochemical quantum yield, Fv’/Fm’: effective photochemical quantum yield, qP: photochemical quenching factor). Five cotton plants with uniform growth were randomly selected for each water treatment, and the average value was determined three times. The daily change of chlorophyll fluorescence was tested every 20 days from seedling stage and every two hours from 8:00 to 20:00 Beijing time.
Fv’ = Fm’ − F0′
qP = (Fm’ − F)/Fm
2.3.3. Cotton Yield and Quality Testing
The quality of 100 bolls, the number of plants, and the number of effective bolls per plant were measured, and the weight of fluffed seed cotton yield, overall yield, and their components were determined, taking the average across the three plots. Additionally, 100 bolls were collected from each plot to assess the weight of cotton bolls and lint contributing to the calculation of the harvested plot yield. Cotton fiber samples were sent to the Ministry of Agriculture Quality Supervision and Inspection Center for the assessment of fiber quality indicators.
2.3.4. Water Productivity
The formula for water productivity is given by:
where WP represents water productivity, y denotes seed cotton yield (kg/hm2), and I stand for irrigation water (mm).
WP = y/I
2.4. Data Processing
The experimental data were graphically and statistically plotted using Excel 2020, Origin 2016, and ArcGIS 10.8 software. IBM SPSS 25.0 was used for analysis of significance (ANOVA), correlation analysis, and linear fitting of cotton physiological and growth test data. Additionally, the layout of the drip irrigation belt was designed using CAD 2016. GaussCum function (4), LogisticCum function (5), and quadratic equation were used to fit the cotton yield, quality, and irrigation water productivity data.
where Φ(x) denotes the cumulative distribution function of the Gaussian distribution, x is the variable, e is the base of the natural logarithm, and π is the circumference.
where, denotes F(x) denotes the cumulative distribution function of the logistic function, x is the variable, and e is the base of the natural logarithm.
3. Results
3.1. Plant Height and Stem Thickness
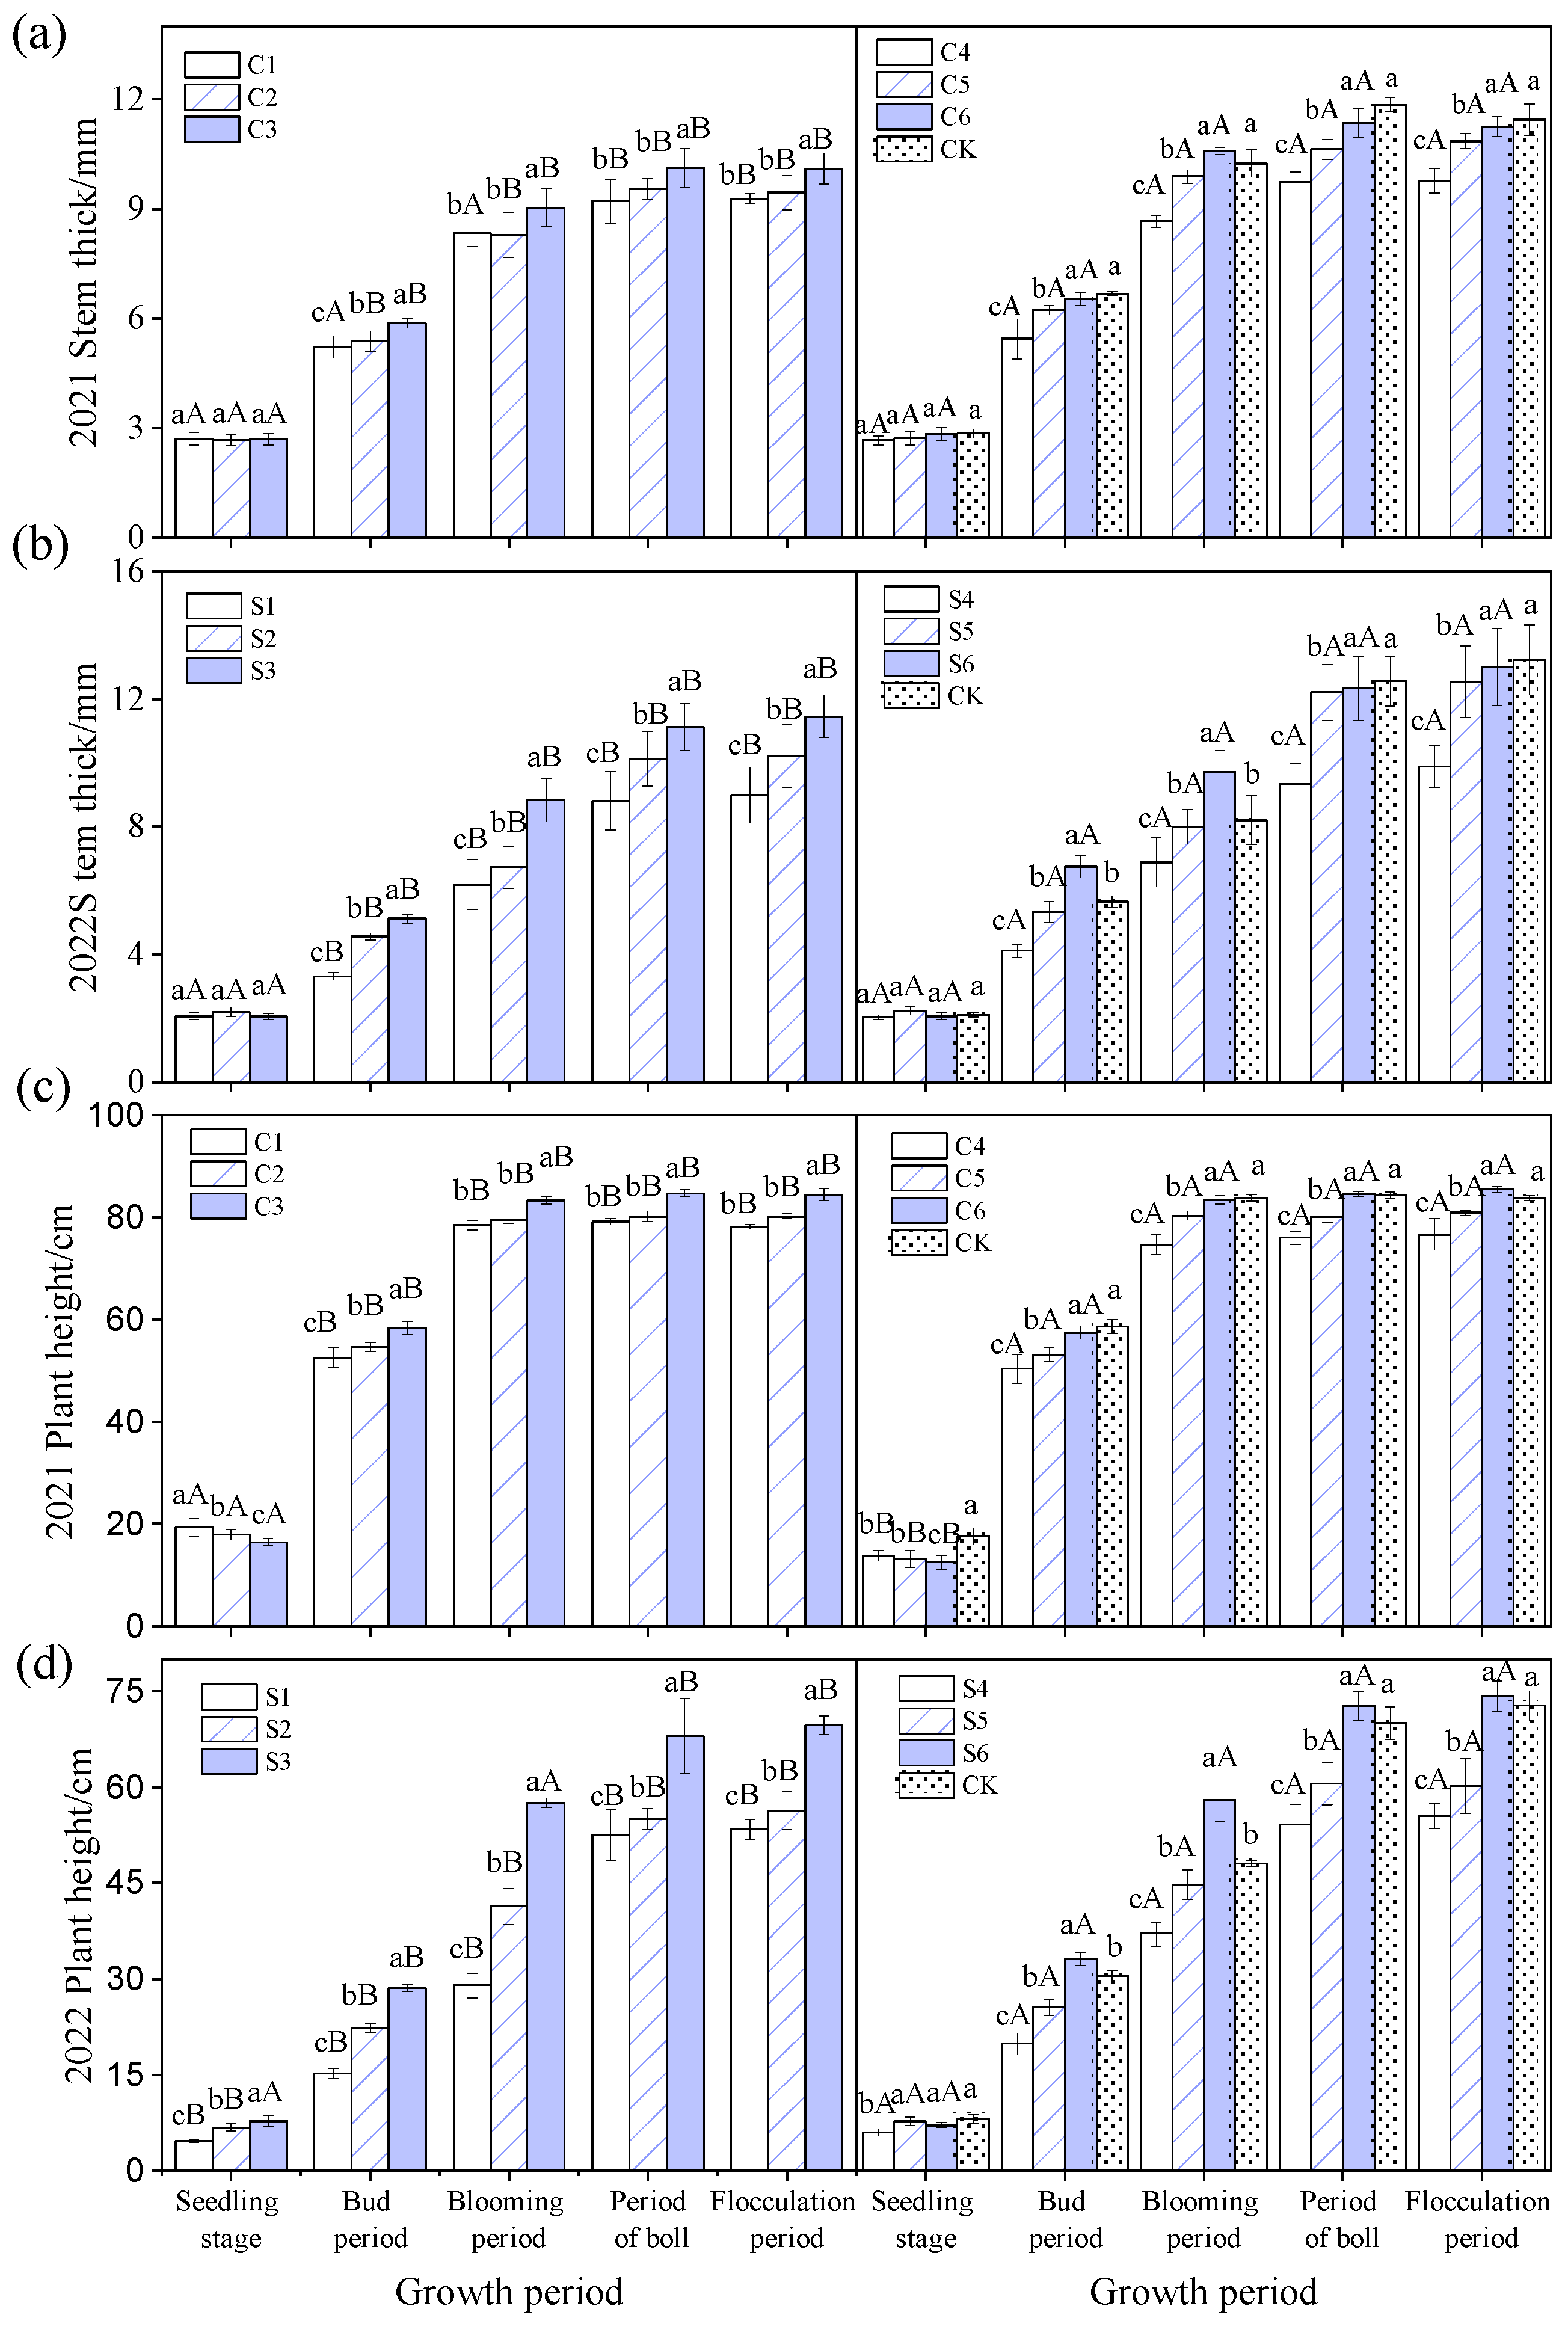
The trend of stem thickness changes during the cotton fertility period in each treatment from 2021 to 2022 showed an initial increase followed by stabilization, reaching its maximum at the batting stage (Figure 4a,b). No significant difference in stem thickness was observed among treatments at the seedling stage, but the difference gradually increased (p < 0.05) as the fertility stage advanced. Stem thickness progressively increased with the rise in seedling water quantity at the same drip frequency. In comparison, at the same seedling water quantity, the stem thickness of the high-frequency treatment increased by 10.45% and 14.38% in 2021 and 2022, respectively. Compared to 2021, the mean value of stem thickness is 3.79% lower in 2022.
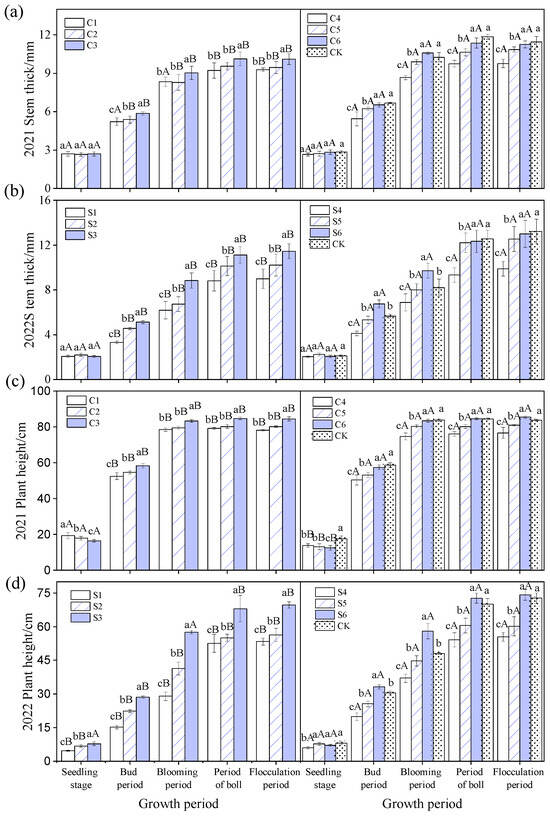
Figure 4.
Changes in plant height and stem thickness during cotton fertility in 2020 and 2021. Note: (a,b) represent the changes in stem thickness and (c,d) represent the changes in plant height during the reproductive years 2021 and 2022, respectively. Different lowercase letters indicate differences between different seedling water quantity treatments (p < 0.05); different uppercase letters indicate significant differences between treatments with different drip frequencies (p < 0.05). The error bars for each treatment in this graphic are represented by calculating the standard errors derived from the data of the three repeated-measures samples to provide information on the precision of the estimation of the sample mean.
Statistical analysis revealed that drip frequency (DF) and seedling water (SW) significantly (p < 0.05) influenced cotton plant height. At the seedling stage in 2021, plant height decreased with increasing seedling water quantity. In 2022, plant height increased with the rise in seedling water quantity. Plant height in the high-frequency treatment groups (S2 and S3) was significantly larger than the low-frequency treatment groups. From bud to the flossing stage in 2021–2022, all water-regulated treatments exhibited a similar trend, with plant height increasing with seedling water volume and drip frequency. Notably, the plant height of high-frequency large-sized seedling water treatments (C6 and S6) was significantly larger than the other water-regulated treatments, reaching its maximum at the bolling stage. The average plant height in 2022 was 39.22% lower than in 2021.
3.2. Dry Matter Accumulation
The composition of cotton dry matter accumulation in each treatment during 2021–2022 is presented in Table 3. Following an analysis of variance (ANOVA), the effects of SW, DF, and DF × SW on boll and total dry matter accumulation in 2021–2022 were found to be significant (p < 0.01). When DF remained constant, boll and total accumulation exhibited a gradual increase with the rise in SW in 2021. Notably, the differences in leaf and stem dry matter accumulation were more pronounced in the high-frequency treatments (C4, C5, and C6) compared to the low-frequency treatments (C1, C2, and C3). In 2022, root, leaf, stem, bell, and total accumulations showed a consistent upward trend with the increase in SW, with the dry matter accumulation of the S6 treatment significantly surpassing that of the other treatments.
Table 3.
Composition of cotton dry matter accumulation in 2021–2022.
With constant SW, the dry matter accumulations of high-frequency treatments were significantly larger than those of low-frequency treatments in both 2021 and 2022. Boll dry matter accumulation accounted for the highest percentage in both years, followed by leaf and stem dry matter accumulation. Comparing 2021 C6 with 2022 S6 treatments, the total dry matter quality of S1 and S2 treatments in 2022 decreased by 14.41% and 3.76%, respectively, while that of S3 treatments increased by 0.48%. Additionally, compared with C4, C5, and C6 treatments, the total dry matter quality of S4 treatments decreased by 0.43%, while that of S5 and S6 treatments increased by 10.33%. A notable 15.98% of the dry matter quality for 2021 C6 and 2022 S6 “dry sowing wet emergence” was accumulated. The moisture treatment of cotton total dry matter accumulation for 2021 C6 and 2022 S6 “dry sowing and wet emergence” was the highest for both years. In comparison with the CK treatment, the composition of cotton dry matter accumulation was not significantly different. Root, stem, bud, and total dry matter accumulation were significantly higher in the composition of cotton dry matter accumulation in 2022 compared to 2021, with mean values elevated by 43.01%, 15.56%, 2.94%, and 20.27%, respectively.
3.3. Chlorophyll Fluorescence Parameters
3.3.1. F0’, Fm’, and qP
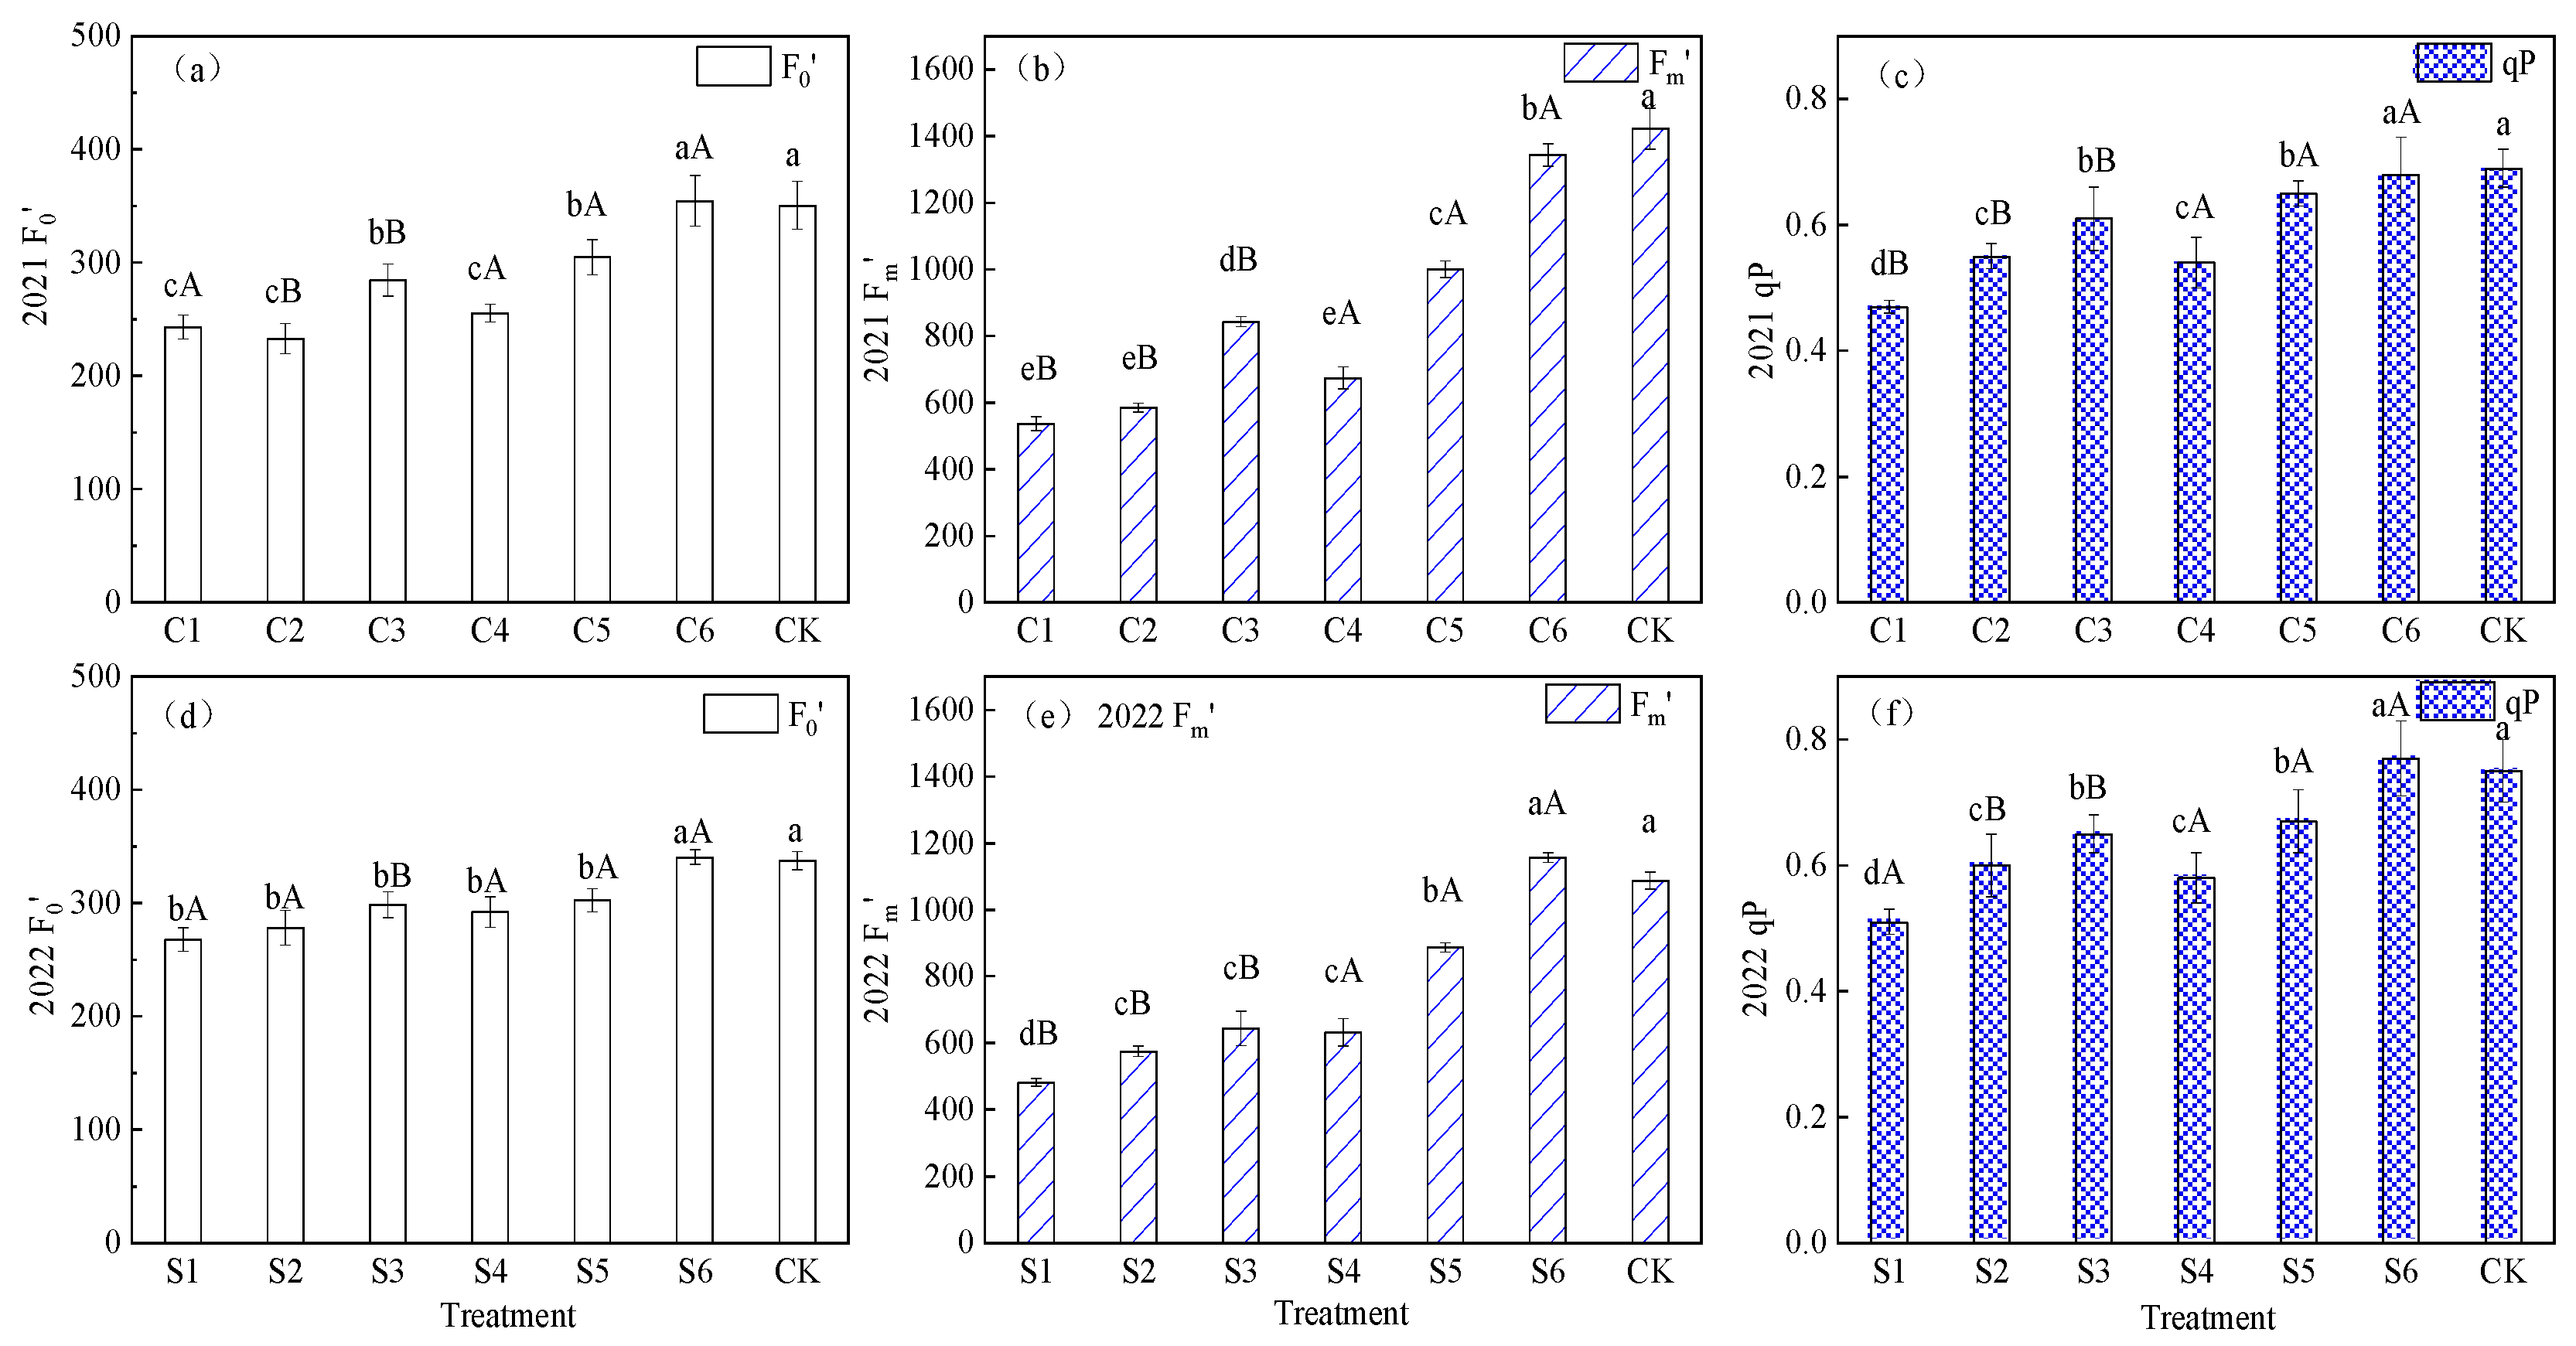
Figure 5a,b,d,e depict the variations in F0’ and Fm’ levels in cotton leaves under different moisture regulation treatments during the period of 2021–2022. When DF remained constant, both F0’ and Fm’ exhibited a gradual increase with rising SW. Notably, F0’ and Fm’ attained significantly higher values in the 2021 C6 and 2022 S6 treatments. Similarly, under consistent SW conditions, high-frequency treatments yielded significantly larger F0’ and Fm’ compared to low-frequency treatments (2021: C1 < C4, C2 < C5, C3 < C6; 2022: S1 < S4, S2 < S5, S3 < S6). The F0’ and Fm’ values for the C6 and S6 treatments were comparatively close to those of CK. Figure 4c,f highlight significant differences (p < 0.05) in qP among moisture-regulated treatments in 2021–2022. Furthermore, qP increased progressively with rising SW under constant DF, showing C1 < C2 < C3, C4 < C5 < C6 in 2021, and S1 < S2 < S3, S4 < S5 < S6 in 2022. Similarly, qP increased gradually with rising SW under consistent SW conditions, exhibiting C1 < C2 < C3, C4 < C5 < C6 in 2021, and S1 < S2 < S3, S4 < S5 < S6 in 2022. In high-frequency treatments, qP significantly surpassed C1, C2, and C3 treatments, with C4, C5, and C6 treatments showing increases of 13.73%, 11.67%, and 18.72% in 2021. Similarly, compared to S1, S2, and S3 treatments, S4, S5, and S6 treatments exhibited increases of 14.20%, 17.31%, and 11.68% in 2022, respectively. Compared to 2021, the mean values of leaf F0’ and qP were elevated by 4.51% and 8.11%, respectively, and the mean value of Fm’ was reduced by 14.68% in 2022.
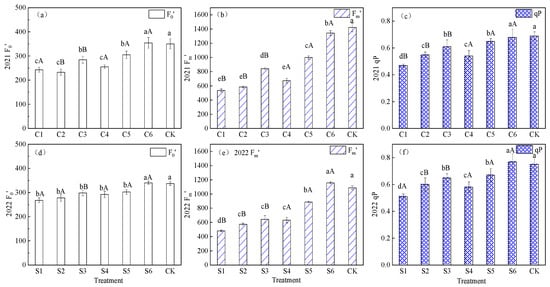
Figure 5.
Size of F0’, Fm’, and qP in 2021–2022. Note: (a–c) indicate the magnitude of F0’, Fm’ and qP values in 2021, respectively. (d–f) shows the magnitude of F0’, Fm’ and qP values in 2022 respectively. Different lowercase letters indicate differences between different seedling water quantity treatments (p < 0.05); different uppercase letters indicate significant differences between treatments with different drip frequencies (p < 0.05). The error bars for each treatment in this graphic are represented by calculating the standard errors derived from the data of the three repeated-measures samples to provide information on the precision of the estimation of the sample mean.
3.3.2. Fv’/Fm’ and Photochemical Quantum Yield (PQY)
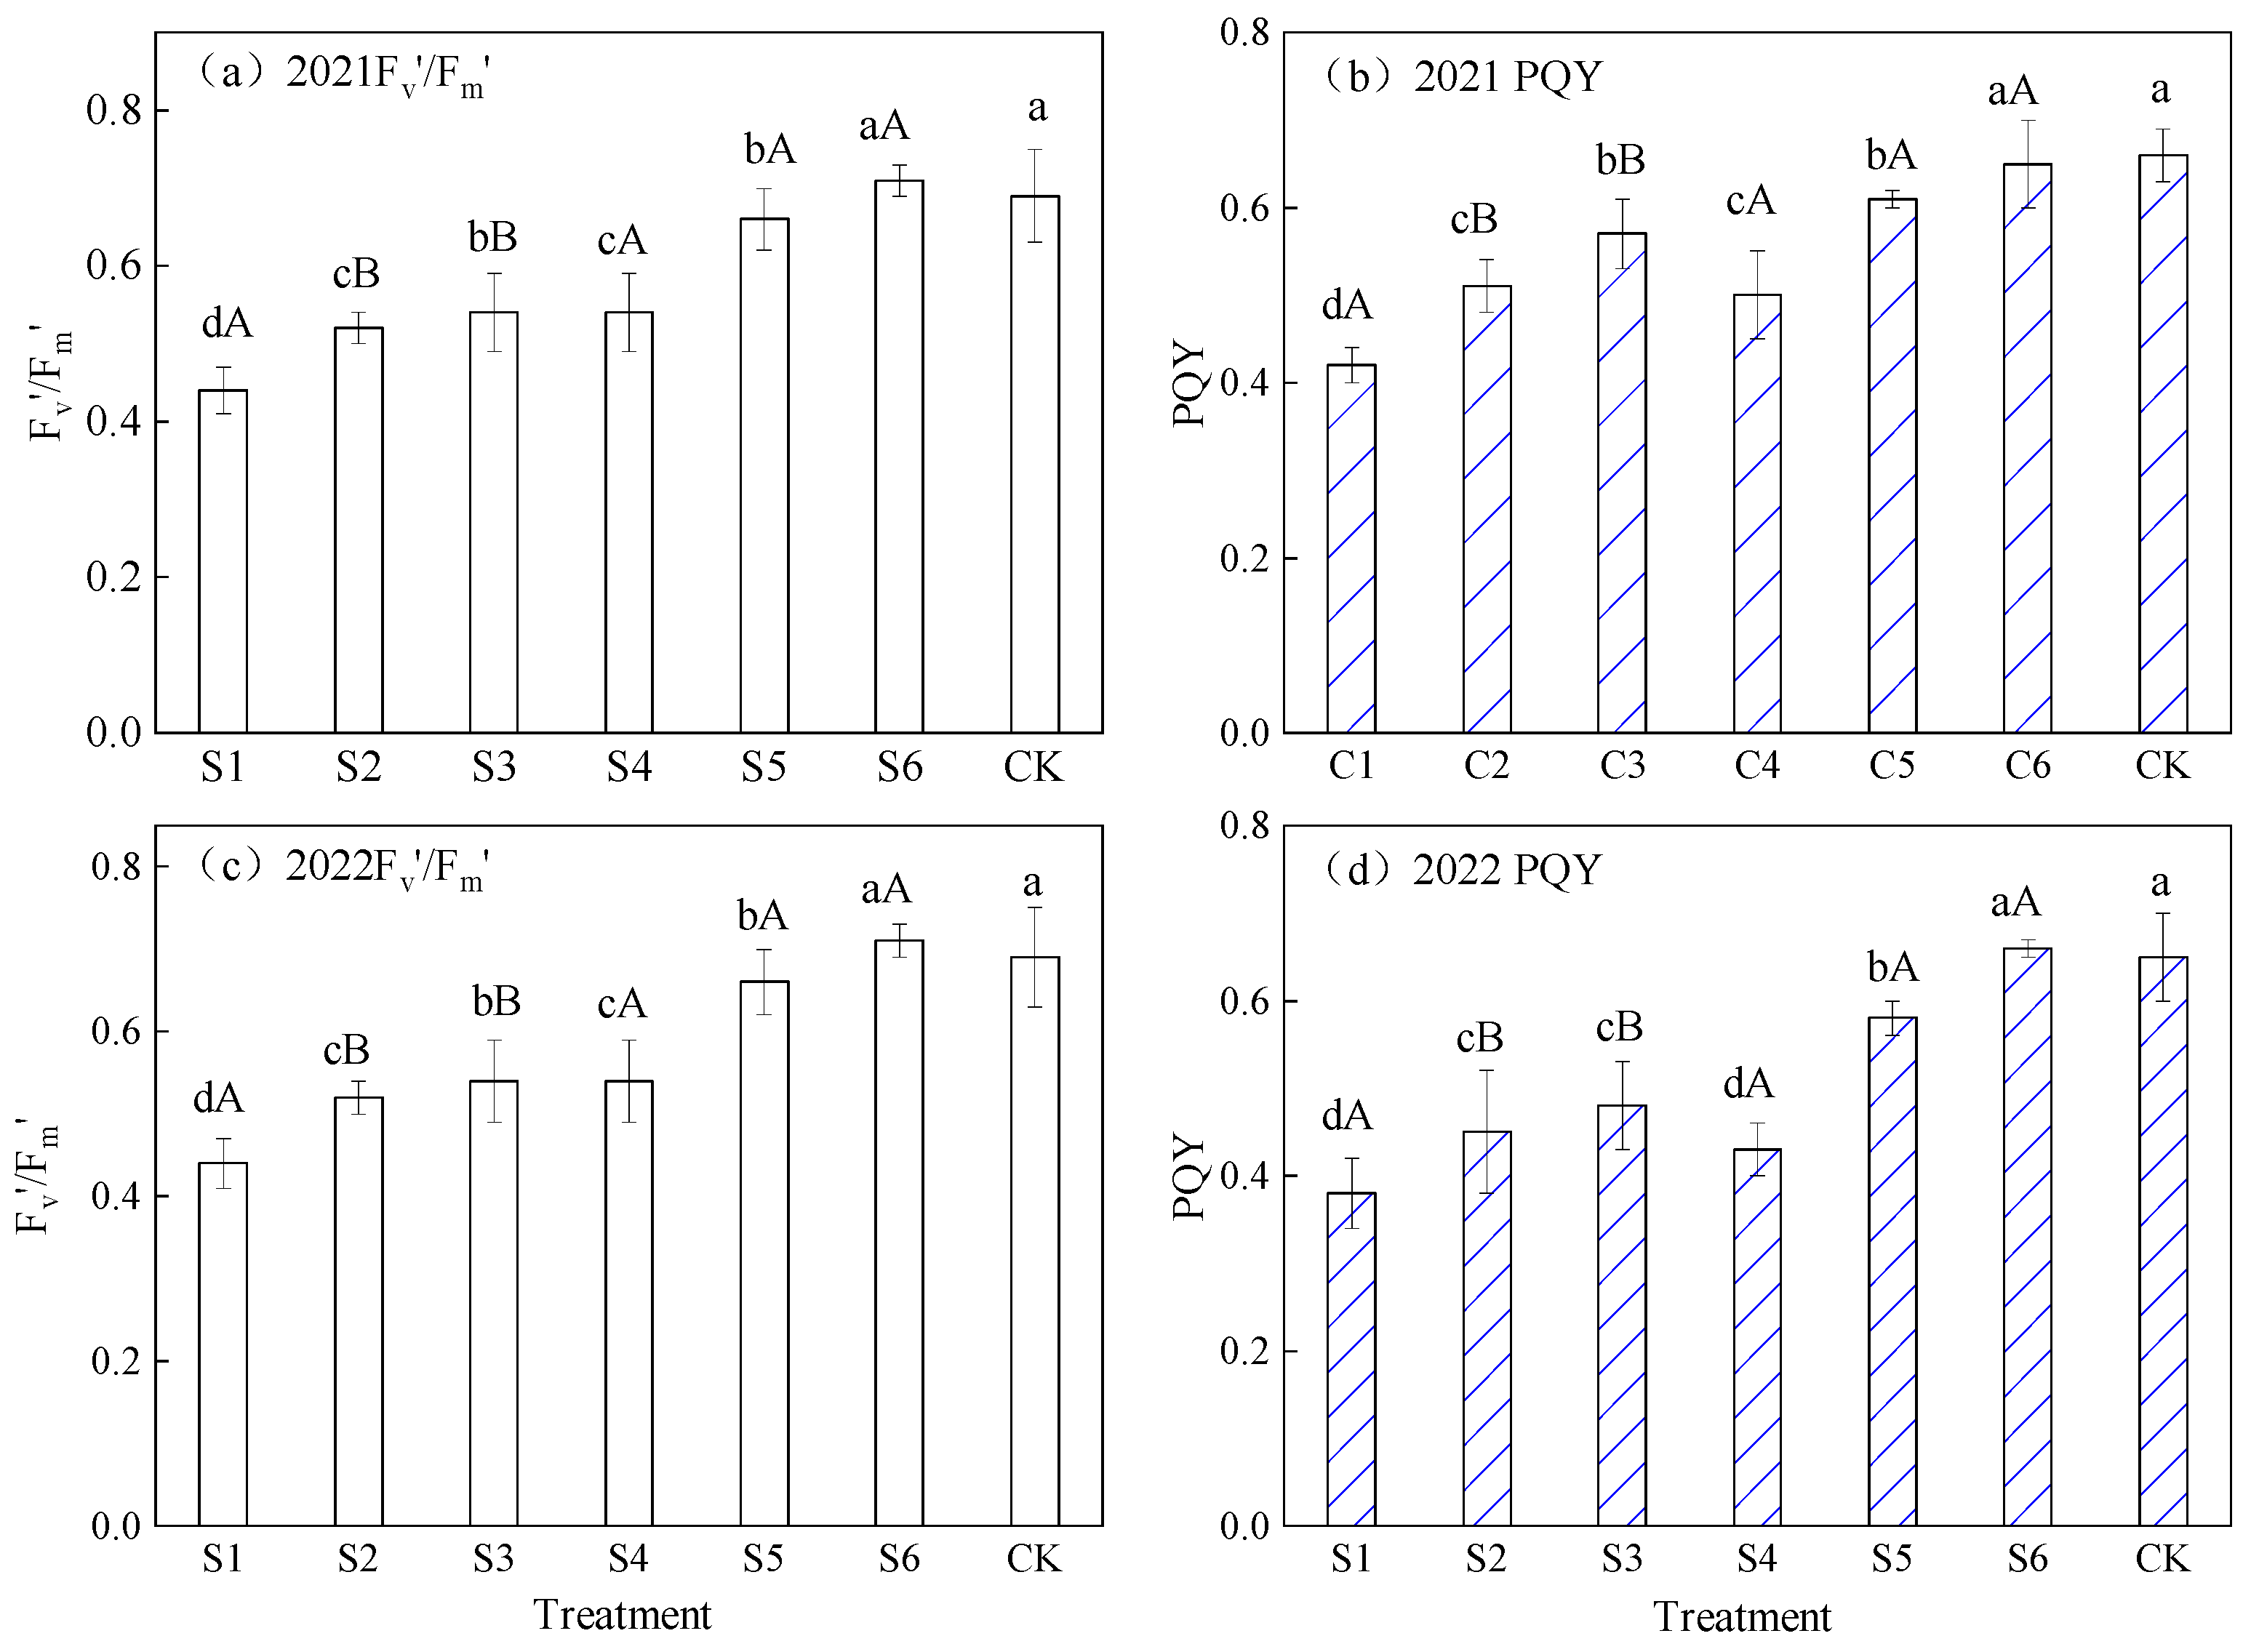
Fv’/Fm’ and PQY assess the efficiency of photosystem II (PS II) in converting absorbed light energy into chemical energy. Figure 6 reveals that in the “dry sowing and wet emergence” treatments from 2021 to 2022, Fv’/Fm’ slightly exceeded PQY, with the latter being more significantly impacted by moisture control treatments. Comparing the two years, low-frequency treatments (S1, S2, S3) witnessed a reduction in Fv’/Fm’ by 23.57%, 16.64%, and 23.54%, respectively, while high-frequency treatments (S4, S5, S6) decreased by 15.41%, 5.45%, and 4.30%, respectively. Notably, high-frequency treatments exhibited consistent reduction across the two years. The variability in Fv’/Fm’ was notably smaller. In comparison, PQY in 2022 decreased by 23.57%, 16.64%, and 23.54% for low-frequency treatments (S1, S2, S3), and 15.41%, 5.45%, and 4.30% for high-frequency treatments (S4, S5, S6). The difference between high-frequency treatments was significantly smaller than that of low-frequency treatments during both years. Following the ANOVA analysis, when DF was constant, Fv’/Fm’ and PQY exhibited a gradual increasing trend with the rise in seedling water volume. Notably, Fv’/Fm’ of C1 and S1 treatments were significantly smaller than that of each “dry sowing and wet emergence” treatment, and C6, S5, and S6 treatments were notably smaller than low-frequency treatments. Among these, Fv’/Fm’ of C1 and S1 treatments were significantly smaller than that of the “dry sowing and wet emergence” treatments, while Fv’/Fm’ of C6 and S6 treatments were the largest and not significantly different from that of CK. The mean leaf Fv’/Fm’ and PQY in 2022 were 11.16% and 7.40% lower than in 2021, respectively.
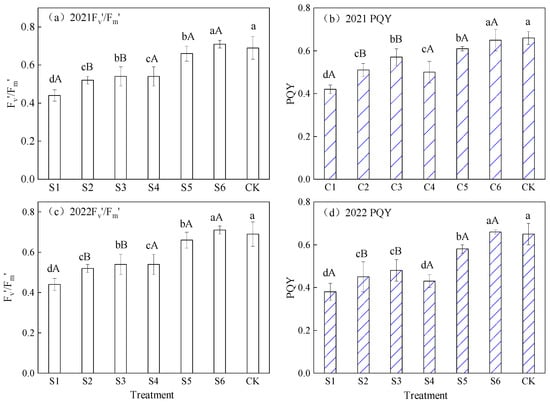
Figure 6.
Size of Fv’/Fm’, and PQY in 2021–2022. Note: (a,b) represent the magnitude of Fv’/Fm’, and PQY values in 2021, and (c,d) represent the magnitude of Fv’/Fm’ and PQY values in 2022, respectively. Significant distinctions between treatments with varying seedling emergence amounts in the current year are denoted by different lowercase letters (p < 0.05). Significant variations between treatments featuring different drip frequencies are indicated by different capital letters (p < 0.05).
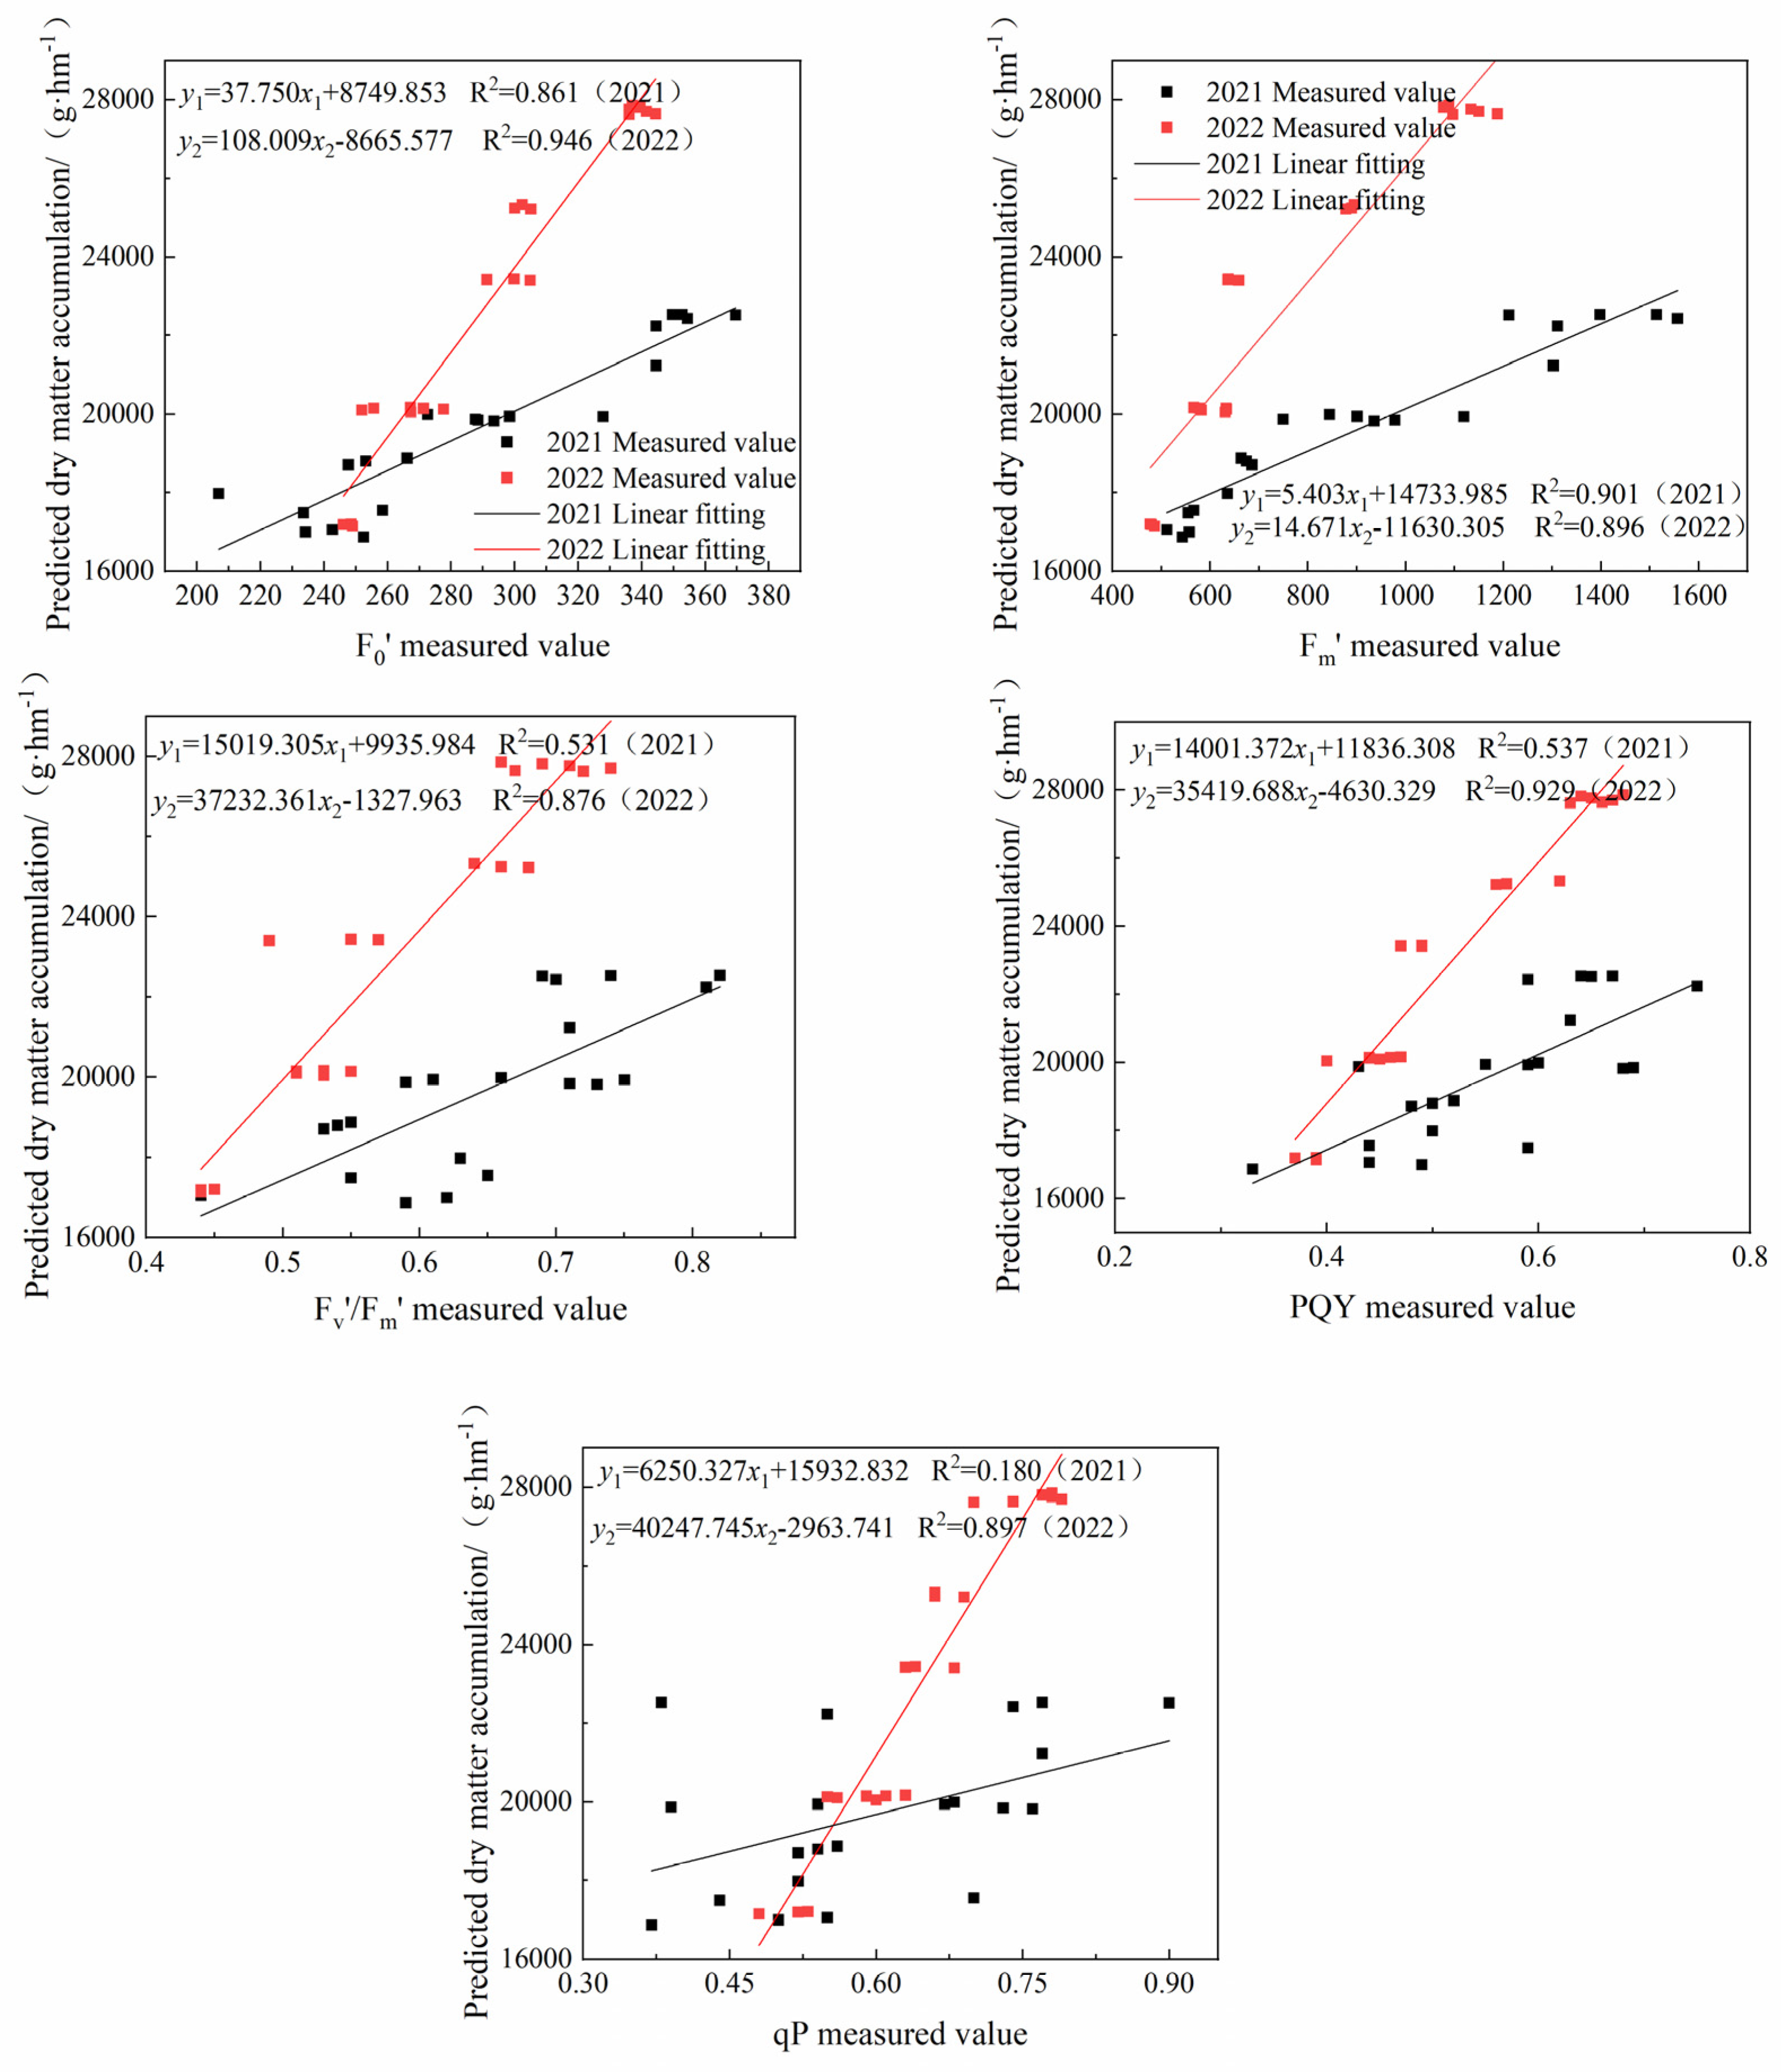
3.4. Linear Correlation Analysis between Chlorophyll Fluorescence Parameters and Dry Matter Accumulation in Cotton
Table 4 presents the correlation coefficients for each treatment in 2021 and 2022. In 2021, correlation coefficients ranged from 0.407 to 0.932, with F0’, Fm’, Yield, and Fv’/Fm’ significantly correlating with dry matter accumulation (p < 0.01). However, qP showed no significant correlation (p > 0.05), and Fm’ exhibited the highest correlation coefficient with dry matter accumulation. In 2022, correlation coefficients ranged from 0.937 to 0.974, with all chlorophyll fluorescence parameters being highly significant (p < 0.01), and F0’ demonstrating the strongest correlation with dry matter accumulation. Linear regression models were constructed (Figure 7), revealing determination coefficients ranging from 0.180 to 0.861 in 2021 and 0.876 to 0.946 in 2022. Notably, Fm’ had the highest determination coefficient in 2021, while F0’ excelled as the best-fitted model for dry matter accumulation in 2022. Both F0’ and Fm’ model fitting parameters remained consistently high across both years, providing reliable estimates for cotton dry matter accumulation.
Table 4.
Correlations between above-ground dry matter accumulation and chlorophyll fluorescence parameters and linear regression analysis from 2021 to 2022.
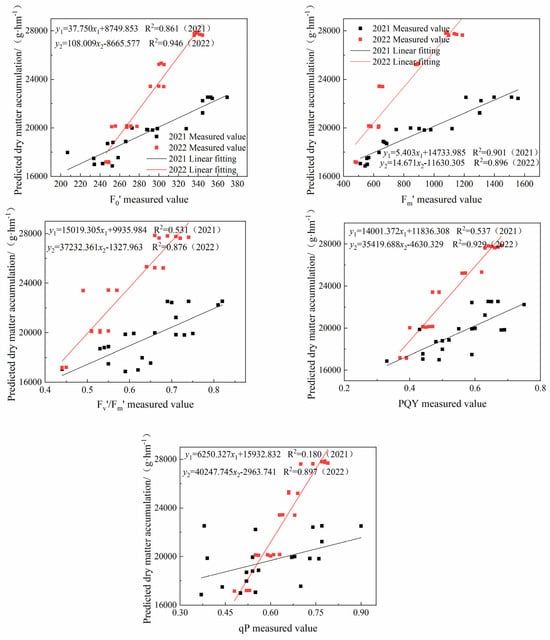
Figure 7.
Linear regression analysis of above-ground dry matter accumulation and chlorophyll fluorescence parameters from 2021 to 2022.
3.5. Cotton Yield, Quality, and Irrigation Water Productivity
3.5.1. Cotton Yield and Irrigation Water Productivity
Table 5 presents the cotton yield and irrigation water productivity data for 2021 and 2022. The statistical analysis revealed that drip frequency (DF) and seedling water quantity (SW) significantly influenced cotton yield composition and irrigation water productivity (p < 0.05). When DF was consistent, cotton yield increased proportionally with rising SW. In 2021, compared to the C1 treatment, C2 and C3 treatments exhibited increases of 6.47% and 14.67%, respectively. Similarly, in 2022, compared to the S1 treatment, S2 and S3 treatments showed increases of 5.95% and 30.24%. When SW remained constant, the yield was significantly larger in the high-frequency treatment, marking a 13.64% and 18.17% increase in 2021 and 2022, respectively, compared to the low-frequency treatment. There was no significant difference in cotton yield size between C6 treatments, S6 treatments, and CK treatment over two years. Moreover, the irrigation water productivity of all “dry sowing and wet emergence” treatments surpassed that of the CK treatment. Notably, treatments with high frequency and a larger amount of seedling water exhibited the highest irrigation water productivity. Specifically, the irrigation water productivity of C6 and S6 treatments reached 1.67 kg/m3 and 2.57 kg/m3, respectively, representing increases of 39.2% and 70.2% compared to the CK treatment. Compared to 2021, the mean values of seed cotton yield and irrigation water productivity increased by 1.26% and 40.02%, respectively, and irrigation water decreased by 26.09% during the reproductive period in 2022.
Table 5.
Cotton yield and water production efficiency under different water treatments.
3.5.2. Cotton Quality
In the two-year cotton study evaluating Macron value, short fiber rate, average upper half fiber length, and fiber neatness (Table 6), the “dry sowing wet emergence” water control treatment exhibited no significant difference in Macron value, ranging from 3.96 to 4.08, falling within the A level. Short fiber rates showed no significant difference between seedling water quantity treatments, while the high-frequency treatment displayed a significantly larger short fiber rate than the low-frequency treatment. Substantial differences were observed in the average length of the upper half of the fibers and fiber neatness across treatments. When the drip frequency (DF) was constant, both length and neatness increased with higher seedling water quantity (SW), particularly evident in C6 in 2021 and S6 in 2022, which significantly exceeded other “dry sowing and wet emergence” treatments. Conversely, when SW was the same, short fiber rates showed no significant differences among treatments. In instances where SW was constant, the high-frequency treatment demonstrated significantly greater average upper half fiber length and fiber neatness. In comparison to the control treatment (CK), the quality indices of the C6 treatment in 2021 and the S6 treatment in 2022 were closely aligned, reflecting higher cotton quality. Compared with 2021, in 2022, the Macron value, the average length of the upper part of the fiber and the fiber straightness, decreased by 1.53%, 4.66% and 1.67%, respectively, and the proportion of staple fiber percentage increased by 18.32%.
Table 6.
Quality indexes of fiber treated with different water in 2021–2022.
3.5.3. Irrigation Volume and Drip Frequency in Relation to Yield, Fiber Quality, and Water Productivity
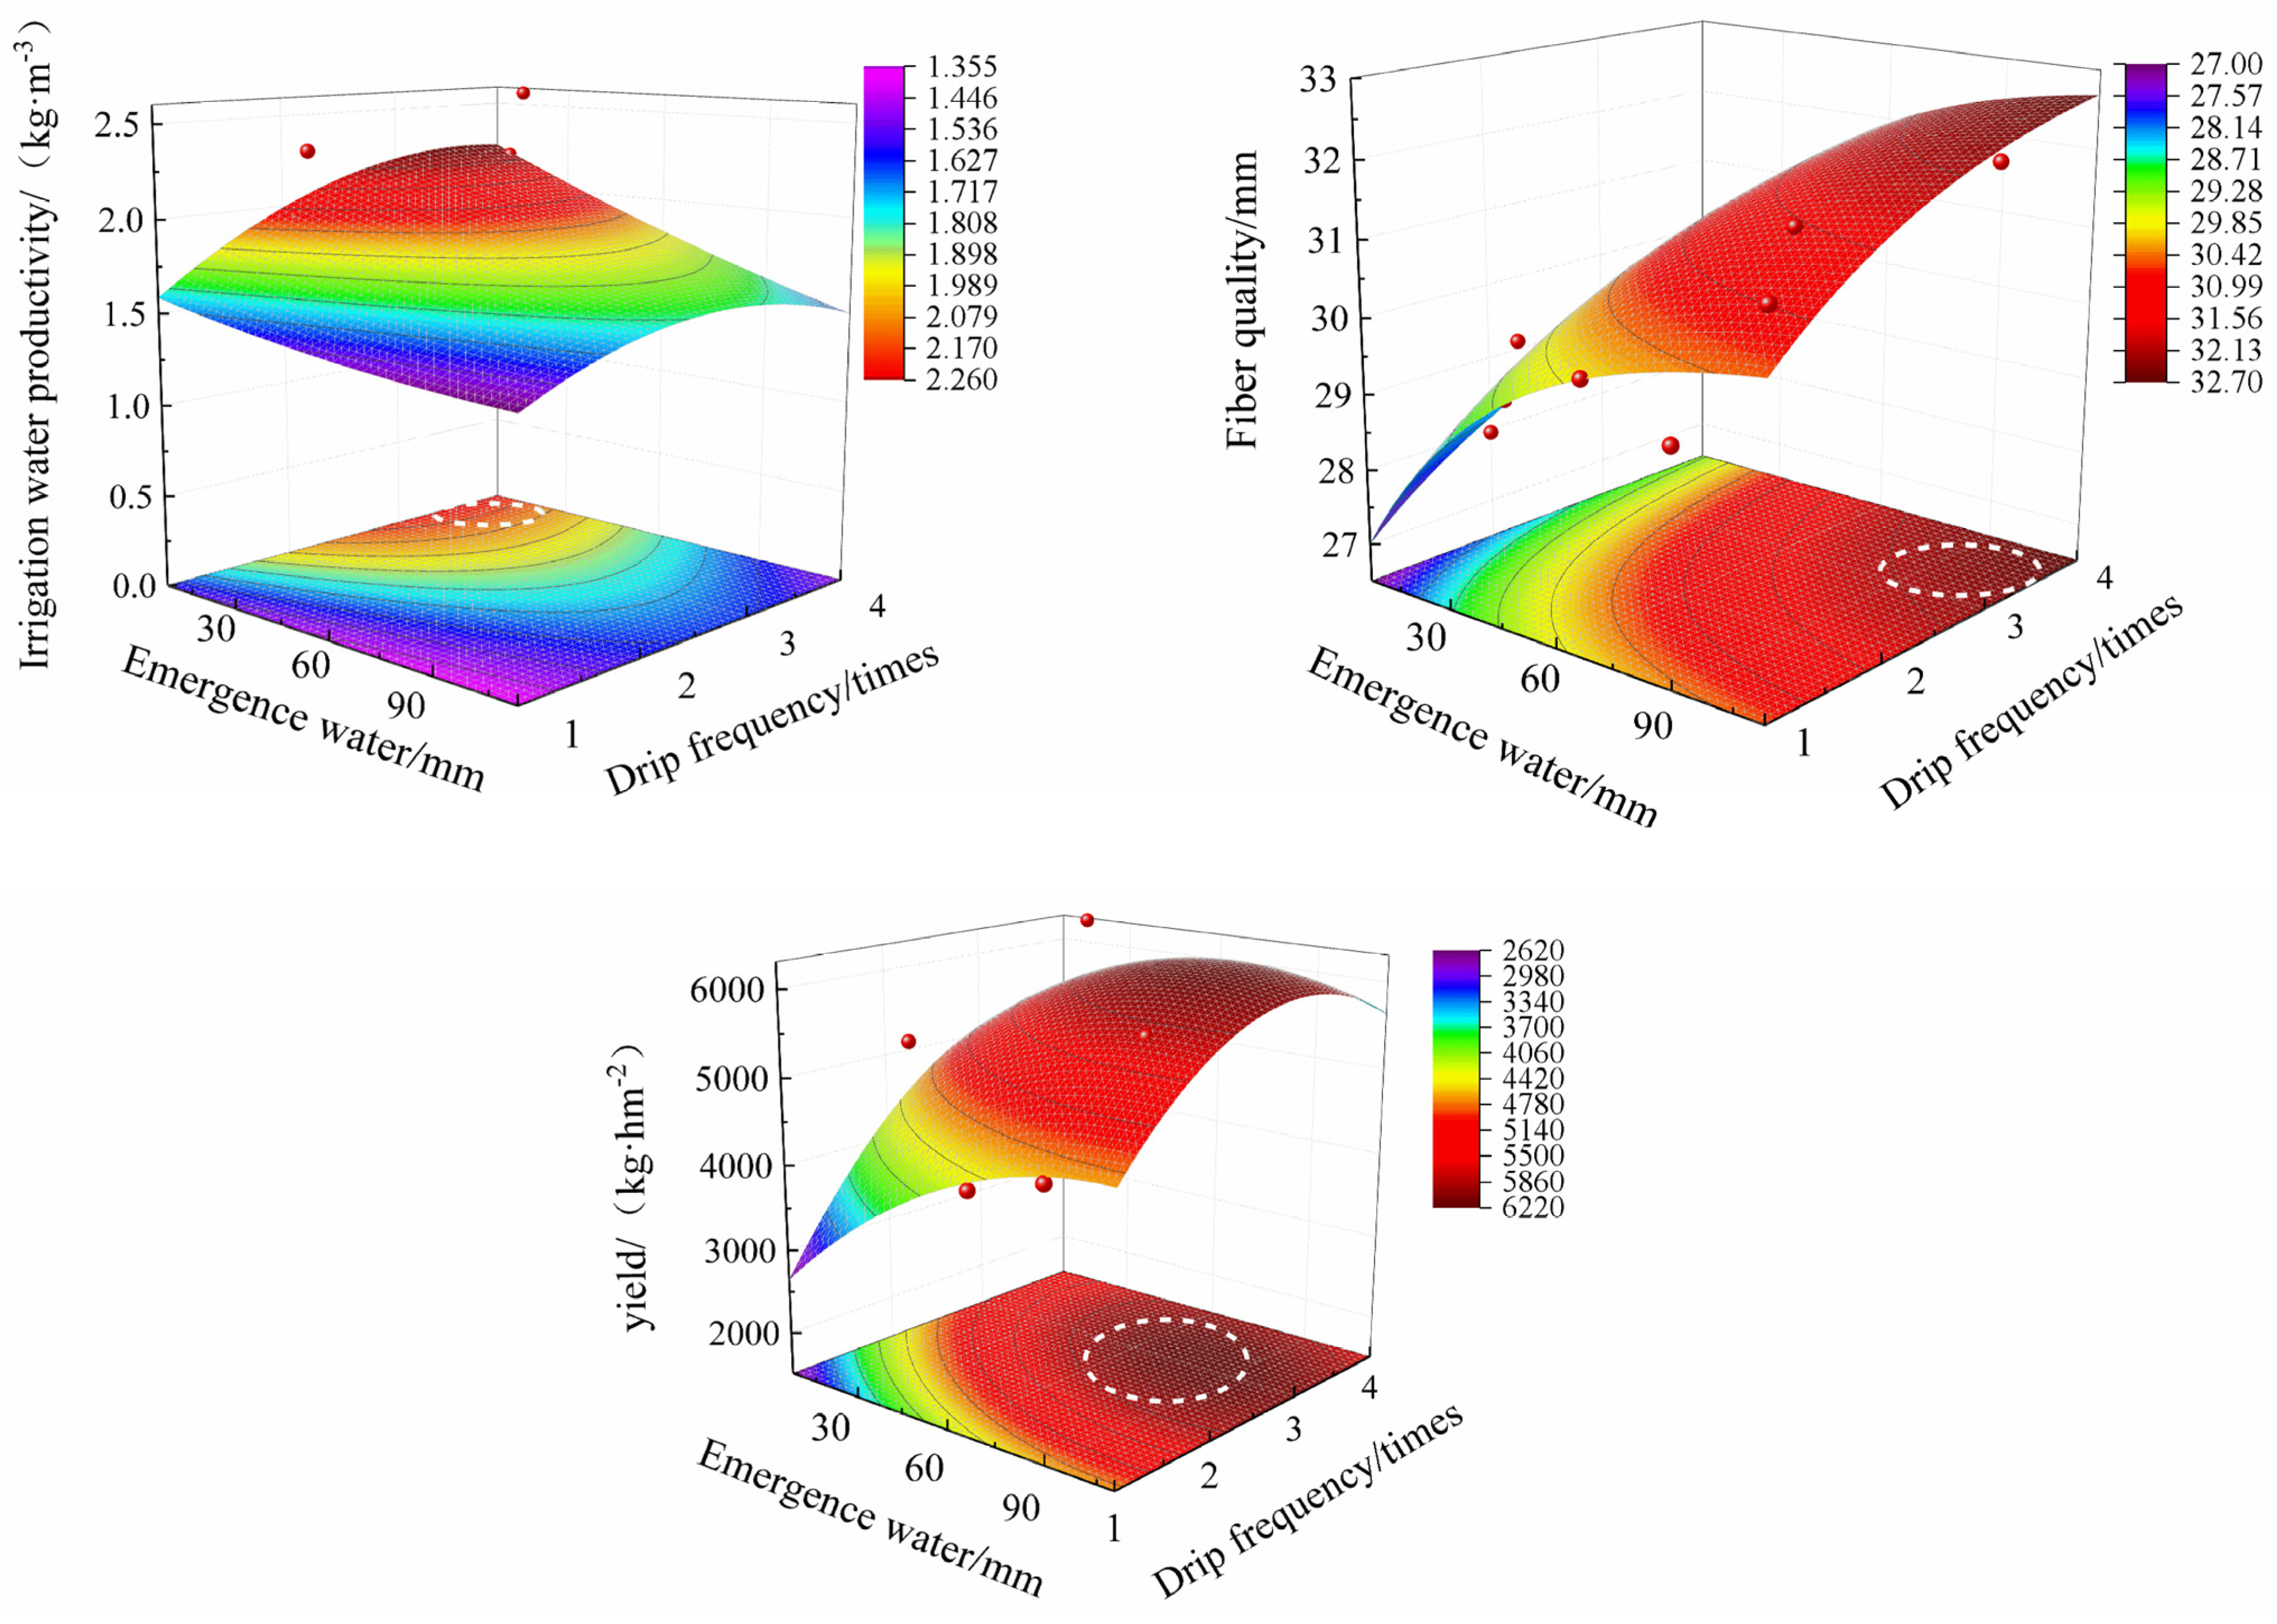
Utilizing two years of experimental data, the least squares method was applied with drip frequency and seedling water volume as independent variables and seed cotton yield, quality, and irrigation water production efficiency as dependent variables. The binary quadratic equation, GaussCum, and LogisticCum functions were chosen for data fitting, yielding regression equations used to calculate the values maximizing crop yield, quality, and irrigation water production efficiency (Table 7). When the seedling water volume is 6 mm and the drip frequency is one time, cotton irrigation water productivity peaks at 2.122 kg/m3. Considering water conservation and increased yield as primary objectives, and accounting for the 95% confidence interval of each dependent variable, the seedling water volume and drip frequency that optimize cotton yield, quality, irrigation water productivity, and dry matter accumulation can be determined (Figure 8). Specifically, when the seedling water volume is three times, achieving 66.133 mm, the average length of the upper part of the fiber reaches the maximum value of 32.689 mm, ensuring the highest cotton quality. With a seedling water quantity of 66.133 mm and a drip frequency of three times, confidence intervals for cotton yield, quality, irrigation water productivity, and dry matter accumulation are guaranteed to be above 95%.
Table 7.
Regression analysis of drip frequency, seedling water quantity and cotton yield, quality, and irrigation water production efficiency.
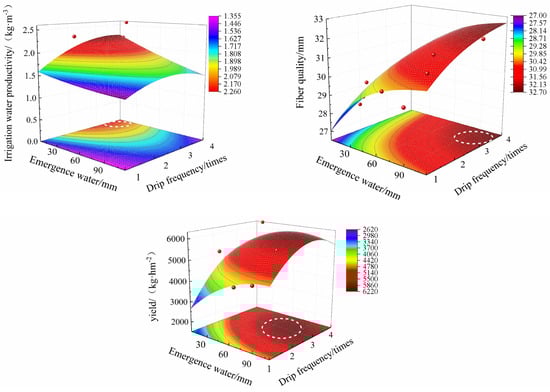
Figure 8.
Cotton yield, quality, and irrigation water use efficiency in relation to seedling water quantity and drip frequency. Note: The red dots in the graph indicate the actual values of yield, quality, or irrigation water use efficiency data for each treatment, and the range of dashed lines in the graph indicates the range of irrigation water volumes and drip frequencies that maximize yield, quality, or irrigation water use efficiency.
4. Discussion
4.1. Effect of “Dry Sowing and Wet Emergence” Water Regulation on Cotton Growth Characteristics
The “dry sowing wet emergence” water control technology, when compared to traditional winter and spring irrigation, involves applying only a minimal amount of drip to cotton after sowing. This approach significantly enhances water utilization, effectively mitigates water use conflicts in winter and spring, and avoids issues associated with excessive or insufficient drip application during seedling watering, such as soil curing, crusting, and hardening. Excessive drip amounts may reduce soil temperature, impacting cotton seedling growth, while insufficient drip amounts fail to meet the crop’s necessary water requirements for normal growth. Therefore, the implementation of a well-designed “dry sowing wet emergence” water control program is crucial for optimal cotton growth.
In this study, disparities were observed in the individual growth characteristics of cotton subjected to varying water control treatments between 2021 and 2022. During the seedling stage, an augmentation in seedling water quantity resulted in a gradual decline in the individual growth index of cotton, inhibiting growth. Notably, the treatment with a smaller seedling water quantity (C1) exhibited more rapid growth. Conversely, from the bud to the flossing stage, a larger seedling water quantity facilitated stronger cotton growth. These findings align with the research outcomes of Herritt et al. and Wu et al. [21,22] regarding the growth characteristics of cotton under diverse water regimes. Moisture plays a crucial role in controlling cotton growth, particularly during the seedling stage when water demand is low, and the root system is in a shallow soil layer. Soil moisture content and temperature become vital determinants for promoting cotton seedling growth [23,24,25]. In the first year of the “dry sowing and wet emergence” test, in order to follow the principle of “first water pressure salt“, the amount of seedling emergence was significantly larger than that in 2022, and excessive water irrigation led to a decrease in soil temperature, which slowed down the growth of cotton seedlings [26,27]. Xiao, et al. [28] observed, through different irrigation frequency treatments, that high-frequency irrigation positively influenced cotton growth, consistent with our experiment’s findings on drip frequency treatment. It may be because the irrigation quota of each high-frequency treatment is gradually reduced. Compared with the low-frequency treatment, the deep leakage water is smaller, the soil moisture content in the main root zone of cotton is larger, and the soil moisture environment is more suitable for cotton growth.
4.2. Impact of “Dry Sowing and Wet Emergence” Water Control on the Cotton’s Physiological Characteristics
Under normal crop growth, light energy absorbed by leaves is mainly consumed through three pathways: photosynthesis, chlorophyll fluorescence, and heat dissipation. These three pathways are interconnected (Yi, et al., 2019) [29], and the changes in chlorophyll fluorescence parameters of leaves can be an effective measure of the photosynthesis and heat dissipation of the crop (Lei et al., 2017) [30]. In this study, we found that the SPAD value of cotton tended to increase gradually with the decrease in the amount of emergence water in “dry sowing and wet emergence”, which was consistent with the results of Han et al. (2017) [31], indicating that chlorophyll synthesis was inhibited, which in turn limited photosynthesis in cotton leaves and led to the inhibition of cotton growth. The smaller parameters of leaf initial fluorescence (F0’), maximum fluorescence (Fm’), variable fluorescence (Fv’), and maximum photochemical efficiency of PS II (Fv’/Fm’) indicate that the plant forms fewer photosynthesized products, i.e., when the plant cells are subjected to environmental stress, the function of the chloroplasts is weakened, which affects the photosynthetic performance [32]. In this study, we found that Fv’/Fm’ and F0’ decreased significantly with the reduction of seedling water volume and drip frequency, indicating that the low seedling water volume and drip frequency could not meet the normal water demand of the crop during the reproductive period. Furthermore, findings indicate the photochemical activity of PSII was inhibited under the conditions of water stress, with the reduction of the electron transfer activity and the reduction of the maximal PSII light-energy conversion efficiency [33], and that the cotton leaves were unable to maintain the normal physiological function through their own adaptive regulation, thus leading to a reduction of photochemical efficiency [34]. qP is a self-protection mechanism within plants, which plays a certain protective role for the photosynthetic apparatus, so when the external conditions are poor, plants will trigger an internal response in the early stage before the manifestation of external symptoms [35,36]. In this experiment, the photochemical burst of qP in cotton leaves decreased gradually with the decrease of emergence water volume and drip frequency, which is consistent with the study of Deeba, et al. (2012) [37]. This indicates that the gradual decrease of emergence water volume can significantly inhibit the degree of opening of the PSII reaction center of cotton leaves and the energy involved in the photochemical electron transfer, so as to make the cotton leaves reduce the efficiency of the utilization of light energy. This in turn will reduce the efficiency of light-energy utilization by cotton leaves, thus affecting cotton yield.
4.3. Effect of “Dry Sowing Wet Emergence” Water Regulation on Cotton Yield, Quality, and Water Use Efficiency
In terms of cotton yield and its components, the number of bolls per plant, boll weight per plant, and seed cotton yield increased with the increase of emergence water in this experiment, which is more in line with the studies of Farooq, et al. (2002) and Ondrasek, et al. (2019) [38,39]. This finding may be attributed to the decrease in the amount of emergence water; the increase in crop water stress and the increase in the amount of irrigated soil moisture could only satisfy nutritive and reproductive growth in the lower and middle parts of the plant, with more vigorous growth of the root system and lower fruiting branches and leaves. However, the upper fruiting branches and leaves suffered from water stress, net photosynthetic intensity was affected, non-structural carbohydrate content decreased, and cotton bud boll shedding was aggravated, which resulted in reduced yield [40,41]. The present study also found that high frequency and large emergence water volume combinations significantly increased cotton yield and irrigation water productivity. Chartzoulakis, et al. (2002) and Li, et al.’s (2019) [42,43] studies were also the same as the present results, which may be due to the fact that low frequency and high emergence water volume treatments had a relatively large single irrigation quota and water in both the horizontal and vertical transport. This could easily cause part of the water waste, and at the same time, the low-frequency treatment water replenishment time interval is long, which may lead to transient water shortage during the reproductive period of cotton, reducing the number of bolls and boll weight, resulting in yield reduction [44,45]. The high-frequency large emergence water volume treatment has appropriate irrigation frequency and irrigation quota, relatively uniform soil profile water distribution, high water utilization, and better control of nutrient growth and promotion of reproductive growth, thus improving cotton yield. Cotton fiber quality is also an important indicator for determining the economic value of cotton [46]. Related studies have shown [47,48,49], with the increase in irrigation volume, the cotton fiber length and fiber neatness is significantly higher, but Markelung value was reduced. The results of this study’s fiber quality trend is the same; the treatment Markelung value is not significantly different, even if the difference between individual treatments is significant, but according to the evaluation method of cotton fiber quality [50], the difference is not beyond the range of the classification of cotton quality, and therefore, when determining the appropriate irrigation system it can not be taken into account [51].
5. Conclusions
After two years of experimental research, we found that the appropriate “dry sowing and wet emergence” water control technology can promote cotton growth, improve cotton yield, increase quality indicators, and significantly reduce agricultural irrigation water. Research results show that “dry sowing and wet emergence” of high-frequency, large emergence water volume affects cotton physiology. High-frequency treatments of cotton plant over two years led to significantly larger growth indicators, higher dry matter accumulation, and better yield average compared to the low-frequency treatment by 8.69%, 16.4% and 15.91%, respectively. The large emergence water volume treatment of cotton yield was 14.33% higher than the low emergence water volume treatment. Compared with the winter irrigation control treatment, “dry sowing and wet emergence” high frequency and large emergence water volume irrigation combination of cotton physiological, growth indicators are not significantly different Between the two years, the cotton leaf F0’, Fm’, and Fv’/Fm’ increased by 1.03%, 0.41%, and 0.85%, respectively. Dry matter accumulation and yield were reduced by 0.37% and 1.95%, but the irrigation water use efficiency increased by 54.7%, and the cotton yield was 14.33% higher than the low emergence water volume treatment. Utilization efficiency increased by 54.7%. In summary, the “dry sowing wet emergence” high-frequency (10.5 + 4.5 + 10.5 + 12 mm) and large seedling water quantity (15 mm) treatment not only ensured successful cotton emergence and growth, enhancing yield efficiency, but also fulfilled the objective of water-saving irrigation, making it applicable to the arid region of Northwest China. It serves as a preliminary recommended irrigation pattern for cotton production, and further research is needed to explore a more accurate and optimal “dry sowing and wet emergence” water control program in the future.
Author Contributions
Conceptualization, Y.D. and J.M.; methodology, J.Z. and Y.B.; software, B.C.; validation, X.H., M.Z. and S.Y.; formal analysis, Y.D.; investigation, J.M.; resources, B.D.; data curation, Y.D.; writing—original draft preparation, Y.D.; writing—review and editing, J.M.; visualization, Y.B.; supervision, J.Z.; project administration, Y.B. All authors have read and agreed to the published version of the manuscript.
Funding
The study was supported by the Major Science and Technology Special Projects of the Autonomous Region (2023A02012-1); National Natural Science Foundation of China (52269017); “Tianshan Talents” Leading Talents in Science and Technology Innovation of the Autonomous Region (2022TSYCLJ0069).
Data Availability Statement
The datasets used in the current study are available from the corresponding author on reasonable request.
Conflicts of Interest
The authors declare no conflicts of interest.
References
- Li, Y.B.; Wang, H.W.; Chen, Y.; Deng, M.J.; Li, Q.; Wu, F.A.; Wang, D.; Ma, L.G. Estimation of regional irrigation water requirements and water balance in Xinjiang, China during 1995–2017. PeerJ 2020, 8, e8243. [Google Scholar] [CrossRef] [PubMed]
- Li, Z.; Chen, Y.N.; Shen, Y.J.; Liu, Y.B.; Zhang, S.H. Analysis of changing pan evaporation in the arid region of Northwest China. Water Resour. Res. 2013, 49, 2205–2212. [Google Scholar] [CrossRef]
- Zhang, Q.; Wang, S. Processes of Water Transfer over Land Surface in Arid and Semi—Arid RegiOn of China. Water Resour. Res. 2007, 25, 1. Available online: http://www.ghqx.org.cn/EN/Y2007/V25/I2/1 (accessed on 10 February 2024).
- Feike, T.; Khor, L.Y.; Mamitimin, Y.; Ha, N.; Li, L.; Abdusalih, N.; Xiao, H.F.; Doluschitz, R. Determinants of cotton farmers’ irrigation water management in arid Northwestern China. Agric. Water Manag. 2017, 187, 1–10. [Google Scholar] [CrossRef]
- Ma, W.J.; Opp, C.; Yang, D.W. Spatiotemporal supply-demand characteristics and economic benefits of crop water footprint in the semi-arid region. Sci. Total Environ. 2020, 738, 139502. [Google Scholar] [CrossRef]
- Li, Y.B.; Deng, M.J. Spatiotemporal variations of agricultural water footprint and its economic benefits in Xinjiang, northwestern China. Sci. Rep. 2021, 11, 23864. [Google Scholar] [CrossRef]
- Yang, G.; Fan, Z.W.; Li, D.Z.; Feng, S.N.; Liu, G.Q.; Li, Q.Y.; Dong, Z.C. Prediction of water resource carrying status based on the ‘three red lines’ water resource management policy in the coastal area of Jiangsu Province, China. Water Policy 2022, 24, 1610–1630. [Google Scholar] [CrossRef]
- Fan, M.T.; Xu, J.H.; Chen, Y.; Li, D.H.; Tian, S.S. How to Sustainably Use Water Resources—A Case Study for Decision Support on the Water Utilization of Xinjiang, China. Water 2020, 12, 3564. [Google Scholar] [CrossRef]
- Cao, Y.D.; Zhang, W.; Ren, J.Z. Efficiency analysis of the input for water-saving agriculture in China. Water 2020, 12, 207. [Google Scholar] [CrossRef]
- Mao, Z.L.; Li, J.W.; Song, Y.P.; Pu, D.S. Dry sowing and wet emergence technology for cotton planting in saline land in Aksu. Rural Sci. Technol. 2020, 2020, 19–21. [Google Scholar]
- Wang, T.G.; Li, H.Q.; Cui, J.Q.; Ma, L.; Kong, X.H. Current status of the promotion and application of dry sowing and wet production technology for cotton in the Third Division. Xinjiang Agric. Reclam. Sci. Technol. 2022, 45, 4–5. [Google Scholar]
- Chen, X.L. Application effect and problems of double-film cover precision sowing technology for cotton in Bazhou, Xinjiang. China Cotton 2013, 40, 40–41. [Google Scholar]
- Yuan, X.T.; Bai, Y.G.; Sun, S.M. Effects of different emergence water on cotton physiological traits and yield under dry sowing and wet emergence mode. Water Sav. Irrig. 2022, 46–51. Available online: https://irrigate.whu.edu.cn/jsgg/CN/Y2022/V0/I9/46 (accessed on 10 February 2024).
- Zheng, M.; Bai, Y.G.; Zhang, J.H. Effects of dry sowing and wet emergence irrigation volume and irrigation frequency on soil sloughing, water-salt distribution and seedling emergence in cotton fields. Agric. Res. Arid Reg. 2022, 40, 100–107. [Google Scholar]
- Han, Z.Y.; Zhang, J.H.; Bai, Y.G. Effects of soil conditioner on soil properties and seedling emergence rate of “dry sowing and wet emergence” mode in cotton fields in southern Xinjiang. Water Sav. Irrig. 2022, 46–52+59. Available online: https://irrigate.whu.edu.cn/jsgg/CN/Y2022/V0/I8/46 (accessed on 10 February 2024).
- Tang, L.S.; Li, Y.; Zhang, J. Biomass allocation and yield formation of cotton under partial rootzone irrigation in arid zone. Plant Soil 2010, 337, 413–423. [Google Scholar] [CrossRef]
- Lokhande, S.; Reddy, K.R. Reproductive and fiber quality responses of upland cotton to moisture deficiency. Agron. J. 2014, 106, 1060–1069. [Google Scholar] [CrossRef]
- Brewer, M.J.; Anderson, D.J.; Parajuleef, M.N. Cotton water-deficit stress, age, and cultivars as moderating factors of cotton fleahopper abundance and yield loss. Crop Prot. 2016, 86, 56–61. [Google Scholar] [CrossRef]
- Ünlü, M.; Kanber, R.; Kapur, B.; Tekin, S.; Koç, D.L. The crop water stress index (CWSI) for drip irrigated cotton in a semi-arid region of Turkey. Afr. J. Biotechnol. 2011, 10, 2258–2273. [Google Scholar] [CrossRef]
- Department of Rural Socio-Economic Survey, National Bureau of Statistics. China County Statistical Yearbook-2020 (County and City Volume); China Statistics Press: Beijing, China, 2021; p. 408. [Google Scholar]
- Herritt, M.T.; Thompson, A.; Thorp, K. Irrigation management impacts on cotton reproductive development and boll distribution. Crop Sci. 2022, 62, 1559–1572. [Google Scholar] [CrossRef]
- Wu, L.F.; Zhang, F.C.; Zhou, H.M.; Suo, Y.S.; Xue, F.D.; Zhou, J.W.; Liang, F. Effect of drip irrigation and fertilizer application on water use efficiency and cotton yield in North of Xinjiang. Trans. Chin. Soc. Agric. Eng. 2014, 30, 137–146. [Google Scholar]
- Reddy, K.R.; Brand, D.; Wijewardana, C.; Gao, W. Temperature effects on cotton seedling emergence, growth, and development. Agron. J. 2017, 109, 1379–1387. [Google Scholar] [CrossRef]
- Steiner, J.J.; Jacobsen, T.A. Time of planting and diurnal soil temperature effects on cotton seedling field emergence and rate of development. Crop Sci. 1992, 32, 238–244. [Google Scholar] [CrossRef]
- Ding, B.X.; Cao, H.M.; Bai, Y.G.; Guo, S.C.; Zhang, J.H.; He, Z.J.; Wang, B.; Jia, Z.L.; Liu, H.B. Effect of biofertilizer addition on soil physicochemical properties, biological properties, and cotton yield under water irrigation with different salinity levels in Xinjiang, China. Field Crops Res. 2024, 308, 109300. [Google Scholar] [CrossRef]
- Heng, T.; Ma, Y.J.; Ai, P.R.; Liu, Z.Y.; Wu, M.; Liu, C.J. The Effects of Soil Salt Stress on the Nitrogen Uptake, Yield Response and Nitrogen Use Efficiency of Cotton in Arid Areas. Agronomy 2024, 14, 229. [Google Scholar] [CrossRef]
- Jouyban, Z. The effects of salt stress on plant growth. Tech. J. Eng. Appl. Sci. 2012, 2, 7–10. [Google Scholar]
- Xiao, C.; Ji, Q.Y.; Zhang, F.C.; Li, Y.; Fan, J.L.; Hou, X.H.; Yan, F.L.; Liu, X.Q.; Gong, K.Y. Effects of various soil water potential thresholds for drip irrigation on soil salinity, seed cotton yield and water productivity of cotton in northwest China. Agric. Water Manag. 2023, 279, 108172. [Google Scholar] [CrossRef]
- Yi, X.P.; Zhang, Y.L.; Yao, H.S.; Luo, H.H.; Gou, L.; Chow, W.S.; Zhang, W.F. Rapid recovery of photosynthetic rate following soil water deficit and re-watering in cotton plants (Gossypium herbaceum L.) is related to the stability of the photosystems. J. Plant Physiol. 2016, 194, 23–34. [Google Scholar] [CrossRef]
- Lei, Z.L.; Jian, J.W.; Hong, K.Z.; Xiao, H.L.; Qian, F.W.; Xue, L.A.; Rui, T.L. Chlorophyll fluorescence and its progress in detecting water stress. Spectrosc. Spectr. Anal. 2017, 37, 2780–2787. [Google Scholar]
- Han, J.M.; Flexas, J.; Xiong, D.L.; Galmes, J.; Zhang, Y.L. Regulation of photosynthesis and water-use efficiency in pima and upland cotton species subjected to drought and recovery. Photosynthetica 2024, 62, 6–15. [Google Scholar] [CrossRef]
- Guo, C.C.; Liu, L.T.; Sun, H.C.; Wang, N.; Zhang, K.; Zhang, Y.J.; Zhu, J.J.; Li, A.C.; Bai, Z.Y.; Liu, X.Q.; et al. Predicting Fv/Fm and evaluating cotton drought tolerance using hyperspectral and 1D-CNN. Front. Plant Sci. 2022, 13, 1007150. [Google Scholar] [CrossRef]
- Khaleghi, E.; Arzani, K.; Moallemi, N.; Barzegar, M. Evaluation of chlorophyll content and chlorophyll fluorescence parameters and relationships between chlorophyll a, b and chlorophyll content index under water stress in Olea europaea cv. Dezful. Int. J. Agric. Biosyst. Eng. 2012, 6, 636–639. [Google Scholar]
- Lu, C.; Zhang, J. Effects of water stress on photosynthesis, chlorophyll fluorescence and photoinhibition in wheat plants. Funct. Plant Biol. 1998, 25, 883–892. [Google Scholar] [CrossRef]
- Chattha, W.S.; Shakeel, A.; Iqbal, M.; Yaseen, M.; Amin, M.; Mahmood, N. Quantifying the Effect of Water Deficit on Cotton Genotypes Using Agro-physiological and Biochemical Parameters. J. Nat. Fibers 2021, 18, 1995–2005. [Google Scholar] [CrossRef]
- Yoshizumi, Y.; Li, M.S.; Akihiro, I. Assessment of photochemical reflectance index as a tool for evaluation of chlorophyll fluorescence parameters in cotton and peanut cultivars under water stress condition. Agric. Sci. China 2010, 9, 662–670. [Google Scholar] [CrossRef]
- Deeba, F.; Pandey, A.K.; Ranjan, S.; Mishra, A.; Singh, R.; Sharma, Y.K.; Shirke, P.A.; Pandey, V. Physiological and proteomic responses of cotton (Gossypium herbaceum L.) to drought stress. Plant Physiol. Biochem. 2012, 53, 6–18. [Google Scholar] [CrossRef] [PubMed]
- Farooq, M.; Hussain, M.; Wakeel, A.; Siddique, K.H. Salt stress in maize: Effects, resistance mechanisms, and management. A review. Agron. Sustain. Dev. 2015, 35, 461–481. [Google Scholar] [CrossRef]
- Ondrasek, G.; Rengel, Z.; Veres, S. Soil salinisation and salt stress in crop production. In Abiotic Stress in Plants—Mechanisms and Adaptations; IntechOpen: London, UK, 2011; pp. 171–190. [Google Scholar]
- Wang, R.; Ji, S.; Zhang, P.; Meng, Y.L.; Wang, Y.H.; Chen, B.L.; Zhou, Z.G. Drought effects on cotton yield and fiber quality on different fruiting branches. Crop Sci. 2016, 56, 1265–1276. [Google Scholar] [CrossRef]
- Basal, H.; Dagdelen, N.; Unay, A.; Yilmaz, E. Effects of deficit drip irrigation ratios on cotton (Gossypium hirsutum L.) yield and fibre quality. J. Agron. Crop Sci. 2009, 195, 19–29. [Google Scholar] [CrossRef]
- Chartzoulakis, K.; Patakas, A.; Kofidis, G.; Bosabalidis, A.; Nastou, A. Water stress affects leaf anatomy, gas exchange, water relations and growth of two avocado cultivars. Sci. Hortic. 2002, 95, 39–50. [Google Scholar] [CrossRef]
- Li, H.; Qi, Z.; Gui, D.; Zeng, F. Water use efficiency and yield responses of cotton to field capacity-based deficit irrigation in an extremely arid area of China. Int. J. Agric. Biol. Eng. 2019, 12, 91–101. Available online: https://www.ijabe.org/index.php/ijabe/article/view/4571 (accessed on 10 February 2024). [CrossRef]
- Ding, B.X.; Cao, H.X.; Zhang, J.H.; Bai, Y.G.; He, Z.J.; Guo, S.C.; Wang, B.; Jia, Z.L.; Liu, H.B. Biofertilizer application improved cotton growth, nitrogen use efficiency, and yield in saline water drip-irrigated cotton fields in Xinjiang, China. Ind. Crops Prod. 2023, 205, 117553. [Google Scholar] [CrossRef]
- Pettigrew, W.T. Moisture deficit effects on cotton lint yield, yield components, and boll distribution. Agron. J. 2004, 96, 377–383. [Google Scholar] [CrossRef]
- Dağdelen, N.; Başal, H.; Yılmaz, E.; Gürbüz, T.; Akcay, S. Different drip irrigation regimes affect cotton yield, water use efficiency and fiber quality in western Turkey. Agric. Water Manag. 2009, 96, 111–120. [Google Scholar] [CrossRef]
- Yilmaz, E.; Gürbüz, T.; Dağdelen, N.; Wzorek, M. Impacts of different irrigation water levels on the yield, water use efficiency, and fiber quality properties of cotton (Gossypium hirsutum L.) irrigated by drip systems. Euro-Mediterr. J. Environ. Integr. 2021, 6, 53. [Google Scholar] [CrossRef]
- Basal, H.; Sezener, V.; Canavar, O.; Kızılkaya, K.; Dagdelen, N. Effects of water stress and plant density on cotton (Gossypium hirsutum L.) cultivars differing in maturity and seed size: I. Yield components and fiber quality parameters. Int. J. Agric. Innov. Res. 2014, 3, 755–760. [Google Scholar]
- Ul-Allah, S.; Rehman, A.; Hussain, M.; Farooq, M. Fiber yield and quality in cotton under drought: Effects and management. Agric. Water Manag. 2021, 255, 106994. [Google Scholar] [CrossRef]
- Glade, E.H. Cotton Quality Evaluation: Testing Methods and Use; US Department of Agriculture, Economic Research Service: Washington, DC, USA, 1981.
- Zhang, D.M.; Luo, Z.; Liu, S.H.; Li, W.J.; Tang, W.; Dong, H. Effects of deficit irrigation and plant density on the growth, yield and fiber quality of irrigated cotton. Field Crops Res. 2016, 197, 1–9. [Google Scholar] [CrossRef]
Disclaimer/Publisher’s Note: The statements, opinions and data contained in all publications are solely those of the individual author(s) and contributor(s) and not of MDPI and/or the editor(s). MDPI and/or the editor(s) disclaim responsibility for any injury to people or property resulting from any ideas, methods, instructions or products referred to in the content. |
© 2024 by the authors. Licensee MDPI, Basel, Switzerland. This article is an open access article distributed under the terms and conditions of the Creative Commons Attribution (CC BY) license (https://creativecommons.org/licenses/by/4.0/).