Article

Effect of Different Nitrogen Levels on Water and Nitrate Distribution in Aeolian Sandy Soil under Drip Irrigation

College of Hydraulic Science and Engineering, Yangzhou University, Yangzhou 225009, China
*
Author to whom correspondence should be addressed.
Agronomy 2024, 14(4), 798; https://doi.org/10.3390/agronomy14040798
Submission received: 20 February 2024 / Revised: 18 March 2024 / Accepted: 22 March 2024 / Published: 11 April 2024
(This article belongs to the Special Issue Influence of Irrigation and Water Use on Agronomic Traits of Crop)

Abstract

:
Understanding the distribution of water and nitrate nitrogen in the soil profile is crucial for the reasonable operation of fertigation, and it is also fundamental for controlling and regulating nitrate nitrogen in the root zone, thereby meeting a crop’s requirements. The application rates of fertilizer and water directly influence this distribution of water and nitrate nitrogen. However, the effects in Aeolian sandy soil, a type of developing soil bordering deserts, remain ambiguous. In this study, field experiments for different drip fertigation treatments in Aeolian sandy soil were conducted to investigate the soil water distribution, as well as that of nitrate nitrogen. A completely randomized experimental design was implemented, encompassing three levels of irrigation amount: low (W1), medium (W2), and high (W3), and three levels of nitrogen application rate: low (F1), medium (F2), high (F3). After the completion of each irrigation treatment, soil samples were extracted at 10–20 cm intervals. The soil water and nitrate nitrogen contents in the profiles of these samples were measured. The experimental results revealed that increasing the nitrogen application rate facilitated the retention of greater amounts of water and nitrate nitrogen in the soil profile. However, with an increase in the nitrogen application rate, both soil water and nitrate nitrogen exhibited a radial tendency to move away from the drip emitter. Some moved upward and accumulated in surface soil near a ridge furrow, while some moved downward and remained in a deeper area approximately 30 cm horizontally from the emitter at depths of 40–60 cm. The uniformity of the water distribution decreased with increasing nitrogen application under low water conditions, with a reversal of this trend observed in medium and high water treatments. The effect of nitrogen application level on the uniformity of the nitrate nitrogen distribution was not significant. There was no significant correlation between the average soil water content and nitrate nitrogen content along the horizontal direction, however, a positive correlation existed in the vertical direction. In the whole profile, increasing the nitrogen application enhanced the correlation under low water conditions, but under medium and high water conditions, this trend was the opposite. This implies that, to avoid nitrate nitrogen leaching or limiting in a specific area, a moderate nitrogen application level is advisable. Under low water conditions, nitrogen application showed a positive effect on the nitrate nitrogen content, and a higher application is recommended. In cases of substantial water irrigation or rainy years, the nitrogen application rate should be decreased.

1. Introduction

Nitrogen is the basic production material for plant growth, directly influencing crop yield [1]. In practice, owing to the one-sided pursuit of high yields, nitrogen is frequently applied in excess. Consequently, China has become one of the countries with the largest annual utilization of nitrogen fertilizer in the world, and its application amount per unit area surpasses the world average level [2]. Traditional fertilization schedules must be developed by considering various factors, including irrigation, rainfall, and stage of plant growth. Fertilizers are frequently centrally applied during the critical periods of crops, utilizing irrigation water or rainwater as the medium for dissolution and transport. Thus, traditional fertilization schedules are characterized by a large single fertilization amount and an extended utilization duration. Under circumstances where irrigation is unreasonable or rainfall is short-term but substantial, nitrogen fertilizer is prone to loss through runoff, drainage, deep leakage, and denitrification, resulting in problems such as a low fertilizer efficiency, uneconomical practices, and non-point source pollution [3,4,5].
Controlling nitrogen in the soil layer, where roots are mainly distributed, may represent the optimal approach to enhancing fertilizer efficiency and mitigating the risk of non-point source pollution. To achieve these objectives, researchers have implemented a range of measures from the perspectives of irrigation and fertilization. Examples include optimizing irrigation scheduling to reduce water infiltration by reducing irrigation quotas [6,7,8]; controlling the soil water content and distribution in the root zone using efficient water-saving irrigation technology [9,10]; reducing fertilizer application to reduce nitrogen loss [11,12]; and using slow-release fertilizers to prolong the effective duration of fertilizers [13,14]. These measures have achieved some successful outcomes.
Among these measures, drip irrigation, a water-saving irrigation technology that confines water supply to the root zones of each plant, offers distinct advantages compared to other measures. Adjusting the irrigation parameters of drip irrigation could align the moist soil area with the root distribution area [15]. As nutrients are dissolved and transported by the soil water, the nutrient distribution and the root distribution could be coordinated under drip irrigation [16,17]. At the same time, the pipe network in the drip irrigation system provides the basis for the application of fertigation. Nitrogen fertilizer could be transported directly to the root zone upon dissolution and easily taken up by crop roots. Therefore, the nitrogen loss by runoff or leaching will be reduced [18]. Furthermore, drip irrigation provides water regularly and quantitatively in accordance with crop water demand. It could also provide the fertilizer precisely according to the law of crop fertilizer demand [19]. With the combination of these advantages, drip irrigation achieves precise control over the distribution of water and fertilizer. Furthermore, it offers a valuable approach for utilizing Aeolian sandy soil, which is characterized by poor water retention and nutrient-preserving capacity.
Aeolian sandy soil represents a prevalent soil resource in the northwest of Liaoning along the southeast edge of Horqin Sandy Land of Inner Mongolia, northern China. The soil primarily consists of fine sand with a low moisture content and poor water and fertilizer retention. Crops in this region heavily rely on rainfall and some supplementary irrigation. Due to water shortages, irrigation is limited. To improve yield, individuals must cultivate additional land. The average yield of maize is only 4.5–6.0 t hm−2. Land productivity is notably low, which seriously restricts regional agricultural and economic development. As mentioned above, it seems that drip irrigation has the potential to alter this circumstance.
Fertigation changes the form of fertilizer on the field, improves the fertilizer use efficiency, and theoretically, it has the potential to reduce the amount of nitrogen fertilizer needed [20]. On the other hand, drip irrigation improves the soil environment and affords better conditions for plant growth. Roots gain easier access to water and nitrogen fertilizer, potentially increasing the demand for both [21]. However, if the application of water and nitrogen fertilizer increases, the likelihood of leaching for dissolved nitrogen fertilizer rises, necessitating a reduction in the fertigation quota. These above contradictions might be more obvious in Aeolian sandy soil, needing to be solved as a priority. Regardless of the quantities of water and nitrogen fertilizers applied, the spatial distribution characteristics of water and nitrogen fertilizer in the soil always serve as the foundation for assessing the rationality of dosages and are pivotal in formulating fertigation schedules.
In our early experiments, drip irrigation with traditional fertilization management was conducted and single irrigation scheduling was developed. In this paper, fertigation will be carried out, and the application of nitrogen fertilizer will be regulated based on previous work. This study aims to investigate the distribution characteristics of water and nitrate nitrogen in the main root layer of maize under different fertilization conditions, analyze the effects of nitrogen application on water and nitrate nitrogen distribution, and thus provide a theoretical basis for the application of the fertigation in Aeolian sandy soil.

2. Materials and Methods

2.1. Experimental Site

The study site was located at the Beidianzi village (E 122°23′, N 42°50′), Zhangwu country, Liaoning province, China. Situated along the southeast edge of Horqin Sandy Land of Inner Mongolia, the site belongs to the temperate semi-arid monsoon climate zone, characterized by being dry, windy, and dusty. The annual average rainfall is 412 mm. It distributes unevenly throughout the year and 60–70% of the rainfall is in summer. The annual average evaporation is 1781 mm; the annual average temperature is 6.1 °C; the average wind speed is 3.7–4.2 mm s−1; the maximum instantaneous wind speed is 24.0 mm s−1; sandstorm weather is 10–15 d; the plant growing period is 145–150 d; and the frost-free period is 154 d. The soil in the test area is mainly mobile wind sand, with a dry density of about 1.69 g cm−3. The field water capacity is 12%, the wilting water content is 1.7%, and the saturated water content is 16.9%. The mechanical composition of the soil is mainly fine sand, accounting for 70%, with very little clay particles and coarse sand. The organic matter content is 0.66 g kg−1.

2.2. Description of the Experiment

The maize test variety was “Liaodan 535” (growth period from May to September). Seedling beds were built 0.1 m high and 5 m long. The bed width was 1.2 m and the ridge surface was 0.7 m wide with a slope of 45°. Drip irrigation tubes, with 0.2 m emitter intervals, were placed on the center of each bed. Polyethylene mulch, with the same width as the ridge surface and 0.008 mm thick, was applied over the beds along the drip tubes. Maize was planted 0.2 m around the drip tube at intervals of 0.27 m in rows. Specifically, maize was planted in alternating wide and narrow rows, with wide spacings set at 0.8 m and narrow spacings at 0.4 m. Based on the maize growth, it was divided into five growth periods: the seedling period, jointing period, spike period, filling period, and mature period.
The experiment was arranged in a randomized complete block design with nine treatments and three replications. Thus, there were 27 plots and the dimension of each plot was 5 m × 6 m. The treatments involved three levels of irrigation management and three levels of fertilization management. The following irrigation regimes were applied:
W = αKci (Ek,5Pk,5)
where W is the water irrigated; Ek,5 is the accumulated evaporation every 5 days; Pk,5 is the accumulated rainfall of 5 days; subscript k is the sequence number of the 5 days after planting; Kci is the crop coefficient of each growth period; and subscript i is the sequence number of the growth period, i = 1, 2, …, 5. In this paper, numbers 1 to 5 represent the seedling, jointing, spike, filling, and mature periods, and Kc equals to 0.45, 0.55, 1.2, 1, and 0.7, respectively, while α is the water management coefficient. According to the experiment design, α takes 0.4 (W1 means applying a low water amount), 0.8 (W2 means applying a medium water amount), and 1.2 (W3 means applying a high water amount). Finally, during the growth period, all the treatments were irrigated 13 times, and the application rates of W1, W2, and W3 were 145 mm, 290 mm. and 435 mm respectively.
The fertilization management levels were the recommended nitrogen fertilizer amount (F2), 70% of the recommendation (F1), and 130% of the recommendation (F3). The recommended nitrogen fertilizer amount was 225 kg·hm−2 (pure nitrogen). Thus, the nitrogen fertilizer amounts applied in F1 and F3 were 158 kg·hm−2 and 293 kg·hm−2 respectively.

2.3. Irrigation Management

Each treatment was equipped with an independent gravity drip irrigation system, comprising a 200 L tank and 15 drip tubes (5 tubes per plot). The tank was installed 0.8 m above the ground to store irrigation water. A valve was installed at the bottom of the tank. Before irrigation, the valve was closed and water was pumped into the tank. Upon reaching the calculated volume, according to the water meter, the pump was turned off. Subsequently, the valve was opened and water flowed into the plots under the influence of gravity. Irrigation continued until the tank was emptied.

2.4. Agronomic Practices

The maize was planted on 20 May 2022. Maize seeds were planted in alternate wide–narrow (80–40 cm) rows with a planting density of 61,730 plants ha−1. All of the treatments used the same P2O5 and K2O at 135 kg ha−1. The proportion of fertilizer was base fertilizer: jointing fertilizer: spike fertilizer =70:12:18. The base fertilizer was applied during spring sowing, facilitated by the integrated ridging–sowing–earthing–filming–fertilizing machine. During topdressing, phosphoric acid, urea, and potassium dihydrogen phosphate were added into the fertilizer tank and dissolved in water so that the fertilizer was fertigated with the irrigation water.
Other field management practices adhered to local customs. Before sowing, the seeds were dried and all plots were ploughed and leveled in preparation for spring sowing. At the same time, farm manure (chicken manure) was applied at the dosage of 1.5 t hm−2. During the jointing period, weeding and cultivating were carried out, and methamidophos was sprayed to control pests.

2.5. Sampling and Chemical Analysis

Soil samples were collected from each plot at the final harvest. The samples were obtained at 0, 10, 20, 30, and 50 cm from the emitters and all sample depths were the same: 0–10, 10–20, 20–30, 30–40, and 40–60 cm. The soil water content was measured by the oven drying method. The samples were dried in an oven at 105 °C for 10 h. To measure the soil nitrate nitrogen content, the three replicate soil samples were mixed into one sample per treatment. All the soil samples were air-dried and passed through a 1 mm sieve. Subsequently, the samples were extracted with 0.01 mol L−1 of calcium chloride, and the nitrate nitrogen (NO3-N) content was analyzed using an ultraviolet spectrophotometer.

2.6. Statistical Analysis

All data gathered in the study were recorded and classified using Microsoft Office Excel 2023. Analyses of variance (ANOVAs) were conducted using SPSS 26.0 statistical software (IBM Corp., New York, NY, USA). The significance of the effect of all variables was examined by one-way ANOVA. The spatial distributions of water and NO3-N in a surface made at a distance from the emitters (60 cm) and depth of 60 cm were created using Surfer 8.0 (Golden Software LLc., Golden, CO, USA) and Origin8.0 (Origin Lab LLc., Northampton, MA, USA).

3. Results

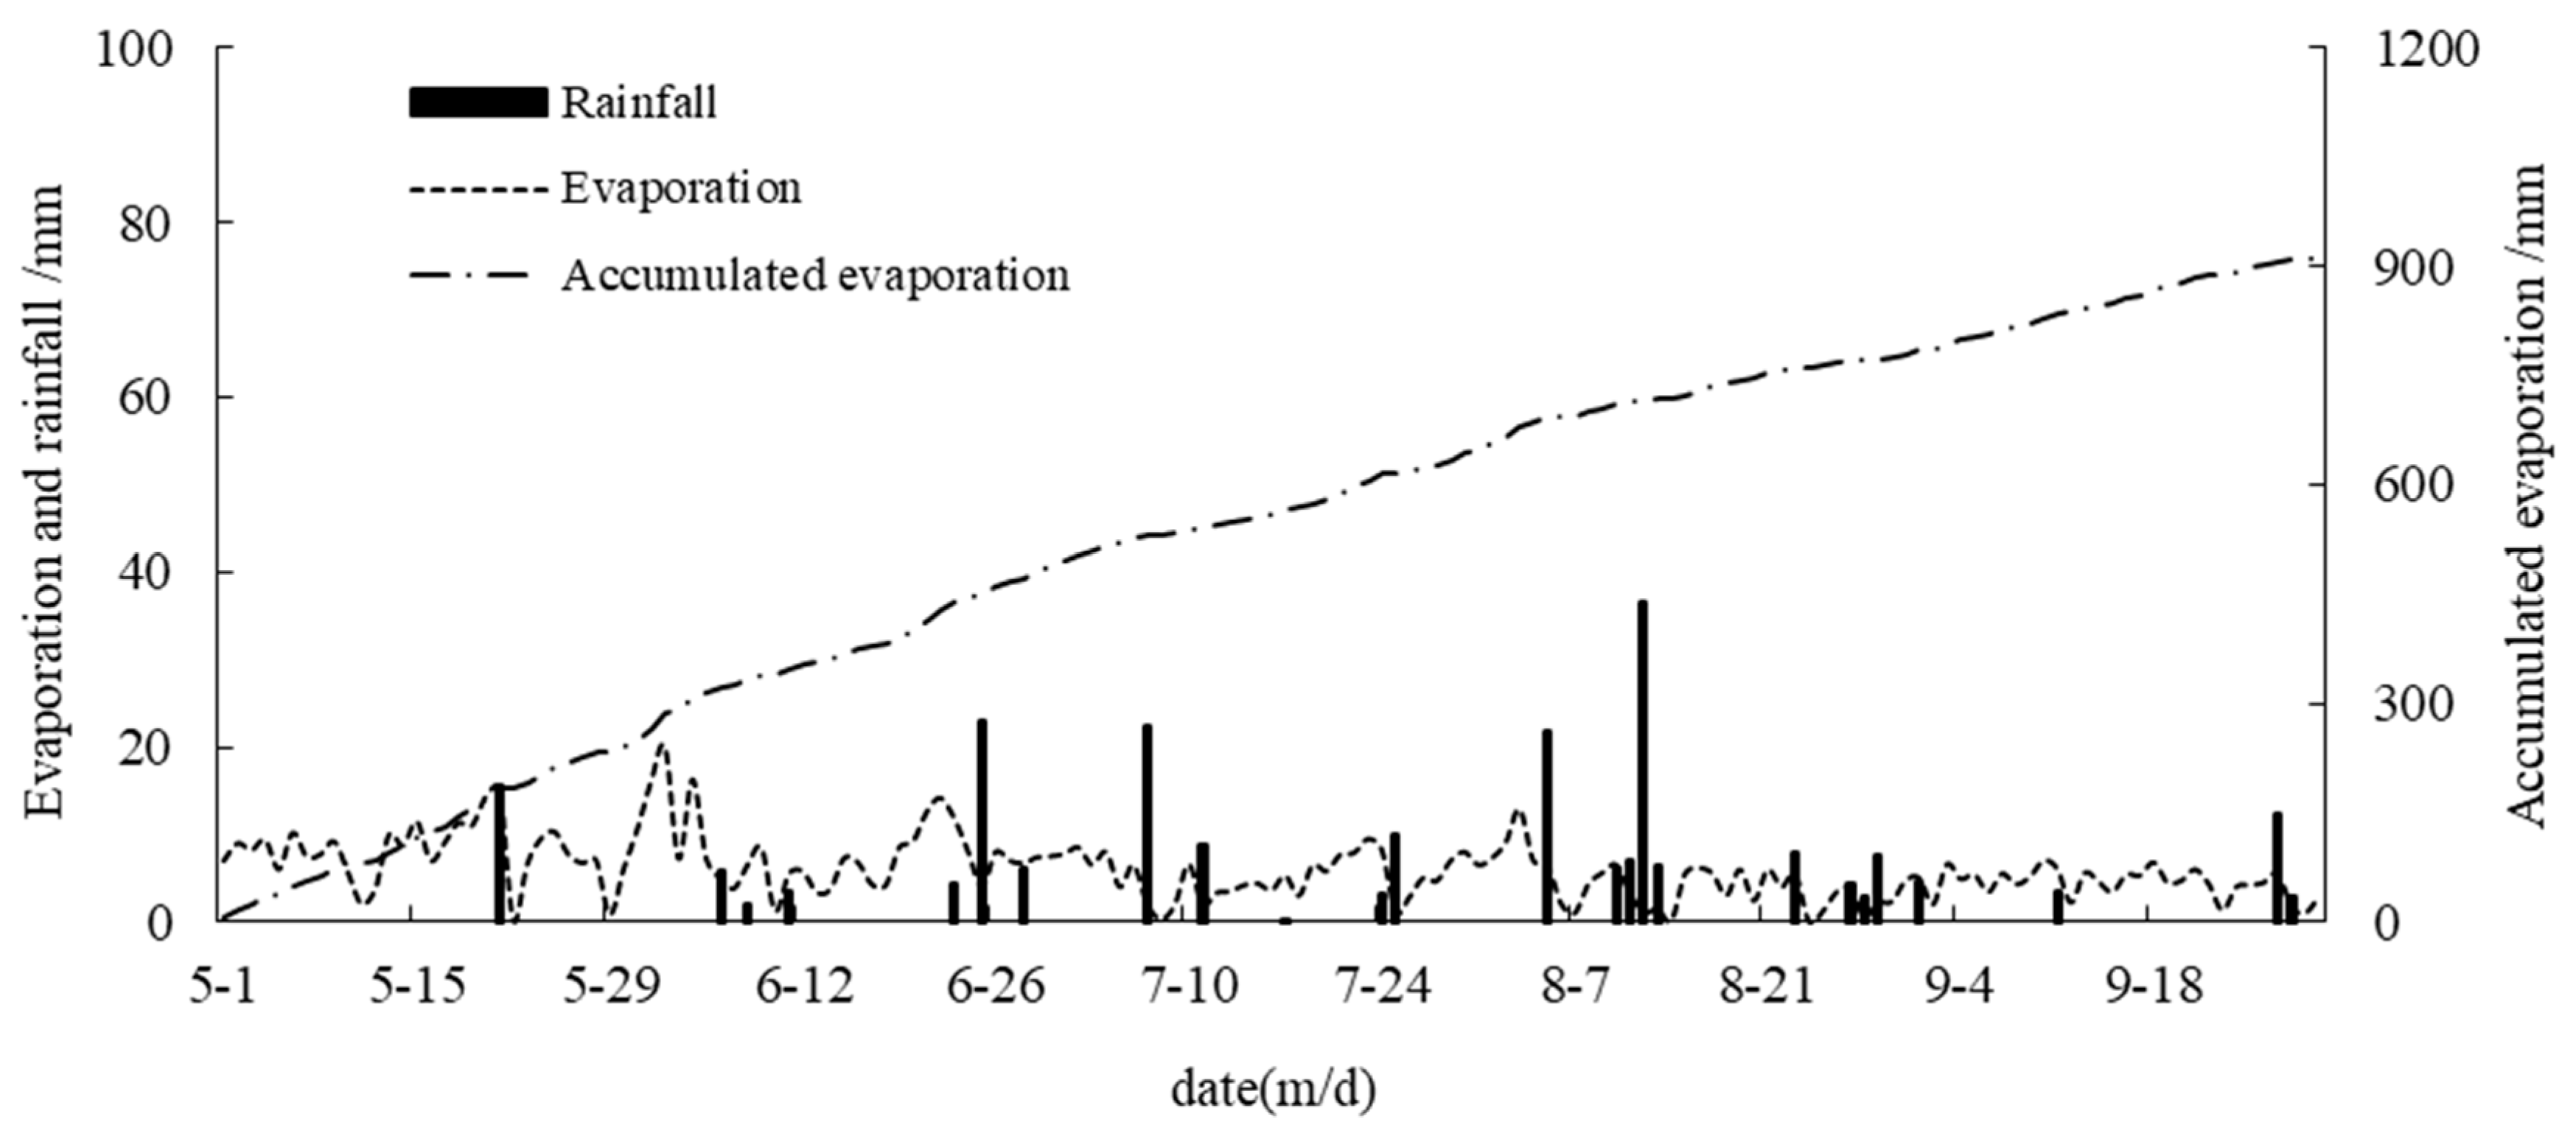
3.1. Rainfall and Evaporation

The evaporation, rainfall, and accumulated evaporation during the maize growth period are shown in Figure 1. The total rainfall was 235.2 mm. The accumulated evaporation was 920.5 mm. There were 24 instances of rainfall, with 15 considered to be effective, constituting 62.5% of the total rainfall occurrences. From 23 June to 2 September, there were 17 instances of rainfall, accumulating 187.9 mm and accounting for 80.0% of the total rainfall. The maximum single rainfall occurred on August 12, reaching a daily precipitation of 43.5 mm. Before June 20, that is, before the jointing period, the accumulated evaporation was 338.9 mm, up to 36.8% of the total evaporation of the growing season. The average daily evaporation reached 7.8 mm. Consequently, it was irrigated frequently in the early growing stages. With the onset of the rainy season, particularly after the filling period, this irrigation diminished.
The low water (IL) and high water (IH) treatment plots were irrigated 13 times during the growth period of the corn, and the cumulative irrigation water was 223.0 mm and 370.4 mm, respectively.

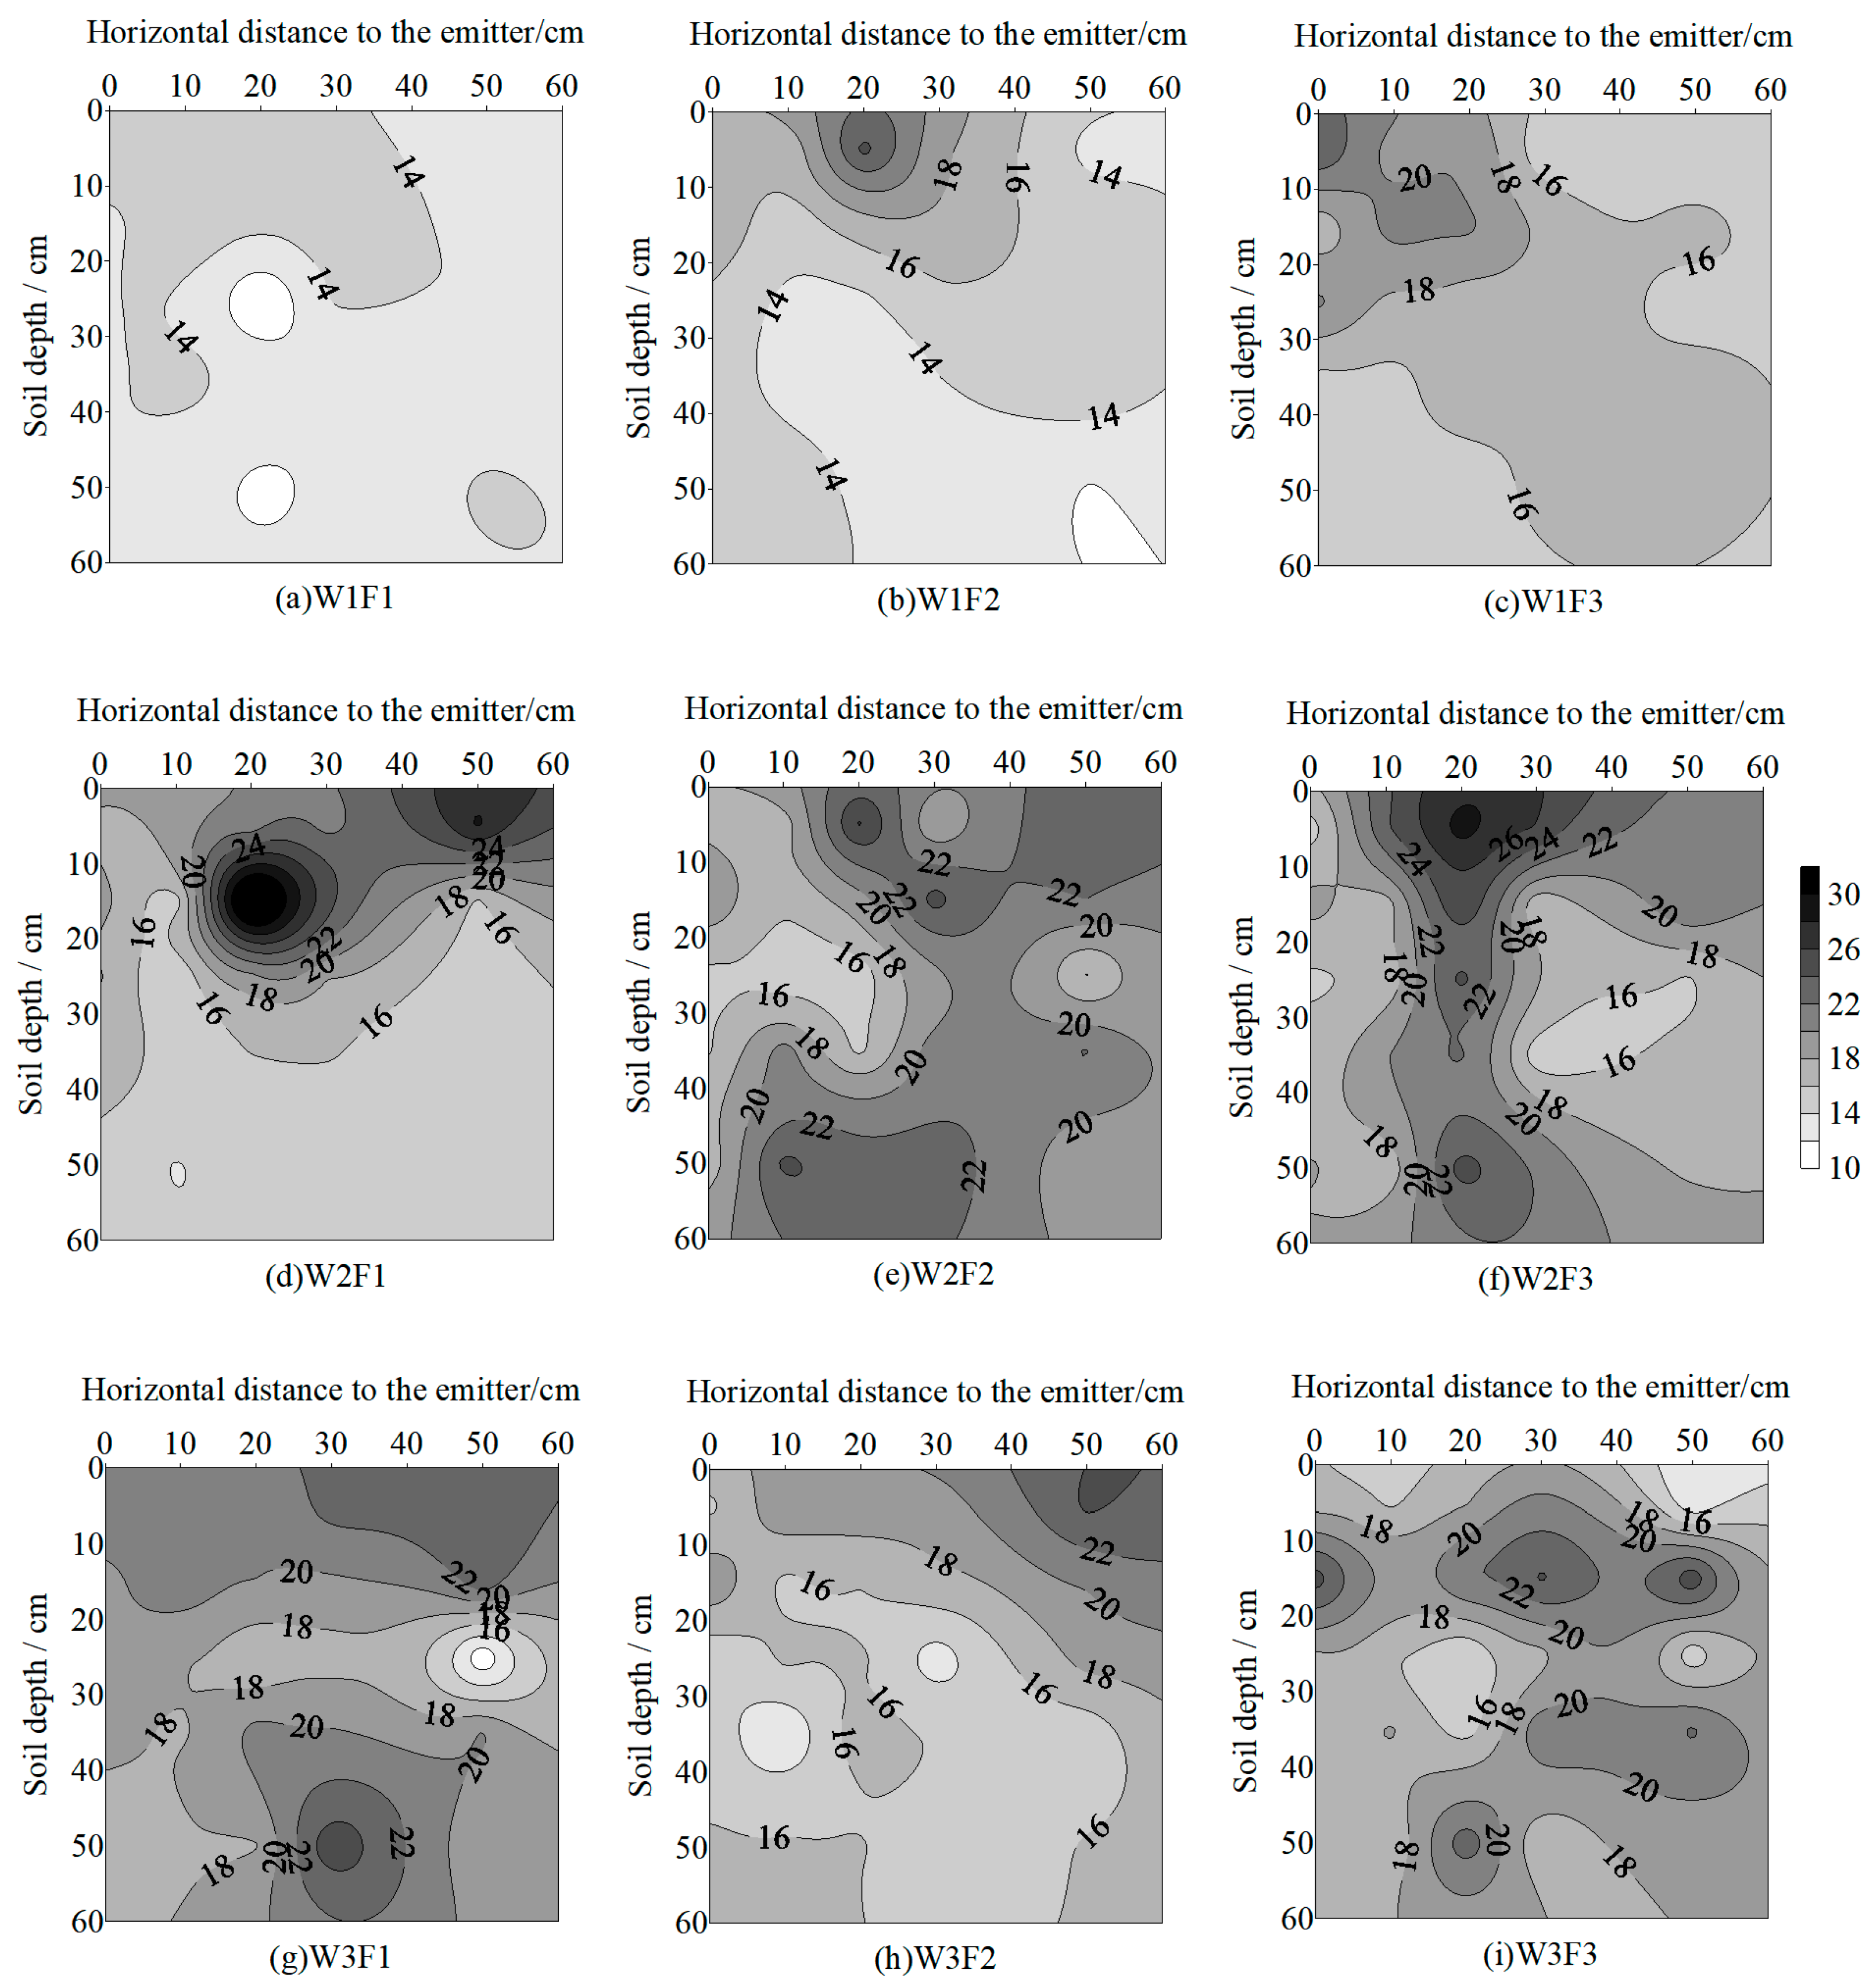
3.2. Soil Water Distribution Characteristics

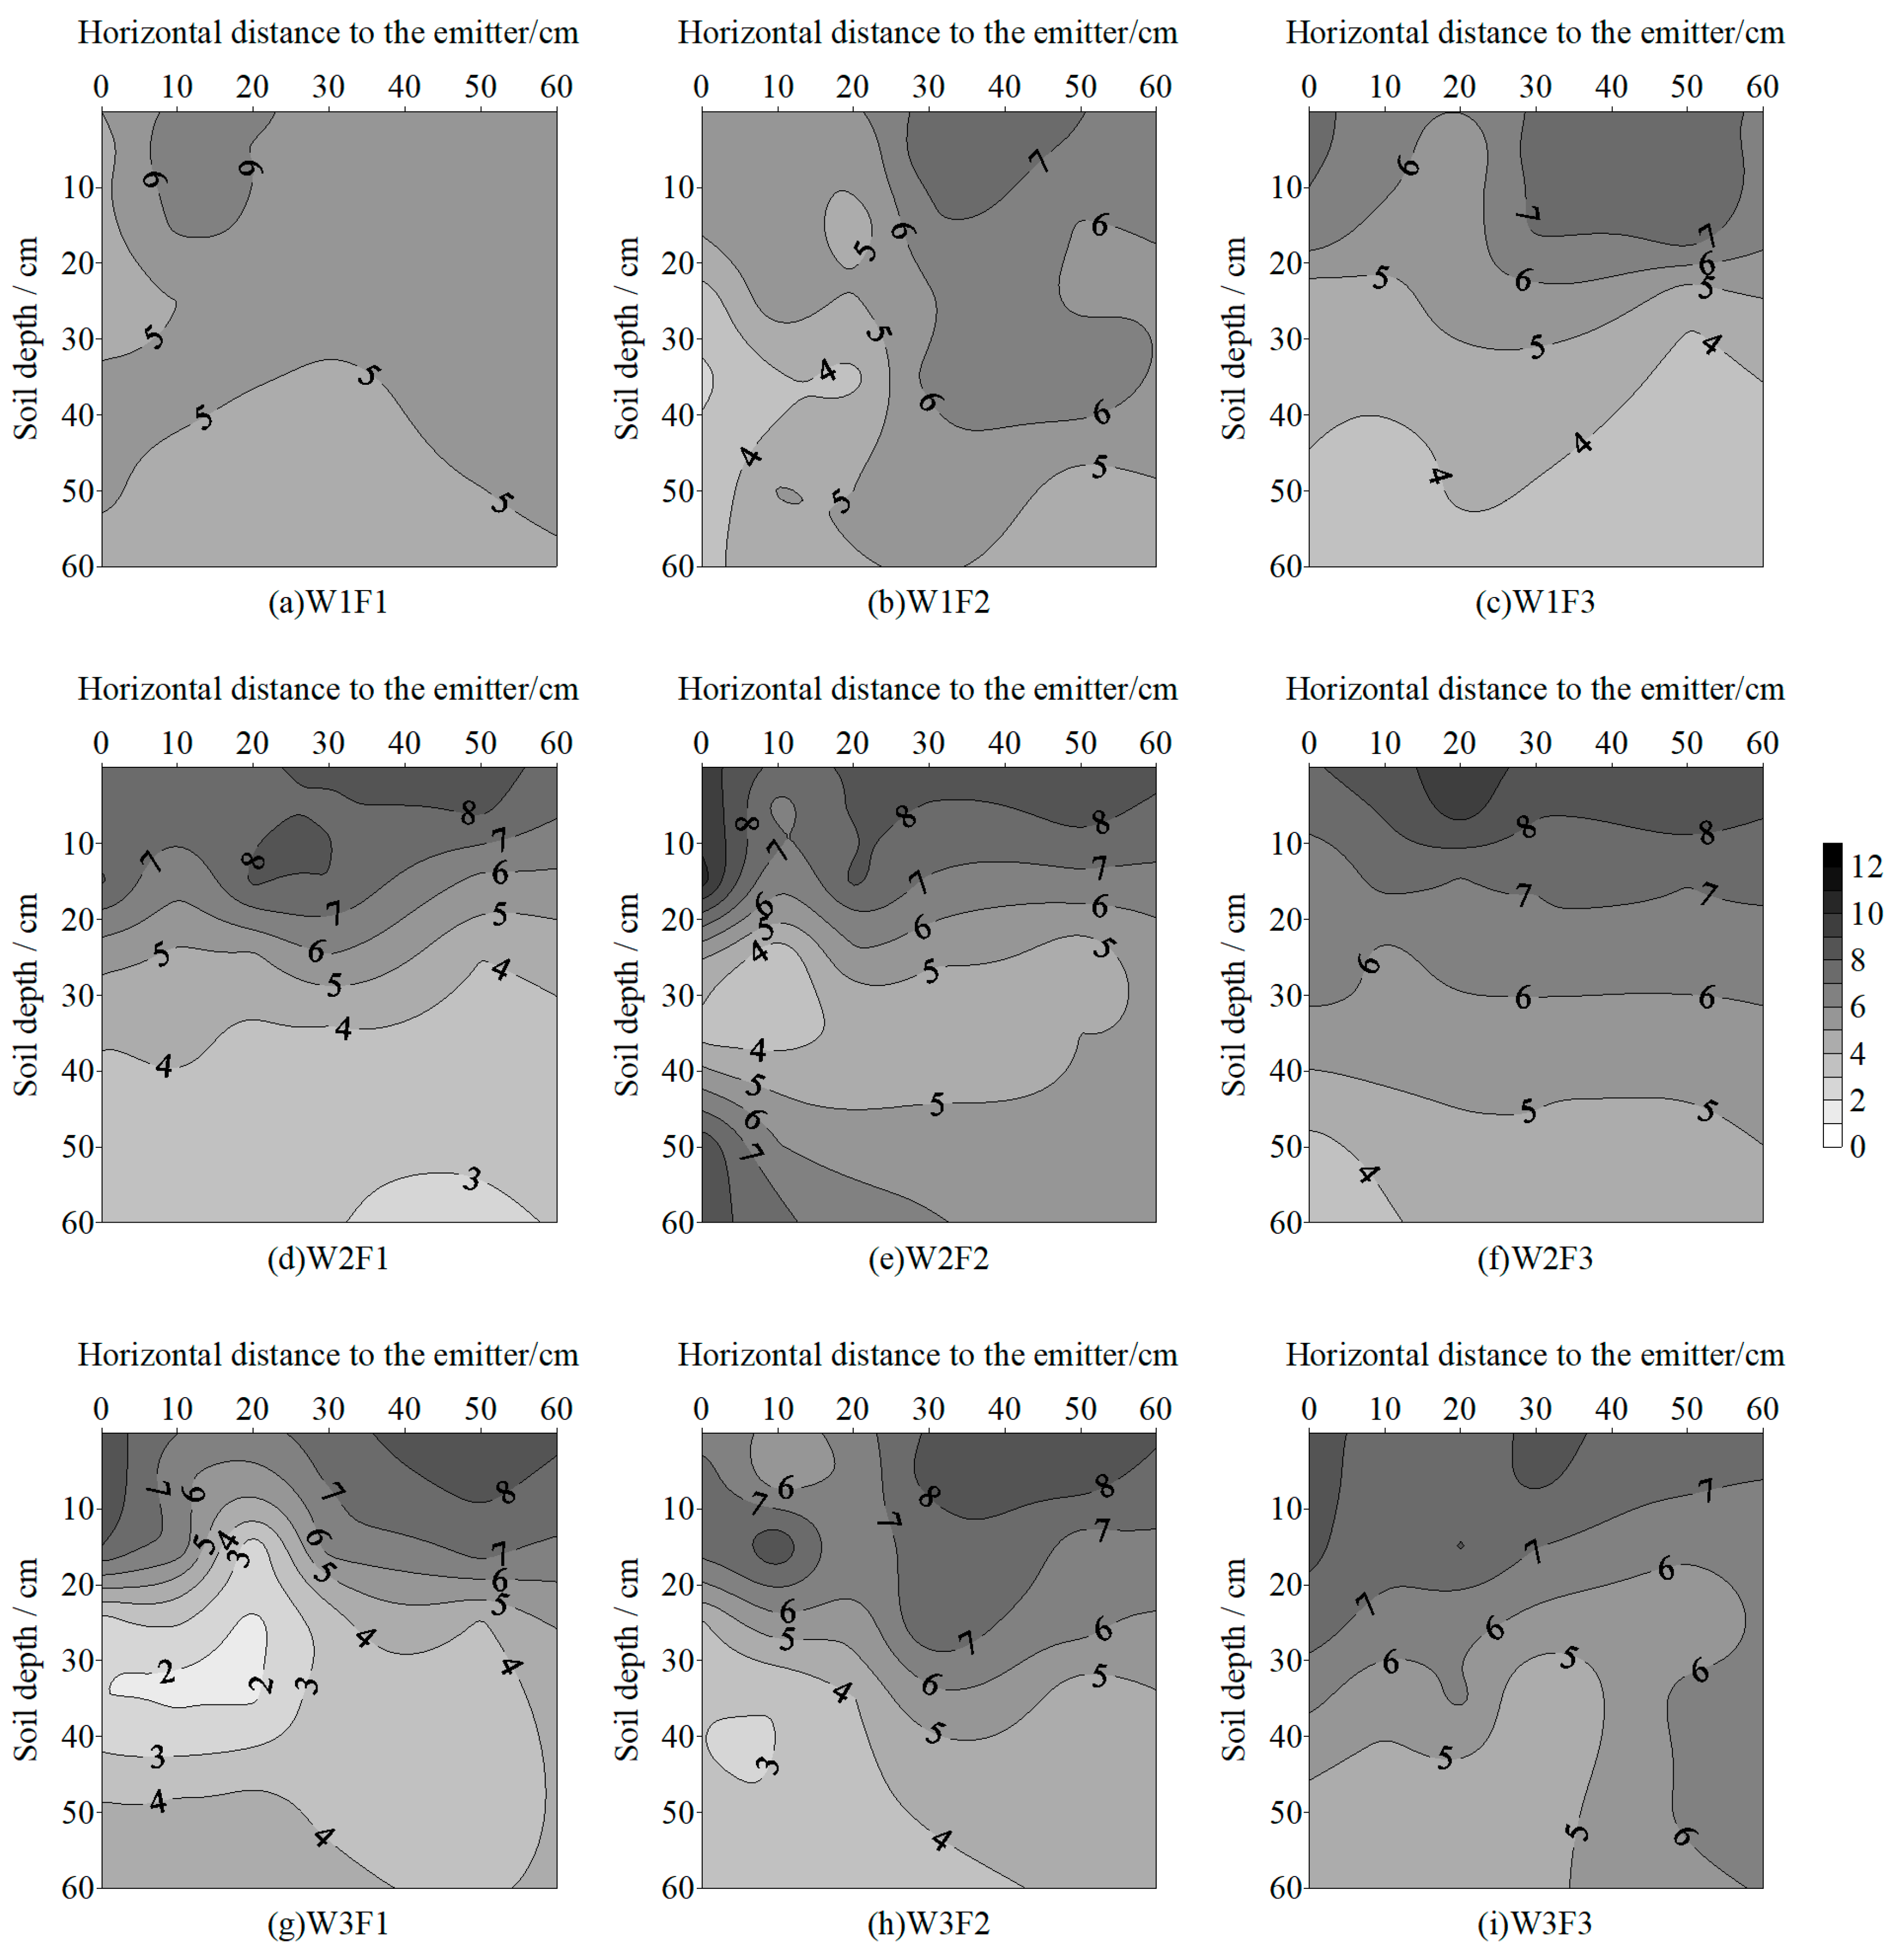
3.2.1. Soil Water Distribution in the Profile

The distributions of the soil water contents of different irrigation treatments are shown in Figure 2. Generally, the soil water content decreased radially from the drip emitters.
Figure 2a–c show the water distributions of different nitrogen levels under the low water treatment condition. The water of the W1F1 treatment was distributed uniformly in the profile and the water content ranged from 4% to 7%. The water content of the upper soil near the ridge edge was higher than that of the lower soil under the drip emitter. The water content of the W1F2 treatment ranged from 3% to 8%, and the water content contour was uneven. That is, in the profile, soil water was nonuniformly distributed. It showed that the soil water content increased from the soil under the drip emitter to the furrow. The water content of the W1F3 treatment ranged from 3% to 9%. The surface soil near the ridge furrows had the highest water content, and it decreased as the soil depth increased. The mean values and coefficients of variation in Figure 2a–c are 5.2%, 5.3%, and 5.3%, and 0.12, 0.23, and 0.27, respectively. This implies that, with an increase in the nitrogen application rate, soil moisture accumulated in the surface soil near the ridge furrow, leading to a slight rise in the average water content of the section, thereby increasing the inequality of the water content distribution in the profile.
Figure 2d–f show the water distributions of different nitrogen levels under the medium water treatment condition. The water content of the W2F1 treatment ranged from 3% to 9%. The area with the largest soil water content was located at the surface of the soil near the ridge furrow. The soil water content decreased with depth in the 0–40 cm soil layer, while below 40 cm, it was distributed uniformly. The contour of the soil water content in the upper layer was dense, thus, the gradient was large. The water content of the W2F2 treatment ranged from 3% to 10%, and it decreased with depth in the 0–30 cm layer and then increased from a depth of 40 cm to 60 cm directly under the drip emitter. The water content of the W2F3 treatment ranged from 3% to 10%, and the soil water distribution was characterized by stratification. The soil water content contour was almost straight, and the soil water content decreased by about 1% every 10–15 cm depth downward. The mean values and variation coefficients of the soil water content for the low nitrogen, medium nitrogen, and high nitrogen treatments under medium water conditions were 5.5%, 6.2%, and 6.3% and 0.34, 0.32, and 0.22, respectively. This indicates that, with an increase in the nitrogen application rate, the profile water content increased slightly and the inequality of the soil water content distribution was reduced.
Figure 2g–i show the water distributions of different nitrogen applications under high water treatment conditions. The soil water content ranged from 2% to 10% under high water conditions. There were two areas in the profile where the soil water was greater than in other parts, one was directly below the drip emitter and the other was near the ridge furrow. The soil water was distributed unevenly in the low fertilizer and medium fertilizer treatments and the soil water content varied greatly; thus, the contours of the soil water content were dense and uneven where the water content was high. However, the contours of the high nitrogen treatment were relatively sparse and gentle; the water content gradient was small and the water was distributed uniformly. Under the conditions of high water, the mean values and coefficients of variation of the moisture content of the low nitrogen, medium nitrogen, and high nitrogen treatment profiles were: 4.6%, 5.6%, and 6.4% and 0.47, 0.34, and 0.21, respectively. Compared to the low nitrogen treatment, the two values of the high nitrogen treatment were increased by 37.5% and decreased by 56.1%. This indicates that increasing the rate of nitrogen application had an obvious effect on improving the content and uniformity of the soil water.

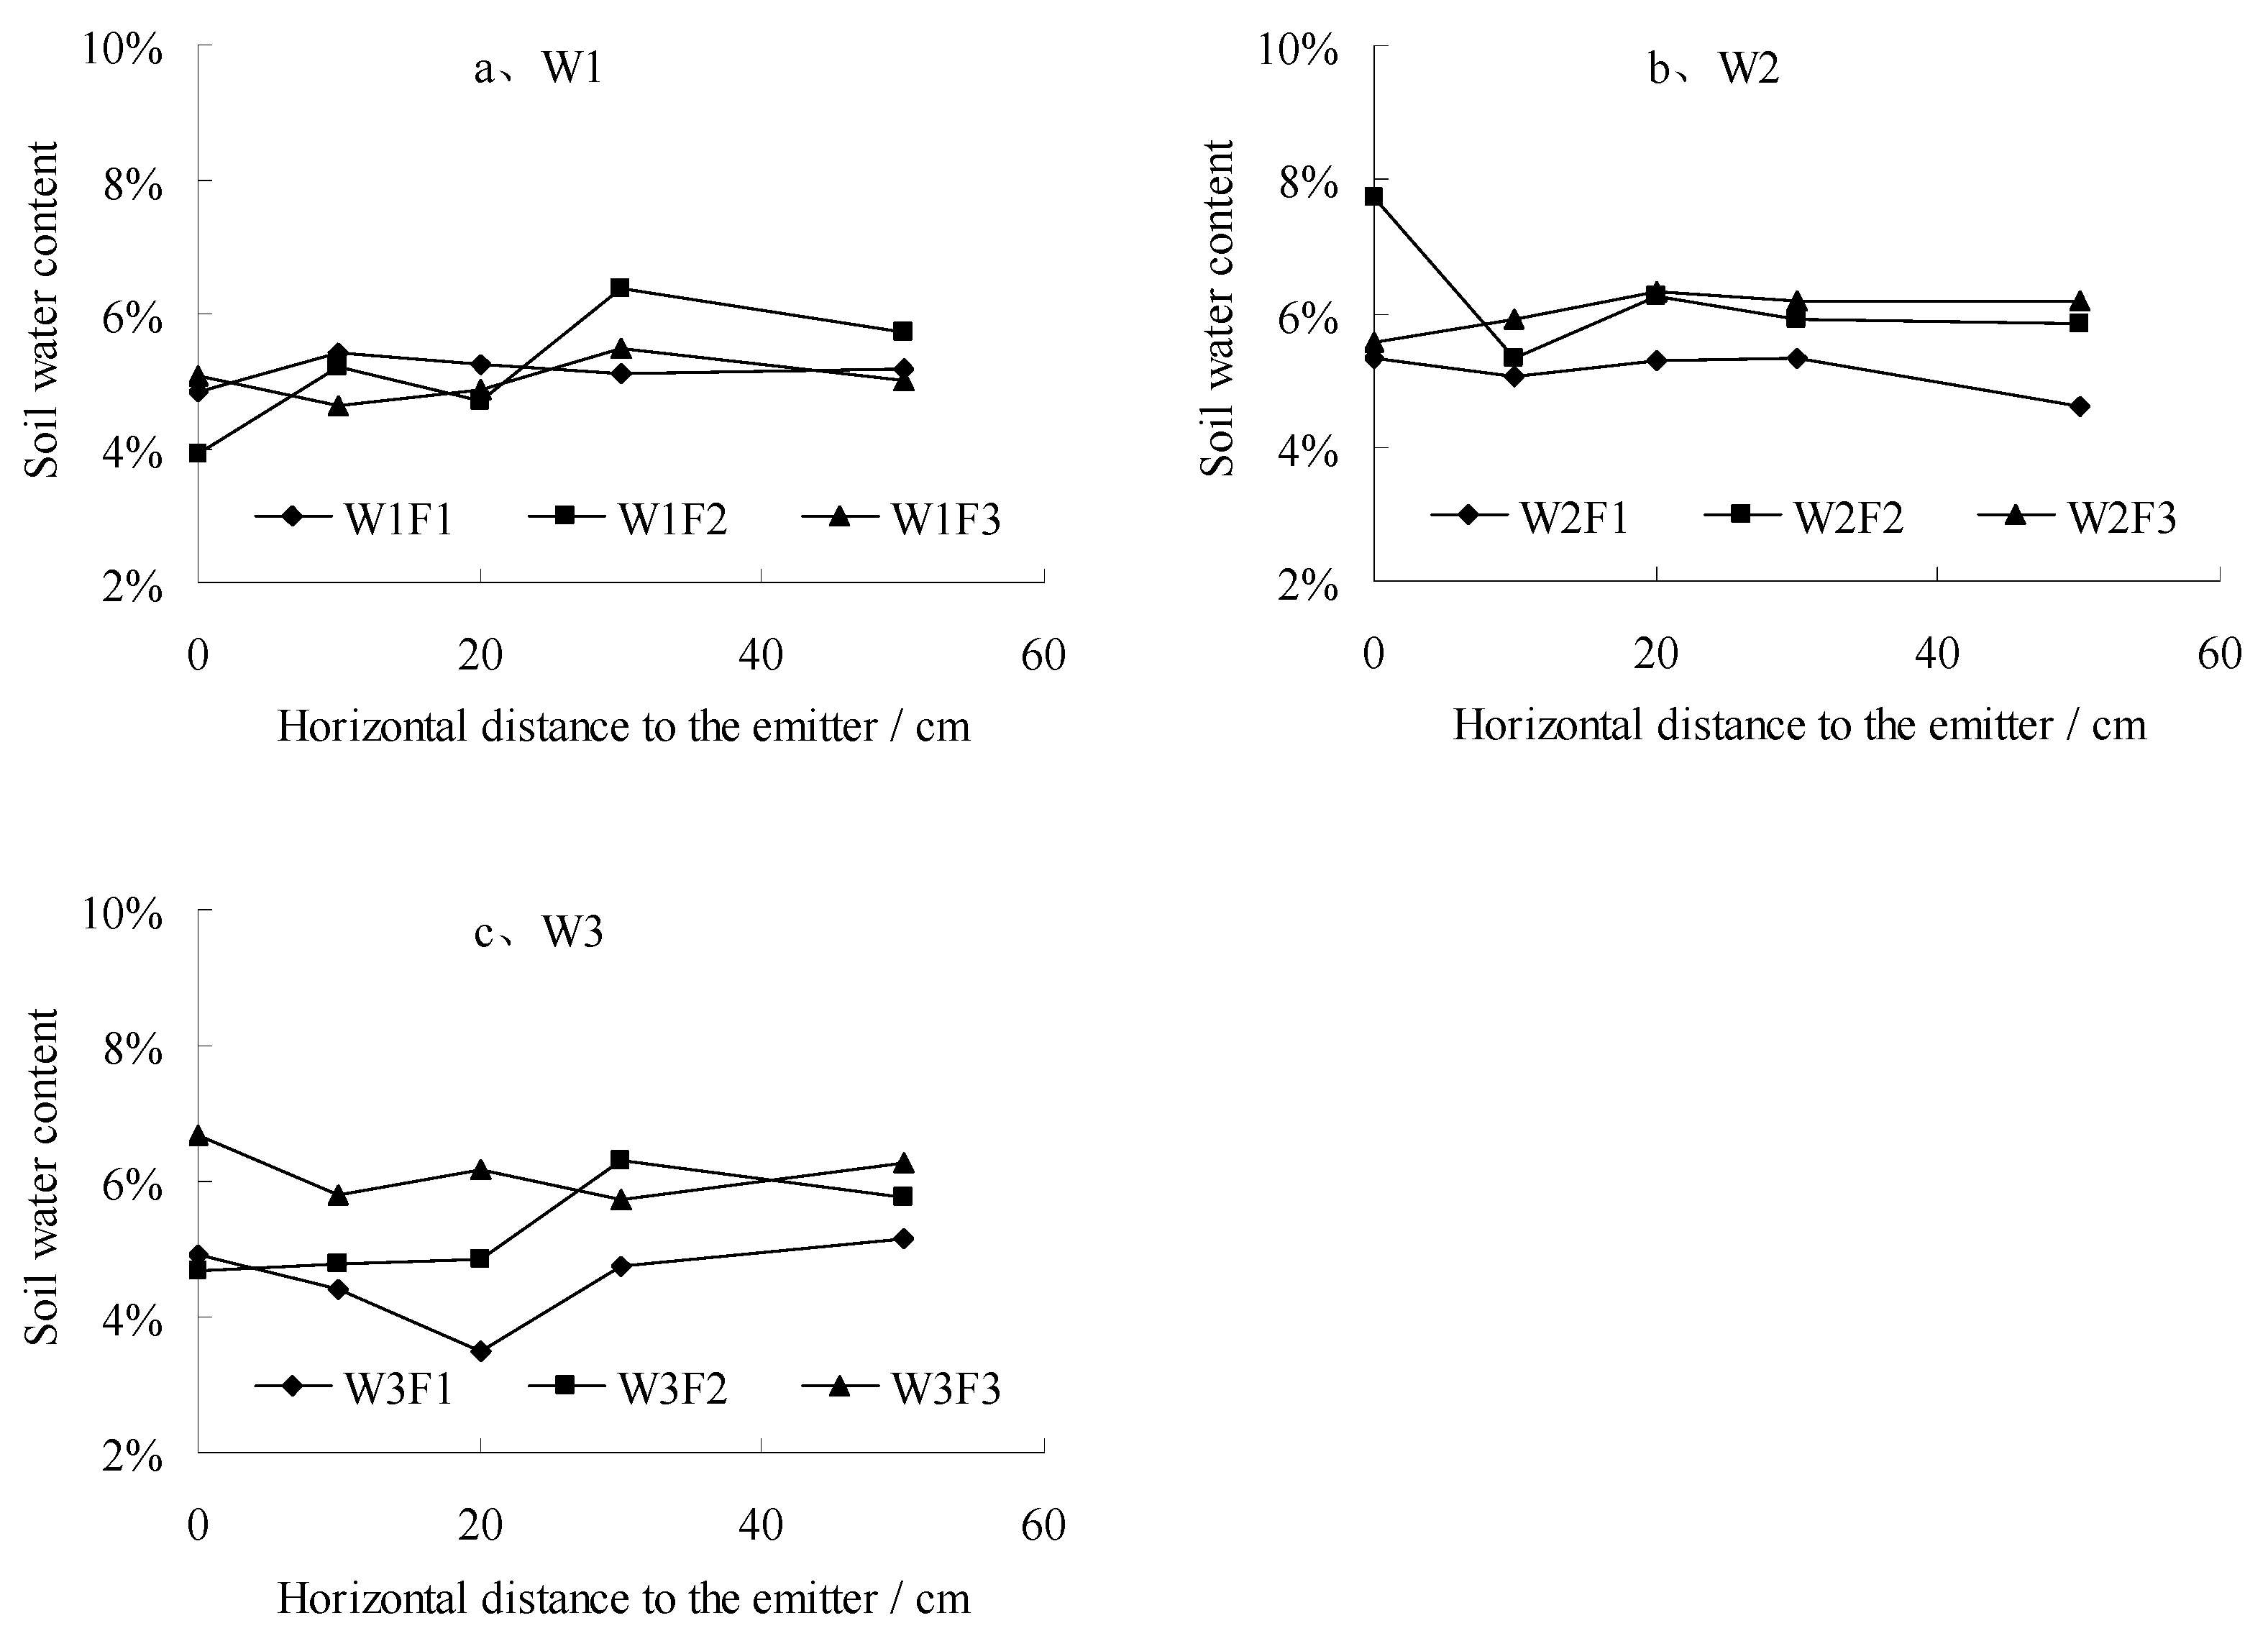
3.2.2. Changes in Soil Water in the Horizontal Direction

The changes in the soil water in the horizontal direction are shown in Figure 3. Under low water conditions (Figure 3a), the average soil water contents of the W1F1 and W1F3 treatments in the horizontal direction ranged from 4.5% to 5.5%, exhibiting minimal variations. The W1F2 treatment increased and then decreased with the increasing distance from the drip emitter. With 20 cm in the horizontal direction, the difference in the soil water content among the different nitrogen treatments was within 1%, but beyond 20 cm, the water content of the W1F2 treatment was higher than that of the W1F1 and W1F3 treatments. Under medium water conditions (Figure 3b), the water content of W2F2 directly below the drip emitter was higher than that of others, and besides that, differences along the horizontal direction of each treatment were not significant. The soil water content sequence of the treatments was: W2F3 > W2F2 > W2F1. The difference between the high fertilizer and medium fertilizer treatments was small, but both were higher than that of the low fertilizer treatment. Under the high water conditions (Figure 3c), the soil water content decreased first and then increased along the horizontal direction. The soil water content of W3F1 was lower than that of W3F2 and W3F3. The soil water content of W3F3 was larger than that of W3F2 within 20 cm from the drip emitter, while beyond 20 cm, the difference between the two treatments was not obvious. The difference in the soil water content in the horizontal soil showed that nitrogen application had little effect on the water content in the horizontal direction under low water conditions, while increasing the fertilizer application rate was beneficial for improving the soil water content.

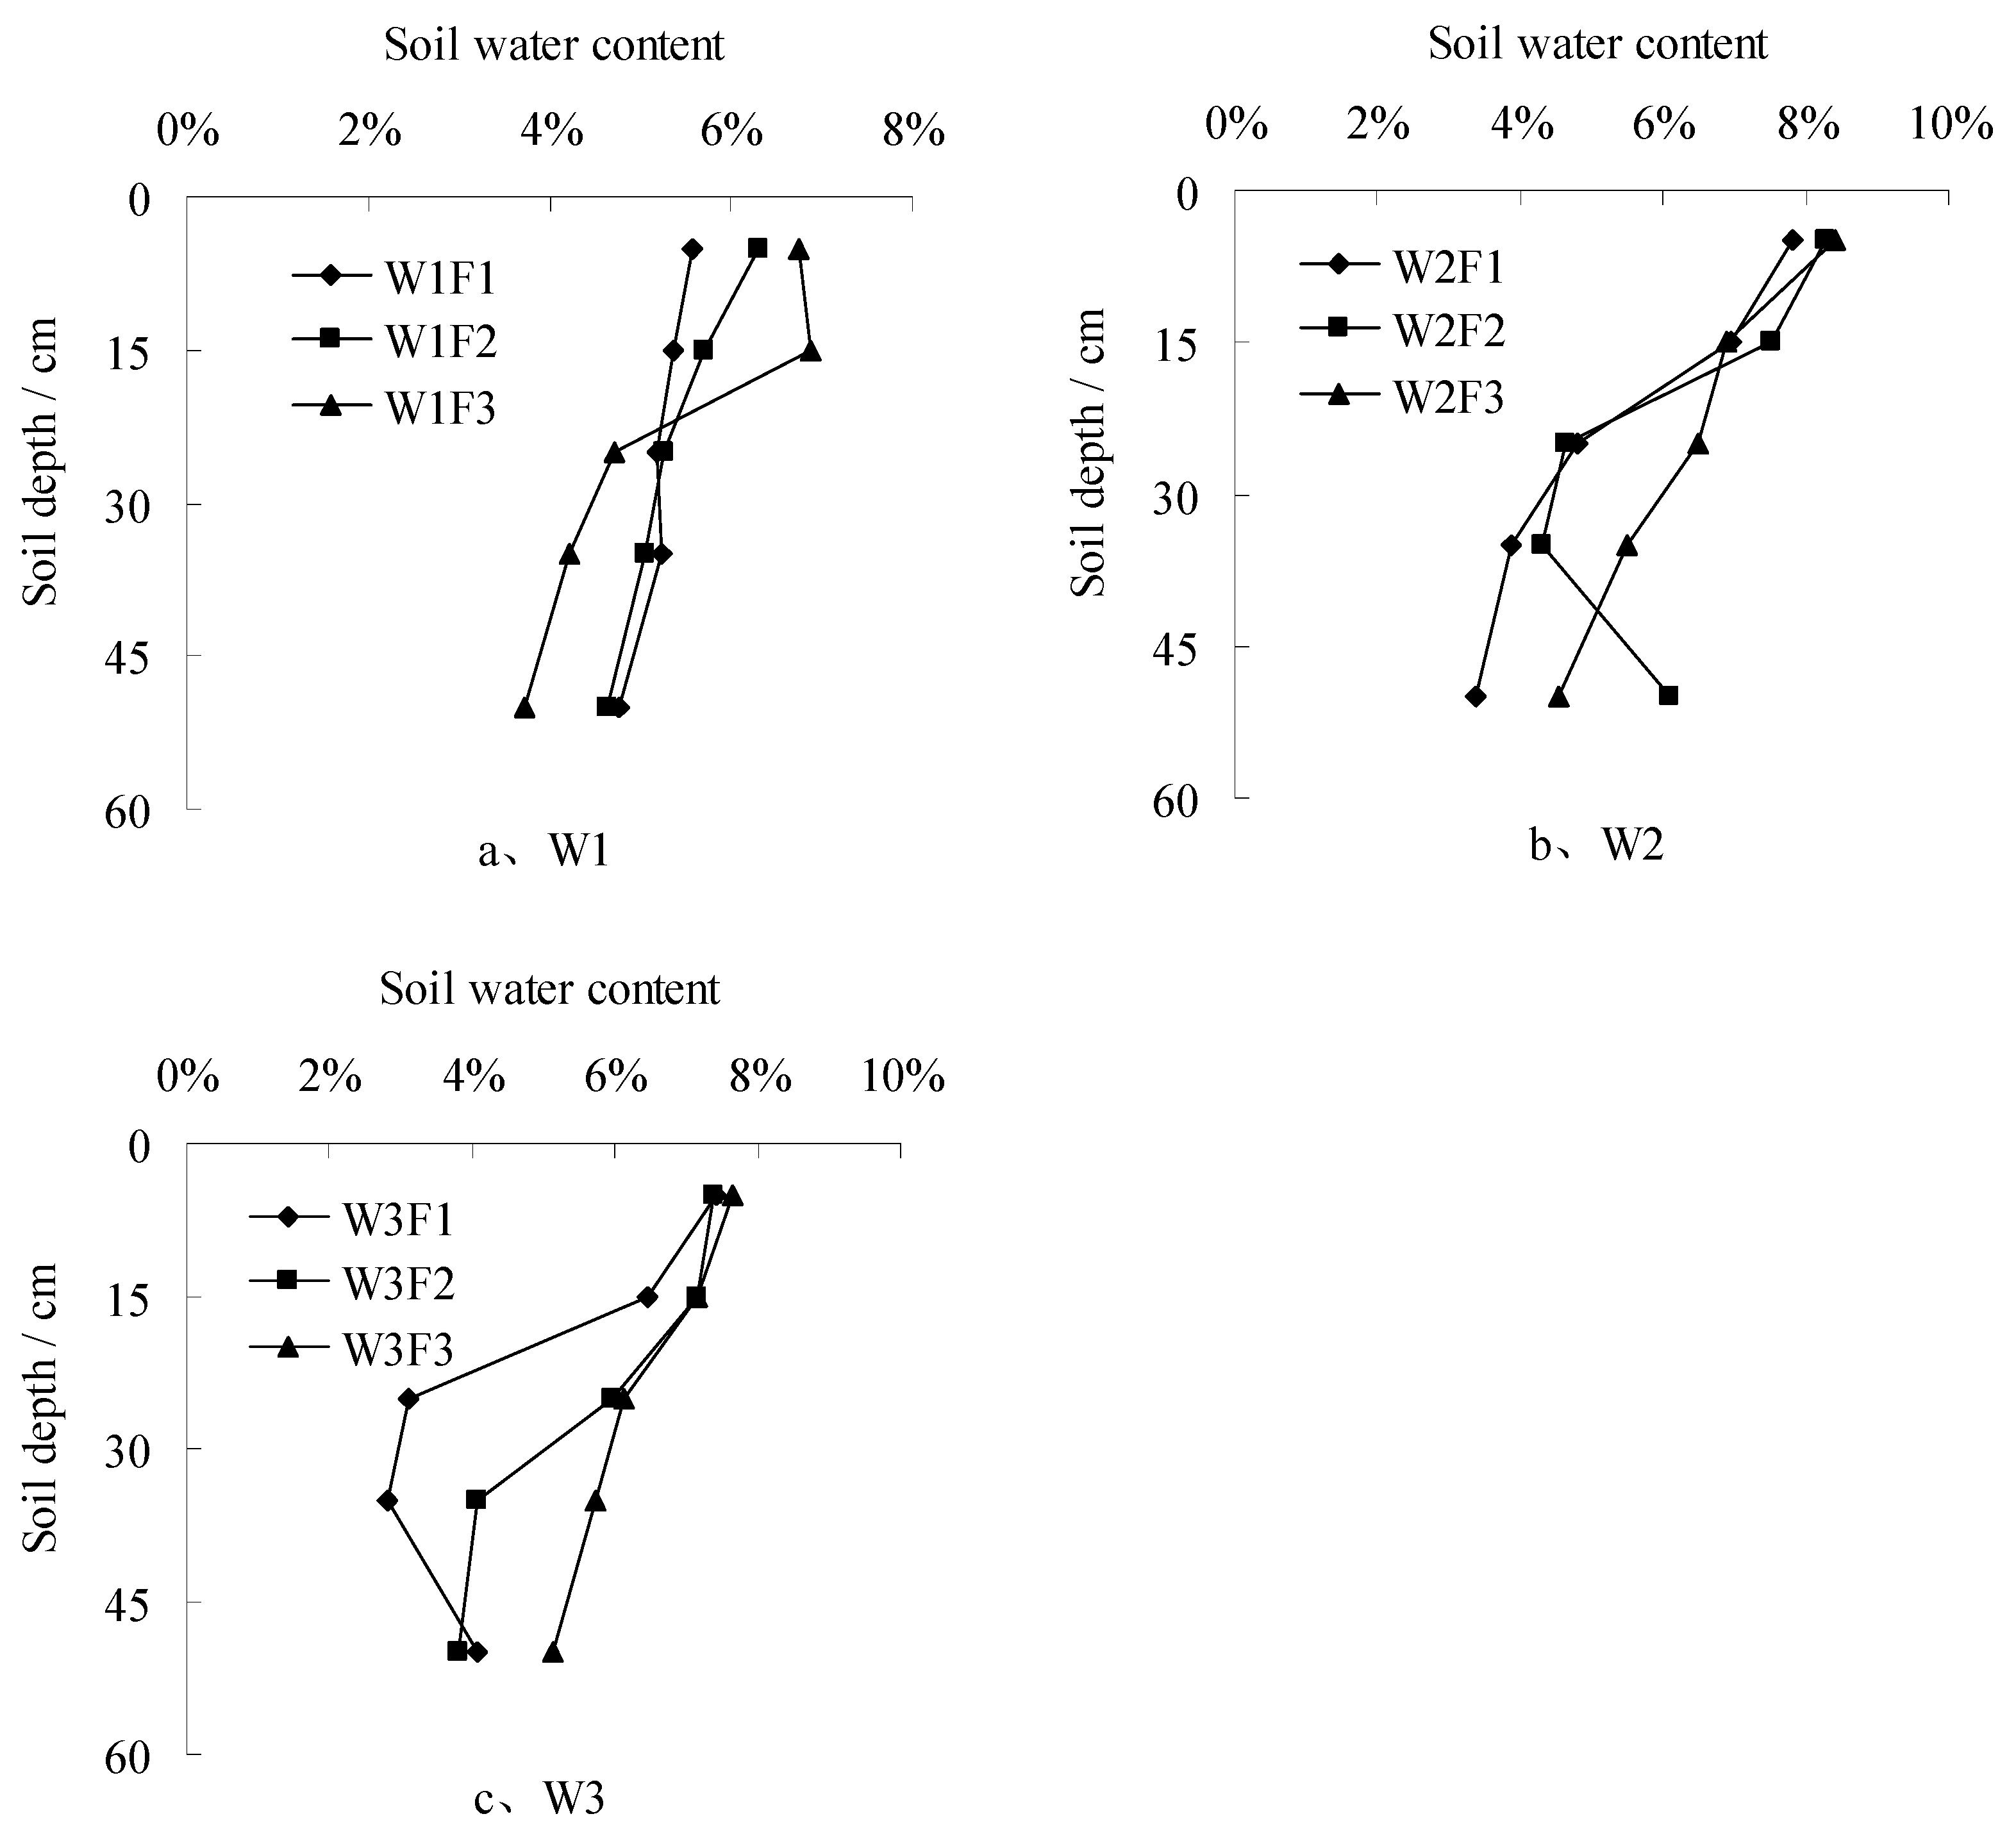
3.2.3. Changes in Soil Water in the Vertical Direction

The changes in the soil water in the vertical direction are shown in Figure 4. Under low water conditions (Figure 4a), the soil water content of each treatment decreased with an increasing soil depth, and at the depth of 40–60 cm of the W1F1, W1F2, and W1F3I treatments, it decreased by 14.6%, 26.4%, and 44.8% compared with the surface soil. From 0 to 20 cm, the soil water content increased as the nitrogen application increased, while below 20 cm, it decreased. Under medium water conditions (Figure 4b), except in the W2F2 treatment, the soil water content at the depth of 50 cm was about 6.1%, and the soil water content of each treatment decreased with an increasing depth. In the W2F1, W2F2, and W2F3 treatments, the soil water contents decreased by 56.9%, 47.8%, and 46.2%, respectively, from the 0 to 60 cm layer. The soil water content of the upper 20 cm had little difference among treatments, while below 20 cm, it had a tendency to increase with an increasing nitrogen application rate. Under high water conditions (Figure 4c), in the W3F1 treatment, the soil water content of the 40–60 cm layer was higher than that of the 20–40 cm layer, and besides that, the soil water content of each treatment decreased with an increasing depth. In the W3F1, W3F2, and W3F3 treatments, the soil water content decreased by 62.2%, 44.8%, and 33.0%, respectively, from the 0 to 60 cm layer. In each vertical layer, the variation trend of the water content with the nitrogen application rate was consistent with that under medium water conditions. The test showed that the soil depth influenced the soil moisture content, and the deeper the soil layer, the lower the water content. Increasing the nitrogen application rate was beneficial for improving the soil moisture content, especially below 20 cm, but this tendency was not obvious or even inverse when less water was irrigated.

3.3. Nitrate Nitrogen Distribution Characteristics

3.3.1. Distribution of Nitrate Nitrogen in the Profile

The distributions of NO3-N in each treatment are shown in Figure 5. Figure 5a–c show the distributions of nitrate nitrogen in the soil profiles for different nitrogen applications under low water conditions. The NO3-N content in the W1F1 treatment ranged from 10.0 to 15.8 mg kg−1, with a mean value of 13.6 mg kg−1. The NO3-N content was low and varied within a small range, and thus, nitrate nitrogen was uniformly distributed in the soil profile. The NO3-N content in W1F2 ranged from 11.9 to 24.6 mg kg−1, with a mean value of 15.4 mg kg−1. NO3-N accumulated in the area about 20 cm horizontally away from the emitter at the depth of 0–10 cm. As the radial distance from the emitter increased, the contour spacing of the NO3-N content increased and the content change became flat. The NO3-N content in W1F3 ranged from 14.0 to 23.8 mg kg−1, with a mean value of 17.2 mg kg−1. NO3-N accumulated in the area directly under the emitter, decreasing radially from that point. In the profile, except for in the accumulated area, the NO3-N contour was sparsely distributed with a large spacing, that is, NO3-N was distributed uniformly in th soil profile, with little change in content and gradient. This indicates that, under low water conditions, NO3-N accumulated in the surface soil near the drip emitter and decreased radially outward. With an increase in the nitrogen application rate, the NO3-N content in the profile increased significantly.
Figure 5d–f show the distributions of NO3-N at different nitrogen levels under medium water conditions. The NO3-N content in the W2F1 treatment ranged from 13.9 to 36.6 mg kg−1, and its mean value was 18.3 mg kg−1. NO3-N accumulated in two areas in the profile: one was about 20 cm horizontally away from the emitter at a depth of 5–25 cm, and the other was 50 cm from the emitter at a depth of 0–10 cm. However, below 30 cm, NO3-N showed little change. The NO3-N content in the W2F2 treatment ranged from 14.9 to 26.3 mg kg−1, and its mean value was 19.5 mg kg−1. The NO3-N directly under the emitter was less than in other areas, it increased first and then decreased as the radial distance increased, and it slightly accumulated about 20 cm around the emitter. The NO3-N content in the W2F3 treatment ranged from 14.8 to 28.7 mg kg−1, and its mean value was 19.7 mg kg−1. The distribution of soil nitrate nitrogen in W2F3 was similar to the W2F2 treatment. NO3-N accumulated away from the emitter more obviously and its content was higher than that of the W2F2 treatment. The test showed that, under medium water conditions, the NO3-N content increased with the amount of nitrogen applied, accumulating in the soil profile about 20 cm radially from the drip emitter. At a low nitrogen level, NO3-N mainly accumulated in the upper soil. At the medium and high nitrogen levels, it accumulated in both deeper and upper soil layers, reaching peak values.
Figure 5g–i show the distributions of NO3-N at different nitrogen levels under high water conditions. The NO3-N content in the W3F1 treatment ranged from 10.3 to 25.5 mg kg−1, and its mean value was 19.5 mg kg−1. NO3-N accumulated in two areas in the profile: one was the surface soil of the ridge slope and furrow, and the other was 30–40 cm from the emitter at a depth of 45–60 cm. The NO3-N content in the W3F2 treatment ranged from 12.2 to 24.3 mg kg−1, and its mean value was 16.8 mg kg−1. NO3-N apparently accumulated in the surface soil of the ridge furrow, while it changed little below 20 cm. The NO3-N content in the W3F3 treatment was between 12.2 and 25.4 mg kg−1, and its mean value was 18.6 mg kg−1. NO3-N was mainly distributed at the depth of 10–20 cm. This indicated that, under the high water condition, the amount of nitrogen had little effect on the distribution of NO3-N. NO3-N accumulated radially outward 30 cm from the drip emitter, especially in the surface soil of the furrow.

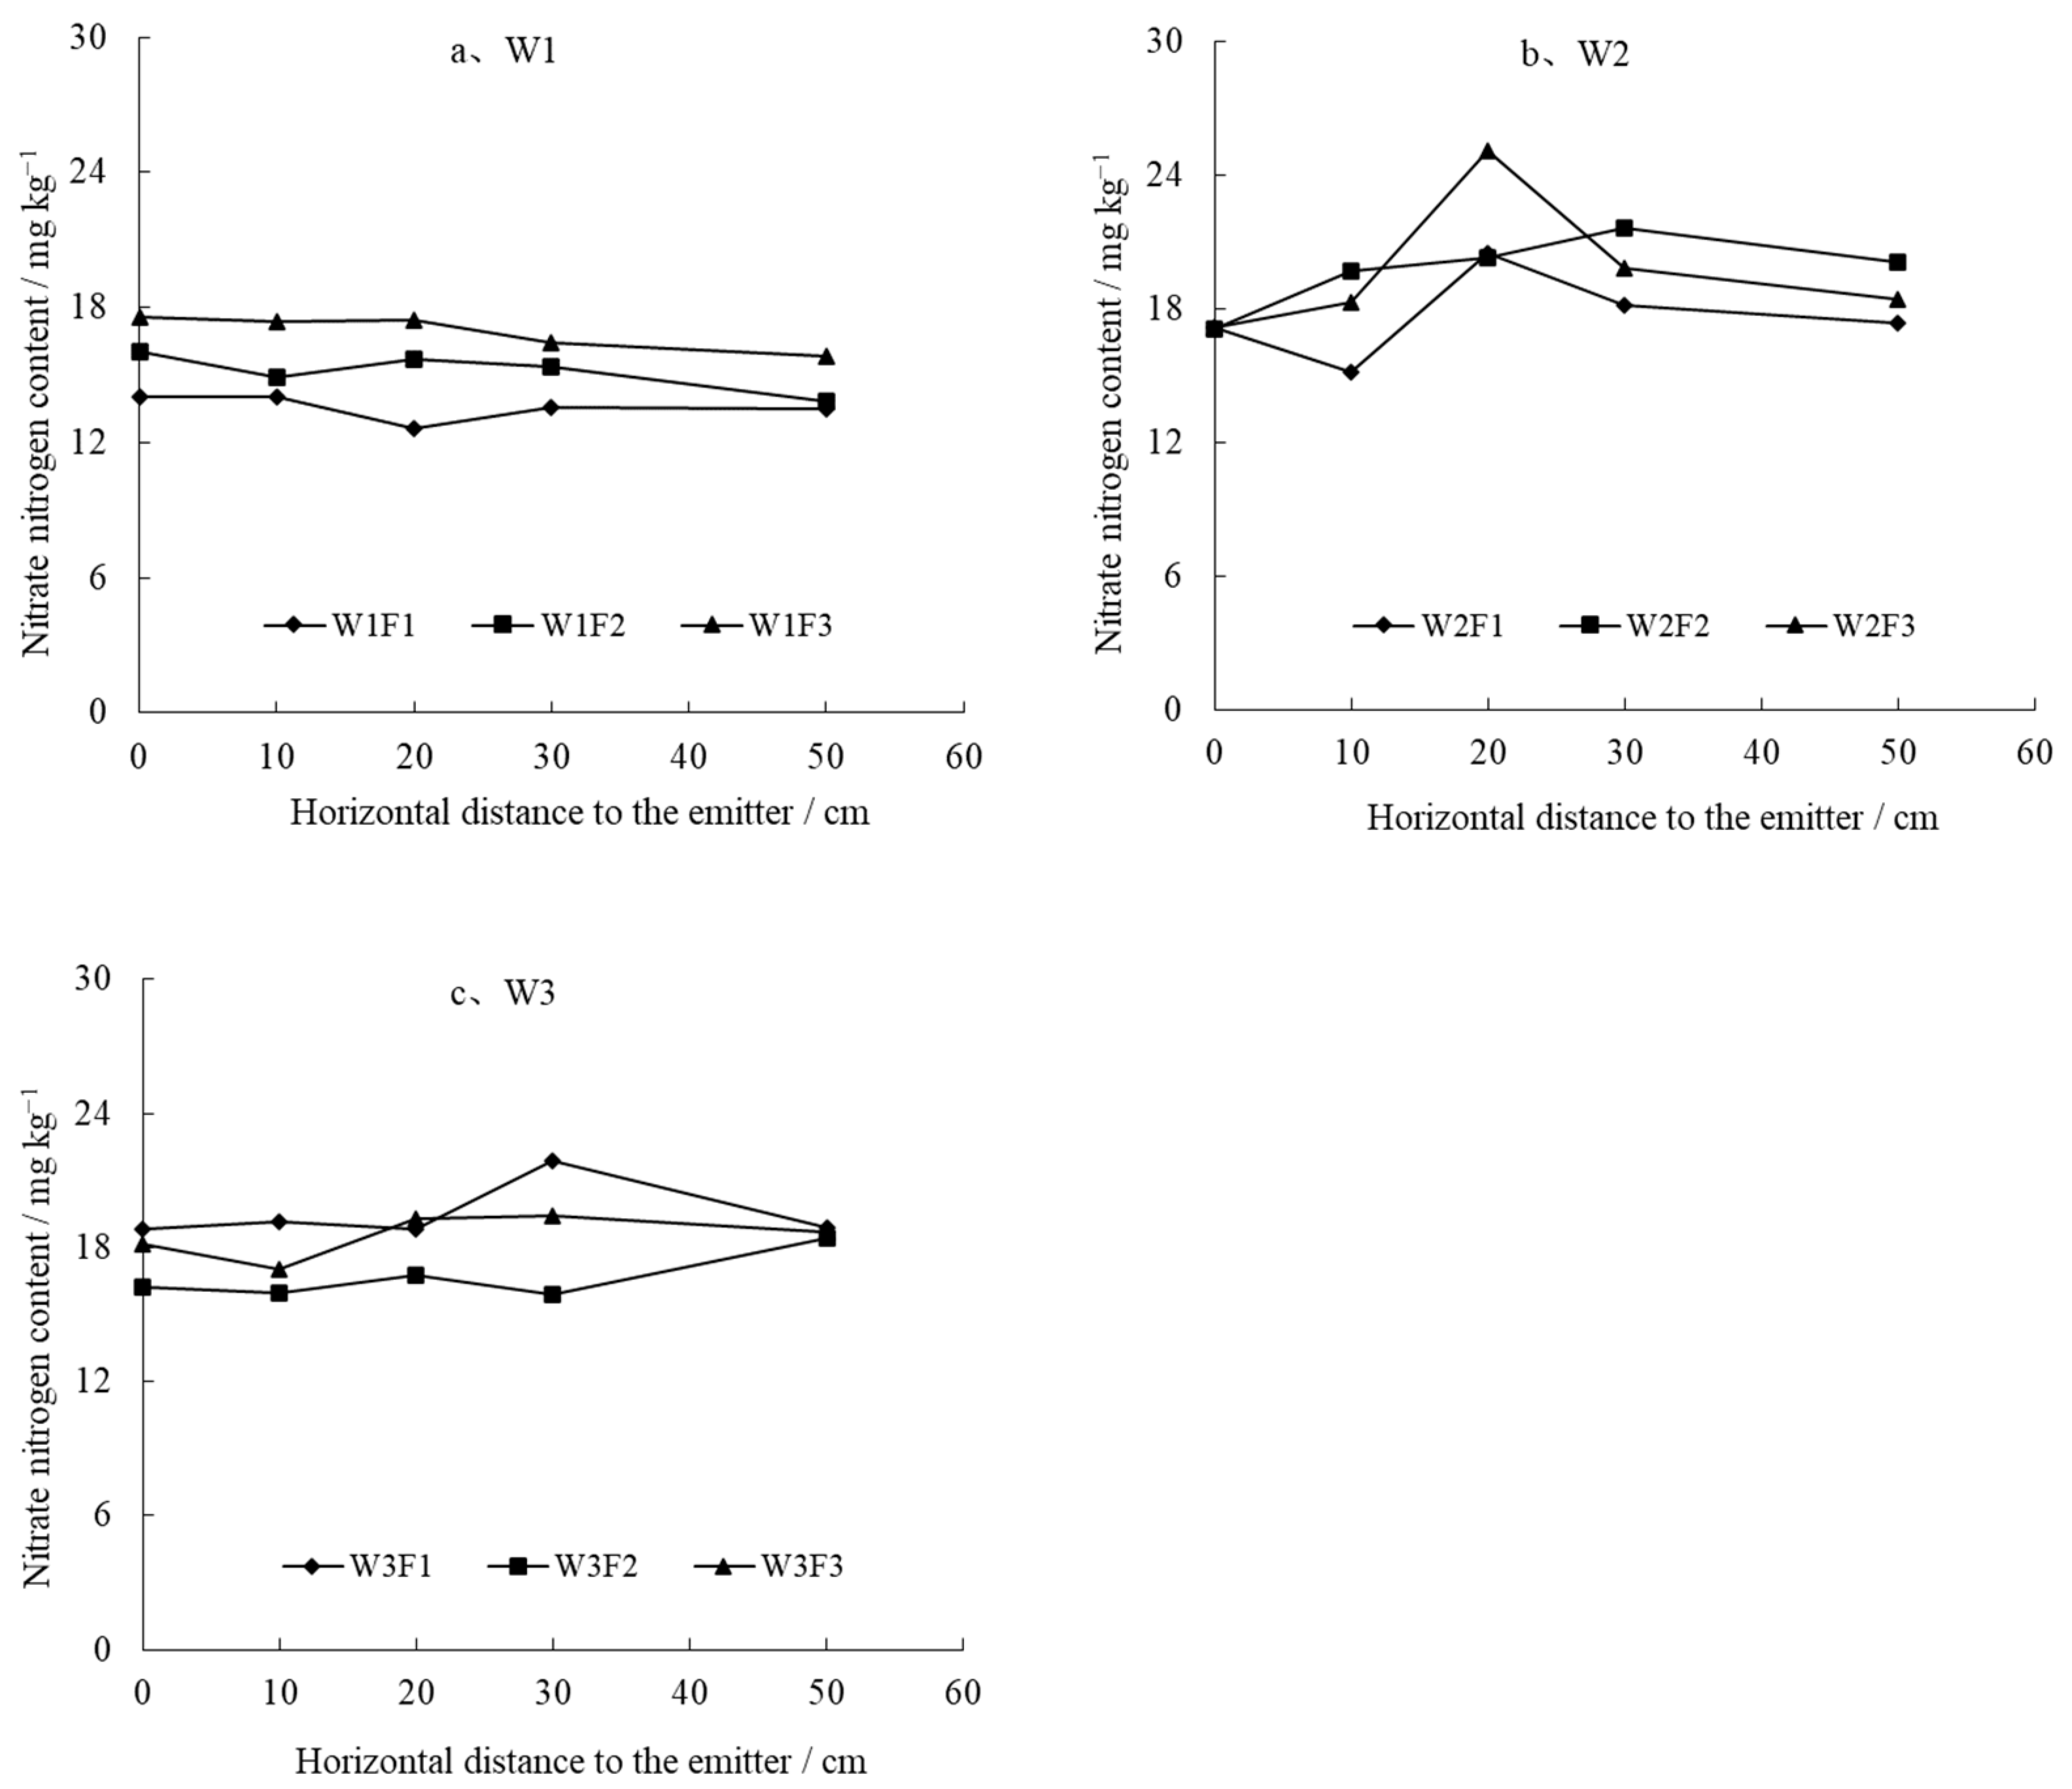
3.3.2. Changes in Nitrate Nitrogen in the Horizontal Direction

The changes in NO3-N content in the horizontal direction are shown in Figure 6. Under low water conditions (Figure 6a), the average NO3-N content slightly decreased with the increasing distance to the drip emitter. The average NO3-N content at 50 cm from the drip emitter in W1F1, W1F2, and W1F3 decreased by 3.5%, 13.8%, and 9.9%, respectively, compared to the content directly under the emitter. Among the treatments, there was an increase in the NO3-N content in the soil with the application of more nitrogen along the horizontal direction. The average nitrate nitrogen content of W1F1 at each distance was 17.2–25.1% higher than that of W1F3. Under medium water conditions (Figure 6b), the NO3-N content of each treatment was lowest directly below the emitter, and it increased initially before decreasing with the increasing horizontal distance. In W2F1 and W2F3, the maximum appeared at 20 cm from the emitter, while in W2F2, it appeared at 30 cm. Along the horizontal direction, the effects of the nitrogen level on the NO3-N content between W2F2 and W2F3 were not significant, however, both treatments had a higher content than W2F1. Under high water conditions (Figure 6c), the NO3-N content exhibited a tendency similar to that under medium water conditions, and it increased initially and then decreased with the increasing horizontal distance. W3F1 and W3F2 had higher contents at 20 cm around the emitter, while in W3F3, the maximum appeared at 30 cm. Along the horizontal direction, the effects of nitrogen application on the NO3-N content between W3F1 and W3F3 were not significant, while both the two treatments had higher contents than W2F2. The differences in the NO3-N content among the treatments along the horizontal direction showed that, the more nitrogen applied, the more NO3-N existed in the soil, and this effect extended further away from the emitter.

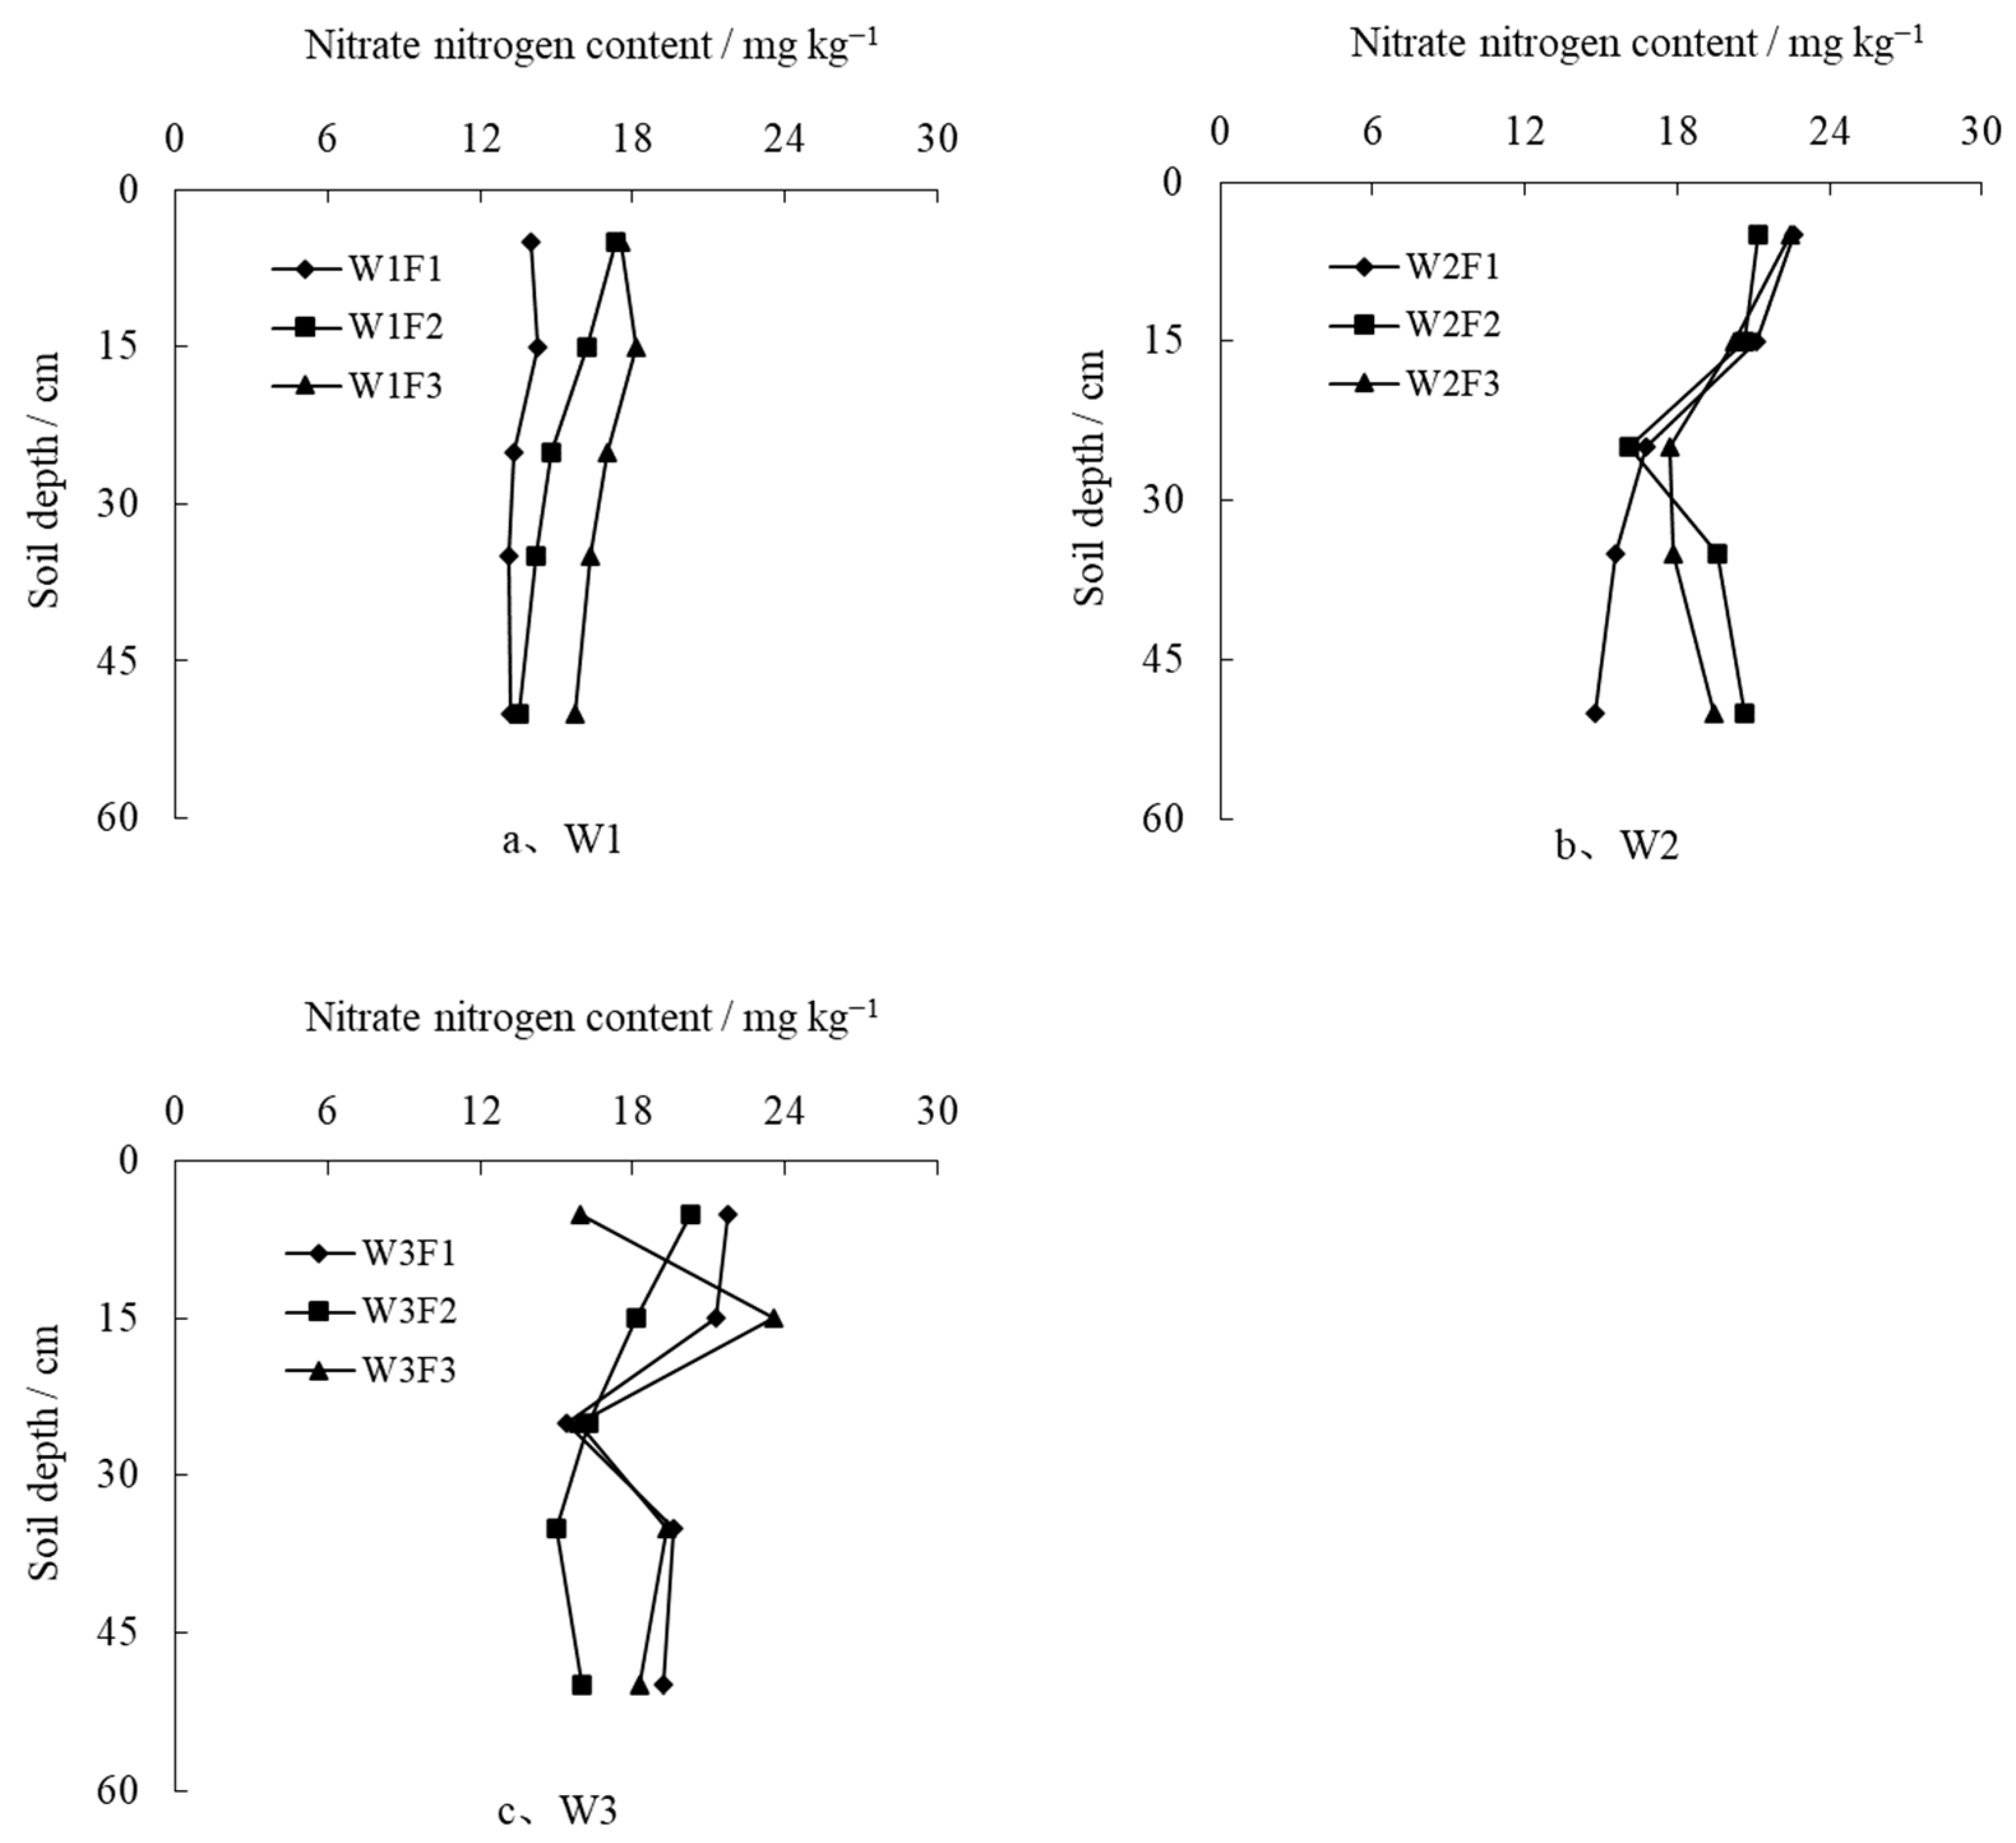
3.3.3. Changes in Nitrate Nitrogen in the Vertical Direction

The changes in the NO3-N content in the vertical direction are shown in Figure 7. Under low water conditions (Figure 7a), the NO3-N content of each treatment changed slightly with depth, and decreased by 0.8, 3.8, and 1.8 mg kg−1 in W1F1, W1F2, and W1F3 from the surface to 6a 0 cm depth, respectively; the average NO3-N content in each layer increased with an increase in the nitrogen application rate. Under medium water conditions (Figure 7b), the NO3-N content of the W2F1 treatment decreased with an increasing depth, and the average NO3-N content at 0–10 cm was 52.9% higher than that at a 40–60 cm depth. For W2F2 and W2F3, the NO3-N content decreased to the minimum from the surface to a 20–30 cm depth, then it increased, and in the layer of 40–60 cm, it was approximately equal to the content of the surface soil. Among the treatments, differences in the NO3-N content were not significant in the upper 0–30 cm, however, in the layer deeper than 30 cm, the NO3-N contents of W2F2 and W2F3 exhibited similarity and surpassed that of W2F1. Under high water conditions (Figure 7c), the content of NO3-N in each treatment had no obvious pattern with depth, and the application of nitrogen followed a similar trend. However, the NO3-N content of the upper 30 cm soil layer was higher than that of the deeper layer. Generally, the study showed that increasing the nitrogen application could increase the average NO3-N content in the soil profile. However, with an increase in the irrigation amount, the positive effect of nitrogen application on the NO3-N content gradually decreased.

3.4. Correlation Analysis of Water and Fertilizer Distribution

A correlation analysis between the soil water content and NO3-N content for each treatment soil is shown in Table 1. At different horizontal distances (0, 10, 20, 30, and 50 cm), there was no significant correlation between the soil water content and NO3-N content. Under low and medium water conditions, a negative correlation was evident, whereas under high water conditions, a positive correlation was observed.
In the vertical direction, the water content was positively correlated with the NO3-N content. They had a moderate or strong correlation, except for in W3F3, which showed a low correlation. Especially in W1F2 and W2F1, a highly significant level was observed (p < 0.01), and in W1F3, a highly significant level was noted (p < 0.05). This indicated that, under low water conditions, a higher nitrogen application promoted the correlation between the soil water content and NO3-N content, while under medium and high water conditions, the opposite effect was observed.
The correlation of the water content and NO3-N in the soil profile showed that the soil water content and NO3-N content were positively correlated. In W2F1, a highly significant level was observed (p < 0.01), and in W2F3, W3F1, and W3F2, a highly significant level was noted (p < 0.05). Under different irrigation conditions, nitrogen application had no obvious pattern in its impact on correlation.

4. Discussion

Regulating and controlling the water and nutrients in the root-dominant area is the optimal outcome of fertigation. This process ensures a stable water and fertilizer condition for plants, thereby improving the utilization efficiency of water and fertilizer.
Under drip irrigation conditions, water dripped from the emitter flows under the combined function of soil suction and gravitation, ultimately creating an ellipsoid-shaped wet body directly below the drip emitter. Apparently, the shape of the wet zone and the spatial distribution of water content are mainly affected by irrigation practices [22,23]. Recently, studies have shown that the wet zone is also affected by the fertilizing amount and fertilization concentration [24,25,26,27]. In this experiment, under the same irrigation conditions, an increase in the nitrogen application rate led to a rise in the soil water content, which was consistent with the results of previous studies [28]. Under the low-water irrigation condition, increasing the amount of nitrogen application increased the inhomogeneity of the distribution of soil water in the profile, however, under the medium- and high-water irrigation conditions, the trend reversed and increasing the amount of nitrogen application was beneficial for improving the uniformity of the soil water distribution. This might have been due to low water and low nitrogen, as crop roots had to expand into the lower soil layer to obtain the water and nutrients which are necessary for growth [29,30,31], while under high water and high nitrogen conditions, enough water and nutrients could be obtained from the upper soil; thus, roots were mainly distributed in the upper soil layer [17]. Previous studies have also shown that a high nitrogen application increases root length and surface area [32,33,34,35,36], that is, an increasing nitrogen application increases the water absorption capacity of roots. Increasing the nitrogen application under low water conditions might increase the water consumption from the soil and increase the inhomogeneity of the soil water distribution in the profile. However, under medium and high water conditions, the increased water supply would compensate for the consumption and thus reduce the inhomogeneity.
Research has shown that, the greater nitrogen concentration applied, the farther water flows in both the horizontal and vertical directions [37]. In this experiment, similar results were observed. Under low water conditions, nitrogen application had little effect on the soil water along both the horizontal and vertical directions, while under medium and high water conditions, a higher nitrogen application increased the horizontal distance where the maximum soil water content existed. In addition, the effect of nitrogen application was influenced by irrigation amount. The shape of the wet zone and soil water content under low water conditions were smaller than that of the medium and high water conditions, which led to a result that the effects of nitrogen application on the soil water in both the horizontal and vertical directions under low water conditions were the least.
It has been shown that an increase in the amount of nitrogen leads to an accumulation of nitrate in the soil [38,39]. The results of this study observed a similar trend, but the growing tendency gradually decreased with the increasing irrigation water. This could be attributed to excessive fertilization, which the crop roots could not absorb in a timely manner. With the increasing irrigation water, unabsorbed nitrate nitrogen was easy to leach out with leakage water [40,41]. This study also showed that, under low water conditions, nitrogen application had minimal impact on nitrate nitrogen distribution, while under medium and high water conditions, a higher nitrogen application resulted in an increased accumulation of nitrate nitrogen on the surface soil, with subsequent downward movement. It might be that less irrigation water leads to less mobility of nitrate nitrogen, and when irrigation water increases, some water moves up with evaporation [42] and some water infiltrates to deeper layers [43]. Since nitrate nitrogen moves with water, its distribution is consistent with the moving path, and the increasing application makes this accumulation more obvious [44].
In many references, soil water content has a good relationship with nitrate nitrogen [45,46]. The test showed that the water content of each point in the soil profile was positively correlated with the nitrate nitrogen content, but the effect of nitrogen application on the correlation was not significant. It might be caused by the plastic mulch, which cut off the path of soil water evaporation and changed the distribution of nitrate nitrogen.

5. Conclusions

(1)
Increasing nitrogen application was conducive to holding more water in the soil profile. When less water was irrigated, the uniformity of the water distribution decreased with an increase in the nitrogen application. When irrigation water increased, a higher nitrogen application led to more uniformly distributed water. Increasing nitrogen application was beneficial for improving the soil water content with distance away from the drip emitter, but the effect was not obvious under the conditions of lower irrigation amounts.
(2)
Increasing the nitrogen application increased the nitrate nitrogen content in the soil profile, and made more nitrate nitrogen move upward to the surface layer and downward to the deeper layer. However, this increasing trend would be weakened as the irrigation water increased. Under low water conditions, nitrate nitrogen mostly distributed directly under the drip emitter. Increasing the nitrogen application also had a positive effect on the nitrate nitrogen content along both the horizontal and vertical directions, but this effect declined with an increase in irrigation water.
(3)
There was no significant correlation between the average soil water content and nitrate nitrogen content along the horizontal direction. However, in the vertical direction, the soil water content was positively correlated with the nitrate nitrogen content. Increasing the nitrogen application enhanced the correlation under low water conditions, while under medium and high water conditions, the correlation decreased.
In conclusion, under low water conditions, a higher nitrogen application is recommended, but water might be the limiting factor for crop growth; thus, the suitable application needs to be determined further. If a large amount of water has to be irrigated or it is rainy year, a low application of nitrogen is recommended.

Author Contributions

Methodology, C.D.; Investigation, C.D. and Y.S.; Writing—original draft, C.D.; Writing—review & editing, Y.S.; Project administration, C.D. All authors have read and agreed to the published version of the manuscript.

Funding

This research was funded by National Natural Science Fund of China, the grant number was 51609208.

Data Availability Statement

The data are contained within the article.

Conflicts of Interest

The authors declare no conflict of interest.

References

  1. Yahaya, M.S.; Mahmud, A.A.; Abdullahi, M.; Haruna, A. Recent advances in the chemistry of nitrogen, phosphorus and potassium as fertilizers in soil: A review. Pedosphere 2023, 33, 385–406. [Google Scholar] [CrossRef]
  2. Liu, X.J.; Zhang, Y.; Han, W.X.; Tang, A.H.; Shen, J.L.; Cui, Z.L.; Vitousek, P.; Erisman, J.W.; Goulding, K.; Christie, P.; et al. Enhanced Nitrogen Deposition over China. Nature 2013, 494, 459–462. [Google Scholar] [CrossRef] [PubMed]
  3. Zhou, J.Y.; Gu, B.J.; Schlesinger, W.H.; Ju, X.T. Significant accumulation of nitrate in Chinese semi-humid croplands. Sci. Rep. 2016, 6, 25088. [Google Scholar] [CrossRef] [PubMed]
  4. Sigler, W.A.; Ewing, S.A.; Jones, C.A.; Payn, R.A.; Brookshire, E.N.; Klassen, J.K.; Jackson-Smith, D.; Weissmann, G.S. Connections among soil, ground, and surface water chemistries characterize nitrogen loss from an agricultural landscape in the upper Missouri River Basin. J. Hydrol. 2018, 556, 247–261. [Google Scholar] [CrossRef]
  5. Cameron, K.C.; Di, H.J.; Moir, J.L. Nitrogen losses from the soil/plant system: A review. Ann. Appl. Biol. 2013, 162, 145–173. [Google Scholar] [CrossRef]
  6. Alva, A.K.; Paramasivam, S.; Fares, A.; Delgado, J.A.; Mattos, D., Jr.; Sajwan, K.S. Nitrogen and irrigation management practices to improve nitrogen uptake efficiency and minimize leaching losses. J. Crop Improv. 2006, 15, 369–420. [Google Scholar] [CrossRef]
  7. Liu, Y.; Li, J.; Li, Y. Effects of split fertigation rates on the dynamics of nitrate in soil and the yield of mulched drip-irrigated maize in the sub-humid region. Appl. Eng. Agric. 2015, 31, 103–117. [Google Scholar] [CrossRef]
  8. Ayankojo, T.I.; Morgan, T.K.; Mahmoud, K. Evaluation of soil water and nitrogen distribution by site-specific irrigation scheduling method in tomato crop grown on sandy soil. Soil Sci. Soc. Am. J. 2019, 83, 761–771. [Google Scholar] [CrossRef]
  9. Alva, A.K.; Paramasivam, S.; Graham, W.D.; Wheaton, T.A. Best nitrogen and irrigation management practices for citrus production in sandy soils. Water Air Soil Pollut. 2003, 143, 139–154. [Google Scholar] [CrossRef]
  10. Cheng, Y.; Zhang, T.B.; Hu, X.L.; Liu, Z.Y.; Liang, Q.; Yan, S.H.; Feng, H.; Siddique KH, M. Drip fertigation triggered by soil matric potential reduces residual soil nitrate content and improves maize nitrogen uptake and yield stability in an arid area. Eur. J. Agron. 2023, 150, 126932. [Google Scholar] [CrossRef]
  11. Basso, B.; Ritchie, J.T.; Cammarano, D.; Sartori, L. A strategic and tactical management approach to select optimal N fertilizer rates for wheat in a spatially variable field. Eur. J. Agron. 2011, 35, 215–222. [Google Scholar] [CrossRef]
  12. Wang, H.Y.; Zhang, Y.T.; Chen, A.Q.; Liu, H.B.; Zhai, L.M.; Lei, B.K.; Ren, T.Z. An optimal regional nitrogen application threshold for wheat in the North China Plain considering yield and environmental effects. Field Crops Res. 2017, 207, 52–61. [Google Scholar] [CrossRef]
  13. Ma, Q.; Qian, Y.S.; Yu, Q.Q.; Cao, Y.F.; Tao, R.R.; Zhu, M.; Ding, J.F.; Li, C.Y.; Guo, W.S.; Zhu, X.K. Controlled-release nitrogen fertilizer application mitigated N losses and modified microbial community while improving wheat yield and N use efficiency. Agric. Ecosyst. Environ. 2023, 349, 108445. [Google Scholar] [CrossRef]
  14. Su, N.; Ronga, X.M.; Xie, G.X.; Chang, T.; Zhang, Y.P.; Peng, J.W.; Luo, G.W. Effectiveness of a 10-year continuous reduction of controlled-release nitrogen fertilizer on production, nitrogen loss and utilization of double-cropping rice. Sci. Total Environ. 2024, 912, 168857. [Google Scholar] [CrossRef]
  15. Davenport, J.; Stevens, R.; Whitley, K. Spatial and temporal distribution of soil moisture in drip-irrigated vineyards. HortScience 2008, 43, 229–235. [Google Scholar] [CrossRef]
  16. Zheng, J.H.; Huang, G.H.; Jia, D.D.; Wang, J.; Mota, M.; Pereira, L.S.; Huang, Q.Z.; Xu, X.; Liu, H.J. Responses of drip irrigated tomato (Solanumly copersicum L.) yield, quality and water productivity to various soil matric potential thresholds in an arid region of Northwest China. Agric. Water Manag. 2013, 129, 181–193. [Google Scholar] [CrossRef]
  17. Liu, C.Y.; Wang, R.; Wang, W.N.; Hu, X.T.; Cheng, Y.; Liu, F.L. Effect of fertilizer solution concentrations on filter clogging in drip fertigation systems. Agric. Water Manag. 2021, 250, 106829. [Google Scholar] [CrossRef]
  18. Wu, Y.; Yan, S.C.; Fan, J.L.; Zhang, F.C.; Zheng, J.; Guo, J.J.; Xiang, Y.Z. Combined application of soluble organic and chemical fertilizers in drip fertigation improves nitrogen use efficiency and enhances tomato yield and quality. J. Sci. Food Agric. 2020, 100, 5422–5433. [Google Scholar] [CrossRef]
  19. Wang, D.; Li, G.Y.; Mo, Y.; Cai, M.K.; Bian, X.Y. Evaluation of optimal nitrogen rate for corn production under mulched drip fertigation and economic benefits. Field Crop Res. 2018, 216, 225–233. [Google Scholar] [CrossRef]
  20. Jayakumar, M.; Janapriya, S.; Surendran, U. Effect of drip fertigation and polythene mulching on growth and productivity of coconut (Cocos nucifera L.) water, nutrient use efficiency and economic benefits. Agric. Water Manag. 2017, 182, 87–93. [Google Scholar] [CrossRef]
  21. Zhang, F.S.; Cui, Z.L.; Fan, M.S.; Zhang, W.F.; Chen, X.P.; Jiang, R.F. Integrated soil-crop system management: Reducing environmental risk while increasing crop productivity and improving nutrient use efficiency in China. J. Environ. Qual. 2011, 40, 1051–1057. [Google Scholar] [CrossRef] [PubMed]
  22. Selim, T.; Bouksila, F.; Berndtsson, R.; Persson, M. Soil water and salinity distribution under different treatments of drip irrigation. Soil Sci. Soc. Am. J. 2013, 77, 1144–1156. [Google Scholar] [CrossRef]
  23. Selim, T.; Berndtsson, R.; Persson, M. Simulation of soil water and salinity distribution under surface drip irrigation. Irrig. Drain. 2013, 62, 352–362. [Google Scholar] [CrossRef]
  24. Li, J.S.; Zhang, J.J.; Ren, L. Water and nitrogen distribution as affected by fertigation of ammonium nitrate from a point source. Irrig. Sci. 2003, 22, 19–30. [Google Scholar] [CrossRef]
  25. Zhou, F.; Xi, Q.L.; Xue, G.; Xu, S.X.; Yang, T.Z. Effects of different fertigation strategies on soil water and salt movement and redistribution in tobacco-growing soil. Water Sav. Irrig. 2023, 11, 99–106, 114, (In Chinese with English Abstract). [Google Scholar] [CrossRef]
  26. Wei, X.D.; Yin, J.; Hu, P.C.; Su, Z.J. Study on soil water movement under the condition of drip irrigation and fertilization. Water Sav. Irrig. 2020, 10, 41–46, 50, (In Chinese with English Abstract). [Google Scholar]
  27. Zhao, Y.B.; Yin, J.; Yin, L. A study on soil moisture change under drip irrigation. Water Sav. Irrig. 2018, 5, 5–11, (In Chinese with English Abstract). [Google Scholar]
  28. Yan, D.Z.; Wang, D.J.; Lin, J.H. Effects of fertilizer-N application rate on soil N supply, rice N uptake and groundwater in Taihu region. Acta Pedol. Sin. 2005, 42, 440–446, (In Chinese with English abstract). [Google Scholar]
  29. Flynn, N.E.; Comas, L.H.; Stewart, C.E.; Fonte, S.J. Deficit irrigation drives maize root distribution and soil microbial communities with implications for soil carbon dynamics. Soil Sci. Soc. Am. J. 2021, 85, 412–422. [Google Scholar] [CrossRef]
  30. Comas, L.H.; Becker, S.R.; Cruz VM, V.; Byrne, P.F.; Dierig, D.A. Root traits contributing to plant productivity under drought. Front. Plant Sci. 2013, 4, 442. [Google Scholar] [CrossRef]
  31. Sampathkumar, T.; Pandian, B.J.; Mahimairaja, S. Soil moisture distribution and root characters as influenced by deficit irrigation through drip system in cotton-maize cropping sequence. Agric. Water Manag. 2012, 103, 43–53. [Google Scholar] [CrossRef]
  32. Guo, Y.F.; Mi, G.H.; Chen, F.J.; Zhang, F.S. Effect of NO3-N supply on lateral root growth in maize plants. J. Plant Physiol. Mol. Biol. 2005, 31, 90–96, (In Chinese with English Abstract). [Google Scholar]
  33. Chen, Y.L.; Zhang, J.; Li, Q.; He, X.L.; Su, X.P.; Chen, F.J.; Yuan, L.X.; Mi, G.H. Effects of nitrogen application on post-silking root senescence and yield of maize. Agron. J. 2015, 107, 835–842. [Google Scholar] [CrossRef]
  34. Feng, G.Z.; Zhang, Y.J.; Chen, Y.L.; Li, Q.; Chen, F.J.; Gao, Q. Effects of nitrogen application on root length and grain yield of rain-fed maize under different soil types. Agron. J. 2016, 108, 1656–1665. [Google Scholar] [CrossRef]
  35. Hansel, F.D.; Amado, T.J.; Diaz DA, R.; Rosso, L.H.M.; Nicoloso, F.T.; Schorr, M. Phosphorus Fertilizer Placement and Tillage Affect Soybean Root Growth and Drought Tolerance. Agron. J. 2017, 109, 2936–2944. [Google Scholar] [CrossRef]
  36. Liu, X.S.; Zhao, J.W.; Liu, J.Y.; Lu, W.H.; Ma, C.H.; Gu, X.L. Water-phosphorus coupling enhances fine root turnover and dry matter yield of alfalfa under drip irrigation. Agron. J. 2021, 113, 4161–4175. [Google Scholar] [CrossRef]
  37. Li, J.; Zhang, J.; Rao, M. Wetting patterns and nitrogen distributions as affected by fertigation strategies from a surface point source. Agric. Water Manag. 2004, 67, 89–104. [Google Scholar] [CrossRef]
  38. Liu, X.Y.; He, P.; Jin, J.Y.; Zhou, W.; Sulewski, G.; Phillips, S. Yield gaps, indigenous nutrient supply, and nutrient use efficiency of wheat in China. Agron. J. 2011, 103, 1452–1463. [Google Scholar] [CrossRef]
  39. Xu, X.P.; Liu, X.Y.; He, P.; Johnston, A.M.; Zhao, S.C.; Qiu, S.J.; Zhou, W. Yield gap, indigenous nutrient supply and nutrient use efficiency for maize in China. PLoS ONE 2017, 10, 0140767. [Google Scholar] [CrossRef]
  40. Ju, X.T.; Xing, G.X.; Chen, X.P.; Zhang, F.S. Reducing environmental risk by improving N management in intensive Chinese agricultural systems. Proc. Natl. Acad. Sci. USA 2009, 106, 3041–3046. [Google Scholar] [CrossRef]
  41. Cui, Z.L.; Wang, G.L.; Yue, S.C.; Wu, L.; Zhang, W.F.; Zhang, F.S.; Chen, X.P. Closing the N-use efficiency gap to achieve food and environmental security. Environ. Sci. Technol. 2014, 48, 5780–5787. [Google Scholar] [CrossRef] [PubMed]
  42. Yang, M.J.; Lv, X.; Hou, Z.A.; Chen, J.; Zhang, Z. Distribution of Nitrate Nitrogen in Different Soil Layers under Drip Fertigation. Xinjiang Agric. Sci. 2013, 50, 875–881. [Google Scholar]
  43. Li, J.S.; Ji, H.Y.; Li, B.; Liu, Y.C. Wetting patterns and nitrate distributions in layered-textural soils under drip irrigation. Agric. Sci. China 2007, 6, 970–980. [Google Scholar] [CrossRef]
  44. Wang, Z.; Li, J.S.; Li, Y.F. Simulation of nitrate leaching under varying drip system uniformities and precipitation patterns during the growing season of maize in the North China Plain. Agric. Water Manag. 2014, 142, 19–28. [Google Scholar] [CrossRef]
  45. Clothier, B.E.; Sauer, T.J. Nitrogen transport during drip fertigation with urea. Soil Sci. Soc. Am. J. 1988, 52, 345–349. [Google Scholar] [CrossRef]
  46. Kadyampakeni, D.M.; Morgan, K.T.; Schumann, A.W.; Nkedi-Kizza, P.; Mahmoud, K. Ammonium and nitrate distribution in the soil using drip and microsprinkler irrigation for citrus production. Soil Sci. Soc. Am. J. 2014, 78, 645–654. [Google Scholar] [CrossRef]
Figure 1. Rainfall, evaporation, and accumulated evaporation during the growth period.
Agronomy 14 00798 g001
Figure 2. Distribution of soil water in the soil profile/%.
Agronomy 14 00798 g002
Figure 3. Changes in soil water content in the horizontal direction.
Agronomy 14 00798 g003
Figure 4. Changes in soil water content in the vertical direction.
Agronomy 14 00798 g004
Figure 5. Distribution of nitrate nitrogen in the soil profile/mg kg−1.
Agronomy 14 00798 g005
Figure 6. Changes in nitrate nitrogen content in the horizontal direction.
Agronomy 14 00798 g006
Figure 7. Changes in nitrate nitrogen content in the vertical direction.
Agronomy 14 00798 g007
Table 1. The correlation between soil water content and nitrate nitrogen of each treatment.
TreatmentW1F1W1F2W1F3W2F1W2F2W2F3W3F1W3F2W3F3
Horizontal directionCorrelation coefficient−0.209−0.580−0.4530.345−0.7690.7350.1720.195−0.005
p value0.7350.3060.4430.5700.1280.1570.7820.7540.993
Vertical directionCorrelation coefficient0.6830.993 **0.947 *0.998 **0.7060.6780.7670.8660.081
p value0.2040.0010.0150.0000.1830.2090.1300.0580.897
Soil profileCorrelation coefficient0.3120.1950.2350.722 **0.2590.403 *0.421 *0.469 *0.134
p value0.1290.3510.2580.0000.2120.0460.0360.0180.524
Note: * means significant correlation at the 0.05 level (bilateral); ** means significant correlation at the 0.01 level (bilateral).
Disclaimer/Publisher’s Note: The statements, opinions and data contained in all publications are solely those of the individual author(s) and contributor(s) and not of MDPI and/or the editor(s). MDPI and/or the editor(s) disclaim responsibility for any injury to people or property resulting from any ideas, methods, instructions or products referred to in the content.

