Abstract
The residual effect of compost and biochar amendment on soil properties and durum wheat response was evaluated under field conditions in a Mediterranean environment. The treatments compared in a randomized complete block experimental design with three replications were: mineral fertilizer (100 kg N ha−1), compost applied at the rate of 25 Mg ha−1, biochar applied at the rates of 10 and 30 Mg ha−1, unfertilized control. Wheat was the second crop included in a sorghum–wheat cropping system and did not receive fertilizer supply. A hierarchical statistical analysis was carried out to investigate how different treatments could impact the cropping system performance. The findings highlight the significant influence of soil properties, particularly total N, WEOC, and TOC, on wheat and protein yield. One year after the amendment and fertilizer application, compost and biochar significantly increased soil total organic carbon content. The highest soil water extractable organic carbon was found with the compost application (76.9 mg kg−1), whereas the lowest value (50 mg kg−1) was with the highest rate of biochar. Soil respiration rates and hydraulic properties were not affected by the investigated treatments. This behavior is probably related to the short experimental duration and to the silty clayey soil texture. Significant correlations were observed between bulk density and water content at pressure heads in the −20 and −100 cm range; this range accounts for the effect of soil macro and mesopores. Multiple linear regression analysis revealed strong predictive power for grain (R2_adj = 0.78; p < 0.001) and protein yield (R2_adj = 0.77; p < 0.001). The highest grain yield (3.36 Mg ha−1) was observed with compost, and the lowest (2.18 Mg ha−1) with biochar at a rate of 30 Mg ha−1. These findings lay the basis for understanding how different soil amendment management may impact soil quality and wheat performance, even in consideration of climate change.
1. Introduction
In the current context of resource scarcity, global climate change, environmental degradation, and increasing food demand, enhancing the use of by-products as organic matter sources in agriculture can promote sustainable development in the agricultural sector. This can allow restoration of soil quality and crop productivity, and prevent by-products rich in organic carbon from being treated as wastes [1,2,3]. Such strategies facilitate a transition towards a circular, solid, and resilient system based on sustainable production processes. In addition, the use of soil organic amendments, coupled with crop rotations and conservation tillage, represents a central strategy in managing marginal areas to restore productivity, improve the quality of degraded or abandoned soils, and revitalize ecosystems on contaminated lands [4,5,6]. This aligns with the UN Sustainable Development Goals (SDGs), which emphasize the need for restoring degraded soils to improve crop productivity, soil and water conservation, and the provision of ecosystem services [6].
Soil organic amendments, such as compost and biochar, play a crucial role in providing essential nutrients, restoring soil fertility, and re-establishing microbial populations. In addition, amendment application could allow carbon storage in the soil, converting it into more stable forms and decreasing CO2 loss in the atmosphere [7]. Compost is the product deriving from the aerobic decomposition (composting) of solid raw organic materials, such as yard trimmings, food residuals, or animal by-products, offering an effective solution for managing and recycling large amounts of organic materials [8]. The microbial bio-oxidation process requires a proper carbon to nitrogen ratio, a favorable temperature regime, and an optimal water and air content, to convert organic biomasses into a stabilized material suitable for soil amendment [9,10]. Usually, compost is characterized by a low decomposition rate and by a slow release of organically bound nutrients, making compost less susceptible to large nutrient losses. Biochar is the carbonaceous residue of pyrolyzed organic materials or biomass (particularly agricultural residues) and it is predominantly stable and recalcitrant. Due to its stability, biochar can be used for increasing soil carbon (C) sequestration [11,12,13,14], soil remediation [15,16], greenhouse gas emission mitigation [17,18], and improving soil fertility and crop yield [11,19,20]. In addition, biochar’s highly active surface area and functionality contribute to improving soil quality through positive effects on soil’s structure, chemical, and biological properties. For these reasons, biochar represents a suitable solution for degraded soils to alleviate problems caused by alkalinity, acidity, nutrient deficiency, and metal toxicity [6,11]. However, the chemical and physical properties of biochar may vary significantly depending on feedstocks and production methods and temperatures [11]. Wang et al. [21], in their review, highlighted that the decomposition rate of biochar in the soil depends on the feedstock, the pyrolysis conditions, and soil properties, with particular regard to textural characteristics. Wood-derived biochar showed a low decomposition rate, likely due to the inert properties of feedstock such as the high lignin content, whereas biochar obtained from crops and grasses was generally more degradable [22,23]. In addition, the decomposition rate decreased with increasing pyrolysis temperature [24,25] and a slower decomposition rate was observed in soils with high clay content. Soil moisture plays an important role in biochar degradation, increasing significantly under unsaturated or alternating saturated–unsaturated conditions [21].
Previous studies have highlighted the positive effect of compost and biochar amendment on soil fertility and crop yield [11,26,27,28,29,30,31]. However, results are often contradictory depending on amendment characteristics (source material, processing conditions), pedo-climatic conditions, and rates applied. Moreover, most of the research carried out, particularly on biochar application, has been performed under controlled conditions [28,32], whereas only a few studies have focused on the use of biochar as amendment on arable crops under field conditions. However, on-field studies are essential to provide information on how biochar and compost affect soil properties and crop response. Another factor to take into account is related to the evaluation of the residual effect of these amendments on soil fertility and crop response, as only a fraction of the nutrients available can be released to the crops in the first year of application [31,33,34,35,36]. Stable products, characterized by slow degradation, such as biochar and compost, can persist for months after application, with nutrients gradually released and positively impacting plant response over time [31,37,38]. Consequently, extending the intervals between soil amendment applications to more than one year could improve nutrient use efficiency while minimizing nutrient losses and contamination risks. In any case, in-depth investigations are necessary to optimize the amendment use in order to mitigate environmental risks and to guarantee sustainable yields.
The objective of this research was to evaluate the effect of compost and biochar amendment on chemical, biological, and physical soil properties, and wheat yield response under field conditions in a Mediterranean environment. Specifically, the study focused on the residual effect of soil amendment in the year following the application. A multidisciplinary approach was adopted to unravel the complex relationships within the soil–plant system by analyzing variations in crop yield response alongside specific hydrological, microbiological, and chemical soil indicators simultaneously. To this aim, a hierarchical statistical approach was applied for underlying mechanisms driving these interactions, with a particular focus on identifying the key soil properties that significantly influence grain performance.
2. Materials and Methods
2.1. Experimental Site and Treatments
The field experiment was performed at the experimental farm of the Council for Agricultural Research and Economics (CREA-AA) in Southern Italy, Foggia, (41°27′03″ N, 15°30′06″ E) during the cropping season 2021–2022. The climate of the area is classified as “accentuated thermo-Mediterranean” (Unesco-FAO—Rome, Italy—classification), with temperatures that may fall below 0 °C in winter and exceed 40 °C in summer. Rainfall is unevenly distributed throughout the year and is mostly concentrated in the winter months, with a long-term annual average of 550 mm. The soil is clay of alluvial origin classified by Soil Taxonomy–USDA as fine, mesic, Typic Chromoxerert [39,40], with a good content of organic matter (average value of 28.77 g kg−1) and total nitrogen (about 1.5 g kg−1).
To evaluate the residual effect of different amendments on soil properties and on wheat response, the following treatments were compared: mineral fertilizer (MIN), compost (COMP), two rates of biochar (CHAR10 and CHAR30), unfertilized control (TEST). The experimental trial was arranged in a randomized complete block design (RCBD) with three replications. The single plot size was 150 m2 (15 × 10 m).
In the spring 2021, about a week before the sowing of the summer crop [grain sorghum, Sorghum bicolor (L.) Moench.], the amendment and fertilization were carried out: in the COMP treatment, 25 Mg ha−1 of compost was applied; in the CHAR10 and CHAR30 treatments, 10 and 30 Mg ha−1 of biochar, respectively; in the MIN treatment 100 kg N ha−1 was applied as ammonium nitrate (1/3 at sowing, 2/3 in top-dressing). The mineral fertilizer (MIN treatment) was applied considering sorghum nitrogen needs, whereas the amendment doses (compost and biochar) were those recommended by the manufacturer. The amendments were spread and buried using a harrow in the 0−15 cm soil layer. The biochar used derives from a process of pyro-gasification of wood obtained from forest cutting (pine, oak, holm oak, chestnut, fir). The temperatures during the thermal degradation process reach values above 700–800 °C. The compost is a commercial organic amendment obtained by a controlled process of transformation and stabilization of renewable organic matrices such as manure, and animal and vegetable residues. In Table 1, the main chemical properties of the soil amendments and soil at the beginning of experiment are shown. The amounts of TOC and N applied were 2500 and 100 kg ha−1 with compost (COMP), 2028.6 and 6.9 kg ha−1 with the lowest rate of biochar (CHAR10), and 6085.8 and 20.7 kg ha−1 with the highest rate of biochar (CHAR30).

Table 1.
Main chemical properties of soil, at the beginning of the experiment (t0), compost and biochar.
In September, the sorghum was harvested and subsequently the soil was tilled and prepared for the durum wheat (Triticum durum Desf.) sowing. The crop cycle of wheat took place in the absence of amendment and fertilization in order to evaluate the residual effect of the treatments applied.
2.2. Soil Sampling and Analysis
Before the beginning of the field experiment (spring 2021), a soil sampling was carried out in order to characterize the soil and highlight the presence of any conditions of heterogeneity, not due to the treatment application.
One year after amendment and fertilization, during the wheat cropping (May 2022), soil sampling was carried out, taking 60 samples of disturbed soil (4 subsamples per plot) at a depth of 0.20 m, to evaluate the residual effect of the treatments studied on the biological and chemical soil properties. To this aim, each sample of disturbed soil was divided into two subsamples: one was stored at 4 °C in plastic bags until assaying of biochemical analysis, the others were air-dried and sieved for chemical ones. In the same moment, 30 samples of undisturbed soil (2 subsamples per plot) were also taken to evaluate physical soil properties.
2.2.1. Chemical and Biological Analyses
On air-dried and sieved soil samples (<2 mm particle size), total organic carbon content (TOC) was measured by dry combustion [40] with a TOC Vario Select analyzer (Elementar, Hanau, Germany), total nitrogen (N) was analyzed according to the Kjeldahl procedure, pH was measured in a soil to 0.01 M CaCl2 solution of 1:2.5 (w/v), and electrical conductivity (EC) was measured with a soil-to-water ratio of 1:2.5 (w/v), pH was quantified with a CRISON Titro Matic 2S pHmeter and EC with a CRISON GPL32 conductivimeter.
On fresh and field-moist soil samples, water extractable organic carbon (WEOC) was measured. Extraction of water-soluble carbon from the soil was carried out according to a protocol obtained by combining procedures reported in Haynes [41] and Rees and Parker [42]: 30 g of fresh-weight soil and 60 mL of distilled water (1:2 solid/liquid ratio) were placed in an Erlenmeyer flask, capped, and shaken for 30 min. The extracts were centrifuged at 10,000 rpm for 10 min and the supernatant was filtered through 45 μm Millipore filter. Total organic carbon in water extracts was analyzed with TOC Vario Select analyzer (Elementar, Hanau, Germany) [43].
On two out of the four fresh samples per plot, soil respiration rate was quantified by the titrimetric method [44]. This method is based on the determination of CO2 evolution from incubated soil. Approximately 30 g of soil was placed in vials, and deionized water was added to obtain a gravimetric water content of 30% [45]. Each vial containing soil was placed in a 1.0 L glass jar containing a vial with 4 mL of 1-M NaOH; moreover, 4 mL of acidified water was added into the base of the jar to maintain the humidity and reduce soil drying. Each jar was sealed tightly and placed in darkness in an incubation chamber with constant temperature of 28 °C. During incubation, the CO2 produced was trapped into NaOH solution, forming Na2CO3, and the excess NaOH, which did not react, was titrated with HCl. Soil respiration was determined after 1, 3, 7, 10, 14, 21, and 28 days of incubation: the glass jar was opened and the reaction of hydroxide with carbon dioxide was immediately stopped by adding 8 mL of 0.75-N BaCl2, then the NaOH vial was removed from the jar, and the excess NaOH was titrated out with 0.1 M HCl, setting the titration pH of 8.8. Soil respiration as μg C–CO2 g−1 h−1 was computed from the titration value according to the equation:
where V0 is the volume (mL) of acid (HCl) used to titrate the alkali (NaOH) of a blank solution (incubated without soil), V is the volume (mL) of acid used to titrate the alkali solution incubated with the soil sample, M is the molarity (mol L−1) of the acid (HCl), and EW is the equivalent weight (g mol−1) of C–CO2, 1000 is the converting factor from mg to μg, dw is the dry weight of soil (g), and hinc is the incubation duration expressed in hours [43]. Subsequently, the C-CO2 values were converted into CO2 values by multiplying by the CO2 equivalent weight (22 g mol−1).
2.2.2. Soil Hydrological Analyses
The 30 undisturbed soil cores (2 per plot) were sampled in the 0–10 cm layer using stainless steel rings with volume approximately equal to 200 cm3 (specifically, 204 cm3; H = 5 cm, D = 7.2 cm), for determining dry bulk density and water contents at selected soil pressure head values, h = −(2.5, 5, 10, 20, 40, 70, 100) cm. The soil water content at h = −100 cm corresponds to the field capacity of the soil. The steel rings with sharp edges were carefully inserted into the soil using a rubber hammer and a wooden board. Once extracted, soil cores were sealed with plastic film and stored in the refrigerator at a constant temperature of about 5 °C, until processing in the laboratory.
The water content was determined with filter funnels equipped with a porous plate, where a drainage process on an initially saturated soil sample was triggered. Specifically, during the transient of drainage, soil pressure head, h, was imposed, until the hydrostatic equilibrium corresponded to the imposed h value was reached. Therefore, the volumetric water content, θ, corresponding to the final h value (−100 cm), was obtained by the thermogravimetric method, and the other θ values were deduced adding the drained water between successive h values (as usual in this procedure). At the end of the desorption experiments, the undisturbed soil cores were used to determine the dry bulk density [46,47].
2.3. Grain Yield and Quality
At physiological maturity (end of June), wheat harvesting was performed for each plot in a test area of 22.5 m2. The wheat ears were threshed to obtain the grain weight, and calculate the grain yield (expressed at 13% of moisture) and the test weight. Moreover, grain yellow index, protein and gluten content were also measured (Infratec 1241 Analyzer, FOSS, 2010. Hillerød, Denmark). The moisture content of the grain at threshing was determined in laboratory after drying at 70 °C until constant weight.
2.4. Data Analysis
Soil and wheat yield data were preliminary analyzed in order to investigate the distribution of the variables under study for the whole data set. Data were then tested for normality using the Kolmogorov–Smirnov test. This preliminary evaluation showed that, except for pH values (p = 0.02102), data distribution did not deviate from Gaussianity according to the normality test (Table S1). For this reason, data were not transformed.
Data were then subjected to a nested analysis of variance for a randomized complete block design (RCBD), considering the sub-replicates within each plot as pseudo-replicates [40]; means were compared using SNK post hoc test at p = 0.05 level. In addition, a two-way analysis of variance was conducted to analyze soil respiration data collected over time across different treatments. The treatment factor included different amendment and fertilization conditions, while the time factor represented sequential measurements taken at regular intervals. The two-way analysis of variance allowed for the assessment of main effects associated with treatment and time, as well as potential interactions between these factors.
Pearson linear correlation analysis was performed to investigate relationships between chemical, biological, and physical soil variables. The Pearson correlation coefficients provided insights into the strength and direction of the relationship between the variables investigated.
In addition, to investigate how different treatments could impact the cropping system performance, a hierarchical statistical analysis was performed. This hierarchical approach facilitated a systematic exploration of the relationships between soil indicators, treatments, and wheat yield parameters and enabled a more comprehensive understanding of the factors influencing wheat quality. The hierarchical framework approach is described in the following paragraph.
Hierarchical Approach for Statistical-Based Assessment of the Relationship between Yield Response Parameters and Soil Indicators
The analysis focused on evaluating the relationship between the type of amendment and fertilization and grain yield parameters, exploring how soil quality chemical (TOC, EC, pH, WEOC, and Total N), physical and hydrological (bulk density and water contents at selected soil pressure head values), and biological (soil respiration) indicators interacted with each other and influenced crop response.
The first objective was to identify the wheat yield parameters most influenced by soil quality variables. To achieve this, a standardized multiple linear regression was used in order to provide an algebraical expression of the relationship between two or more variables (soil chemical parameters) and indicate the extent to which a dependent variable (grain performance) can be predicted or the extent of the association with other variables. Regression analysis on standardized variables produces standardized coefficients which represent the change (weight) in the response variable that results from a change of one standard deviation in the corresponding explanatory variable. Based on the resulting adjusted R2 values (R2_adj) and p-values, it was determined which grain parameters were most susceptible to the influence of soil chemical properties, and the values of the regressors associated with each predictor were investigated to evaluate the magnitude of the impact that each chemical property had on the previously identified yield response variables.
Subsequently, the next step was to assess how different management practices impacted soil chemical properties, which in turn influenced the grain performance of wheat, as indicated by the exploration of parameters and coefficients of multiple linear regression equation. Categorical independent variables such as the treatments compared (CHAR30, CHAR10, MIN, COMP, and TEST) were first coded by one or more dummy variables, which involves transforming categorical variables into a set of binary (dummy) variables. Dummy coding generates a matrix where each categorical variable is associated with a set of numbers (1-0) that numerically identifies that variable (soil chemical properties), as shown in Table S2. This correlation analysis allowed for a comprehensive examination and understanding of how different treatments influenced soil chemical properties and, subsequently, grain performance.
Finally, the k-means clustering algorithm was applied to group measurements by volumetric water content values at specific pressure heads (wet conditions). K-means is a machine learning technique that partitions data points into clusters based on similarity, aiming to maximize intra-cluster cohesion and inter-cluster separation. By employing k-means clustering, our aim was to identify sets of pressure heads that yielded similar volumetric water content readings. Clustering based on pressure head–volumetric water content pairs facilitated the identification of broader trends and patterns in the data, making it easier to detect treatment effects and interpret their implications for soil water dynamics. The elbow method was used to define the optimal number of clusters. Finally, a factorial analysis of variance was conducted to investigate the effect of compared treatments on volumetric water content at different pressure heads in each cluster identified.
Data analysis was carried out using the SAS/STAT 9.2 software [48] and JMP® Pro version 15 [49].
3. Results
3.1. Chemical, Biological, and Physico-Hydrological Soil Properties
The analysis of variance carried out on soil chemical variables quantified on samples collected at the beginning of the experiment (t0) showed homogeneity of the soil variable distribution over the experimental site since no significant differences were observed among the samples.
The application of compost (COMP) and biochar at increasing rates (10 and 30 Mg ha−1; CHAR10 and CHAR30) affected some of the soil chemical properties investigated (Table 2). After one year from the treatments’ application (May 2022), the soil total organic carbon was significantly higher in COMP, CHAR10, and CHAR30 treatments in comparison to the treatment that received mineral fertilizers (MIN) and the unfertilized control (TEST); an average increase of 9% was observed in comparison to the unfertilized control. The highest content of water extractable organic carbon (WEOC), 76.93 mg kg−1, was observed with compost application, while the lowest value (49.98 mg kg−1) was observed in the treatment with the highest rate of biochar (CHAR30).
Table 2.
Soil properties measured on the soil samples collected one year after the treatment application.
Total N showed a tendency towards significance (p = 0.066), with the highest average value in the compost treatment (1.66 g kg−1). No significant differences were observed for soil pH and electrical conductivity (EC). A significant correlation was observed between total N content and water extractable organic carbon (r = 0.7392, p = 0.0016).
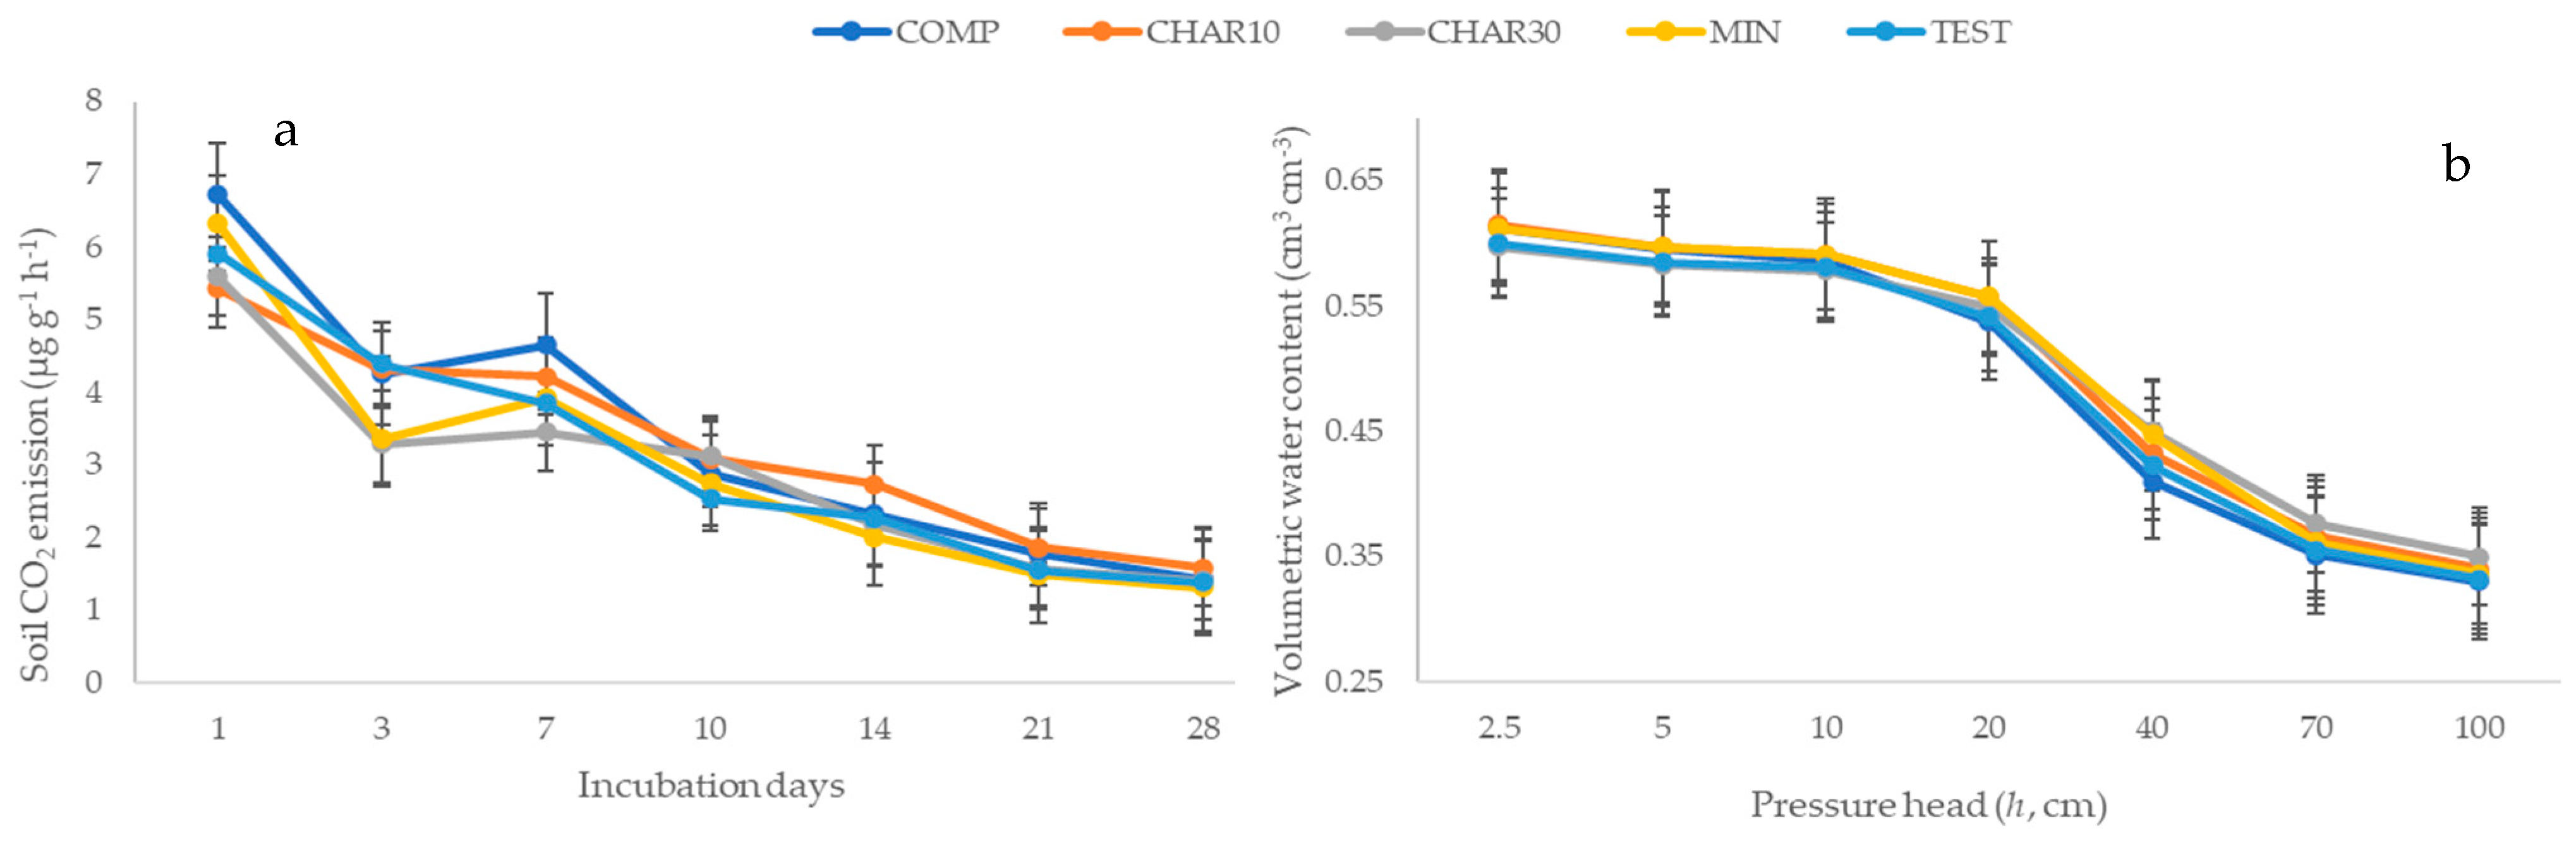
Soil respiration, estimated as the CO2 produced and released during an incubation period of 28 days, did not show significant differences among treatments (Figure 1a). The highest CO2 emission rates, for all treatments, were found after one day of incubation, then the respiration gradually declined with time, reaching the lowest value at the end of the incubation period (after 28 days). At the beginning of the incubation experiment, the highest soil respiration rate (6.71 μg g−1 h−1) was observed in the COMP treatment that was characterized by the highest WEOC value. The two-way ANOVA revealed that the effect of investigated treatments on soil respiration was not statistically significant (Table 3). However, time demonstrated a significant impact on soil respiration, indicating temporal variations in soil respiration levels over the observation period. Moreover, the interaction between treatment and time did not exhibit statistical significance, suggesting that the influence of treatment on soil respiration did not vary significantly across different time points.
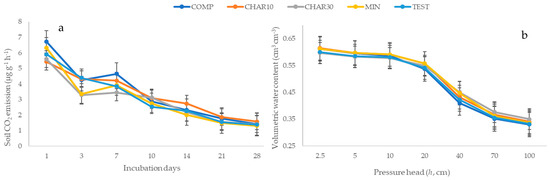
Figure 1.
Soil respiration rate measured on the soil samples collected one year after the treatment application (a). Volumetric water content measured on the soil samples collected one year after the treatment application at different imposed pressure heads (b). The pressure head values are reported in absolute value. The bars represent the standard error.
Table 3.
Two-way analysis of variance table summarizing the effects of fertilization treatments on soil respiration measurements.
Physical and hydraulic soil properties were not significantly affected by the compared treatments (Table 2). The average soil bulk density was 1.06 g cm−3, with the lowest value observed in the treatment that received a compost application (1.04 g cm−3). The soil average volumetric water content was 0.60 cm3 cm−3 at a pressure head of −2.5 cm (near the soil saturation condition). As the soil pressure head decreased, the water content gradually decreased until it reached an average value of 0.34 cm3 cm−3 at field capacity (−100 cm, Figure 1b).
Interesting relationships were observed between the soil bulk density and the volumetric water content at the pressure head values considered. In particular, significant positive correlations were observed with the water contents at pressure head values ranging from −20 to −100 cm, i.e., the field capacity, with the intensification of the relationships as the pressure head values decreased (Table 4). Although not significant, an inverse trend was observed between the soil bulk density and the water content at pressure head values close to zero (range between −2.5 and −10 cm). The above relationship was therefore weaker when soil pores of relatively larger size (i.e., until about 0.3 mm) were considered, and became stronger for mesopores class (>0.03 mm).
Table 4.
Pearson’s linear correlation coefficients between the bulk density and the volumetric water content at the pressure head values in the range between −2.5 and −100 cm.
3.2. Grain Wheat Yield and Quality
Organic amendment and mineral fertilization significantly influenced wheat yield response, whereas the grain quality variables—test weight, grain yellow index, protein and gluten content—were not affected by the treatments compared (Table 5). The highest grain yield was observed in the treatment with compost (3.36 Mg ha−1) with an average increase of 27.9% compared with the unfertilized control, whereas the lowest yield (2.18 Mg ha−1) was recorded with the supply of biochar at the highest rate (CHAR30). The trend observed in grain yield was consistent with that of water extractable organic carbon (Table 2), supported by the significant correlation between the two variables (r = 0.859, p < 0.0001). A significant correlation was also observed between grain yield and total nitrogen content (r = 0.862, p < 0.0001), in agreement with the significant relationship recorded between the two soil chemical indicators (total N and WEOC).
Table 5.
Effects of different treatments on durum wheat grain yield and quality.
3.3. Relationship between Treatments Investigated, Soil Properties, and Durum Wheat Response
The multiple linear regression analysis revealed strong predictive power for wheat production (R2_adj = 0.78; p < 0.001) and protein yield (R2_adj = 0.77; p < 0.001) in response to the chemical soil assets (Table 6). However, no direct effects of soil chemical variables on other grain parameters were observed.
Table 6.
Parameters of significance in multiple linear regression between soil chemical properties and grain yield variables.
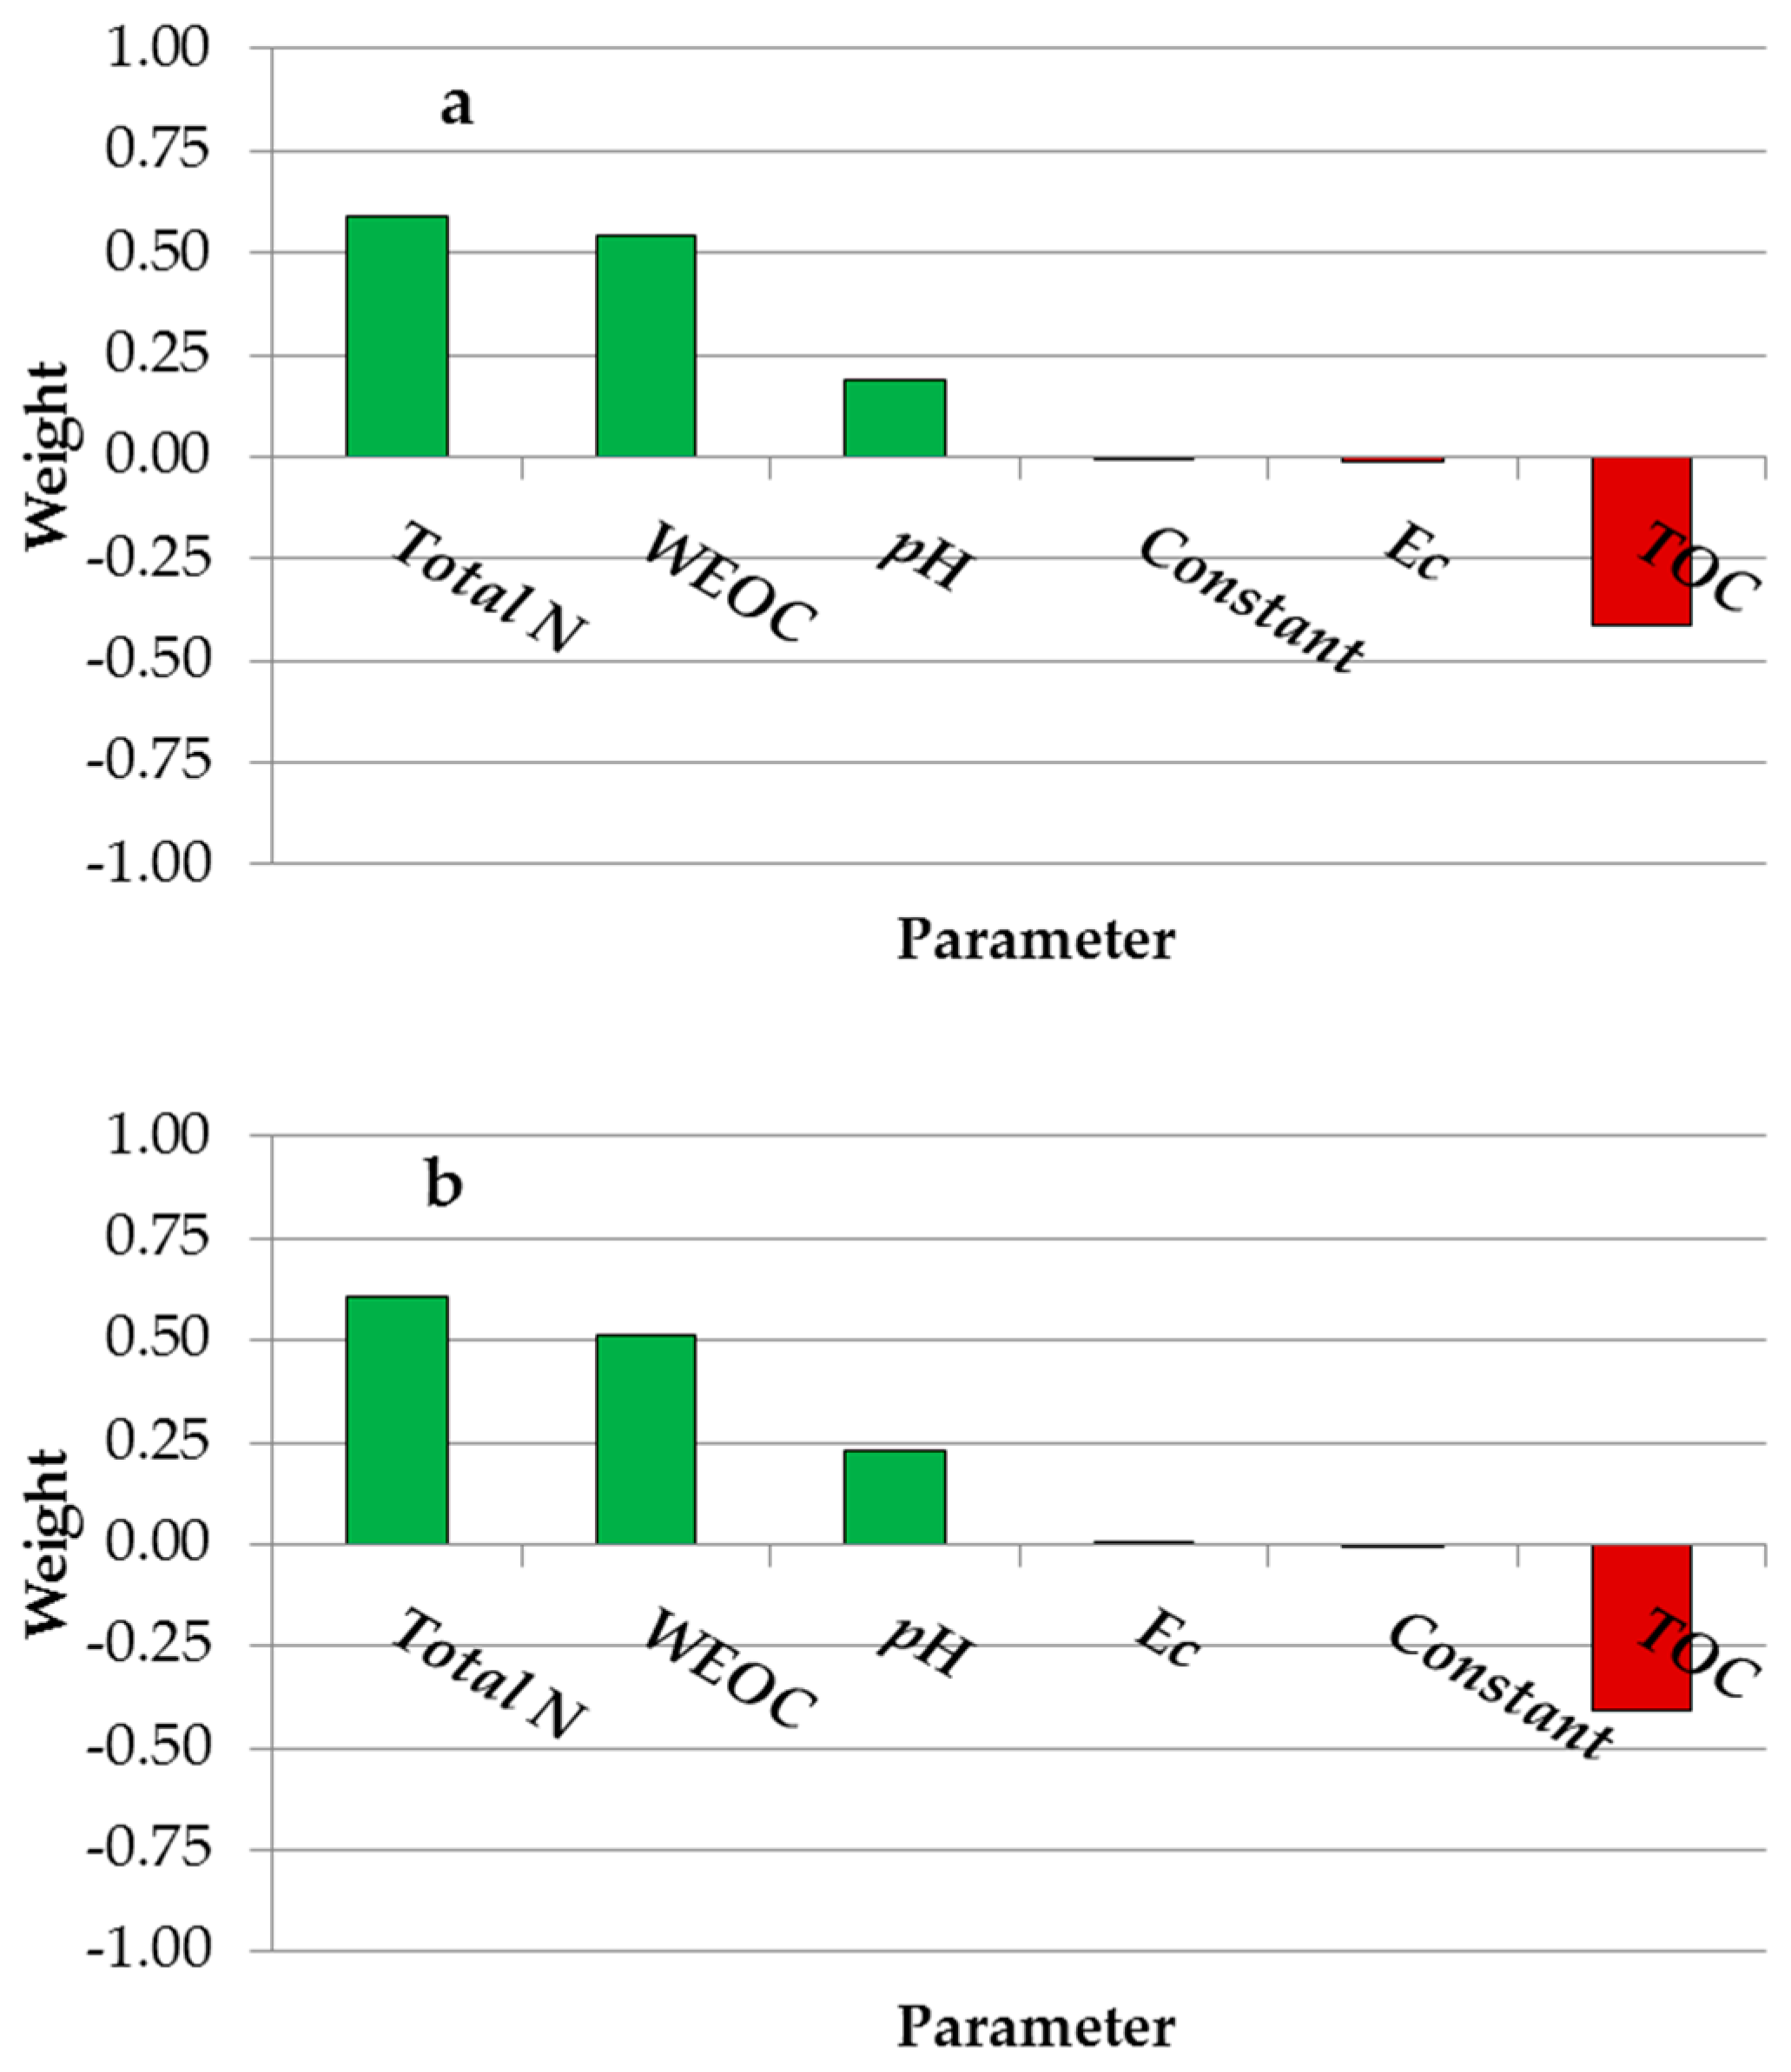
Among the soil variables, total N emerged as the most influential factor compared to the other soil chemical indicators, positively impacting both wheat yield and protein yield, with standardized regression coefficients (β) of 0.59 and 0.61, respectively (Figure 2a,b). WEOC also exhibited a positive effect, with standardized regression coefficients of 0.54 for wheat yield and 0.51 for protein yield. Conversely, TOC exerted negative effects on both parameters, with standardized regression coefficients of −0.41 for both grain and protein yield.
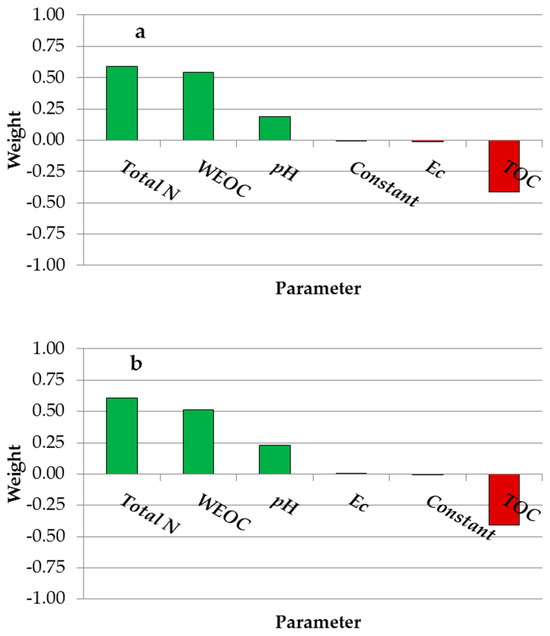
Figure 2.
Standardized regression coefficients for predictors (pH, EC, TOC, WEOC, and Total N) in the multiple linear regression model predicting wheat grain yield (a) and protein yield (b). The green color indicates a positive effect of the examined soil variables on crop performance; the red color indicates a negative effect.
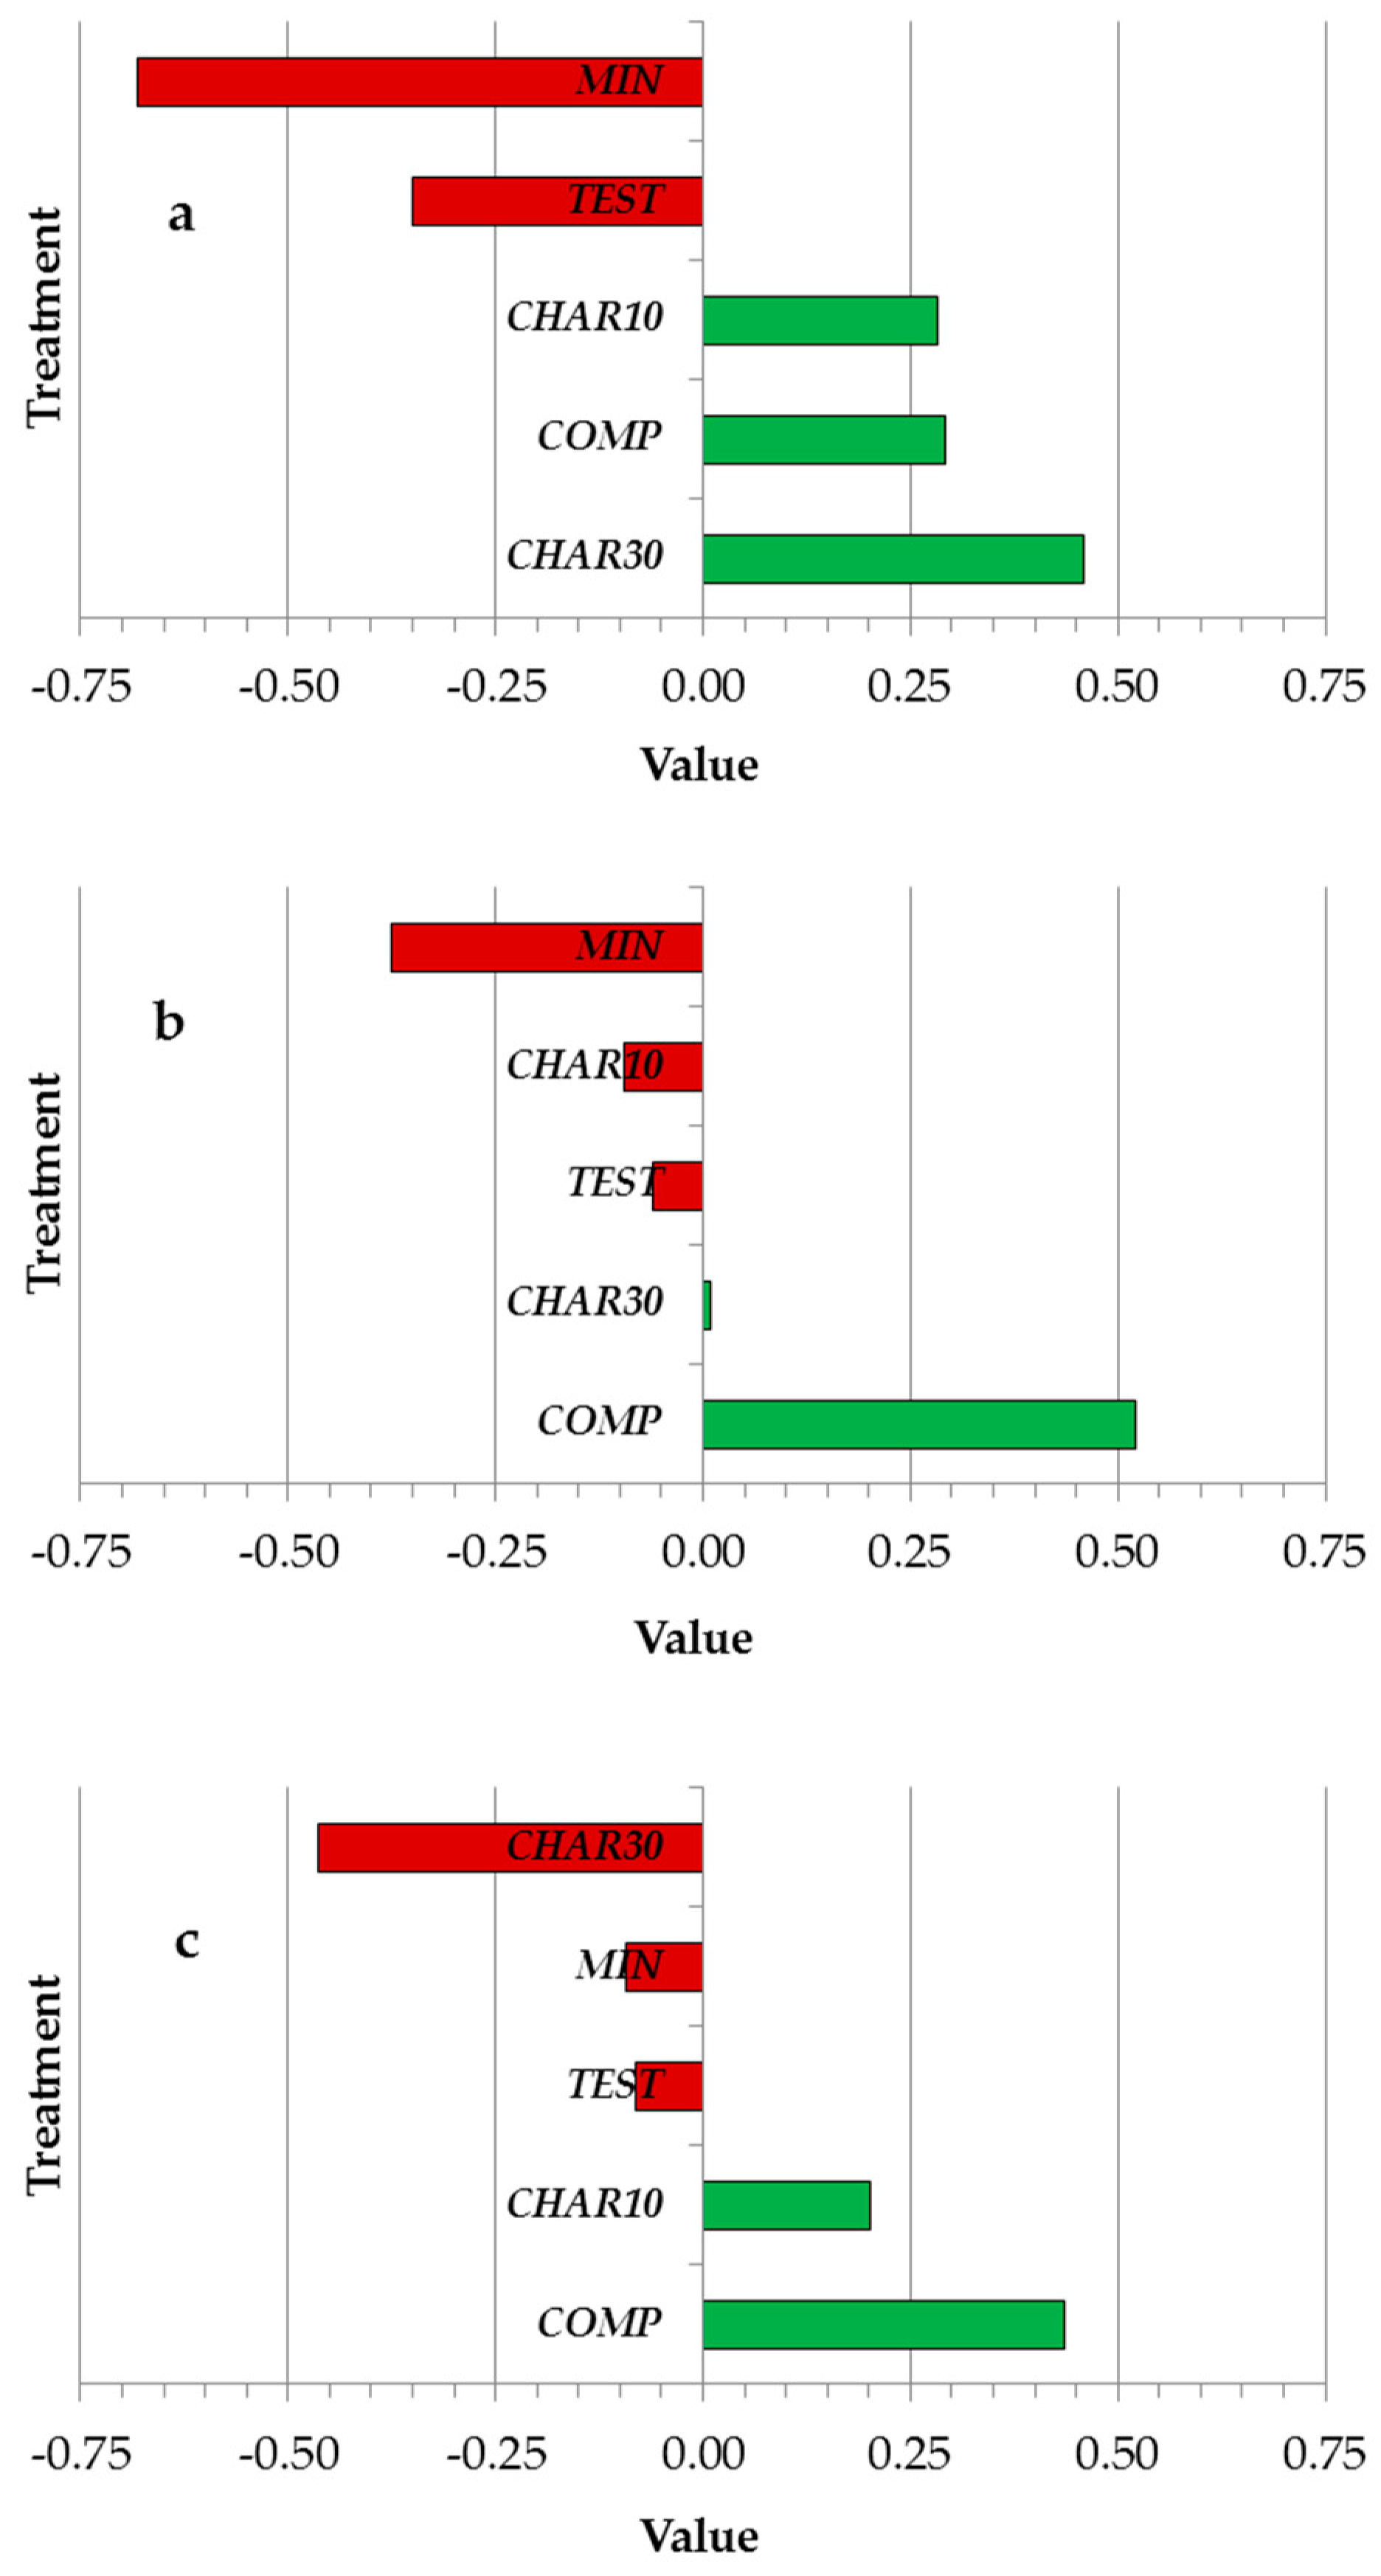
Additionally, Pearson correlation coefficients were computed to examine the relationships between tested treatments and soil properties (Figure 3a–c). Mineral fertilizer and the unfertilized control displayed inverse relationships with TOC (−0.68 and −0.35, respectively, Figure 3a), while compost and biochar treatments exhibited positive associations (0.28, 0.29, and 0.46 for CHAR10, compost, and CHAR30, respectively). For total N (Figure 3b), mineral fertilizer exerted a negative effect on this soil parameter, conversely to the compost behavior. Regarding WEOC (Figure 3c), CHAR30 exhibited an inverse correlation, while compost and CHAR10 demonstrated favorable relationships. The Pearson correlation coefficients for WEOC were very small for mineral fertilizer, but not negligible for compost and biochar at the highest rate.

Figure 3.
Pearson correlation coefficients between compared treatments and total organic carbon (TOC; (a)), Total nitrogen (Total N; (b)), and Water-Extractable Organic Carbon (WEOC; (c)). The green color indicates a positive correlation between the fertilizer application and the examined soil variables; the red color indicates a negative correlation.
According to the elbow method, clustering the data into two clusters was adequate, as the explained variance reached a high value of 0.91 for two clusters. Consequently, the treatments were grouped into two clusters based on their volumetric water content response to varying pressure heads. Cluster 0 represented treatments with relatively higher volumetric water content, while Cluster 1 comprised treatments with lower volumetric water content (Table 7).
Table 7.
Volumetric water content (cm3 cm−3) at different pressure heads (cm) for each treatment clustered by K-means analysis. The pressure head values are reported in absolute value.
The results of the two-way analysis of variance conducted after clustering confirm the presence of two distinct clusters that partition the volumetric content based on pressure heads (Table 8). These results also confirm the relationships observed between the soil bulk density and the volumetric water content at the investigated pressure head values (Table 4). However, no significant differentiation was observed among the fertilizer treatments within these clusters. This suggests that while the clusters differ significantly in volumetric content, the fertilizer treatments did not exhibit significant differences in their impact on soil water content.
Table 8.
Two-way analysis of variance table summarizing the effects of fertilization treatments on water retention properties, investigating the two clusters from k-means elaboration.
4. Discussion
The evaluation of the residual effect of soil amendment application is an issue of great relevance in relation to the effect on soil fertility and crop response, and to the environmental implications. The results of this study provide valuable insights into the potential effects of different amendment applications on soil properties and their impact on crop performance. The significant correlations observed between the compared treatments and soil properties, particularly TOC, total N, and WEOC, shed light on the complex interactions within agricultural systems.
The results of this study showed that the application of compost and biochar enhanced soil total organic carbon (TOC) content compared to non-amended treatments. The use of amendments characterized by high organic carbon contents (20 g 100 g−1 for compost and 88 g 100 g−1 for biochar) can represent a strategy to maintain or even increase the organic carbon content in the soil and therefore contribute to mitigate the effects of climate change, reducing CO2 emissions into the atmosphere. These results support the positive effects of compost and/or biochar additions on soil properties, consistent with prior studies [32,50,51,52,53,54,55,56,57,58]. Furthermore, the effect of biochar on the soil carbon content and its fractions depends both on the type of raw material and on the pyrolysis conditions, with particular regard to the temperatures reached during the transformation process [55,56]. In particular, the recalcitrant organic carbon content tends to increase with the pyrolysis temperature [24,25,55]; conversely, the fraction of labile organic carbon tends to be higher in the biochar obtained at the lowest temperature [55]. In our study, the biochar was produced from wood obtained from forest cutting, with high pyrolysis temperatures (above 700−800 °C), leading to a product with a high C/N ratio (294) and a large fraction of stable carbon. Consequently, the WEOC was lower in soil treated with biochar, especially at the highest rate (30 Mg ha−1), compared to treatment with compost.
The negative correlations observed between mineral fertilizer and the unfertilized control with TOC suggest that these treatments may have contributed to reductions in TOC levels. Mineral fertilizers are known to accelerate microbial decomposition and organic matter mineralization, leading to decreased TOC levels over time, as found in studies highlighting the potential for mineral fertilizers to deplete soil organic carbon [59].
The influence of WEOC on crop performance is consistent with previous studies emphasizing the importance of dissolved organic carbon in nutrient mineralization and availability [60,61]. On the other hand, an increase in TOC was found to be inversely related to WEOC soil levels [62] with negative implication on crop performance, as shown by the lowest grain yield obtained from wheat under CHAR30 management. The application of biochar at different rates resulted in an apparently contradictory response. While the application of 10 Mg ha−1 of biochar demonstrated the potential to exert a slightly positive effect on the trend of WEOC, 30 Mg ha−1 of biochar provided a diametrically opposite and more robust response.
In our study, the most pronounced negative correlation between compared treatments and total nitrogen was observed in the mineral fertilizer. This finding is consistent with results reported in previous studies, wherein the decline in total N content in soil treated with mineral fertilizers was attributed to leaching losses compared to other treatments such as compost [63]. Fertilization with compost, on the other hand, has been demonstrated to result in higher labile carbon pools, increased microbial activity, and enhanced soil nitrogen availability compared to systems receiving mineral fertilizers alone, as observed in previous studies [64,65]. Furthermore, the synergistic effect deriving from the combination of well-humified organic nitrogen and mineral nitrogen present in organic fertilizers stimulates soil microbial biomass and facilitates nutrient release [66]. This could account for the superior performance in wheat yield observed in the COMP treatment compared to other treatments tested in this study.
Soil pH was not significantly affected by the treatments compared, probably due to the buffering capacity of the clayey soil [67]. As concerns EC, the slightly higher values observed in compost-amended soils can be attributed to the higher salinity in the compost (2.2 dS m−1), also in agreement with previous studies [30,52].
The application of biochar and compost did not significantly alter soil respiration rates compared to other treatments. Several factors may explain this observation. Firstly, the short experimental duration and the sampling time after the soil amendment might have limited the detection of the effects on soil respiration. Biochar is known to form a stable carbon pool that decomposes slowly over time, potentially requiring longer monitoring periods to observe significant changes [21]. Additionally, the application rate (up to 30 Mg ha−1) and pyrolysis temperature (700–800 °C) of the biochar used in this study may have contributed to the lack of noticeable response in soil respiration. Meta-analyses have shown that biochar amendments are more likely to affect soil respiration when lower pyrolysis temperatures (<350 °C) and higher application rates (>40 Mg ha−1) are used [68]. Additionally, it has been shown that while biochar amendment increased bacterial richness and diversity, it did not alter the abundance of species associated with carbon cycle functional genes [69]. Numerous studies, including that of Ameloot et al. [70], report a higher mineralization activity during the first few days after amendment, while later respiration rates become similar to those of unamended soil. This is in agreement with our findings where in the first days of incubation, the respiration rate of the compost-amended soil showed higher average values compared to the other treatments, probably due to the higher content of the labile fraction of organic carbon (WEOC) observed in this treatment. Likely, the greater availability of the readily labile organic C fraction created favorable conditions for soil microorganisms and consequently soil respiration and C–CO2 emissions increased [71].
Soil physical and hydrological properties are important indicators of soil quality and play a key role in defining soil health and ensuring a sustainable agricultural production [72]. The water retention curve is an indicator of the characteristics of the poral system (soil pore-size distribution) and the water contents at higher pressure head values (h), close to saturation (in the range 0–100 cm), are influenced both by the textural and structural properties [73]. For these reasons, they are sensitive to the effect of agronomic management (soil tillage, amendment, fertilization, water management, etc.) Our investigation did not highlight significant differences among the treatments for the soil water content at various pressure heads and bulk densities. These findings suggest that the residual effect of the studied treatments on soil water retention capacity was not pronounced after 13 months of application, in line with similar previous results [74]. This lack of significant differences in soil water retention capacity at explored h among the treatments contrasts with some expectations based on previous research indicating potential benefits of organic amendments on soil properties. For instance, other studies reported that the addition of organic amendments determines a reduction in the bulk density and an increase in the water retention capacity in the entire potential range considered [58,73,75,76,77,78,79,80,81], with effects varying as a function of soil textural composition, application rates, incorporation depth, and amendment characteristics, and with more marked effects observed in sandy soils [73,78]. In addition, an increase in the micropores (diameter of 5–30 µm), playing an important role in retaining soil water [82,83]; and the larger specific surface area of the biochar, providing more adsorption sites for soil water, were reported to improve the water content of soils amended with biochar [80]. However, our results are consistent with Bauer and Black [84], which found limited impacts of organic amendments on soil water retention. The discrepancies among previous studies underscore the complexity of soil–organic matter interactions and suggest that the effects of different amendments on soil water retention may be influenced by various factors, including soil texture, initial soil properties, and climatic conditions [74], as discussed in this study. In particular, in our experiment, the clayey soil texture, with clay and silt contents higher than 40% and 30% and a total organic carbon content of 1.6 g 100 g−1, could have attenuated the differences between the compared treatments. Furthermore, the effects of different fertilizer treatments on soil water content may vary depending on the moisture regime considered. Other researchers pointed out that while significant differences were not observed in the wet range of the soil water retention curve among the treatments (as observed in our study), the dry range exhibited more variability [85].
Significant correlations between bulk density and the water content at pressure head values in the interval from −20 to −100 cm allowed disclosing an effect of compost on physical properties. Considering that soil water contents at −10 and −100 cm reflect the influence of soil macro and mesopores (pore diameters >0.3 and 0.03 mm, respectively), it suggests that the soil amendment effect was primarily observed within this range of the poral diameters. Finally, the inverse behavior, although not significant, observed between the bulk density and the water contents at pressure heads close to zero (between −2.5 and −10 cm) could be explained by the higher specific surface area of soil amendments which, as previously highlighted [80], can provide more adsorption sites for soil water, through physical and chemical absorption processes.
The application of compost and biochar positively affected wheat yield response. In several studies, the effectiveness of the application of compost and biochar on wheat yield response was highlighted [26,36,53,86,87], even in the long term [36], and explained as the greater availability of macro- and micro-nutrients during the crop cycle, and the positive effect on soil properties and in particular on the enzymatic activities involved in the carbon, nitrogen, phosphorus, and sulfur cycle. Eghball et al. [34] observed a residual effect of the application of organic amendments, manure, and compost, on maize yield and nitrogen uptake at least in the year following the application, while the effects observed on the soil properties were more lasting over time. In our study, the lowest yield was found for the treatment with biochar at the highest rate (30 Mg ha−1). Similar results were observed in previous studies on horticultural crops, where reduction in growth and yield with rates of biochar higher than 16 Mg ha−1 were highlighted; optimal suggested rates ranged from 8 to 20 Mg ha−1 [28,30,31]. Finally, positive results were reported in other studies where biochar was combined with mineral fertilization [50,88,89,90,91,92].
5. Conclusions
These findings highlight the significant influence of soil properties, particularly total N, WEOC, and TOC, on wheat grain and protein yield. High total N levels are associated with increased protein synthesis, leading to enhanced wheat grain and protein yield. Conversely, elevated TOC levels can lead to nitrogen immobilization, negatively impacting wheat quality. WEOC plays a vital role in nutrient mineralization and availability, contributing positively to wheat grain yield and quality. The observed correlations between investigated treatments and soil chemical properties emphasize the importance of soil management practices in optimizing wheat quality parameters. Despite expectations, biochar application did not exert a significant impact on soil respiration rates, an outcome possibly influenced by factors such as the short experimental duration and application management. Additionally, no discernible differences were detected among treatments concerning soil water content, implying limited residual effects on soil water retention capacity at higher pressure head values, a behavior possibly related to the silty clayey soil texture which could have attenuated the differences among treatments. The significant correlation observed between soil bulk density and the water content at pressure heads in the range −20 and −100 cm should be further investigated, since this range establishes the soil condition in which the larger pores (macropores) are mostly emptied due to gravity action whereas the intermediate ones (mesopores) still contain water inside them. These initial findings lay the groundwork for understanding how different soil amendment management may impact soil quality and wheat performance, even in consideration of climate change.
Supplementary Materials
The following supporting information can be downloaded at: https://www.mdpi.com/article/10.3390/agronomy14040749/s1, Table S1: (a) Descriptive statistics on soil chemical and biological properties, (b) Descriptive statistics on soil physical properties, (c) Descriptive statistics on grain yield and quality; Table S2: Encoding of dummy code for categorical variables. Each fertilizer treatment corresponds to a string of 1-0 code combination.
Author Contributions
Conceptualization, R.L. and A.M.S.; methodology, R.L., A.M.S. and P.G.; formal analysis, R.L., C.V. and M.M.; investigation, R.L., A.M.S. and F.F.M.; resources, P.G. and M.C.; data curation, R.L., A.M.S., P.G. and M.C.; writing—original draft preparation, R.L. and I.S.; writing—review and editing, R.L., A.M.S., P.G., G.L., M.S., F.F.M. and M.C.; visualization, G.L.; supervision, R.L.; project administration, R.L.; funding acquisition, R.L. and A.M.S. All authors have read and agreed to the published version of the manuscript.
Funding
This research received no external funding.
Data Availability Statement
Dataset available on request from the authors.
Acknowledgments
This research was supported by the “Recovery of Organics and Nutrients from Sludge of Apulian Soils—RONSAS” project, funded by Apulia Region (DGR n. 2321 del 28 December 2017) under the P.O. FESR Puglia 2014/2020—asse VI, Azione 6.4, Sub-Azione 6.4.a. The Authors also thank Alessandro Vittorio Vonella and Luisa Giglio for their skillful technical assistance. This study was carried out within the Agritech National Research Center and received funding from the European Union Next-GenerationEU (PIANO NAZIONALE DI RIPRESA E RESILIENZA (PNRR)—MISSIONE 4 COMPONENTE 2, INVESTIMENTO 1.4-D.D. 1032 17 June 2022, CN00000022). This manuscript reflects only the authors’ views and opinions; neither the European Union nor the European Commission can be considered responsible for them.
Conflicts of Interest
The authors declare no conflicts of interest.
References
- Nattassha, R.; Handayati, Y.; Simatupang, T.M.; Siallagan, M. Understanding circular economy implementation in the agri-food supply chain: The case of an Indonesian organic fertiliser producer. Agric. Food Secur. 2020, 9, 10. [Google Scholar] [CrossRef]
- Velasco-Munoz, J.F.; Mendoza, J.M.F.; Aznar-Sanchez, J.A.; Gallego-Schmid, A. Circular economy implementation in the agricultural sector: Definition, strategies, and indicators. Resour. Conserv. Recycl. 2021, 170, 105618. [Google Scholar] [CrossRef]
- Cameron, K.C.; Di, H.J.; Moir, J.L. Nitrogen losses from the soil/plant system: A review. Ann. Appl. Biol. 2013, 162, 145–173. [Google Scholar] [CrossRef]
- Garcia, C.; Hernandez, T.; Coll, M.D.; Ondoño, S. Organic amendments for soil restoration in arid and semiarid areas: A review. AIMS Environ. Sci. 2017, 4, 640–676. [Google Scholar] [CrossRef]
- Schröder, P.; Beckers, B.; Daniels, S.; Gnädinger, F.; Maestri, E.; Marmiroli, N.; Mench, M.; Millan, R.; Obermeier, M.M.; Oustriere, N.; et al. Intensify production, transform biomass to energy and novel goods and protect soils in Europe—A vision how to mobilize marginal lands. Sci. Total Environ. 2018, 616, 1101–1123. [Google Scholar] [CrossRef] [PubMed]
- Altobelli, F.; Vargas, R.; Corti, G.; Dazzi, C.; Montanarella, L.; Monteleone, A.; Caon, L.; Piazza, M.G.; Calzolari, C.; Munafò, M.; et al. Improving soil and water conservation and ecosystem services by sustainable soil management practices: From a global to an Italian soil partnership. Ital. J. Agron. 2020, 15, 293–298. [Google Scholar] [CrossRef]
- Gross, A.; Glaser, B. Meta analysis on how manure application changes soil organic carbon storage. Sci. Rep. 2021, 11, 5516. [Google Scholar] [CrossRef] [PubMed]
- Gattullo, C.E.; Mininni, C.; Parente, A.; Montesano, F.F.; Allegretta, I.; Terzano, R. Effect of compost-based growing media on the yield and heavy metal content of four lettuce cultivars. Environ. Sci. Pol. Res. 2017, 24, 25406–25415. [Google Scholar] [CrossRef]
- Dhar, H.; Kumar, S.; Kumar, R. A review on organic waste to energy systems in India. Bioresour. Technol. 2017, 245, 1229–1237. [Google Scholar] [CrossRef]
- Yu, K.; Li, S.; Sun, X.; Cai, L.; Zhang, P.; Kang, Y.; Yu, Z.; Tong, J.; Wang, L. Application of seasonal freeze-thaw to pretreat raw material for accelerating green waste composting. J. Environ. Manag. 2019, 239, 96–102. [Google Scholar] [CrossRef]
- Yu, H.; Zou, W.; Chen, J.; Chen, H.; Yu, Z.; Huang, J.; Tang, H.; Xiangying Wei, X.; Gao, B. Biochar amendment improves crop production in problem soils: A review. J. Environ. Manag. 2019, 232, 8–21. [Google Scholar] [CrossRef] [PubMed]
- Sanchez-Monedero, M.A.; Cayuela, M.L.; Roig, A.; Jindo, K.; Mondini, C.; Bolan, N. Role of biochar as an additive in organic waste composting. Bioresour. Technol. 2018, 247, 1155–1164. [Google Scholar] [CrossRef] [PubMed]
- Lehmann, J.; Gaunt, J.; Rondon, M. Bio-char sequestration in terrestrial ecosystems—A review. Mitig. Adapt. Strateg. Glob. Chang. 2006, 11, 395–419. [Google Scholar] [CrossRef]
- Schmidt, M.W.; Torn, M.S.; Abiven, S.; Dittmar, T.; Guggenberger, G.; Janssens, I.A.; Kleber, M.; Kogel-Knabner, I.; Lehmann, J.; Manning, D.A.C.; et al. Persistence of soil organic matter as an ecosystem property. Nature 2011, 478, 49–56. [Google Scholar] [CrossRef] [PubMed]
- Ahmad, M.; Rajapaksha, A.U.; Lim, J.E.; Zhang, M.; Bolan, N.; Mohan, D.; Vithanage, M.; Lee, S.S.; Ok, Y.S. Biochar as a sorbent for contaminant management in soil and water: A review. Chemosphere 2014, 99, 19–33. [Google Scholar] [CrossRef] [PubMed]
- Zhang, M.; Ok, Y.S. Biochar soil amendment for sustainable agriculture with carbon and contaminant sequestration. Carbon Manag. 2014, 5, 255–257. [Google Scholar] [CrossRef]
- Woolf, D.; Amonette, J.E.; Street-Perrott, F.A.; Lehmann, J.; Joseph, S. Sustainable biochar to mitigate global climate change. Nat. Commun. 2010, 1, 56. [Google Scholar] [CrossRef] [PubMed]
- Gurwick, N.P.; Moore, L.A.; Kelly, C.; Elias, P. A systematic review of biochar research, with a focus on its stability in situ and its promise as a climate mitigation strategy. PLoS ONE 2013, 8, e75932. [Google Scholar] [CrossRef] [PubMed]
- Jeffery, S.; Verheijen, F.G.A.; Van Der Velde, M.; Bastos, A.C. A quantitative review of the effects of biochar application to soils on crop productivity using meta-analysis. Agric. Ecosyst. Environ. 2011, 144, 175–187. [Google Scholar] [CrossRef]
- Biederman, L.A.; Harpole, W.S. Biochar and its effects on plant productivity and nutrient cycling: A meta-analysis. Glob. Chang. Biol. Bioenergy 2013, 5, 202–214. [Google Scholar] [CrossRef]
- Wang, J.; Xiong, Z.; Kuzyakov, Y. Biochar stability in soil: Meta-analysis of decomposition and priming effects. Glob. Chang. Biol. Bioenergy 2016, 8, 512–523. [Google Scholar] [CrossRef]
- Hilscher, A.; Heister, K.; Siewert, C.; Knicker, H. Mineralisation and structural changes during the initial phase of microbial degradation of pyrogenic plant residues in soil. Org. Geochem. 2009, 40, 332–342. [Google Scholar] [CrossRef]
- Singh, B.P.; Cowie, A.L. Long-term influence of biochar on native organic carbon mineralisation in a low-carbon clayey soil. Sci. Rep. 2014, 4, 3687. [Google Scholar] [CrossRef] [PubMed]
- Singh, N.; Abiven, S.; Torn, M.S.; Schmidt, M.W.I. Fire-derived organic carbon in soil turns over on a centennial scale. Biogeosciences 2012, 9, 2847–2857. [Google Scholar] [CrossRef]
- Crombie, K.; Masek, O.; Sohi, S.P.; Brownsort, P.; Cross, A. The effect of pyrolysis conditions on biochar stability as determined by three methods. Glob. Chang. Biol. Bioenergy 2013, 5, 122–131. [Google Scholar] [CrossRef]
- Tejada, M.; Gonzalez, J.L. Application of different organic wastes on soil properties and wheat yield. Agron. J. 2007, 99, 1597–1606. [Google Scholar] [CrossRef]
- Leogrande, R.; Vitti, C.; Stellacci, A.M.; Cocozza, C.; Ventrella, D. Response of wheat crop during transition to organic system under Mediterranean conditions. Int. J. Plant Prod. 2016, 10, 565–578. [Google Scholar]
- de Lima, W.B.; Cavalcante, A.R.; Bonifácio, B.F.; da Silva, A.A.R.; de Oliveira, L.D.; de Souza, R.F.A.; Chaves, L.H.G. Growth and development of bell peppers submitted to fertilization with biochar and nitrogen. Agric. Sci. 2019, 10, 753–762. [Google Scholar] [CrossRef]
- Gilbert, J.; Ricci-Jürgensen, M.; Ramola, A. Benefits of Compost and Anaerobic Digestate When Applied to Soil. Report ISWA. 2020. Available online: https://www.altereko.it/wp-content/uploads/2020/03/Report-2-Benefits-of-Compost-and-Anaerobic-Digestate.pdf (accessed on 1 September 2023).
- Mohawesh, O.; Albalasmeh, A.; Gharaibeh, M.; Deb, S.; Simpson, C.; Singh, S.; Al Soub, B.; Hanandeh, A.E. Potential Use of Biochar as an Amendment to Improve Soil Fertility and Tomato and Bell Pepper Growth Performance under Arid Conditions. J. Soil Sci. Plant Nutr. 2021, 21, 2946–2956. [Google Scholar] [CrossRef]
- González-Pernas, F.M.; Grajera-Antolín, C.; García-Cámara, O.; González, M. Effects of Biochar on Biointensive Horticultural Crops and Its Economic Viability in the Mediterranean Climate. Energies 2022, 15, 3407. [Google Scholar] [CrossRef]
- Zeng, G.; Wu, H.; Liang, J.; Guo, S.; Huang, L.; Xu, P.; Liu, Y.; Yuan, Y.; He, X.; He, Y. Efficiency of biochar and compost (or composting) combined amendments for reducing Cd, Cu, Zn and Pb bioavailability, mobility and ecological risk in wetland soil. RSC Adv. 2015, 5, 34541. [Google Scholar] [CrossRef]
- van Kessel, J.S.; Reeves, J.B. Nitrogen mineralization potential of dairy manures and its relationship to composition. Biol. Fertil. Soils 2002, 36, 118–123. [Google Scholar] [CrossRef]
- Eghball, B.; Ginting, D.; Gilley, J.E. Residual Effects of Manure and Compost Applications on Corn Production and Soil Properties. Agron. J. 2004, 96, 442–447. [Google Scholar] [CrossRef]
- Ginting, D.; Kessavalou, A.; Eghball, B.; Doran, J.W. Greenhouse gas emissions and soil indicators four years after manure and compost applications. J. Environ. Qual. 2003, 32, 23–32. [Google Scholar] [CrossRef] [PubMed]
- Reeve, J.R.; Endelman, J.B.; Miller, B.E.; Hole, D.J. Residual Effects of Compost on Soil Quality and Dryland Wheat Yield Sixteen Years after Compost Application. Soil Sci. Soc. Am. J. 2012, 76, 278–285. [Google Scholar] [CrossRef]
- Adekiya, A.O.; Agbede, T.M.; Aboyeji, C.M.; Dunsin, O.; Simeon, V.T. Biochar and poultry manure effects on soil properties and radish (Raphanus sativus L.) yield. Biol. Agric. Hortic. 2019, 35, 33–45. [Google Scholar] [CrossRef]
- Trupiano, D.; Cocozza, C.; Baronti, S.; Amendola, C.; Vaccari, F.P.; Lustrato, G.; Di Lonardo, S.; Fantasma, F.; Tognetti, R.; Scippa, G.S. The Effects of Biochar and Its Combination with Compost on Lettuce (Lactuca sativa L.) Growth, Soil Properties, and Soil Microbial Activity and Abundance. Int. J. Agron. 2017, 2017, 3158207. [Google Scholar] [CrossRef]
- Castellini, M.; Ventrella, D. Impact of conventional and minimum tillage on soil hydraulic conductivity in typical cropping system in Southern Italy. Soil Tillage Res. 2012, 124, 47–56. [Google Scholar] [CrossRef]
- Vitti, C.; Stellacci, A.M.; Leogrande, R.; Mastrangelo, M.; Cazzato, E.; Ventrella, D. Assessment of organic carbon in soils: A comparison between the Springer–Klee wet digestion and the dry combustion methods in Mediterranean soils (Southern Italy). Catena 2016, 137, 113–119. [Google Scholar] [CrossRef]
- Haynes, R.J. Labile organic matter as an indicator of organic matter quality in arable and pastoral soils in New Zealand. Soil Biol. Biochem. 2000, 32, 211–219. [Google Scholar] [CrossRef]
- Rees, R.M.; Parker, J.P. Filtration increases the correlation between water extractable organic carbon and soil microbial activity. Soil Biol. Biochem. 2005, 37, 2240–2248. [Google Scholar] [CrossRef]
- Ferrara, R.M.; Mazza, G.; Muschitiello, C.; Castellini, M.; Stellacci, A.M.; Navarro, A.; Lagomarsino, A.; Vitti, C.; Rossi, R.; Rana, G. Short-term effects of conversion to no-tillage on respiration and chemical-physical properties of the soil: A case study in a wheat cropping system in semi-dry environment. Ital. J. Agrometeorol. 2017, 1, 47–58. [Google Scholar]
- Anderson, J.P.E.; Page, A.L.; Miller, R.H.; Keeney, D.R. Soil Respiration. In Methods of Soil Analysis, Part 2, 2nd ed.; Page, A.L., Ed.; ASA: Madison, WI, USA; SSSA: Madison, WI, USA, 1982; pp. 831–871. [Google Scholar]
- Clark, G.J.; Dodgshun, N.; Sale, P.W.G.; Tang, C. Changes in chemical and biological properties of a sodic clay subsoil with addition of organic amendments. Soil Biol. Biochem. 2007, 39, 2806–2817. [Google Scholar] [CrossRef]
- Castellini, M.; Stellacci, A.M.; Barca, E.; Iovino, M. Application of multivariate analysis techniques for selecting soil physical quality indicators: A case study in long-term field experiments in Apulia (southern Italy). Soil Sci. Soc. Am. J. 2019, 83, 707–720. [Google Scholar] [CrossRef]
- Popolizio, S.; Barca, E.; Castellini, M.; Montesano, F.F.; Stellacci, A.M. Investigating the Spatial Structure of Soil Hydraulic Properties in a Long-Term Field Experiment Using the BEST Methodology. Agronomy 2022, 12, 2873. [Google Scholar] [CrossRef]
- SAS/STAT Software Release; Version 9.2; Statistical Analysis System (SAS) Institute Inc.: Cary, NC, USA, 2010.
- JMP® Pro; Version 15.0.0; Statistical Analysis System (SAS) Institute Inc.: Cary, NC, USA, 2019.
- Chan, K.Y.; Van Zwieten, L.; Meszaros, I.; Downie, A.; Joseph, S. Agronomic values of greenwaste biochar as a soil amendment. Aust. J. Soil Res. 2007, 45, 629–634. [Google Scholar] [CrossRef]
- Angelova, V.R.; Akova, V.I.; Artinova, N.S.; Ivanov, K.I. The Effect of Organic Amendments on Soil Chemical Characteristics. Bulg. J. Agric. Sci. 2013, 19, 958–971. [Google Scholar]
- Mekki, A.; Mdhaffar, M.; Sayadi, S. Advance in Mediterranean soil properties following compost amendment. Int. J. Agric. Policy Res. 2014, 2, 373–379. [Google Scholar]
- Ali Sial, T.; Lan, Z.; Wang, L.; Zhao, Y.; Zhang, J.; Kumbhar, F.; Memon, M.; Siddique Lashari, M.; Naqi Shah, A. Effects of Different Biochars on Wheat Growth Parameters, Yield and Soil Fertility Status in a Silty Clay Loam Soil. Molecules 2019, 24, 1798. [Google Scholar] [CrossRef]
- Leogrande, R.; Vitti, C.; Vonella, A.V.; Ventrella, D. Crop and Soil Response to Organic Management under Mediterranean Conditions. Int. J. Plant Prod. 2020, 14, 209–220. [Google Scholar] [CrossRef]
- Safferi, N.; Hajabbasi, M.A.; Shirani, H.; Mosaddeghi, M.R.; Mamedov, A.I. Biochar type and pyrolysis temperature effects on soil quality indicators and structural stability. J. Environ. Manag. 2020, 261, 110190. [Google Scholar] [CrossRef] [PubMed]
- Joseph, S.; Cowie, A.L.; Van Zwieten, L.; Bolan, N.; Budai, A.; Buss, W.; Luz Cayuela, M.; Graber, E.R.; Ippolito, J.A.; Kuzyakov, Y.; et al. How biochar works, and when it doesn’t: A review of mechanisms controlling soil and plant responses to biochar. Glob. Chang. Biol. Bioenergy 2021, 13, 1731–1764. [Google Scholar] [CrossRef]
- Singh, H.; Northup, B.K.; Rice, C.W.; Vara Prasad, P.V. Biochar applications influence soil physical and chemical properties, microbial diversity, and crop productivity: A meta-analysis. Biochar 2022, 4, 8. [Google Scholar] [CrossRef]
- Beesley, L.; Inneh, O.S.; Norton, G.J.; Moreno-Jimenez, E.; Pardo, T.; Clemente, R.; Dawson, J.J.C. Assessing the influence of compost and biochar amendments on the mobility and toxicity of metals and arsenic in a naturally contaminated mine soil. Environ. Pollut. 2014, 186, 195–202. [Google Scholar] [CrossRef] [PubMed]
- Mulvaney, R.L.; Khan, S.A.; Ellsworth, T.R. Synthetic nitrogen fertilizers deplete soil nitrogen: A global dilemma for sustainable cereal production. J. Environ. Qual. 2009, 38, 2295–2314. [Google Scholar] [CrossRef]
- Prost, K.; Borchard, N.; Siemens, J.; Kautz, T.; Séquaris, J.M.; Möller, A.; Amelung, W. Biochar affected by composting with farmyard manure. J. Environ. Qual. 2013, 42, 164–172. [Google Scholar] [CrossRef] [PubMed]
- Petraityte, D.; Ceseviciene, J.; Arlauskiene, A.; Slepetiene, A.; Skersiene, A.; Gecaite, V. Variation of soil nitrogen, organic carbon, and waxy wheat yield using liquid organic and mineral fertilizers. Agriculture 2022, 12, 2016. [Google Scholar] [CrossRef]
- Singh, P.; Benbi, D.K. Nutrient management effects on organic carbon pools in a sandy loam soil under rice-wheat cropping. Arch. Agron. Soil Sci. 2018, 64, 1879–1891. [Google Scholar] [CrossRef]
- Florio, A.; Felici, B.; Migliore, M.; Dell’Abate, M.T.; Benedetti, A. Nitrogen losses, uptake and abundance of ammonia oxidizers in soil under mineral and organo-mineral fertilization regimes. J. Sci. Food Agric. 2016, 96, 2440–2450. [Google Scholar] [CrossRef]
- Gunapala, N.; Scow, K.M. Dynamics of soil microbial biomass and activity in conventional and organic farming systems. Soil Biol. Biochem. 1998, 30, 805–816. [Google Scholar] [CrossRef]
- Kramer, A.W.; Doane, T.A.; Horwath, W.R.; van Kessel, C. Combining fertilizer and organic inputs to synchronize N supply in alternative cropping systems in California. Agric. Ecosyst. Environ. 2002, 34, 43–50. [Google Scholar] [CrossRef]
- Recous, S.; Mary, B.; Faurie, G. Microbial immobilization of ammonium and nitrate in cultivated soils. Soil Biol. Biochem. 1990, 22, 913–922. [Google Scholar] [CrossRef]
- Cucci, G.; Lacolla, G.; Caranfa, G. Use of composted olive waste as soil conditioner and its effects on the soil. Int. J. Agric. Res. 2013, 8, 149–157. [Google Scholar] [CrossRef]
- Liu, X.; Zheng, J.; Zhang, D.; Cheng, K.; Zhou, H.; Zhang, A.; Li, L.; Joseph, S.; Smith, P.; Crowley, D.; et al. Biochar has no effect on soil respiration across Chinese agricultural soils. Sci. Total Environ. 2016, 14, 554–555. [Google Scholar] [CrossRef]
- Han, Z.; Xu, P.; Li, Z.; Guo, S.; Li, S.; Liu, S.; Wu, S.; Wang, J.; Zou, J. Divergent effects of biochar amendment and replacing mineral fertilizer with manure on soil respiration in a subtropical tea plantation. Biochar 2023, 5, 73. [Google Scholar] [CrossRef]
- Ameloot, N.; Graber, E.R.; Verheijen, F.G.A.; De Neve, S. Interactions between biochar stability and soil organisms: Review and research needs. Eur. J. Soil Biol. 2013, 64, 379–390. [Google Scholar] [CrossRef]
- Usman, A.R.A.; Almaroai, Y.A.; Ahmad, M.; Vithanage, M.; Ok, Y.S. Toxicity of synthetic chelators and metal availability in poultry manure amended Cd, Pb and as contaminated agricultural soil. J. Hazard. Mater. 2013, 262, 1022–1030. [Google Scholar] [CrossRef] [PubMed]
- Doran, J.W.; Parkin, T.B. Quantitative indicators of soil quality: A minimum data set. In Methods for Assessing Soil Quality; Doran, J.W., Jones, A.J., Eds.; Soil Science Society of America, Inc.: Madison, WI, USA, 1996; Volume 49, pp. 25–37. [Google Scholar]
- Rivier, P.A.; Jamniczky, D.; Nemes, A.; Makó, A.; Barna, G.; Uzinger, N.; Rékási, M.; Farkas, C. Short-term effects of compost amendments to soil on soil structure, hydraulic properties, and water regime. J. Hydrol. Hydromech. 2022, 70, 74–88. [Google Scholar] [CrossRef]
- Castellini, M.; Giglio, L.; Niedda, M.; Palumbo, A.D.; Ventrella, D. Impact of biochar addition on the physical and hydraulic properties of a clay soil. Soil Tillage Res. 2015, 154, 1–13. [Google Scholar] [CrossRef]
- Hua, K.; Wang, D.; Guo, X.; Guo, Z. Carbon sequestration efficiency of organic amendments in a long-term experiment on a vertisol in Huang-Huai-Hai Plain, China. PLoS ONE 2014, 9, e108594. [Google Scholar] [CrossRef]
- Guo, M.; He, Z.; Uchimiya, S.M. Agricultural and Environmental Applications of Biochar; Advances and Barriers, SSSA Special Publication; Soil Science Society of America, Inc.: Madison, WI, USA, 2016; pp. 175–198. [Google Scholar]
- Cercioglu, M. The Role of Organic Soil Amendments on Soil Physical Properties and Yield of Maize (Zea mays L.). Commun. Soil Sci. Plant Anal. 2017, 48, 683–691. [Google Scholar] [CrossRef]
- Chang, Y.; Rossi, L.; Zotarelli, L.; Gao, B.; Adnan Shahid, M.; Sarkhosh, A. Biochar improves soil physical characteristics and strengthens root architecture in Muscadine grape (Vitis rotundifolia L.). Chem. Biol. Technol. Agric. 2021, 8, 7. [Google Scholar] [CrossRef]
- Egri, D.; Pârvulescu, O.C.; Ion, V.A.; Raducanu, C.E.; Calcan, S.I.; Badulescu, L.; Madjar, R.; Orbeci, C.; Dobre, T.; Mot, A.; et al. Vine Pruning-Derived Biochar for Agronomic Benefits. Agronomy 2022, 12, 2730. [Google Scholar] [CrossRef]
- Zhang, X.; Wang, K.; Sun, C.; Yang, K.; Zheng, J. Differences in soil physical properties caused by applying three organic amendments to loamy clay soil under field conditions. J. Soils Sediments 2022, 22, 43–55. [Google Scholar] [CrossRef]
- Kranz, C.N.; McLaughlin, R.A.; Johnson, A.; Miller, G.; Heitman, J.L. The effects of compost incorporation on soil physical properties in urban soils—A concise review. J. Environ. Manag. 2020, 261, 110209. [Google Scholar] [CrossRef] [PubMed]
- Amoakwah, E.; Frimpong, K.A.; Okae-Anti, D.; Arthur, E. Soil water retention, air fow and pore structure characteristics after corn cob biochar application to a tropical sandy loam. Geoderma 2017, 307, 189–197. [Google Scholar] [CrossRef]
- Alghamdi, A.G. Biochar as a potential soil additive for improving soil physical properties—A review. Arab. J. Geosci. 2018, 11, 766. [Google Scholar] [CrossRef]
- Bauer, A.; Black, A.L. Organic Carbon Effects on Available Water Capacity of Three Soil Textural Groups. Soil Sci. Soc. Am. J. 1992, 56, 248–254. [Google Scholar] [CrossRef]
- Zhou, H.; Chen, C.; Wang, D.Z.; Arthur, E.; Zhang, Z.B.; Guo, Z.C.; Peng, X.H.; Mooney, S.J. Effect of long-term organicamendments on the full-range soil water retention characteristics of a Vertisol. Soil Tillage Res. 2020, 202, 104663. [Google Scholar] [CrossRef]
- Ibrahim, M.; Anwar-Ul-Hassan; Iqbal, M.; Valeem, E.E. Response of wheat growth and yield to various levels of compost and organic manure. Pak. J. Bot. 2008, 40, 2135–2141. [Google Scholar]
- Mohamed, M.F.; Thalooth, A.T.; Elewa, T.A.; Ahmed, A.G. Yield and nutrient status of wheat plants (Triticum aestivum) as affected by sludge, compost, and biofertilizers under newly reclaimed soil. Bull. Natl. Res. Cent. 2019, 43, 3. [Google Scholar] [CrossRef]
- Alburquerque, J.A.; Salazar, P.; Barrón, V.; Torrent, J.; del Campillo, M.C.; Gallardo, A.; Villar, R. Enhanced wheat yield by biochar addition under different mineral fertilization levels. Agron. Sustain. Dev. 2013, 33, 475–484. [Google Scholar] [CrossRef]
- Van Zwieten, L.; Kimber, S.; Morris, S.; Chan, K.Y.; Downie, A.; Rust, J.; Joseph, S.; Cowie, A. Effects of biochar from slow pyrolysis of papermill waste on agronomic performance and soil fertility. Plant Soil 2010, 327, 235–246. [Google Scholar] [CrossRef]
- Lehmann, J.; da Silva, J.P.; Steiner, C.; Nehls, T.; Zech, W.; Glaser, B. Nutrient availability and leaching in an archaeological Anthrosol and a Ferralsol of the Central Amazon basin: Fertilizer, manure and charcoal amendments. Plant Soil 2003, 249, 343–357. [Google Scholar] [CrossRef]
- Asai, H.; Samson, B.K.; Stephan, H.M.; Songyikhangsuthor, K.; Homma, K.; Kiyono, Y.; Inoue, Y.; Shiraiwa, T.; Horie, T. Biochar amendment techniques for upland rice production in Northern Laos: 1. Soil physical properties, leaf SPAD and grain yield. Field Crops Res. 2009, 111, 81–84. [Google Scholar] [CrossRef]
- Schulz, H.; Glaser, B. Effects of biochar compared to organic and inorganic fertilizers on soil quality and plant growth in a greenhouse experiment. J. Plant Nutr. Soil Sci. 2012, 175, 410–422. [Google Scholar] [CrossRef]
Disclaimer/Publisher’s Note: The statements, opinions and data contained in all publications are solely those of the individual author(s) and contributor(s) and not of MDPI and/or the editor(s). MDPI and/or the editor(s) disclaim responsibility for any injury to people or property resulting from any ideas, methods, instructions or products referred to in the content. |
© 2024 by the authors. Licensee MDPI, Basel, Switzerland. This article is an open access article distributed under the terms and conditions of the Creative Commons Attribution (CC BY) license (https://creativecommons.org/licenses/by/4.0/).