Abstract
The application of nitrogen (N) improves the winter wheat yield. Excessive N application affects winter wheat yields, leading to low net incomes and negative environmental impacts, therefore, optimizing N application is essential. In this study, the effects of N rates on crop growth yield, net income (NI), water use efficiency (WUE), and nitrogen use efficiency (NUE) in the irrigated districts of the eastern loess plateau, China, were investigated using seven N application rates (N0, N90, N180, N210, N240, N270, and N300 kg ha−1) during the 2016–2017 and 2017–2018 seasons. N application significantly increased the total water consumption at 0–200 cm during the growth period, the aboveground dry matter at maturity, the grain nitrogen accumulation, yield, NI, and WUE. However, N exceeding 240 kg ha−1 did not favor dry matter and nitrogen accumulation or translocation from the anthesis stage to the maturity stage, thus leading to reduced yield, NI, and WUE. The transpiration rate and stomatal conductance N240 was highest 21–28 day after anthesis, at 187–276 kg ha−1, which can achieve a high yield and profitability with relatively low environmental costs.
1. Introduction
Wheat (Triticum aestivum L.) is a major food crop in China, and its cultivation area accounts for approximately 20% of the national arable land in China, which has an important impact on grain production and national economic development [1]. China has the highest fertilizer consumption worldwide, and its fertilizer application accounts for 30.7% of global fertilizer applications [2,3]. N fertilizer application is a serious problem in pursuing high winter wheat yields [4,5]. Excessive nitrogen application does not consistently increase the winter wheat yield and leads to a series of problems, such as increased inputs, reduced water and fertilizer use efficiency, and environmental pollution [6]. Therefore, optimizing nitrogen application is important for sustainable production.
Nitrogen is an essential nutrient for crop growth, and is the main factor controlling the rate of dry matter accumulation [7]. Nitrogen fertilizer application promotes the growth of all organs, tillers, and nutrient accumulation, thus increasing yields [8,9]. For winter wheat, population tillers are an important agronomic trait, determining the number of spikes per unit area and affecting the grain yield [10,11]. In addition, the accumulation of dry matter after anthesis and the translocation of dry matter to the grain before anthesis is vital. Several studies have shown that dry matter accumulation after anthesis accounts for 50–80% of the grain dry matter production [12].
Similarly, increased nitrogen fertilization can promote root growth and aboveground dry matter accumulation in winter wheat, which increases soil water consumption [13]. The aboveground dry matter increased by 60%, and the total water consumption during the growth period increased by 36%. Soil water status and nitrogen fertilizer significantly affect the accumulation, translocation, and distribution of nitrogen in plants [14]. The increased application of nitrogen fertilizer can increase the soil nitrogen content, provide sufficient nutrients for aboveground plants, promote nitrogen absorption, and increase the yield [15]. Nitrogen fertilizer application promoted nitrogen absorption and translocation and ensured fitness, thus significantly improving the yield and water use efficiency. Adequate soil water conditions can significantly increase nitrogen accumulation in plants at different growth stages and grain nitrogen accumulation in winter wheat, thus increasing the yield [16]. This study revealed that insufficient soil moisture during the anthesis stage significantly reduced the amount of nitrogen transfer from the nutrient organs to the grains in the middle and late periods of filling, and reduced nitrogen accumulation in the grains at the maturity stage, thus resulting in a decrease in the yield, nitrogen fertilizer use efficiency, and water use efficiency [15,16].
Previous studies on the water consumption and nutrient transport of winter wheat were mostly conducted for the whole growth period, but lacked the point of view of the growth stages. Therefore, we set seven nitrogen application rate gradients. The objectives of this study were (1) to investigate the effects of different nitrogen application rates on group dynamics, the yield, water, and the clear internal relation among each index, and (2) to determine the most suitable nitrogen application range that produced a high yield and high use efficiency in the irrigated district of southern Shanxi Province, based on the net income and environmental benefits.
2. Materials and Methods
2.1. Experimental Site
The field experiment was conducted at the experimental wheat base of Shanxi Agricultural University (35°20′ N, 111°17′ E) from 2016 to 2018 in Wenxi County, Shanxi Province, China. The basic soil fertility of the 0–20 cm soil layer before sowing in the two experimental years is shown in Table 1.

Table 1.
Soil basal fertility of 0–20 cm at the experimental site in Wenxi.
2.2. Experimental Design
The experiment adopted a single-factor completely random design. In this study, seven nitrogen application rates, 0 kg ha−1 (N0), 90 kg ha−1 (N90), 180 kg ha−1 (N180), 210 kg ha−1 (N210), 240 kg ha−1 (N240), 270 kg ha−1 (N270), and 300 kg ha−1 (N300), were adopted for the completely random design. The plots were 5 × 10 m2, and each treatment was replicated three times. The wheat cultivar “Liangxing-99” was used. Before sowing, the land tillage was rotated, and (P) P2O5 150 kg ha−1 and (K) K2O 90 kg ha−1 were applied. Nitrogen fertilizer was applied at a rate of 6:4 before sowing and at the jointing stage, and irrigation was 60 mm at the jointing stage. There were higher average daily, accumulated, and total accumulated temperatures in the long season, as seen in Table 2.
Table 2.
Weather data at the experimental site in Wenxi.
2.3. Soil Water Consumption
Before sowing the winter wheat, a 200 cm deep section was dug into the flat plot, and the ring knife method [17] was used to extract a 20 cm layer of soil from the top to the bottom in order to measure the soil bulk density. In the sowing, jointing, anthesis, and maturity stages of winter wheat, 200 cm deep soil column samples were drilled with a 20 cm layer of soil, making a total of 10 layers. Part of the soil was placed in an aluminum box and the wet weight was promptly weighed, recorded, and then placed into a constant temperature drying oven at 105 °C for more than 12 h until a constant weight was reached. The dry weight of the soil was measured, and the soil water content and soil water storage were calculated. SWSi, ETa, and WUE were calculated according to the method in [1,13,14].
2.4. Evapotranspiration
The calculation of the actual evapotranspiration (ETa) of winter wheat using the water balance method was as follows:
where P is the rainfall amount (mm), irrigation (I) is the irrigation amount (mm), U is the amount entering the 0–2 m soil layer through the capillaries, rainfall (R) is the surface runoff amount, dry weight (DW) is the amount infiltrating below the 2 m soil layer, and ΔS is the change in soil water storage. In both growing seasons, the measured values of U, R, DW, and ΔS were zero.
ETa = P + I + U − R − DW − ΔS
The water use efficiency was calculated as follows:
where Y is the seed yield.
WUE = Y/ETa
2.5. Plant Nitrogen
The jointing, anthesis, and maturity stages were cut, and the nitrogen content rate was measured using the H2SO4-H2O2-Indiophenol blue colorimetric method [1,15]. The nitrogen (N) accumulation in the plant was calculated using the nitrogen content rate and the dry matter. Other relevant calculations are as follows, according to the method in [18]:
Plant N accumulation (kg ha−1) = plant dry matter weight × N content rate
NTBA = N accumulation aboveground at the anthesis stage–N accumulation in vegetative organs at the maturity stage;
where NTBA is nitrogen translocation before anthesis (kg ha−1), NAG is nitrogen accumulation in grains (kg ha−1), NAAA is after anthesis (kg ha−1), NPFP is N partial factor productivity (kg ha−1), UTE is N uptake efficiency (%), and NUE is N use efficiency (kg kg−1).
Contribution rate of NTBA to grains (%) = NTBA/NAG × 100%;
NAAA = NAG at maturity stage − NTBA;
Contribution rate of NAAA to grains (%) = NAAA/NAG × 100%
NPFP = grain yield (kg ha−1)/N application rate (kg ha−1);
UTE = plant N accumulation (kg ha−1)/N application (kg ha−1) × 100%
NUE = grain yield (kg ha−1)/plant N accumulation (kg ha−1)
2.6. Grain Yield and Composition
At the maturity stage, the wheat field with uniform growth was selected to investigate the spike number at 0.667 m2, and 20 plants were randomly selected to investigate the grain number per spike and the 1000-grain weight. Finally, the actual yield was measured by harvesting the sample at 5 m2.
2.7. Net Income
Net income (Yuan ha−1) = total revenue (Yuan ha−1)—inputs (Yuan ha−1). The market price of winter wheat during the experiment was 2.34 Yuan kg−1, and the production inputs are shown in Table 3.
Table 3.
Input of winter wheat production.
2.8. Relative Index Calculation
The ratio between the actual value X of each index and the maximum value Xmax of this index under a certain amount of nitrogen application was defined as the relative value X of this index, and the calculation was as follows:
X = X/Xmax × 100%
When calculating the optimal nitrogen application range, 95–100% of the relative value of each index in the fitting regression curve was defined as the higher level of this index by referring to those defined [19], and the corresponding N when the relative value of each index was 95% was obtained via solving the equation.
2.9. Statistical Analysis
The data were processed using Microsoft Excel 2007; the overview of the dominant patterns DPS 7.5 was used for statistical analysis; the LSD method was used for difference significance test; the significance level was set as p < 0.05; and Origin 2021 was used for plotting.
3. Results
3.1. Soil Water Consumption
Soil water consumption from the sowing to the jointing stage, and from the jointing to the anthesis stage increased with the increase in N, and the N300 was significantly higher than N0, N90, N180, and N210. Soil water consumption from the anthesis to the maturity stage increased first and then decreased, and N240 was significantly higher than that at N0 and N300 (Figure 1a,b). The total soil water consumption during the growth stages increased first, and then gradually changed with an increase in the nitrogen application rate (Figure 1c,d); the nitrogen rate at N300 was significantly higher than 0, 90, 180, and N210.
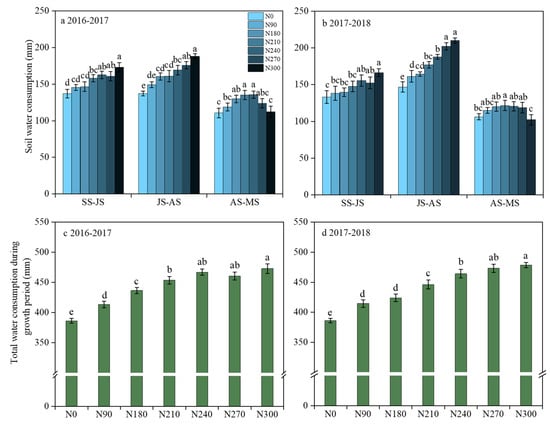
Figure 1.
Effects of different nitrogen rates on the soil water consumption and total water consumption during the growth period of winter wheat. SS-WS, sowing stage to wintering stage; WS-JS, wintering stage to jointing stage; JS-AS, jointing stage to anthesis stage; AS-MS, anthesis stage to maturity stage. Lower-case letters indicate comparisons between N rates; level bars represent the standard error.
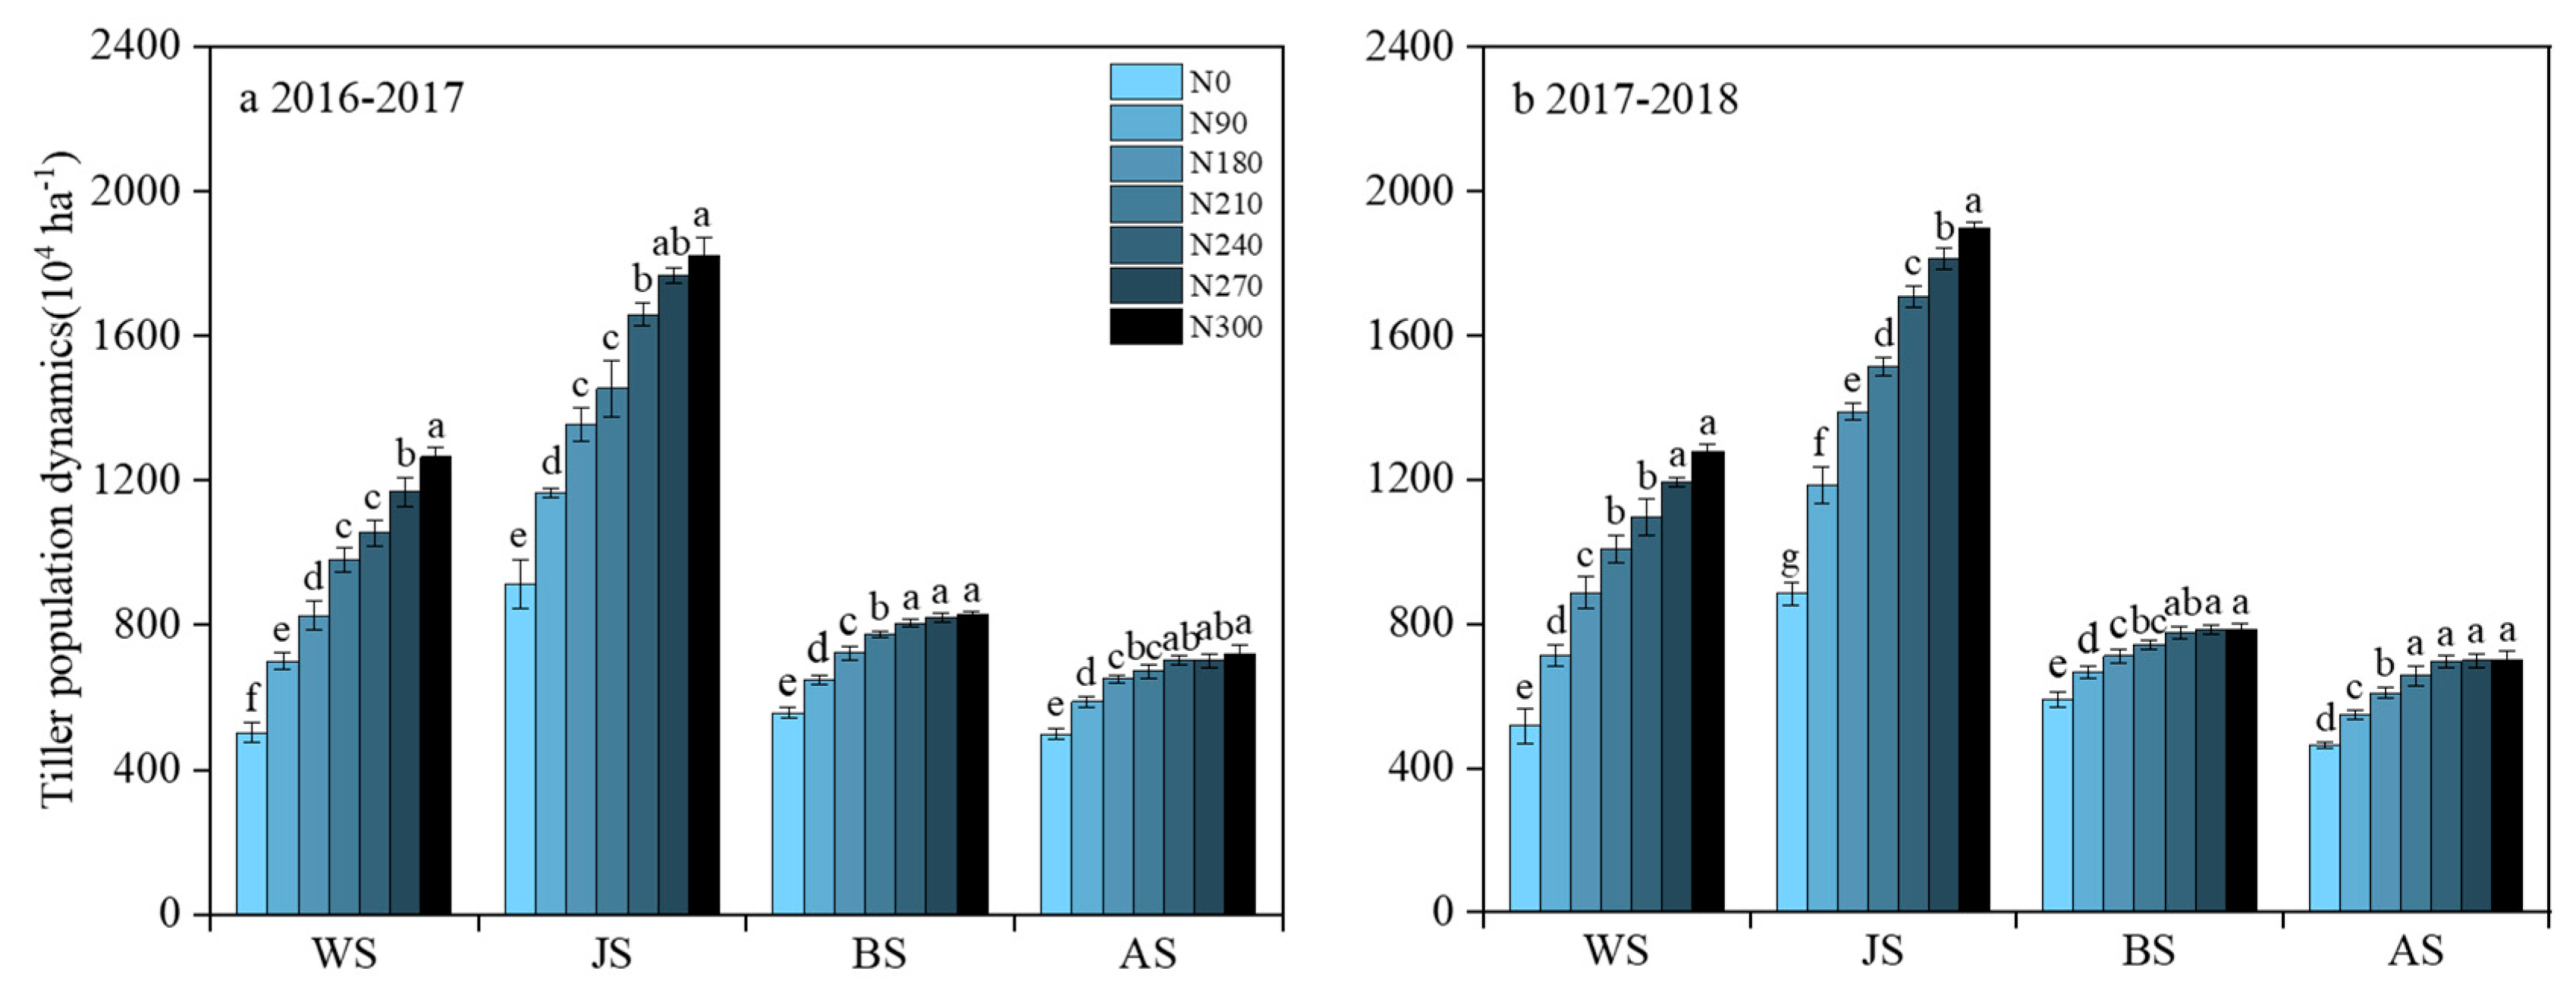
3.2. Tiller Population Dynamics
The tiller population dynamics of N300 were initially significantly higher than those of N0, N90, N180, N210, and N240 before the wintering stage and the jointing stage (Figure 2a). The tiller population dynamics of the wintering, jointing, boosting, and anthesis stages caused N300 to increase, and N300 was significantly higher than N0, N90, N180. The nitrogen application rate at N240 was significantly higher than N0, N90, N180, N210, and N240 before the wintering stage and the jointing stage (Figure 2b).

Figure 2.
Effects of tiller population dynamics. WS, wintering stage; JS, jointing stage; BS, boosting stage; AS, anthesis stage. Lower-case letters indicate comparisons between N rates; level bars represent the standard error.
3.3. Dry Matter Accumulation
Dry matter accumulation from the sowing to the jointing stage and from the jointing stage to the anthesis stage increased, with an increase in the nitrogen application rate. The nitrogen application rate at N300 was the highest, and was significantly different from other treatments from the sowing to the jointing stage, with significant differences between N0, N90, N180, and N210 from the jointing stage to the anthesis stage. The dry matter accumulation from the anthesis stage to the maturity stage increased first, and then decreased with an increase in the nitrogen rate, and the nitrogen application rate at N240 was significantly higher than at N0, N90, N180, N270, and N300 (Figure 3a,b). The dry matter accumulation at the maturity stage and the dry matter translocation before the anthesis stage increased first, and then gradually changed with an increase in the nitrogen rate. N300 was significantly higher than at N0, N90, N180, and N210 (Figure 3c,d; Table 4).
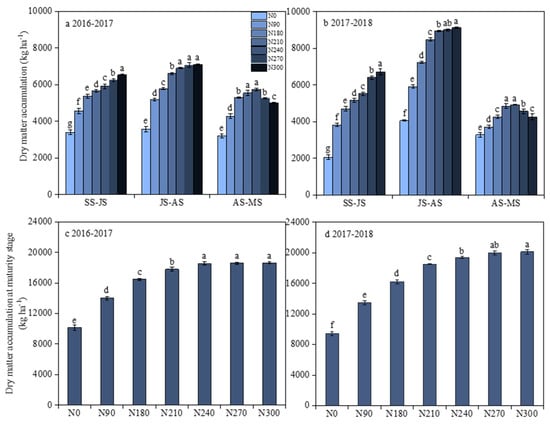
Figure 3.
Dry matter accumulation during different growth stages and the dry matter accumulation at the maturity stage. Lower-case letters indicate comparisons between N rates levels bars represent the standard error.
Table 4.
Dry matter translocation before anthesis and dry matter accumulation after anthesis.
3.4. Nitrogen Accumulation and Translocation
Nitrogen accumulation from sowing to jointing gradually increased with increasing N, which was significantly higher under N300 than under N0, N90, N180, N210, and N240 (Figure 4a,b). N accumulation from the jointing stage to the anthesis stage increased first, and then gradually changed with the increase in N, and the N at N270 and N300 was significantly highest in 2016–2017 and 2017–2018, respectively. However, there was no significant difference between the N240, N270, and N300 in both years. The N accumulation from the anthesis stage to the maturity stage increased first and then decreased, and the N300 was significantly improved by 5.6–69.5% compared to when using other treatments. The N accumulation at the maturity stage increased first and then decreased with an increase in N270 and N240, which were significantly the highest, and there was no significant differences found in N240 and N270 in 2016–2017 and 2017–2018, respectively (Figure 4c,d). Nitrogen translocation before the anthesis stage increased first and then decreased, and the N240 was significantly highest in 2016–2017 with increasing N. The N accumulation after the anthesis stage gradually increased, and the N300 was significantly highest in 2017–2018 with an increase in N (Table 5). The N accumulation in grains increased first and then decreased with an increase in N, and the N240 was significantly improved by 2.2–63.8% when compared to the other treatments.
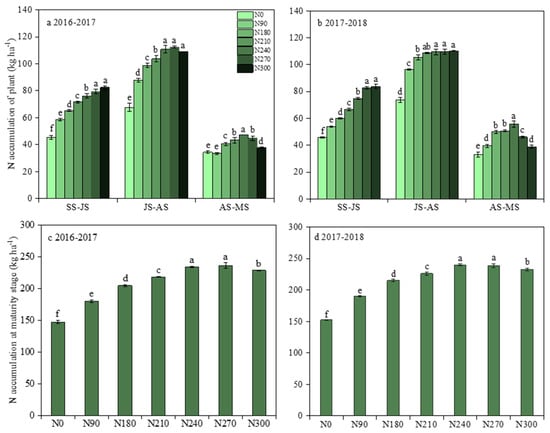
Figure 4.
N accumulation during the different growth stages, and the N accumulation at the maturity stage. Lower-case letters indicate comparisons between N rates; level bars represent the standard error.
Table 5.
Effects of different nitrogen rates on N accumulation after the anthesis stage, and the N accumulation grain of winter wheat.
3.5. Yield and Water Use Efficiency
The yield and water use efficiency first increased and then declined, the spike number and grain number per spike gradually increased, and 1000-grain weight gradually diminished with the increase in the nitrogen rate (Table 6). The spike number and grain number per spike were significantly higher under N300 than under N of N0, N90, and N180. The 1000-grain weight was significantly higher under no nitrogen application and significantly lower under N300. The yield was significantly improved by 2.8–93.1% under N240 in both years, which was significantly different from the other treatments in 2016–2017, and were significantly different from the nitrogen rates N0, N90, N180, and N300. WUE was significantly higher under N240 and N210 in 2016–2017 and 2017–2018, respectively, which were significantly different from the nitrogen application rates of N0, N90, and N180.
Table 6.
Effects of different nitrogen rates on yield and water use efficiency.
3.6. Nitrogen Partial Factor Productivity
The NPFP and NUE gradually decreased with an increase in the nitrogen application rate, which was significantly higher under N300 when compared to the other treatments (Table 7). NUE increased first and then decreased with the increase in the nitrogen rate, which was significantly higher under nitrogen application rates of N180 and N210, which were significantly highest in 2016–2017 and 2017–2018, respectively.
Table 7.
Effects of different nitrogen application rates on the N use efficiency of winter wheat.
3.7. Correlation Analysis among Soil Water Consumption, Nitrogen Accumulation, and Translocation Yield
There was a highly significant positive correlation between the soil water consumption from the sowing to the jointing stage and the dry matter accumulation from the sowing to the jointing stage and the jointing stage to the anthesis stage, as well as between the dry matter translocation occurring before the anthesis stage and the yield (Table 8). There was a highly significant positive correlation between the soil water consumption from the jointing stage to the anthesis stage and the dry matter accumulation from the jointing to the anthesis stage and dry matter translocation occurring before the anthesis stage. There was a significant positive correlation between the soil water consumption from the jointing stage to the anthesis stage and the yield. There was a significant positive correlation between the soil water consumption from the anthesis stage to the maturity stage and dry matter accumulation occurring after the anthesis stage. Finally, there was a highly significant positive correlation between the total water consumption and dry matter accumulation from the sowing to the jointing stage and the jointing stage to the anthesis stage and both the dry matter translocation occurring before and after the anthesis stage and the yield.
Table 8.
The correlation index between dry matter accumulation and translocation, yield, and soil water consumption.
3.8. Soil Water Consumption of Nitrogen Accumulation, and Yield
There was a highly significant positive correlation between both the nitrogen accumulation from the sowing to the jointing stage and the soil water consumption from the sowing to the jointing stage and the total water consumption (Table 9). There was a highly significant positive correlation between both the nitrogen accumulation from the jointing stage to the anthesis stage and the soil water consumption from the jointing stage to the anthesis stage and the total water consumption. There was a significant positive correlation between the nitrogen accumulation from the jointing stage to the anthesis stage and the soil water consumption from the sowing to the jointing stage. There was a significant positive correlation between both the nitrogen accumulation before the anthesis stage the soil water consumption from the sowing to jointing stage and from the jointing stage to the anthesis stage and the total water consumption. There was a highly significant positive correlation between the nitrogen accumulation after the anthesis stage and the soil water consumption from the anthesis to the maturity stage.
Table 9.
The correlation index between soil water consumption, nitrogen accumulation, and translocation.
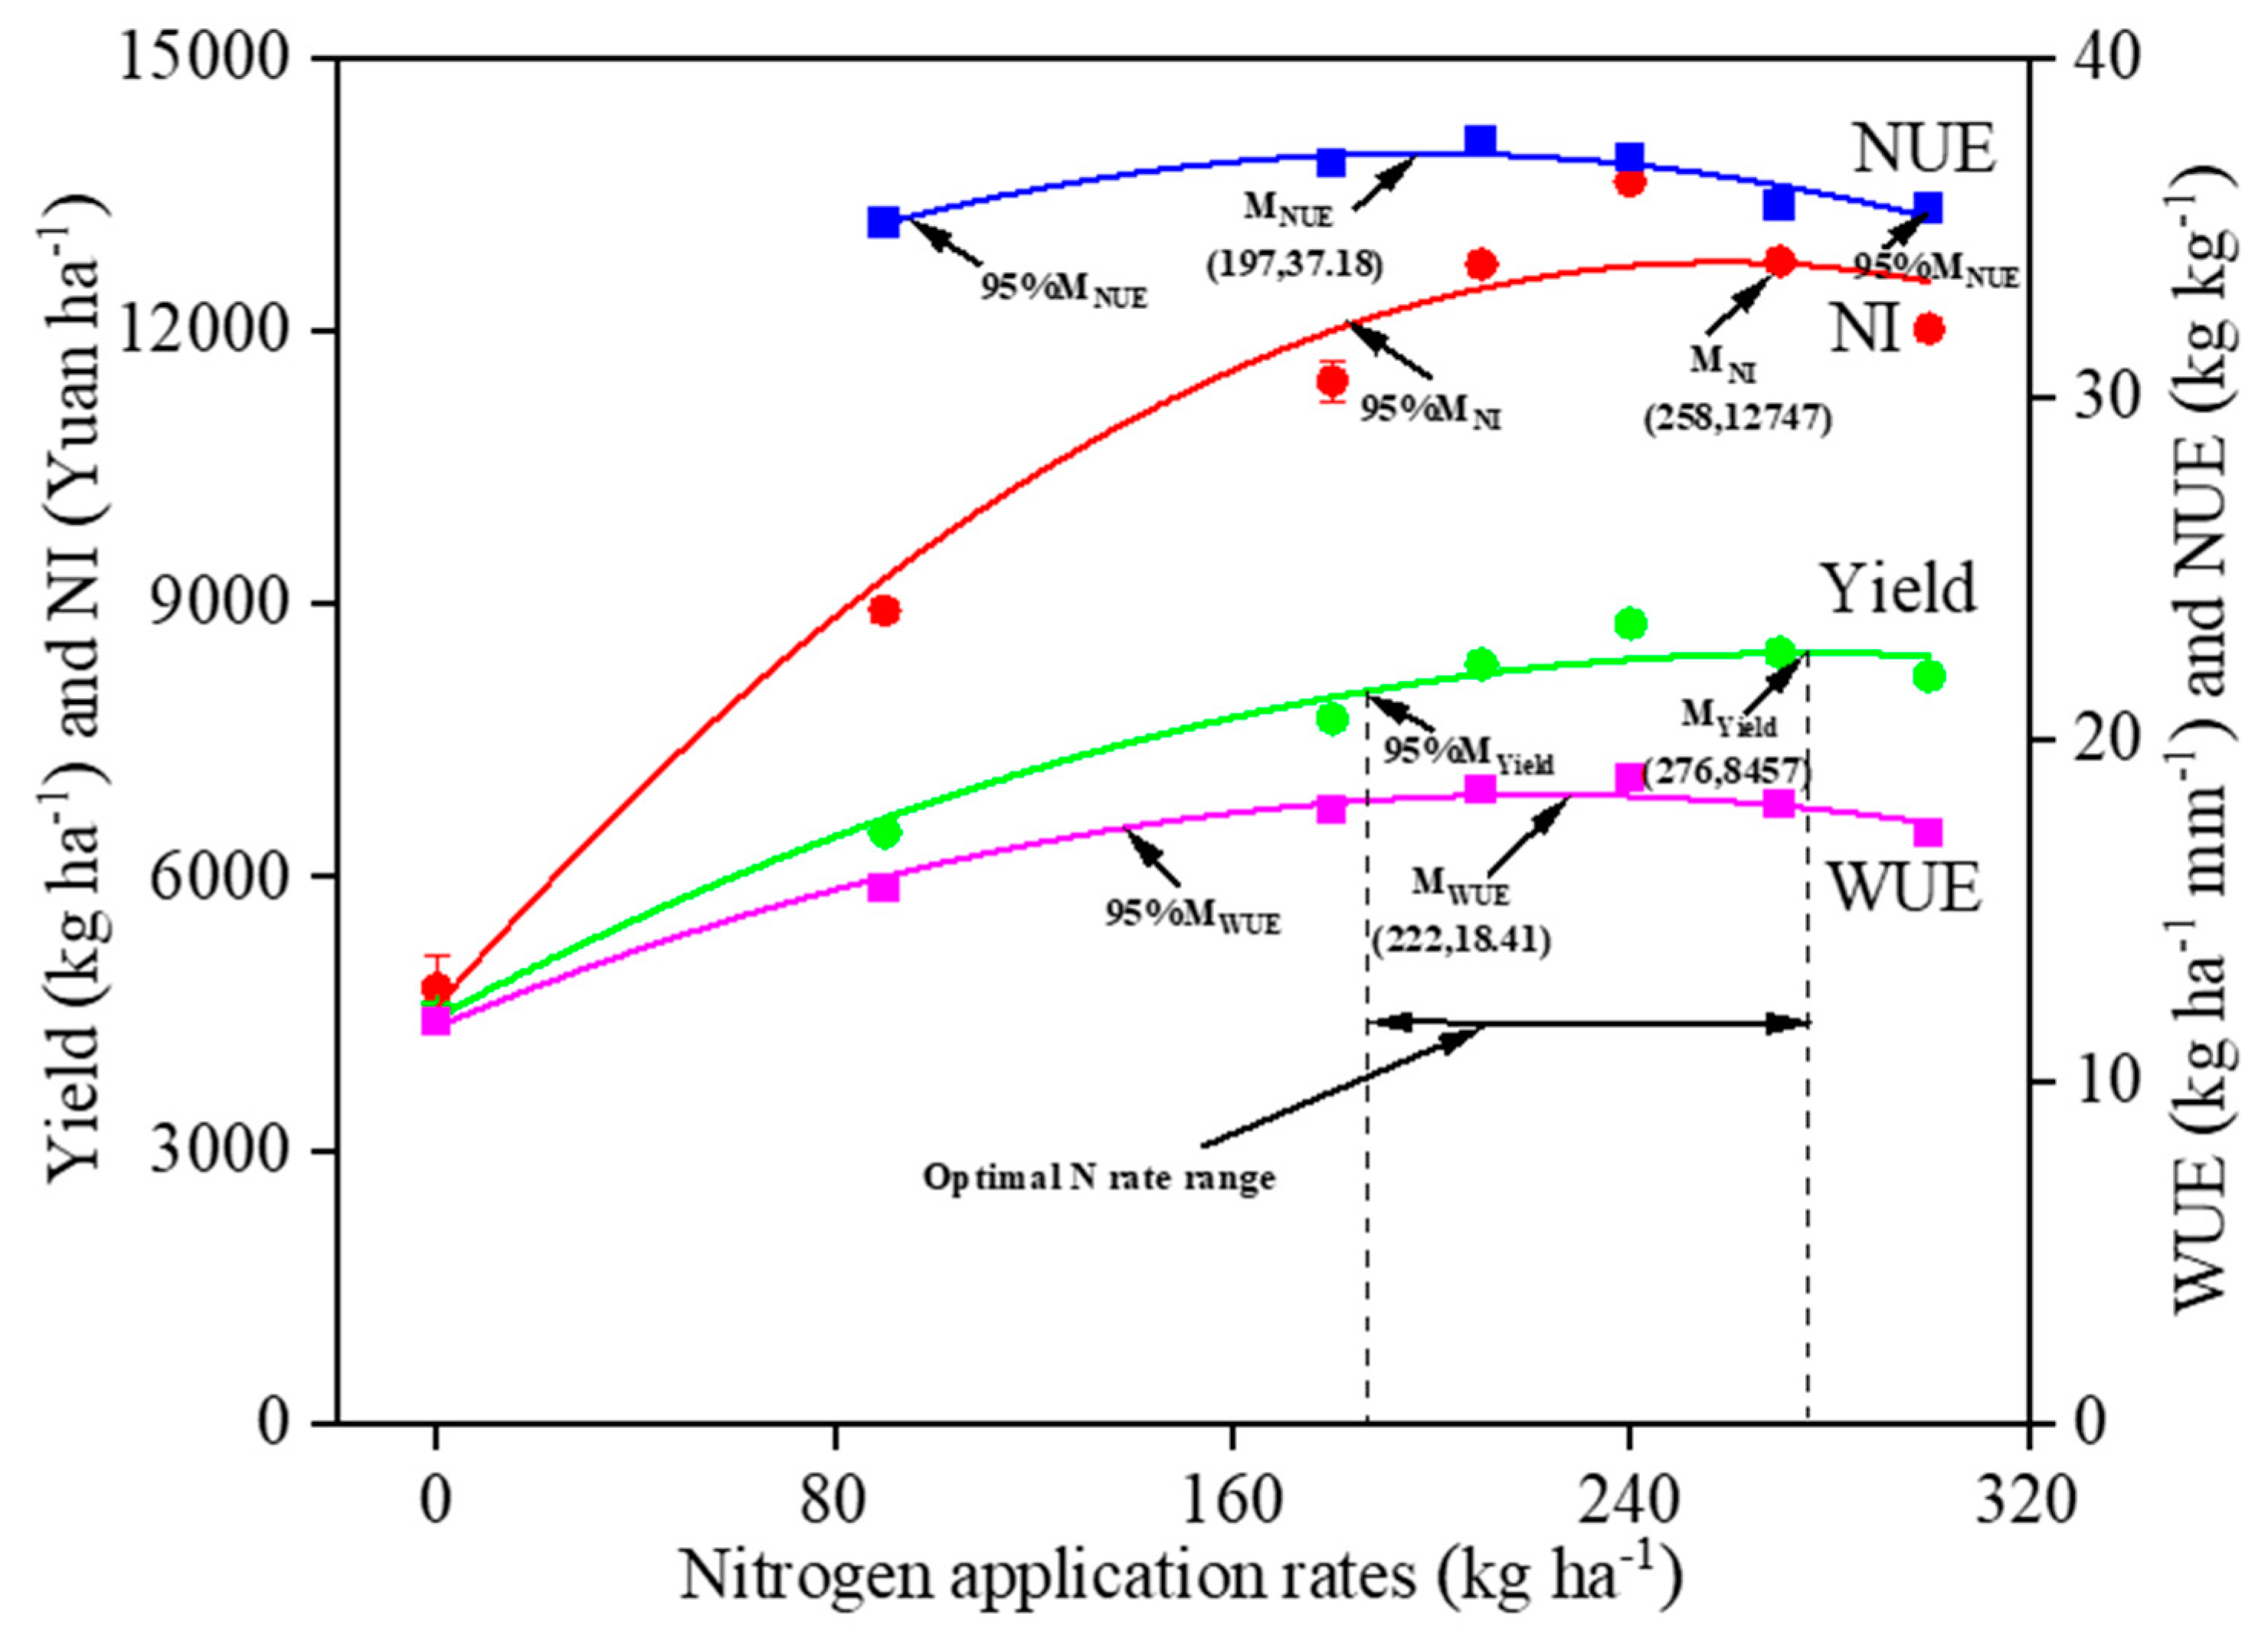
3.9. Finding Optimal N-Application Rates
Considering the internal influence, the average input and output across the two years can better reflect the effect of nitrogen fertilizer. For this reason, the average yield, net income, water use efficiency, and nitrogen use efficiency across the two years of this experiment were analyzed using regression (Figure 5). The results demonstrated that when N was 197,222, 258, and 276 kg, the NUE, WUE, net income, and yield reached the highest values of 37.18, 18.41, 12,747 Yuan ha−1, and 8457, respectively. The range of N corresponding to the relative value of each index being defined above 95%, which was defined as the higher level of this index. The results showed that the N was within the range of 187–276 kg ha−1 (Table 10), although the range of N exceeded the corresponding amount of the highest WUE, net income, and WUE. However, this did not decrease to 95% of the maximum value. Nonetheless, the yield can reach 95–100%, which is conducive to ensuring food security.
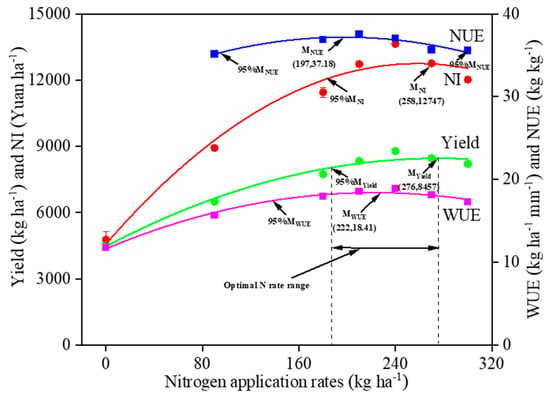
Figure 5.
Yield, net income (NI), nitrogen use efficiency (NUE), and water use efficiency (WUE) as regression functions with an annual average rate of nitrogen application for 2016–2018.
Table 10.
The different nitrogen application rates when each index (X) reached its maximum value (Ymax) and 95% of its maximum value (95%Ymax).
4. Discussion
4.1. Effects of Nitrogen Application on Material Accumulation
Nitrogen application has a threshold effect in regulating the crop growth and yield, and excessive N applications may be detrimental to crop growth and yield improvement [20,21]. Therefore, the tiller population and dry matter are important crop growth and development indices. Among them, the tiller population is a key factor determining the spike number in winter wheat; besides being influenced by genetic characteristics, agronomic measures (such as nitrogen fertilizer management) have an important influence on its growth and extinction [13,22]. In this study, as the growth stage progressed, the tiller population number of winter wheat first increased, then decreased, and reached a peak at the jointing stage. The tiller population increased gradually with an increase in the nitrogen application in each growth stage; the growth was faster at the wintering and jointing stages, and slower at the boosting and anthesis stages. At the maturity stage, N300 presented the highest values, but the difference was not significant between N240 and N270 (Figure 2; Table 5). This indicates that increasing N will improve the number of tillers in the early growth stage, but as the growth stage progresses, especially after the jointing stage, the plants will grow faster and therefore need to compete for more space in order to meet their proper growth rates; thus, many ineffective tillers will die out, and the rate of tiller formation spikes will reduce [23,24]. Therefore, this study showed that the application of N240 did not consistently increase the spike number at the maturity stage, but increased the growth of ineffective tillers in the early stages of reproduction, thus resulting in ineffective water and nutrient consumption.
Dry matter accumulation and translocation are closely related to the yield [25], and N application significantly affects its accumulation and translocation [26]. This study showed that, with the increase in N application, the dry matter accumulation in winter wheat increased gradually from the sowing stage to the jointing stage; it increased first and then remained constant from the jointing stage to the anthesis stage, and increased and then decreased from the anthesis stage to the maturity stage. The highest N240 and the dry matter at the maturity stage showed an increasing trend and then leveled off. The differences among N240, N270, and N300 were not significant because, with an increase in N application, the number of tiller populations and the leaf area index improve before the jointing stage, which enhances the photosynthetic capacity, resulting in more dry matter accumulation [27]. After the jointing stage, many ineffective tillers died, and, with N240, the difference was not significant in the number of tiller populations at the anthesis stage; thus, the difference in dry matter accumulation from the jointing stage to the anthesis stage was not significant among N240, N270, and N300. Because of the nitrogen application rates of N270 and N300, 0–200 cm of soil water was consumed before the anthesis stage, resulting in insufficient soil water storage after anthesis. The soil water shortage at the filling stage inhibits the re-transfer of dry matter stored in the nutrient organs before anthesis to the accumulation of grains and dry matter after anthesis [28]. Therefore, after anthesis, thew nitrogen accumulation was significantly lower with N300 than compared to N240. In contrast, before anthesis, the dry matter accumulation was significantly higher with N270 and N300 when compared to N240, although the soil moisture deficiency during N applications at N270 and N300 inhibited its running capacity. However, before anthesis, the dry matter accumulation did not significantly differ between N270 and N300 and N240. Therefore, the N240 would cause the aboveground dry matter to grow wildly before jointing and consume a large amount of soil water, which was not conducive to the dry matter running before anthesis and the dry matter accumulation after anthesis.
The yield is determined by both the dry matter translocation before anthesis and the dry matter accumulation after anthesis [29]. In this study, with the increase in the N application, the translocation before the anthesis stage increased first and then leveled out. After anthesis, the dry matter accumulation showed a trend of increasing and then decreasing, thus resulting in the yield showing the same trend, which is consistent with the studies of [30]. In this study, the highest yield was achieved at N240, with an increase of 2.8–93.1%, when compared to other treatments. Therefore, an appropriate amount of N is beneficial for building a reasonable population structure, increasing the number of spikes, promoting dry matter translocation before anthesis, and the dry matter accumulation after anthesis, and then increasing the yield.
4.2. Soil Water Consumption and Nutrient Utilization
The application of nitrogen can improve the soil water use capacity, surge crop water consumption, and improve WUE in winter wheat [31], because the N application affects the soil water use by affecting the aboveground dry matter accumulation in the crop [32]. In this study, the N application significantly increased the total water consumption during the growth stage, and with the increase in N application, the total water consumption increased significantly within N240 and leveled off, exceeding N240. However, there was no significant difference between N270, N300, and N240. The changing trend is consistent with [32] in North China.
The reason may be that the soil water consumption at each growth stages and the total water consumption were significantly correlated to the dry matter accumulation at the corresponding stage and the dry matter accumulation at the maturity stage (Table 7). The appropriate N application increased the crop leaf area index and biomass, and increased the crop transpiration water consumption. In contrast, excessive N did not result in a sustained increase in biomass due to the self-regulatory capacity of the crop population and the limitation of soil water storage [33]. The total water consumption during the growth stage tended to increase first and then remained unchanged. Improving WUE is beneficial to the rational use of agricultural resources, and the results of this study showed that N300 significantly increased the water use efficiency; however, excessive N application did not result in a sustained increase in water use efficiency (WUE), which was consistent with the studies of [34]. The water use efficiency was the highest with N240 and N270 in 2016–2017 and 2017–2018, which was significantly different from N0, N90, and N300. Therefore, N can exploit the potential of crop water regulation with fertilizers and improve the water consumption, as well as the WUE of crops since the total water consumption was unchanged. The yield was significantly lower when N exceeded N240, and the WUE decreased when the appropriate amount of N was exceeded.
Nitrogen application increases soil N content and provides sufficient nutrients to the aboveground part of the plant, thus promoting N uptake in winter wheat, while the N uptake and utilization in the plant are closely related to the soil water status. This study revealed that the nitrogen accumulation increased gradually with an increase in N from the sowing stage to the jointing stage; it increased then remained constant from the jointing stage to the anthesis stage, and then increased and decreased from the anthesis stage to the maturity stage, reaching the highest levels at N240. Similarly, before anthesis, N translocation and grain nitrogen accumulation also tended to increase and then decrease, reaching the highest levels at N240. The reason for this may be that N accumulation at each growth stage and the N translocation before anthesis significantly correlated with the soil water consumption at the corresponding stages (Table 8), and the plant nitrogen accumulation gradually increased with an increase in N between the sowing and the jointing stage and the jointing and the anthesis stage. In contrast, the N uptake by plants was inevitably accompanied by soil water consumption, resulting in higher soil water consumption before anthesis (Figure 1). After the anthesis stage, the soil water storage is insufficient at N240, and the soil water conditions affect the nitrogen uptake and utilization [16,35]. Despite the increase in N, there is insufficient water in the wheat field to fully utilize N fertilizer, which is not conducive to the translocation and accumulation of N in the plant, thus reducing the accumulation of N in the grains. An increase in nitrogen application without increasing the plant N accumulation beyond a certain range will certainly decrease N fertilizer utilization [36]. Our study showed that, with an increase in N application, the N fertilizer factor productivity and N fertilizer uptake efficiency showed a gradual decrease, and the NUE first increased and then decreased, with the highest being at N180 and N210 kg ha−1 of N in 2016–2017 and 2017–2018, respectively. The appropriate amount of N application is conducive to the balanced use of water at all the growth stages, promoting nitrogen accumulation and translocation and improving the grain N accumulation and the water and N fertilizer utilization efficiency.
4.3. Yield and Comprehensive Benefit
Rational N can improve the crop yield, water, and NUE, thus achieving a high yield and high net income at lower environmental costs, and ensuring sustainable agricultural development [1,37]. The rational N of winter wheat varies with the soil fertility, climatic environment, planting pattern, and evaluation index [38]. The recommended rate is 195 kg ha−1 nitrogen application rate for winter wheat under micro-sprinkler irrigation in the North China Plain, based on the synergistic improvement of yield, water, and NUE [39]. N270 and N300 are advised for winter wheat in wheat–maize rotation areas in China, based on the balanced improvement of yield, quality, income, and NUE through several literature investigations and field trial data integrations [16,40]. The optimal N of N210 and N240 for winter wheat was based on yield, plant N accumulation, and soil N residue in the middle and lower reaches of the Yangtze River, China.
This study showed that when considering the yield, net income, water, and NUE, the N300 could meet the four indexes and reach 95–100% of the maximum value after fitting. On this basis, if the soil fertility is high, N90–N300 are recommended to improve the NUE and reduce the soil N residue effectively. If the soil water was poor before sowing, the recommended N would be N300 to ensure higher soil water consumption. If the economic benefit is the primary consideration, then N270 and N300 can increase the incomes of farmers.
5. Conclusions
A continuous increase in N did not increase the yield, WUE, or NUE. However, in this study, N240 equalized the water consumption at different stages, significantly increased the dry matter translocation before anthesis and the dry matter accumulation after anthesis, the total water consumption during the growth stages, the N translocation before anthesis, and the nitrogen accumulation after anthesis, as well as increasing the yield by 2.8–91.3%. Therefore, when considering the yield, net income, and environmental benefits, the N, 187–276 kg ha−1, transpiration rate and stomatal conductance N240 was highest 21–28 day after anthesis, can achieve a high yield, maintain a high economic income, and have a high WUE and NUE, which is the optimum N application rate for high-yield and high-efficiency cultivation in this region. In this study, we compared the changes in the dry matter yield, the net income, water, and the NUE benefit.
Author Contributions
Conceptualization, X.L. and Z.G.; methodology, P.D. and F.N.; software, X.L.; validation, H.N.; formal analysis, X.L.; investigation, M.S.; resources, P.D.; data curation, H.N.; writing—original draft preparation, H.N.; writing—review and editing, H.N. and F.N.; visualization, F.N.; supervision, H.N.; project administration, H.N. and P.D.; funding acquisition, H.N. All authors have read and agreed to the published version of the manuscript.
Funding
This project was approved by the China Agriculture Research System (No. CARS-03-01-24), National Natural Science Foundation of China (No. 32272216), Sub-project of National Key R & D program (No. 2021YFD1901102-2). The Central Government guides local science and Technology Development Fund projects (No. YDZJSX2021C016), State Key Laboratory of Sustainable Dryland Agriculture, Shanxi Agricultural University (No. 202003-2), the Basic Research Program Project of Shanxi Province (20210302123410), the technology innovation team of Shanxi Province (No. 201605D131041), the Key Laboratory of Shanxi Province (No. 201705D111007), the “1331” Engineering Key Laboratory of Shanxi Province, the “1331” Engineering Key Innovation Cultivation Team of Shanxi Province (No. SXYBKY201733). Shanxi Province Foundation for Returness (2022-105) for financial support of this study.
Data Availability Statement
Data are contained within the article.
Conflicts of Interest
The authors declare no competing interests.
References
- Noor, H.; Shah, A.A.; Ding, P.; Ren, A.; Sun, M.; Gao, Z. Long-Term Nutrient Cycle inImproved Grain Yield of Dryland Winter Wheat (Triticum aestivum L.) under Hydrological Process of PlantEcosystem Distribution in the LoessPlateau of China. Plants 2023, 12, 2369. [Google Scholar] [CrossRef] [PubMed]
- FAO. 2019. Available online: https://www.fao.org/faostat/en/#data/QC (accessed on 21 July 2021).
- Raji, V.R.; Packialakshmi, S. Assessing the wastewater pollutants retaining for a soil aquifer treatment using batch column experiments. Civ. Eng. J. 2022, 8, 1482–1491. [Google Scholar] [CrossRef]
- Zheng, B.; Zhang, X.; Wang, Q.; Li, W.; Huang, M.; Zhou, Q.; Cai, J.; Wang, X.; Cao, W.; Dai, T.; et al. Increasing plant density improves grain yield, protein quality and nitrogen agronomic efficiency of soft wheat cultivars with reduced nitrogen rate. Field Crops Res. 2019, 267, 4–8. [Google Scholar] [CrossRef]
- Cui, Z.; Zhang, H.; Chen, X.; Zhang, C.; Ma, W.; Huang, C.; Zhang, W.; Mi, G.; Miao, Y.; Li, X.; et al. Pursuing sustainable productivity with millions of smallholder farmers. Nature 2018, 555, 363–366. [Google Scholar] [CrossRef] [PubMed]
- Ju, X.-T.; Xing, G.-X.; Chen, X.-P.; Zhang, S.-L.; Zhang, L.-J.; Liu, X.-J.; Cui, Z.-L.; Yin, B.; Christie, P.; Zhu, Z.-L.; et al. Reducing environmental risk by improving N management in intensive Chinese agricultural systems. Proc. Natl. Acad. Sci. USA 2018, 106, 3041–3046. [Google Scholar] [CrossRef] [PubMed]
- Spiertz, J. Nitrogen, sustainable agriculture and food security. A review. Agron. Sustain. Dev. 2010, 30, 43–55. [Google Scholar] [CrossRef]
- Xu, H.-C.; Dai, X.-L.; Chu, J.-P.; Wang, Y.-C.; Yin, L.-J.; Ma, X.; Dong, S.; He, M.-R. Integrated management strategy for improving the grain yield and nitrogen-use efficiency of winter wheat. J. Integr. Agric. 2018, 17, 315–327. [Google Scholar] [CrossRef]
- Zhang, X.; Davidson, E.A.; Mauzerall, D.L.; Searchinger, T.D.; Dumas, P.; Shen, Y. Managing nitrogen for sustainable development. Nature 2015, 528, 51–59. [Google Scholar] [CrossRef] [PubMed]
- Naruoka, Y.; Talbert, L.E.; Lanning, S.P.; Blake, N.K.; Martin, J.M.; Sherman, J.D. Identification of quantitative trait loci for productive tiller number and its relationship to agronomic traits in spring wheat. Theor. Appl. Genet. 2011, 123, 1043–1053. [Google Scholar] [CrossRef]
- Wang, Z.; Liu, Y.; Shi, H.; Mo, H.; Wu, F.; Lin, Y.; Gao, S.; Wang, J.; Wei, Y.; Liu, C.; et al. Identification and validation of novel low-tiller number QTL in common wheat. Theor. Appl. Genet. 2016, 129, 603–612. [Google Scholar] [CrossRef]
- Ercoli, L.; Lulli, L.; Mariotti, M.; Masoni, A.; Arduini, I. Post-anthesis dry matter and nitrogen dynamics in durum wheat as affected by nitrogen supply and soil water availability. Eur. J. Agron. 2008, 28, 138–147. [Google Scholar] [CrossRef]
- Si, Z.; Zain, M.; Mehmood, F.; Wang, G.; Gao, Y.; Duan, A. Effects of nitrogen application rate and irrigation regime on growth, yield, and water-nitrogen use efficiency of drip-irrigated winter wheat in the North China Plain. Agric. Water Manag. 2020, 231, 106002. [Google Scholar] [CrossRef]
- Noor, H.; Noor, F.; Liang, L.T.; Ding, P.; Sun, M.; Gao, Z. Nitrogen fertilization and precipitation affected Wheat (Triticum aestivum L.) in dryland the Loess Plateau of South Shanxi, China. Heliyon 2023, 9, e18177. [Google Scholar] [CrossRef]
- Noor, H.; Yan, Z.; Sun, P.; Zhang, L.; Ding, P.; Li, L.; Ren, A.; Sun, M.; Gao, Z. Effects of Nitrogen on Photosynthetic Produc-tivity and Yield Quality of Wheat (Triticum aestivum L.). Agronomy 2023, 13, 1448. [Google Scholar] [CrossRef]
- Noor, H.; Ding, P.; Ren, A.; Sun, M.; Gao, Z. Effects of Nitrogen Fertilizer on Photosynthetic Characteristics and Yield. Agronomy 2023, 13, 1550. [Google Scholar] [CrossRef]
- Mbuthia, L.W.; Acosta-Martínez, V.; DeBruyn, J.; Schaeffer, S.; Tyler, D.; Odoi, E.; Mpheshea, M.; Walker, F.; Eash, N. Long term tillage, cover crop, and fertilization effects on microbial community structure, activity: Implications for soil quality. Soil. Bio Biochem. 2015, 89, 24–34. [Google Scholar] [CrossRef]
- Przulj, N.; Momčilović, V. Dry matter and nitrogen accumulation and use in spring barley. Plant Soil. Environ. 2003, 49, 36–47. [Google Scholar] [CrossRef]
- Yang, X.; Lu, Y.; Ding, Y.; Yin, X.; Raza, S.; Tong, Y. Optimising nitrogen fertilisation: A key to improving nitrogen-use efficiency and minimising nitrate leaching losses in an intensive wheat/maize rotation (2008–2014). Field Crops Res. 2017, 206, 1–10. [Google Scholar] [CrossRef]
- Mon, J.; Bronson, K.F.; Hunsaker, D.J.; Thorp, K.R.; White, J.W.; French, A.N. Interactive effects of nitrogen fertilization and irrigation on grain yield, canopy temperature, and nitrogen use efficiency in overhead sprinkler-irrigated durum wheat. Field Crops Res. 2016, 191, 54–65. [Google Scholar] [CrossRef]
- Norse, D.; Ju, X. Environmental costs of China’s food security. Agric. Ecosyst. Environ. 2015, 209, 5–14. [Google Scholar] [CrossRef]
- Ekeleme, A.C.; Ekwueme, B.N.; Agunwamba, J.C. Modeling contaminant transport of nitrate in soil column. Emerg. Sci. J. 2021, 5, 471–485. [Google Scholar] [CrossRef]
- Bastos, L.M.; Carciochi, W.; Lollato, R.P.; Jaenisch, B.R.; Rezende, C.R.; Schwalbert, R.; Prasad, P.V.; Zhang, G.; Fritz, A.K.; Foster, C.; et al. Winter Wheat Yield Response to Plant Density as a Function of Yield Environment and Tillering Potential: A Review and Field Studies. Front. Plant Sci. 2020, 11, 54. [Google Scholar] [CrossRef] [PubMed]
- Liu, H.; Wang, Z.; Yu, R.; Li, F.; Li, K.; Cao, H.; Yang, N.; Li, M.; Dai, J.; Zan, Y.; et al. Optimal nitrogen input for higher efficiency and lower environmental impacts of winter wheat production in China. Agric. Ecosyst. Environ. 2016, 224, 1–11. [Google Scholar] [CrossRef]
- Jiang, L.; Zhang, Y.; Zhu, Y.; Zhao, L. Effects of Nitrogen Application on Dry Matter Accumulation, Transport and Yield in Different Wheat Varieties. Crops 2019, 5, 151–158. [Google Scholar] [CrossRef]
- Demotes-Mainard, S.; Jeuffroy, M.H. Effects of nitrogen and radiation on dry matter and nitrogen accumulation in the spike of winter wheat. Field Crops Res. 2004, 87, 221–233. [Google Scholar] [CrossRef]
- Jha, S.K.; Ramatshaba, T.S.; Wang, G.; Liang, Y.; Liu, H.; Gao, Y.; Duan, A. Response of growth, yield and water use efficiency of winter wheat to different irrigation methods and scheduling in North China Plain. Agric. Water Manag. 2019, 217, 292–302. [Google Scholar] [CrossRef]
- Ding, P.; Noor, H.; Shah, A.A.; Yan, Z.; Sun, P.; Zhang, L.; Li, L.; Jun, X.; Sun, M.; Elansary, H.O.; et al. Nutrient Cycling and Nitrogen Management Impact of Sowing Method and Soil Water Consumption on Yield Nitrogen Utilization in Dryland Wheat (Triticum aestivum L.). Agronomy 2023, 13, 1528. [Google Scholar] [CrossRef]
- Jin-Peng, L.I.; Zhang, Z.; Yao, C.S.; Liu, Y.; Zhang, Y. Improving winter wheat grain yield and water-/nitrogen-use efficiency by optimizing the micro-sprinkling irrigation amount and nitrogen application rate. J. Integr. Agric. 2021, 20, 606–621. [Google Scholar]
- Liu, W.; Wang, J.; Wang, C.; Ma, G.; Wei, Q.; Lu, H.; Xie, Y.; Ma, D.; Kang, G. Root Growth, Water and Nitrogen Use Efficiencies in Winter Wheat Under Different Irrigation and Nitrogen Regimes in North China Plain. Front. Plant Sci. 2018, 9, 1798. [Google Scholar] [CrossRef]
- Wang, J.; Liu, W.; Dang, T. Responses of soil water balance and precipitation storage efficiency to increased fertilizer application in winter wheat. Plant Soil 2011, 347, 41–51. [Google Scholar] [CrossRef]
- Noor, H.; Sun, M.; Algwaiz, H.I.M.; Sher, A.; Fiaz, S.; Attia, K.A.; Wani, S.H.; AlKahtani, M.D.F.; Al Husnain, L.; Lin, W.; et al. Chlorophyll fluorescence and grain filling characteristic of wheat (Triticum aestivum L.) in response to nitrogen application level. Mol. Biol. Rep. 2022, 49, 7157–7172. [Google Scholar] [CrossRef] [PubMed]
- Wang, H.; Zhang, Y.; Chen, A.; Liu, H.; Zhai, L.; Lei, B.; Ren, T. An optimal regional nitrogen application threshold for wheat in the North China Plain considering yield and environmental effects. Field Crops Res. 2017, 207, 52–61. [Google Scholar] [CrossRef]
- Wang, L.; Palta, J.A.; Chen, W.; Chen, Y.; Deng, X. Nitrogen fertilization improved water-use efficiency of winter wheat through increasing water use during vegetative rather than grain filling. Agric. Water Manag. 2018, 197, 41–53. [Google Scholar] [CrossRef]
- Noor, H.; Min, S.; Khan, S.; Lin, W.; Ren, A.; Yu, S.; Ullah, S.; Yang, Z.; Gao, Z. Different sowing methods increase the yield and quality of soil water consumption of dryland Winter wheat on the loess plateau of China. Appl. Ecol. Environ. Res. 2020, 18, 8285–8308. [Google Scholar] [CrossRef]
- Sun, M.; Gao, Z.; Zhao, W.; Deng, L.; Deng, Y.; Zhao, H.; Ren, A.; Li, G.; Yang, Z. Effect of subsoiling in fallow period on soil water storage and grain protein accumulation of dryland wheat and its regulatory effect by nitrogen application. PLoS ONE 2013, 8, e75191. [Google Scholar] [CrossRef]
- Pask, A.; Sylvester-Bradley, R.; Jamieson, P.; Foulkes, M. Quantifying how winter wheat crops accumulate and use nitrogen reserves during growth. Field Crops Res. 2012, 126, 104–118. [Google Scholar] [CrossRef]
- Hu, C.L.; Ding, M.; Qu, C.; Sadras, V.; Yang, X.; Zhang, S.L. Yield and water use efficiency of wheat in the Loess Plateau: Responses to root pruning and defoliation. Field Crops Res. 2015, 179, 6–11. [Google Scholar] [CrossRef]
- Zörb, C.; Ludewig, U.; Hawkesford, M.J. Perspective on wheat yield and quality with reduced nitrogen supply. Trends Plant Sci. 2018, 23, 1029–1037. [Google Scholar] [CrossRef]
- Qu, B.; Feng, F.; Di, J.; Noor, H. Root morphology and physiological of their relationship with nitrogen uptake in wheat (Triticum aestivum L.). Heliyon 2024, 10, e29283. [Google Scholar] [CrossRef]


Disclaimer/Publisher’s Note: The statements, opinions and data contained in all publications are solely those of the individual author(s) and contributor(s) and not of MDPI and/or the editor(s). MDPI and/or the editor(s) disclaim responsibility for any injury to people or property resulting from any ideas, methods, instructions or products referred to in the content. |
© 2024 by the authors. Licensee MDPI, Basel, Switzerland. This article is an open access article distributed under the terms and conditions of the Creative Commons Attribution (CC BY) license (https://creativecommons.org/licenses/by/4.0/).