Article

One-Time Contact Application of Controlled-Release Urea and Optimized Method Improved Rice Yield and Nitrogen Use Efficiency with 50% Nitrogen Input

1
MARA Key Laboratory of Sustainable Crop Production in the Middle Reaches of the Yangtze River (Co-Construction by Ministry and Province), College of Agriculture, Yangtze University, Jingzhou 434025, China
2
College of Life Science, Yangtze University, Jingzhou 434025, China
3
Institute of Plant Nutrition and Resources, Beijing Academy of Agriculture and Forestry Sciences, Beijing 100097, China
4
Beijing Engineering Technology Research Center for Slow/Controlled-Release Fertilizer, Beijing 100097, China
*
Authors to whom correspondence should be addressed.
Agronomy 2024, 14(4), 781; https://doi.org/10.3390/agronomy14040781
Submission received: 1 March 2024 / Revised: 29 March 2024 / Accepted: 31 March 2024 / Published: 10 April 2024
(This article belongs to the Section Agroecology Innovation: Achieving System Resilience)

Abstract

:
Excessive nitrogen application is a common phenomenon in rice production in China, which will lead to a low nitrogen utilization rate and increase farmers’ production costs. In Jingzhou, Hubei Province, for two consecutive years (2021, 2022), rice was planted with nursery-box total fertilization (NBTF) technology to provide technical support for rice seedling box contact fertilization technology. The results showed that, compared with the conventional treatment, the seedling emergence rate decreased by 7.70–11.87%, but the seedling quality significantly improved and the plant height significantly increased by 4.38–6.06% in the full-heading stage after the aforementioned treatments. The leaf area index significantly increased by 16.75–34.55%, 10.04–19.30%, and 12.13–18.60% in the tiller, booting, and full-heading stages, respectively, whereas the photosynthetic rate significantly increased by 3.80–5.25% in the booting stage. The rice yield under the 50% CRU and 50% CRU + S treatments was the same as that under the FFP treatment. The rice yield under 50% CRU + BT and 50% CRU + BT + S treatments was 7.50–10.61% higher than that under the FFP treatment; nitrogen partial factor productivity increased by 96.15–123.63%. NBTF combined with Boxingtanzhuang (in Chinese) seedling trays showed an increase in yield, whereas normal seedling trays showed a stable yield. It is suggested that the seedling tray and fertilizer should be specialized in the rice seedling box, and the height of the seedling tray should be increased by 3–5 cm. At the same time, special controlled-release urea should be selected to ensure less N release before emergence and improve the seedling emergence rate so as to popularize NBTF technology in a large area.

1. Introduction

Rice serves as the staple food of more than 60% of the world’s population and contributes to 21% of global calorie intake. China is the largest producer and consumer of rice. It accounts for 28.1% of the global rice output while utilizing 18.8% of the global rice planting area, essentially achieving China’s self-sufficiency in grain production [1,2,3]. The self-sufficiency of rice cannot be achieved without a large amount of nitrogen (N) input. For single-season rice in most regions of China, the N application amount frequently exceeds 200 kg ha−1 to achieve high yields, a figure much higher than the global average of 118 kg ha−1 [4]. However, despite the high N application rates and increased yields, the N use efficiency of rice in China was only 28.3%, significantly lower than the global average of 42%, resulting in environmental pollution [5,6]. At present, urea is the main source of N for rice in China. Urea is generally applied by spreading as a base fertilizer and topdressing to meet the N demands in different growth stages of rice, which results in a large amount of N waste. The N fertilizer type and fertilization mode urgently need to be optimized to improve N use efficiency in rice production. Simplified and precise fertilization has become an essential approach for the sustainable development of modern agriculture.
As an efficient N fertilizer, controlled-release urea can be applied at once to ensure rice yield while reducing human and financial expenses compared with regular urea with multiple topdressings [7]. Layered lateral deep fertilization of controlled-release urea increased yield by 12.24% compared with conventional fertilization by farmers [8]. Tian et al. [9] and Lan et al. [10] showed that stable yield could be achieved by applying controlled-release urea at a reduction rate of 20–30%.
The aim of nursery-box total fertilization (NBTF) technology is to concentrate the N amount required during the whole growth period of rice in the form of controlled-release urea in the vicinity of rice seeds. Controlled-release urea and seedlings are introduced into the rice field during transplanting [11]. Previous studies have shown that NBTF does not burn roots in the young stage and can still improve rice yield and N use efficiency under controlled-release urea reduction [11,12]. This study concluded that the optimal application amount of controlled-release urea in the seedling stage was about 45–90 kg N ha−1, which could ensure the quality of seedlings [13]. However, Yang et al. [14] demonstrated that during the seedling-raising stage, factors such as the placement of seeds, fertilizers, and the positioning of seedlings in the soil can affect the antioxidant oxidase activity in the seedlings. However, the seedling quality (e.g., strong seedling index) and N transfer of rice in a field still need further exploration. In addition, the mechanical transplanting process inevitably damaged the root system to a certain extent. Selecting the appropriate seedling tray during seedling rearing can minimize this damage. Compared with the ordinary seedling tray, the root length, root surface area, root diameter, and root volume of seedlings in the Boxingtanzhuang (in Chinese) seedling tray (BT) showed a significant increase, attributable to the root division treatment applied at the bottom of the tray (Figure 1). This could also reduce the rate of seedling leakage and root injury, promote the early emergence of seedlings, and increase the number of effective panicles and yield [15]. Ye et al. [16] showed that the Boxingtanzhuang (in Chinese) seedling tray could improve seedling quality, yield, and N use efficiency of double-cropping rice compared with the conventional flat tray. Further investigations are needed to determine whether the use of matching BT can improve seedling quality and promote the increase in yield and N use efficiency of box-type seedling raising.
This study aimed to explore (1) the effects of box seedling rearing mode and seedling tray optimization on the quality and growth of rice seedlings and (2) the mechanism underlying the effect of controlled-release urea contact application and optimization on the improvement in rice and N use efficiency.

2. Materials and Methods
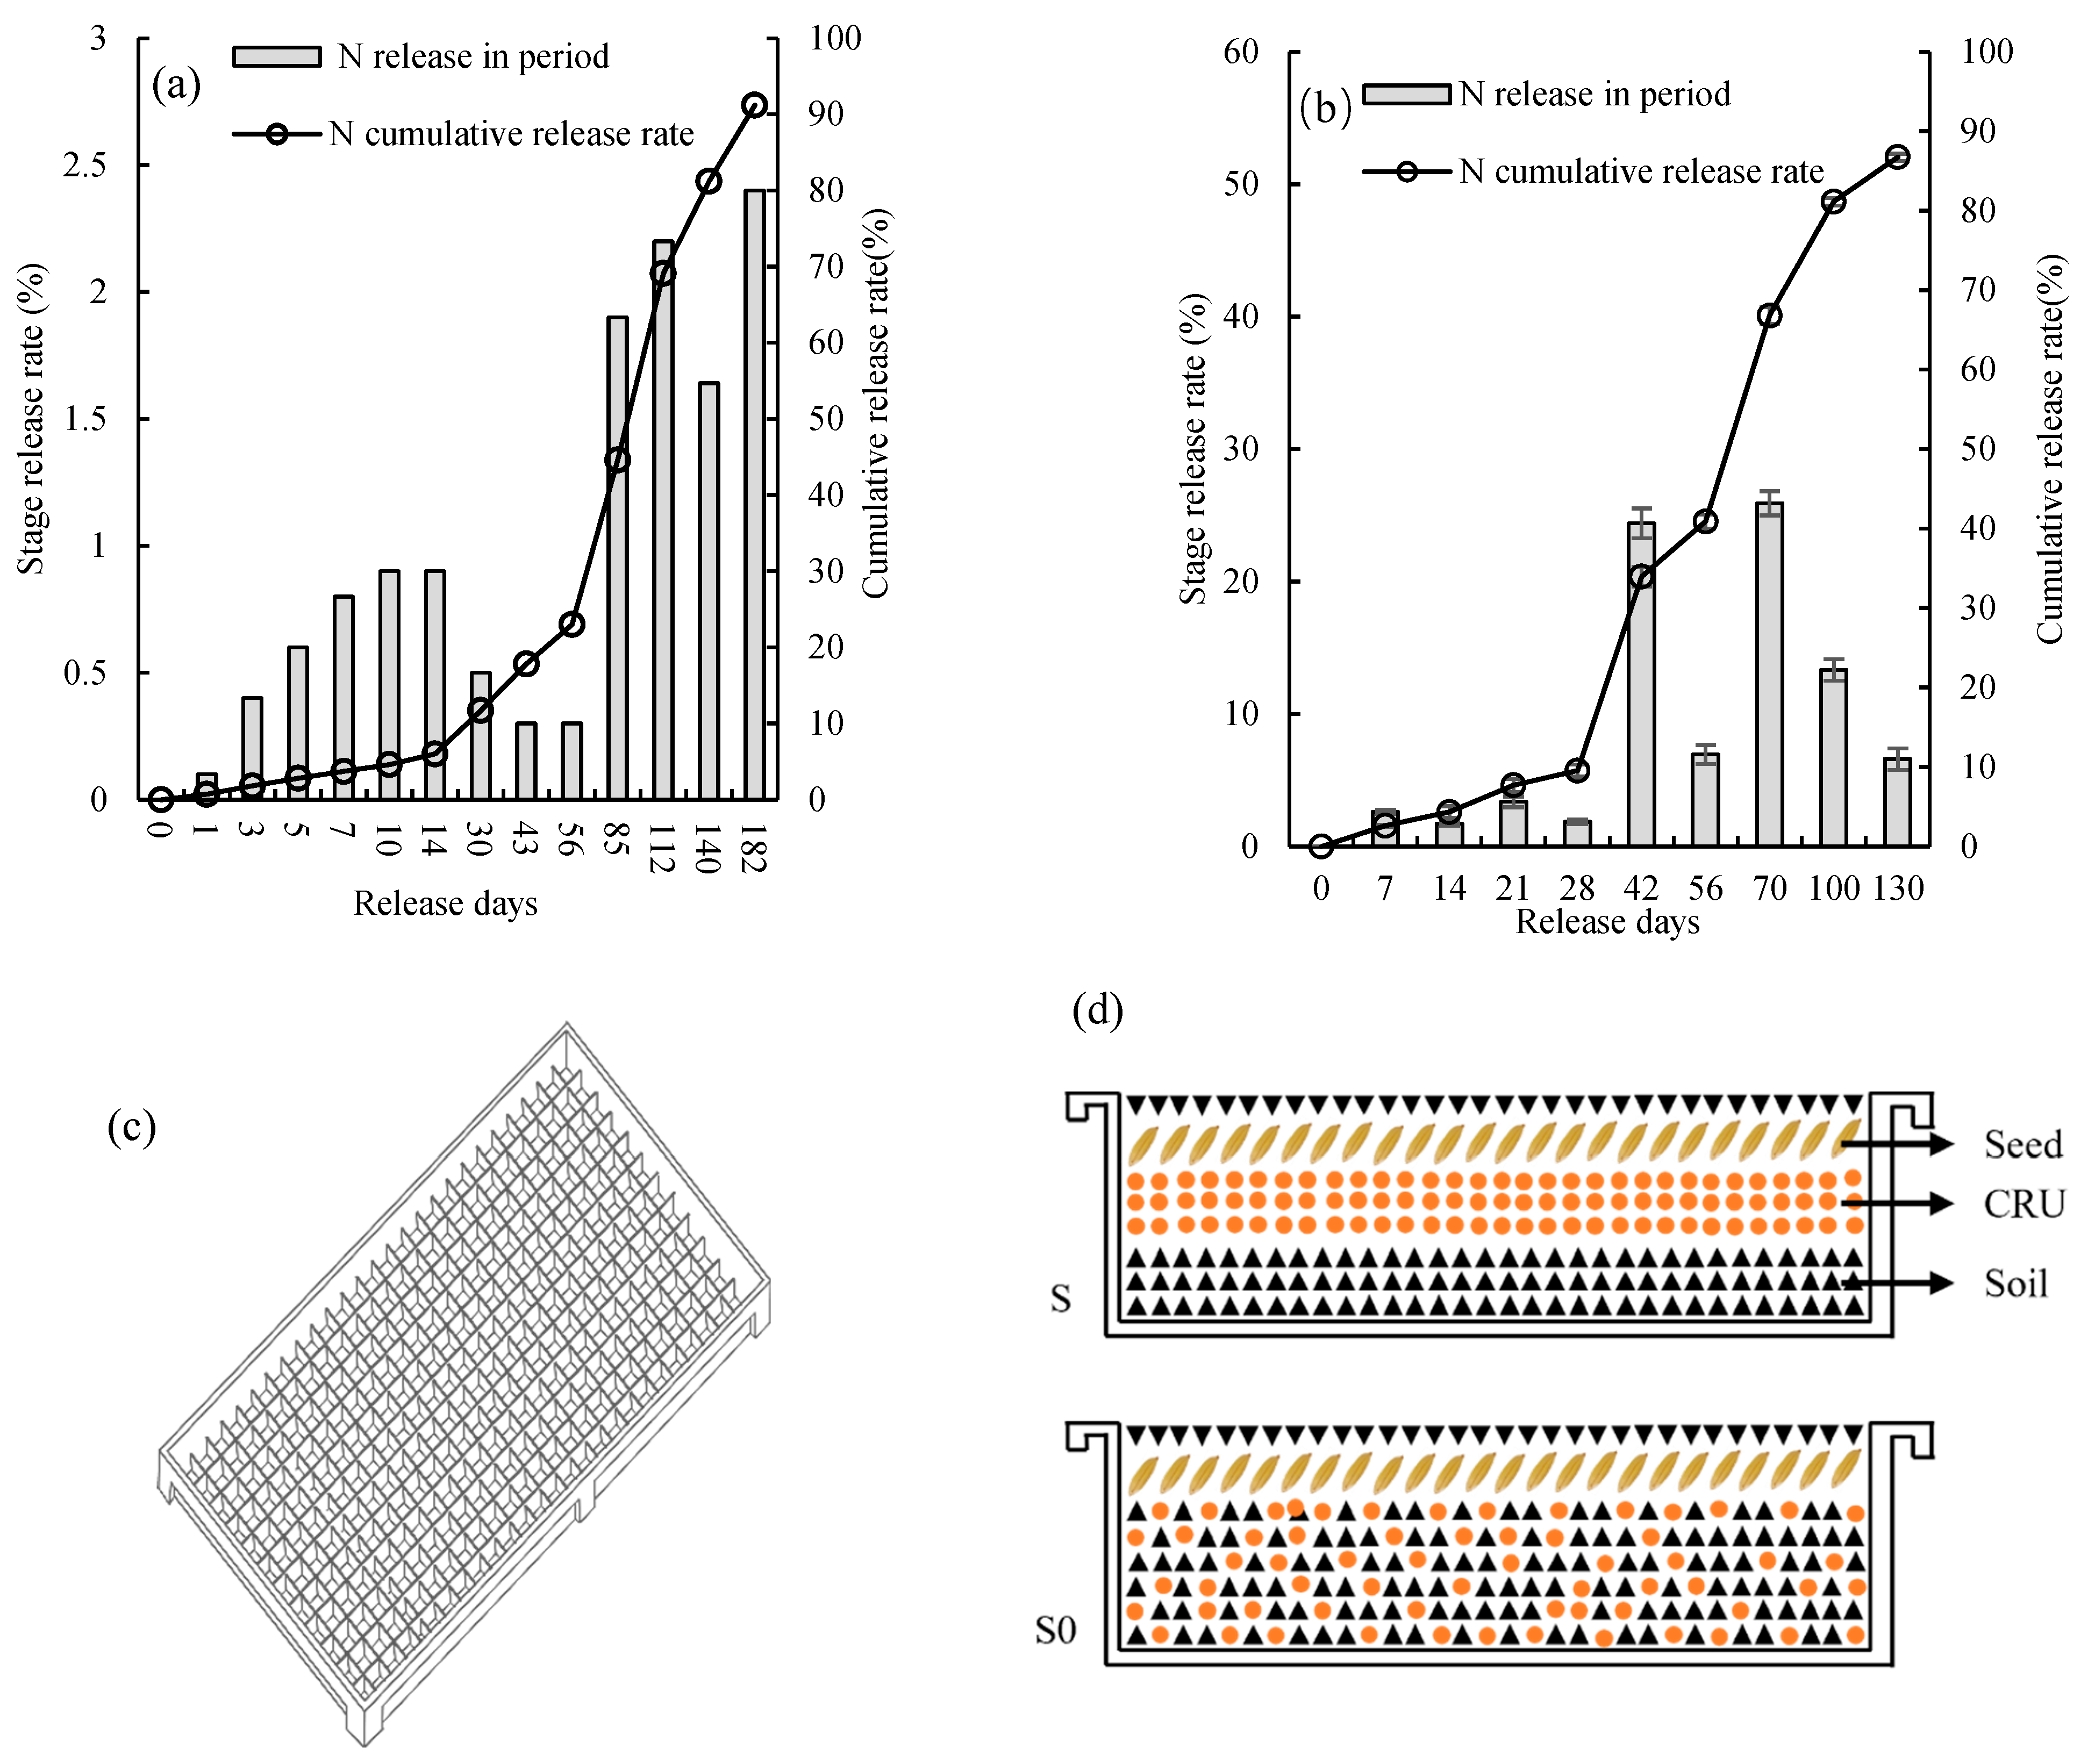
2.1. Test Materials

The experiment was conducted in 2021 and 2022 in the greenhouse of the teaching and research base of Yangtze University. The rice variety studied was Xiuzhan 15 (the 1000-grain weight of the rice seed is 20.4 g, Zhongken Jinxiu Huanong Wuhan Technology Co., Ltd., Wuhan, China). The seedling soil was prepared according to the requirements of local machine transplanting. The local paddy soil and turf were evenly mixed in a ratio of 4:1. Then, 3 kg of compound fertilizer (N-P2O5-K2O, 15-15-15, %) was added per cubic meter of soil for fermentation. Diaxone diluted with water (1000 times) was used for sterilization. A plastic box seedling tray (60 × 30 × 3.2 cm3) was used for dry seedling cultivation. The N content of controlled-release urea used in the experiment was 43%, the release curve was S-shaped, and the release period was 120 days. The controlled-release urea was provided by the National Slow/Controlled-Release Fertilizer Engineering Technology Research Center (Figure 1).

2.2. Experimental Design

Experiment 1 involved a test of contact fertilization. The N application rate of local one-season rice during the whole growth period was 180 kg ha−1, with about 279 plates of seedlings used per hectare. Therefore, the N required for each plate of seedlings during the whole growth period was calculated (0.67 kg). Two common methods were used for transplanting seedlings based on [14]: (1) Conventional laying involved first spreading 2 cm of seedling soil in the seedling tray, adding controlled-release N fertilizer, and sprinkling 75 g of seeds (an equal amount of dry seeds, soaked and used after germination, and the rest remaining the same) directly and evenly on the fertilizer and covering with 0.5 cm of seedling soil (the order being “soil + fertilizer + seed + soil”, S0). (2) The controlled-release N fertilizer was mixed with part of the seedling soil and spread in about 2–2.2 cm of the seedling tray, and 75 g of seeds were sprinkled and then covered with 0.5 cm of soil (the order being “soil mixture + seed + soil”, S). The common seedling tray (B) and BT were used, and the standard specification was 60 × 30 × 3.2 cm3. Five treatments were set according to the amount of controlled-release urea and the fertilizer laying mode: (1) conventional seedling control, no N fertilizer (FFP) used; (2) controlled-release urea providing 50% N, 90 kg ha−1 controlled-release urea applied, and the B and S0 controlled-release N fertilizer laying method (50% CRU) used; (3) controlled-release urea providing 50% N, 90 kg ha−1 controlled-release urea applied, and the B and S controlled-release N fertilizer laying method (50% CRU + S) used; (4) controlled-release urea providing 50% N, 90 kg ha−1 controlled-release urea applied, and the BT and S0 controlled-release N fertilizer laying method (50% CRU + BT) used; (5) controlled-release urea providing 50% N, 90 kg ha−1 controlled-release urea applied, and the BT and S controlled-release N fertilizer laying method (50% CRU + BT + S) used. Each treatment was repeated thrice using a completely random design (Table 1).
Experiment 2 involved a microzone experiment on box rice. The growth index of rice was determined by the open-air pot experiment. Five treatments were set up. The first treatment involved the conventional N application by farmers (FFP), a base fertilizer to tillering fertilizer to ear fertilizer ratio of 5:3:2, the application of phosphate and potassium fertilizers once as base fertilizers, and manual applications of both tillering and ear fertilizers following the base fertilizer application. The other four treatments involved directly transplanting seedlings under the aforementioned contact N fertilization without topdressing (Table 1). Each treatment was repeated thrice. The amount of pure N used in the FFP was 180 kg ha−1, the amounts of P2O5 and K2O were 90 and 120 kg ha−1, respectively, and the amounts of phosphate and potassium fertilizers used in other treatments were consistent with those in the FFP. The N in the FFP came from urea (N, 46%). The N in contact fertilization treatment came from controlled-release urea (N, 43%). The phosphate and potassium used in treatments were derived from superphosphate (P2O5, 12%) and potassium chloride (K2O, 60%), respectively. The amounts of N, phosphorus, and potassium in the microzone were converted according to the row spacing (25 × 18 cm2) (Table 1). The length, width, and height of the micro-area were 51 cm, 38 cm, and 29 cm, respectively. The soil was air-dried, crushed, and sifted 1 cm for use. Each basin of air-dried soil weighed 80 kg. The basic physical and chemical properties of the tested soil were as follows: pH 7.4, organic matter 15.5 g kg−1, alkali-hydrolyzed N 150.6 mg kg−1, available phosphorus 14.5 mg kg−1, and available potassium 84.7 mg kg−1. Two days before rice transplanting, water was injected into the micro-areas until the soil reached full saturation. Each pot contained four holes per pot and two plants per hole. In the early stages, shallow-water irrigation was frequently conducted in all micro-areas. When the number of tillers reached 80% of the expected number of panicles, the field was drained and dried for 7 days, and irrigation was stopped 7 days before harvest. Disease, insect, and weed controls were the same as for the local general field cultivation.

2.3. Sampling and Measurements

2.3.1. Seedling Quality

At 15 days of age, most of the seedlings had three leaves and one heart. The leaf stem base width and stem and leaf dry weights of 30 representative plants were measured from each micro-area, and the seedling parameters, such as fullness, seedling index, and uniformity, were calculated. The seedling quality was calculated as follows:
Fullness = stem and leaf dry weight/seedling height;
Seedling index = stem base width × fullness;
U n i f o r m i t y = 1 x a x a ¯ x a ¯ 2 + 1 x b x b ¯ x b ¯ 2
where xa and xb represent seedling height and stem base width, respectively, and x a ¯ and   x b ¯   represent average seedling height and stem base width, respectively.

2.3.2. Rate of Emergence and Plant Height

After 5 days of seedling emergence, a representative area covering 50% of the seedling tray was selected for counting the number of seedlings. This investigation area was about 900 cm2 (30 × 30 cm2), and the seedling height was measured every 5 days with a ruler. The seedling emergence rate was calculated as follows:
Seedling emergence rate = (number of seedlings/total number of seeds) × 100%.

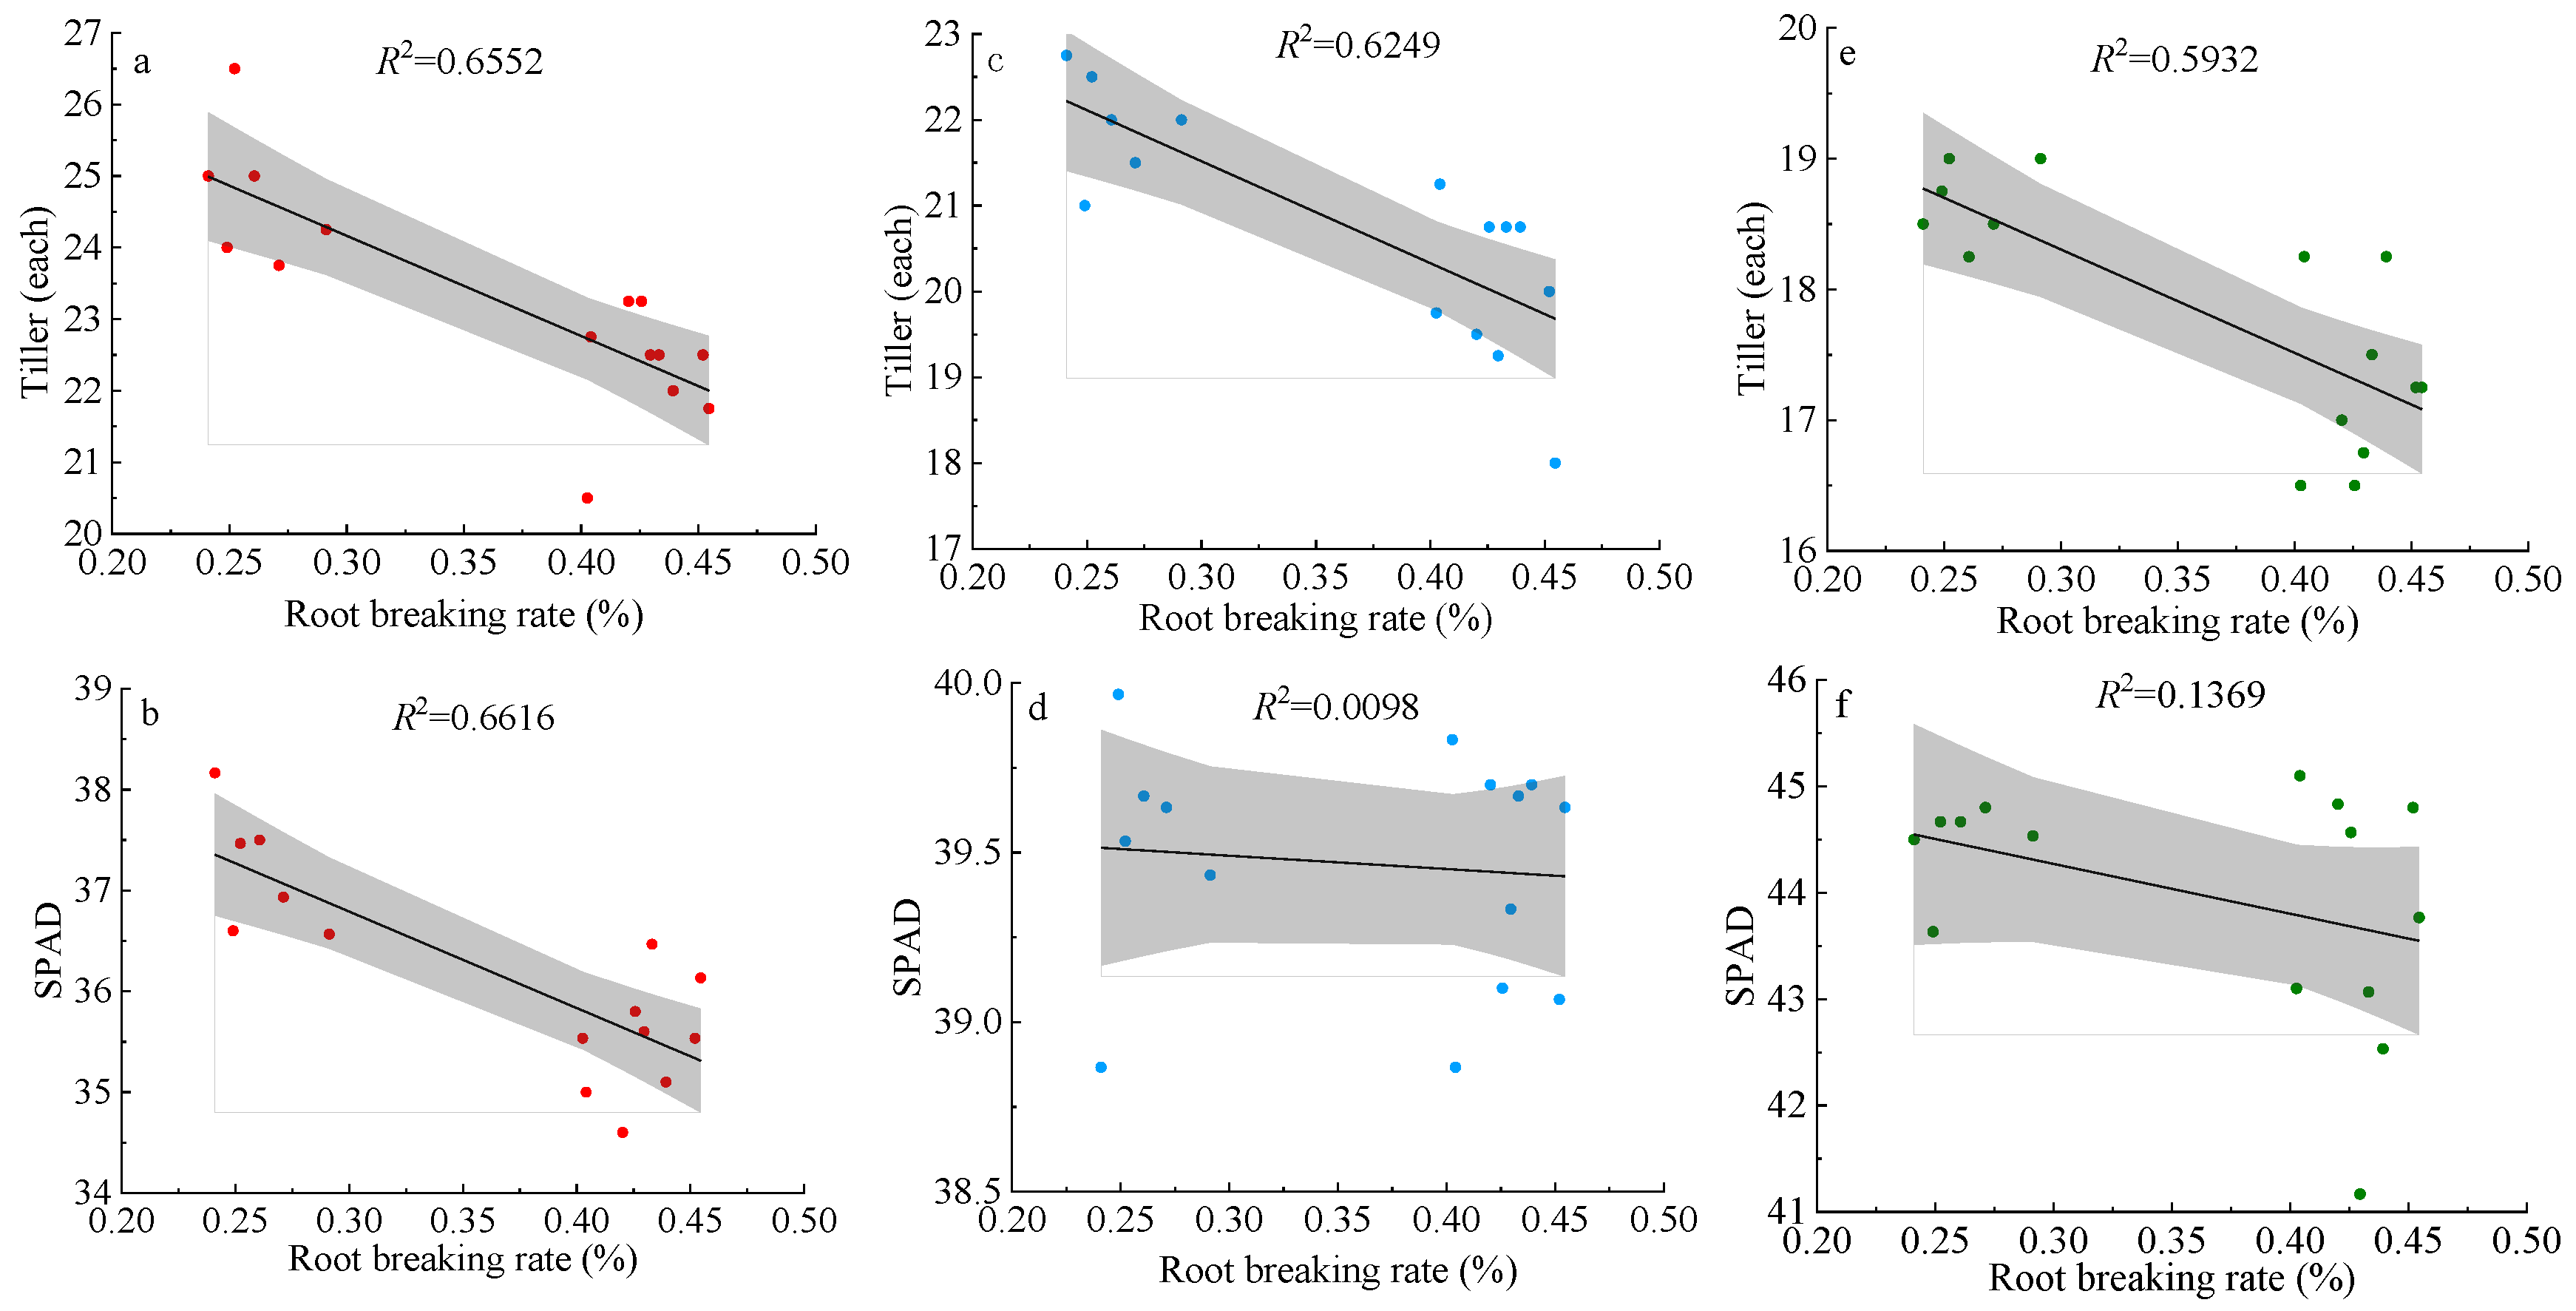
2.3.3. Root Breaking Rate

Before transplanting, a sharp blade was used to simulate machine transplanting. The potted blanket seedlings were cut into pieces based on the size of the pot body. The blanket seedlings grown on the flat plate were also cut into pieces according to the size of the corresponding pot body. The root breaking rate was calculated as follows:
Root breaking rate = (root breaking weight/total root weight) × 100%.

2.3.4. SPAD Value, Plant Height, Number of Tillers, and Leaf Area Index

The SPAD value, plant height, number of tillers, and leaf area index of rice were measured in the tillering, booting, and full-heading stages. The plant height and SPAD value of each growth stage were measured using a straight ruler and the SPAD502 instrument. The number of tillers and leaf area index in each growth stage were obtained by manual counting.

2.3.5. Determination of Leaf Enzyme Levels

The leaves were collected in the tillering, booting, and full-heading stages; 10 flag leaves were collected from each plot. The levels of glutamate dehydrogenase (GDH), glutamate synthetase (NADH-GOGAT), glutamine synthetase (GS), and nitrate reductase (NR) were determined using corresponding leaf enzyme kits.

2.3.6. Yield and Yield Formation

The number of effective panicles, the number of grains per panicle, and the thousand-seed weight of rice in each of the four holes were determined, and the actual yield of rice was calculated after drying.

2.3.7. Nitrogen Partial Factor Productivity

The N partial factor productivity (NPFP) was calculated using the relationship between yield and fertilizer amount as follows:
NPFP = Y/F,
where Y is the crop yield, in kg ha−1; and F is the amount of pure N used, in kg ha−1.

2.4. Statistical Analysis

The DPS data-processing system was used to determine the single-factor square difference, and the least significant difference test was used at the probability level of 0.05. All data charts were produced in Microsoft Excel 2021 and Origin 2023. The correlations between the number of tillers and the root breaking rate and between the SPAD value and the root breaking rate during different periods were analyzed. This study analyzed the correlation between yield and N partial productivity and various factors such as the number of tillers, plant height, SPAD value, and leaf enzyme levels during different periods.

3. Results

3.1. Effects of Controlled-Release Urea Contact Application on Rice Seedling Growth and Seedling Quality

The controlled-release urea contact application resulted in an inhibitory effect on rice seedling emergence but improved seedling quality. Further, 50% CRU + BT and 50% CRU + BT + S also reduced the root breaking rate during seedling transplantation (Table 2). Compared with farmers’ routine (FFP), the emergence rate under four reduced fertilization treatments (50% CRU, 50% CRU + S, 50% CRU + BT, 50% CRU + BT + S) decreased by 7.70–11.87%. Compared with the FFP, the plant height on the 12th day of emergence increased by 17.33–24.54%. Among the four seedling quality indexes, except for uniformity, the effect of reduced fertilization treatment was better than that of conventional treatment. Compared with the FFP, the above-ground dry weight increased by 75.29–81.43%, the enrichment increased by 45.45–63.64%, and the seedling index increased by 40.00–70.00%. The uniformity decreased by 3.77–4.91%. The root breaking rate under 50% CRU + BT and 50% CRU + BT + S treatments significantly decreased by 35.94–42.50% compared with that under flat plate treatments (FFP, 50% CRU, 50% CRU + S). A scatter fit was conducted between the root breaking rate, the number of tillers, and the SPAD value in the three growth stages after transplanting (Figure 2). The results showed that the number of tillers and the SPAD value in the tillering stage were linearly correlated with the root breaking rate (R2 > 0.65). That is, the lower root breaking rate significantly affected the number of tillers and the SPAD value in the tillering stage.

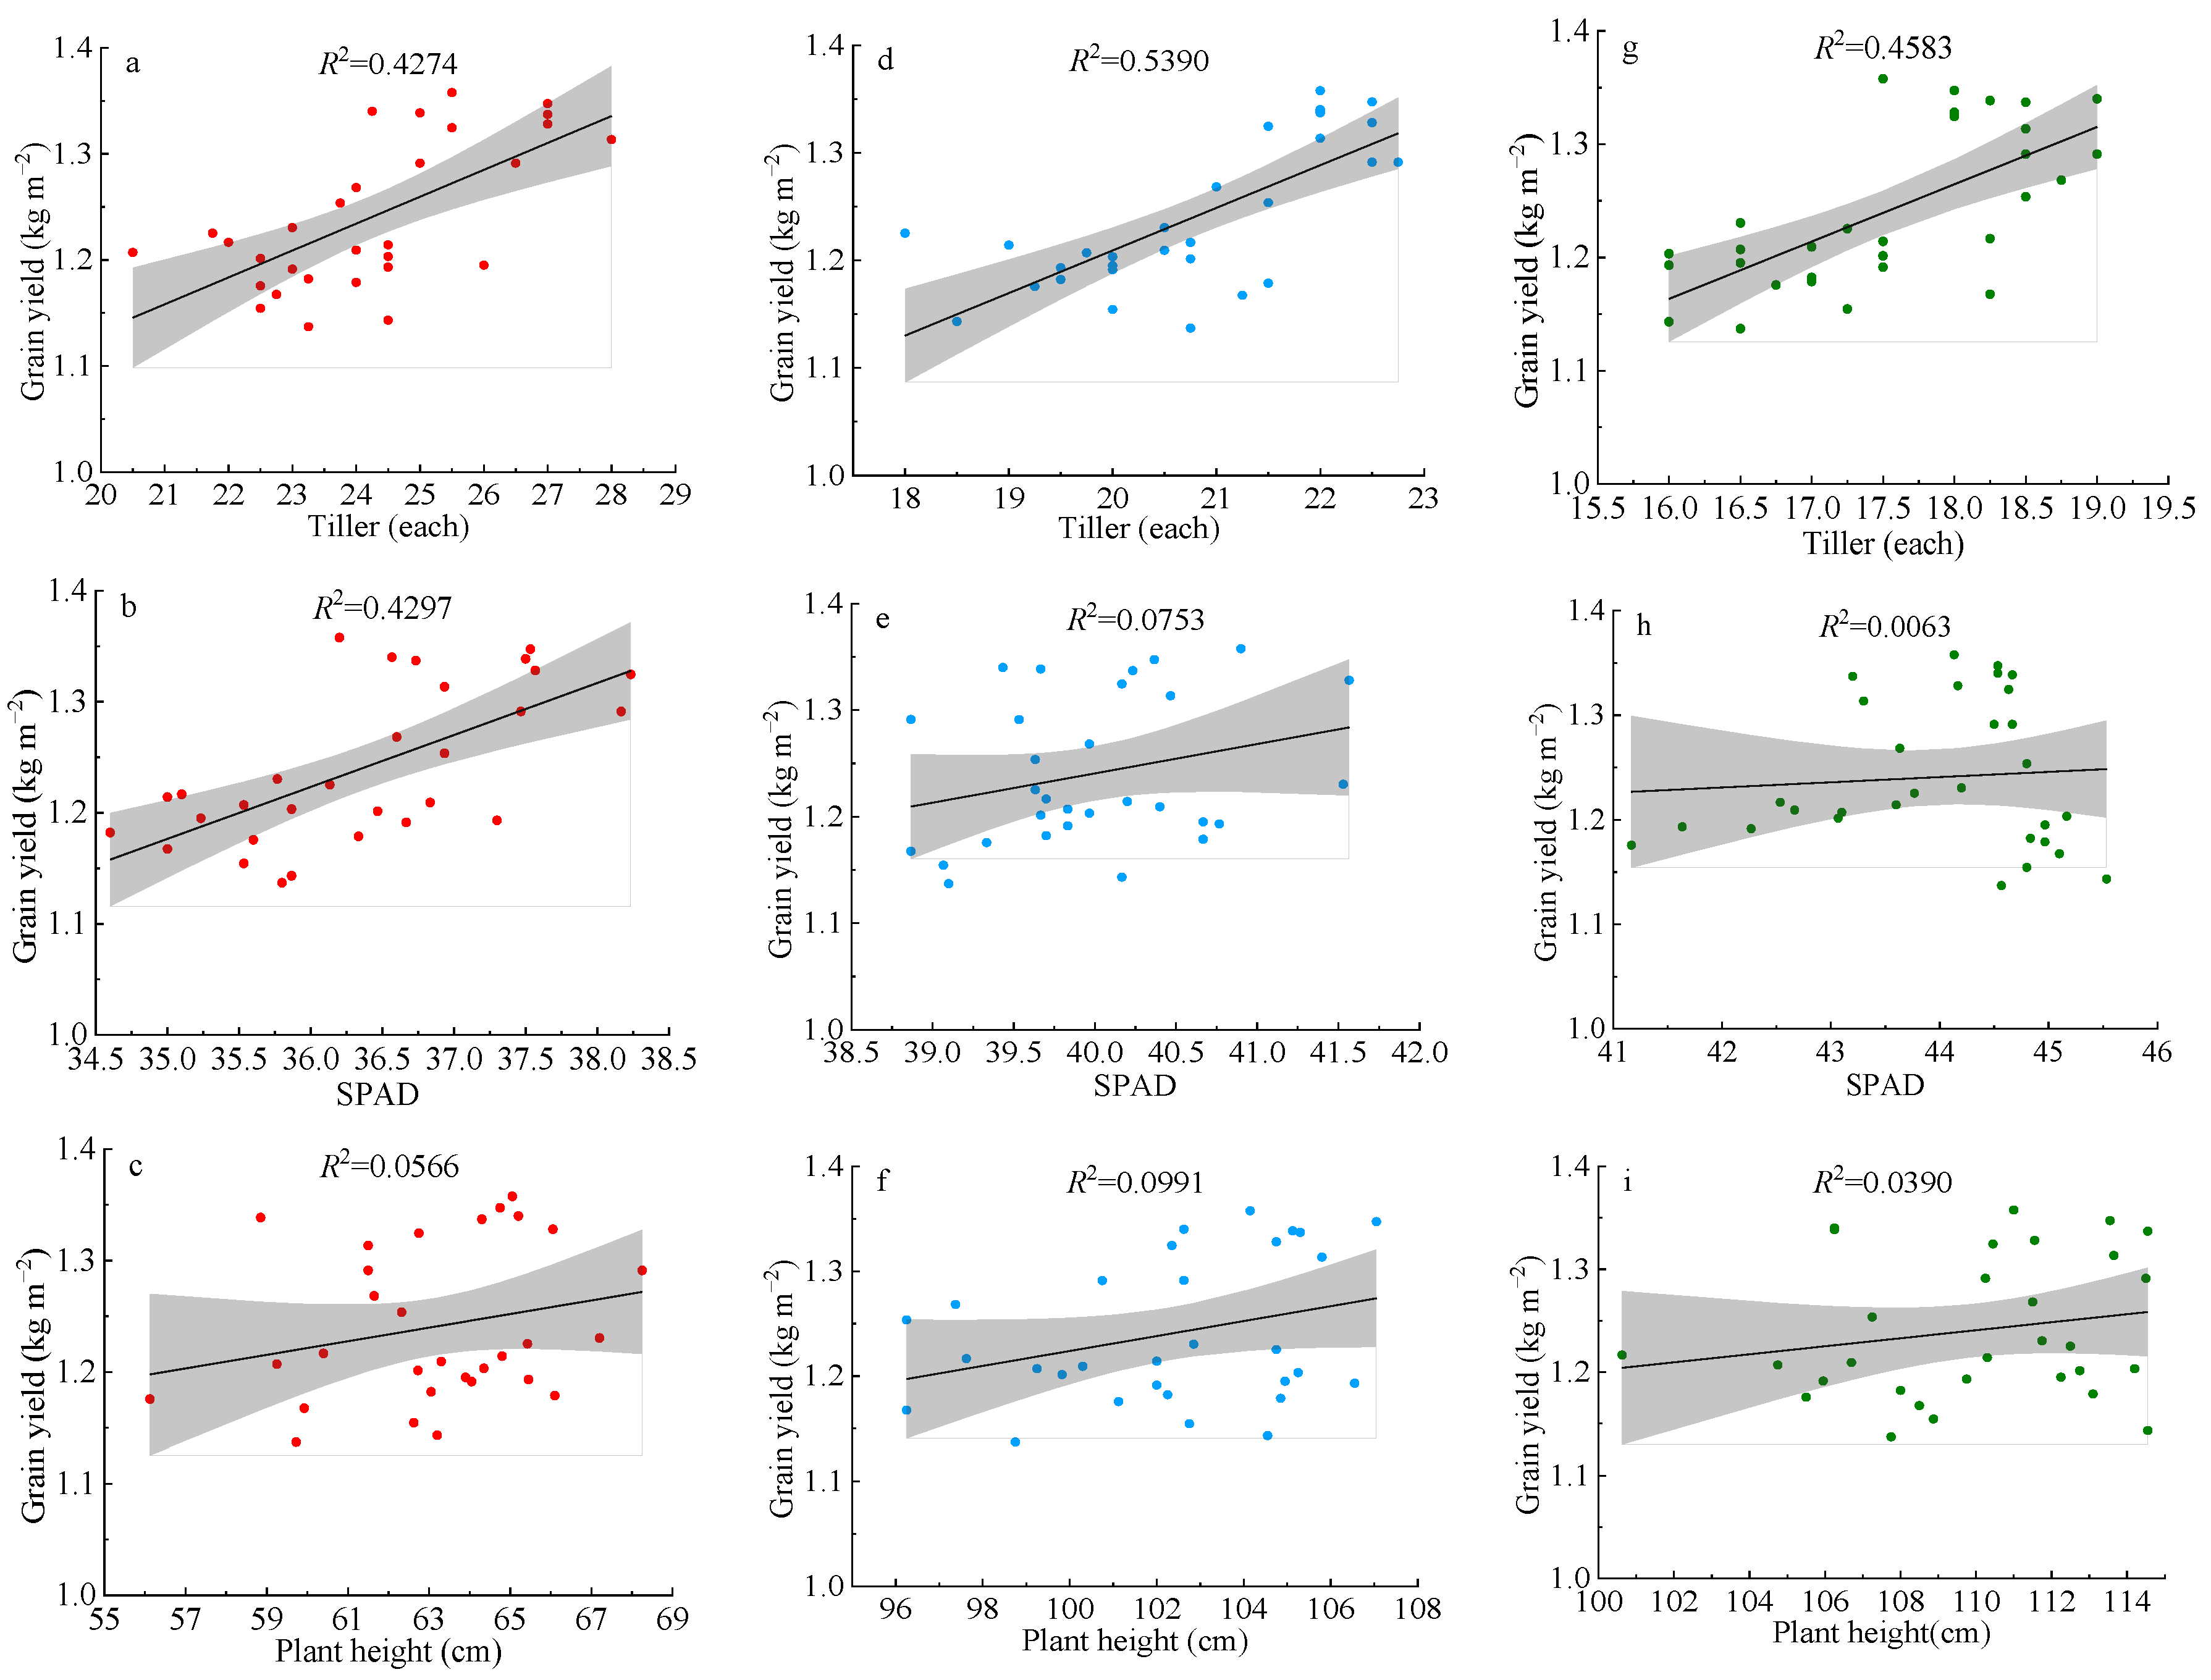
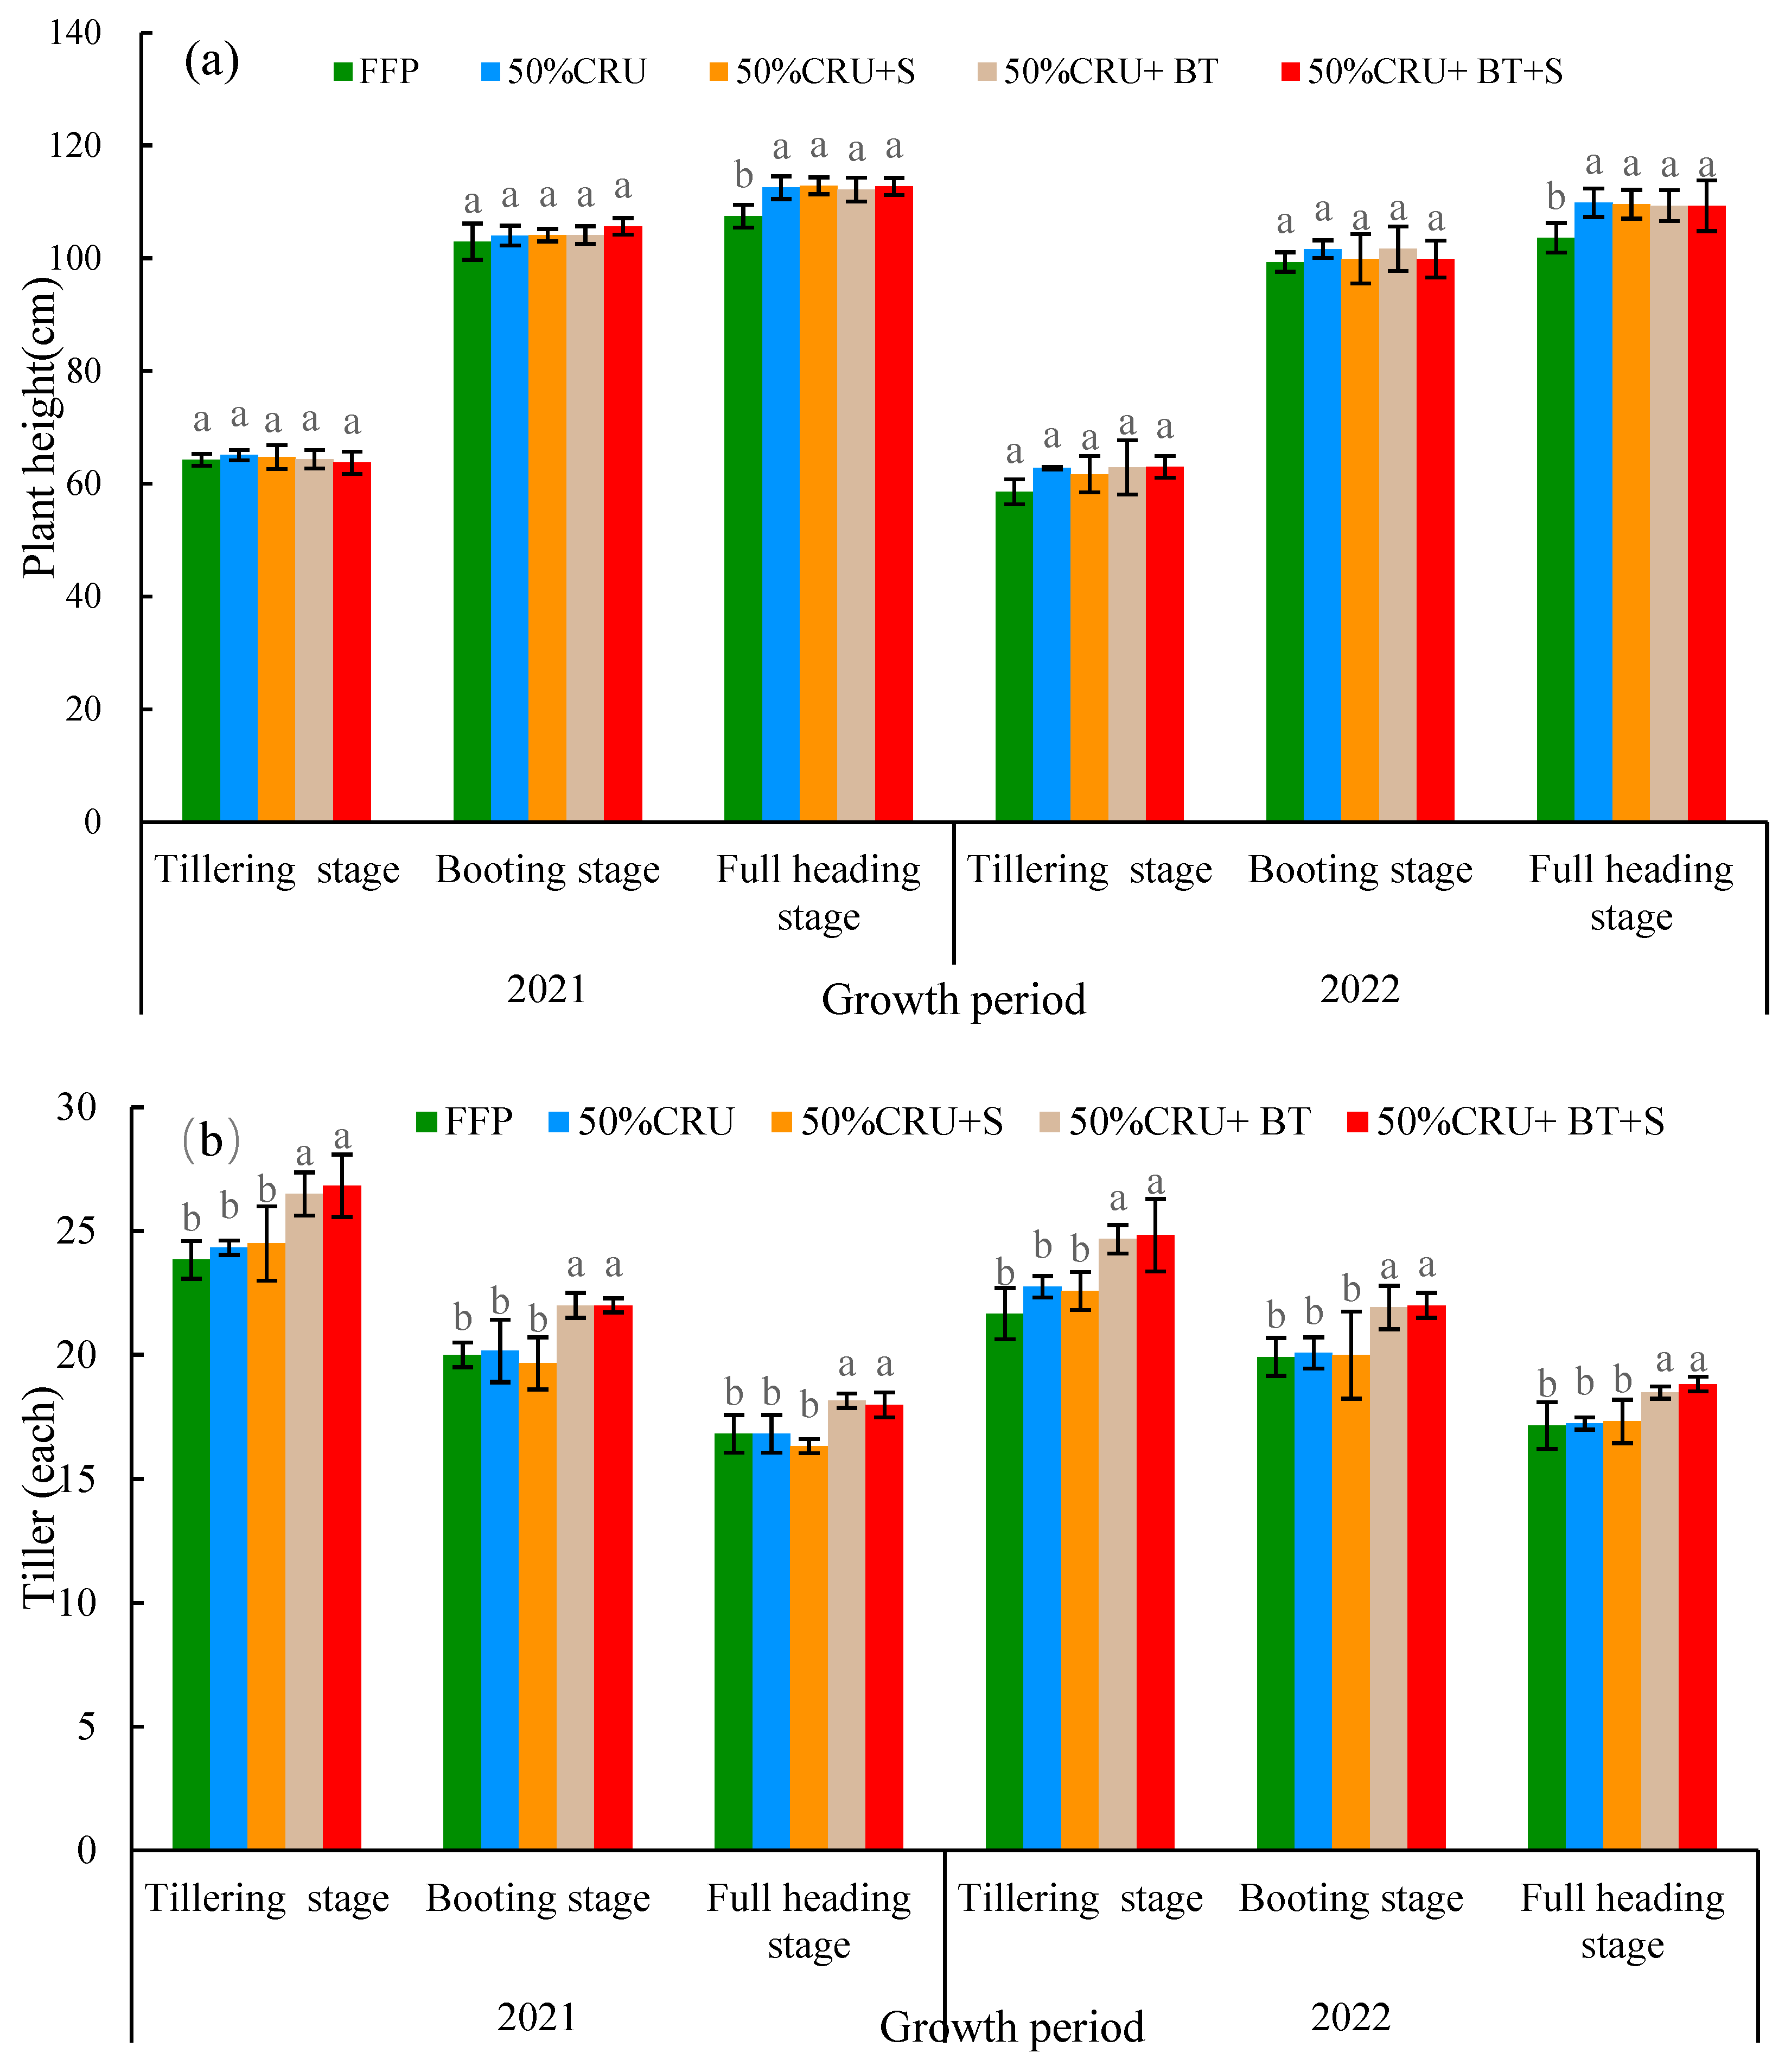
3.2. Effects of Controlled-Release Urea Contact Application on Plant Height and Number of Tillers of Rice in Different Growth Stages

In 2021 and 2022, the plant height under each treatment showed the same trend (Figure 3a); it gradually increased upon moving from one stage to another stage. Compared with the FFP, the plant height in the tillering and booting stages showed no significant difference under the four reduced N treatments. In the full-heading stage, the FFP under the four reduced fertilization treatments was different from that under the conventional treatment; the plant height significantly increased by 4.38–5.01% in 2021 and 5.50–6.06% in 2022. The number of tillers during different periods in the 2 years showed the same pattern (Figure 3b); it gradually decreased with time. Compared with other treatments, the number of tillers in 2021 significantly increased by 7.55–11.18% in the tillering stage, by 8.33–10.61% in the booting stage, and by 6.48–10.09% in the full-heading stage. In 2022, the number of tillers under two optimal treatments (50% CRU + BT, 50% CRU + BT + S) significantly increased by 7.78–13.00% compared with that under other treatments (8.38–9.13% in the booting stage and 6.31–9.00% in the full-heading stage). No significant difference was observed in the number of tillers between the FFP and 50% CRU/50% CRU + S.

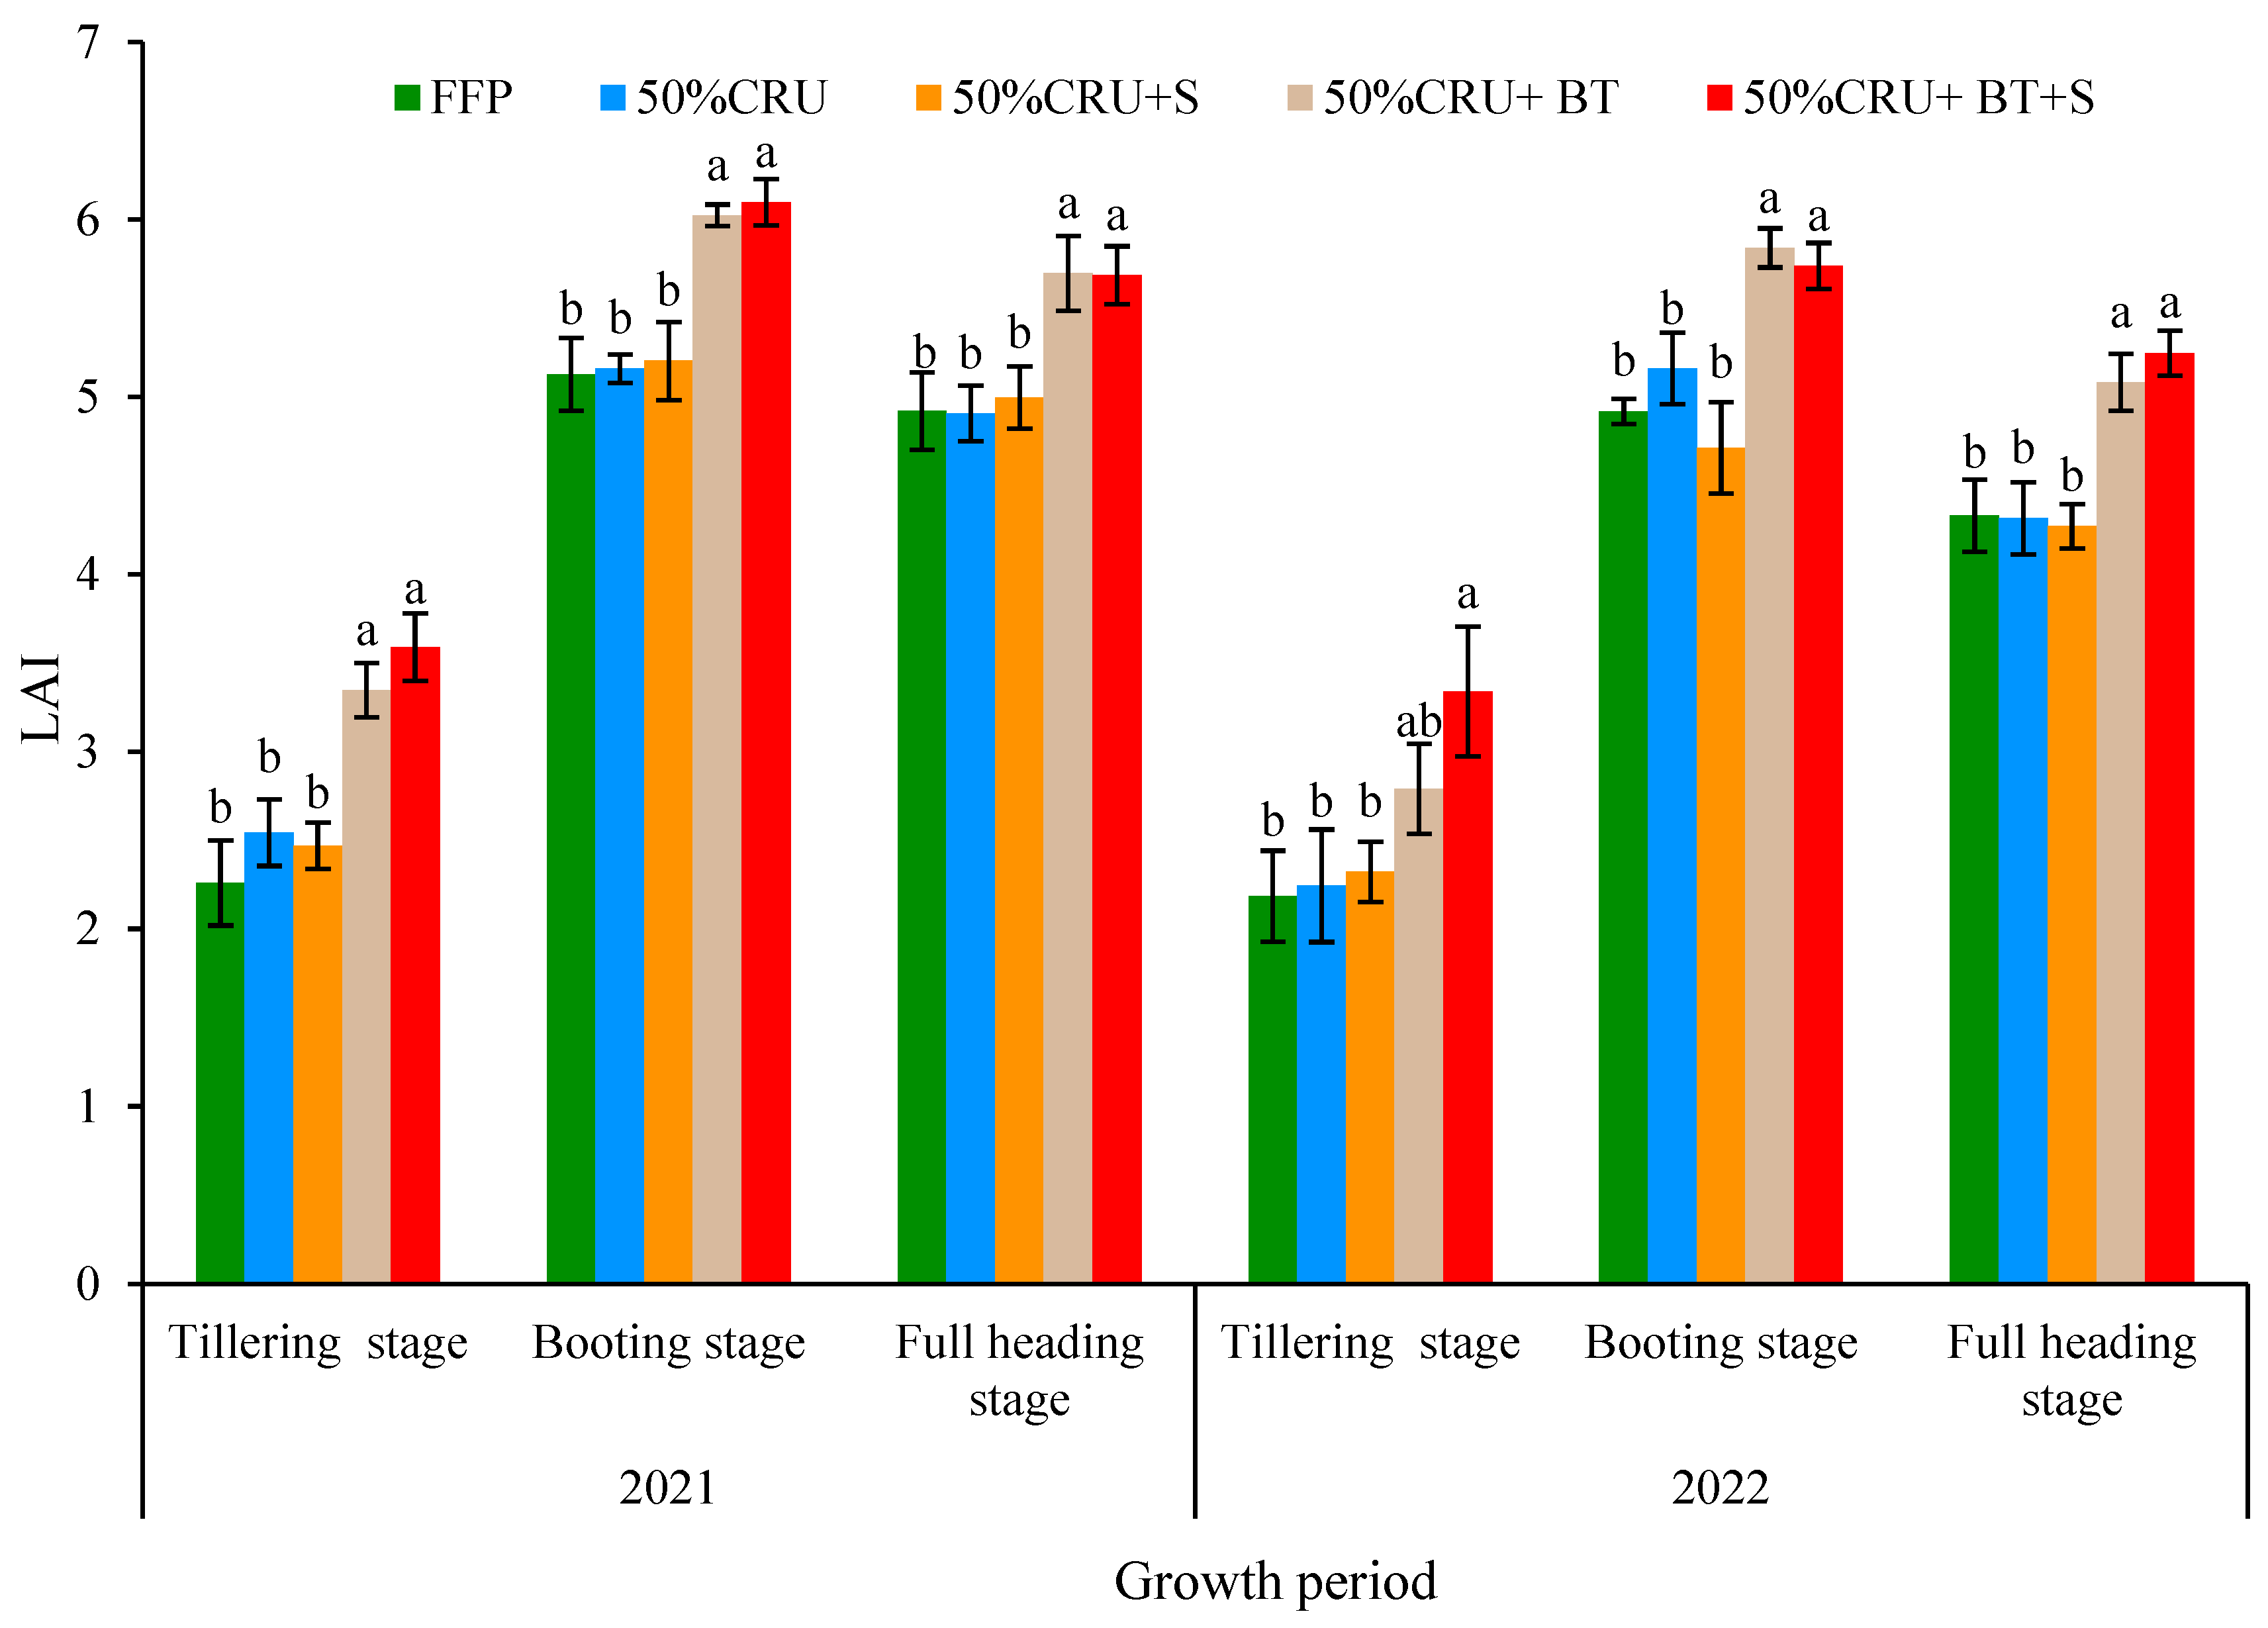
3.3. Effects of Controlled-Release Urea Contact Application on Leaf Area Index of Rice in Different Growth Stages

The leaf area increased with the increase in time, and the leaf area index showed the same regular trend in the interannual repetition (Figure 4). The leaf area index under 50% CRU + BT and 50% CRU + BT + S treatments was significantly higher than that under 50% CRU and 50% CRU + S treatments (except the tillering stage in 2022), and no significant differences were observed between 50% CRU and 50% CRU + S. In 2021, the leaf area index under 50% CRU + BT and 50% CRU + BT + S treatments significantly increased by 24.00–34.05% compared with that under other treatments (13.61–15.91% in the booting stage and 12.13–13.87% in the full-heading stage). In 2022, the leaf area index under 50% CRU + BT and 50% CRU + BT + S treatments significantly increased by 16.75–34.55% compared with that under other treatments (10.04–19.30% in the booting stage and 14.81–18.60% in the full-heading stage).

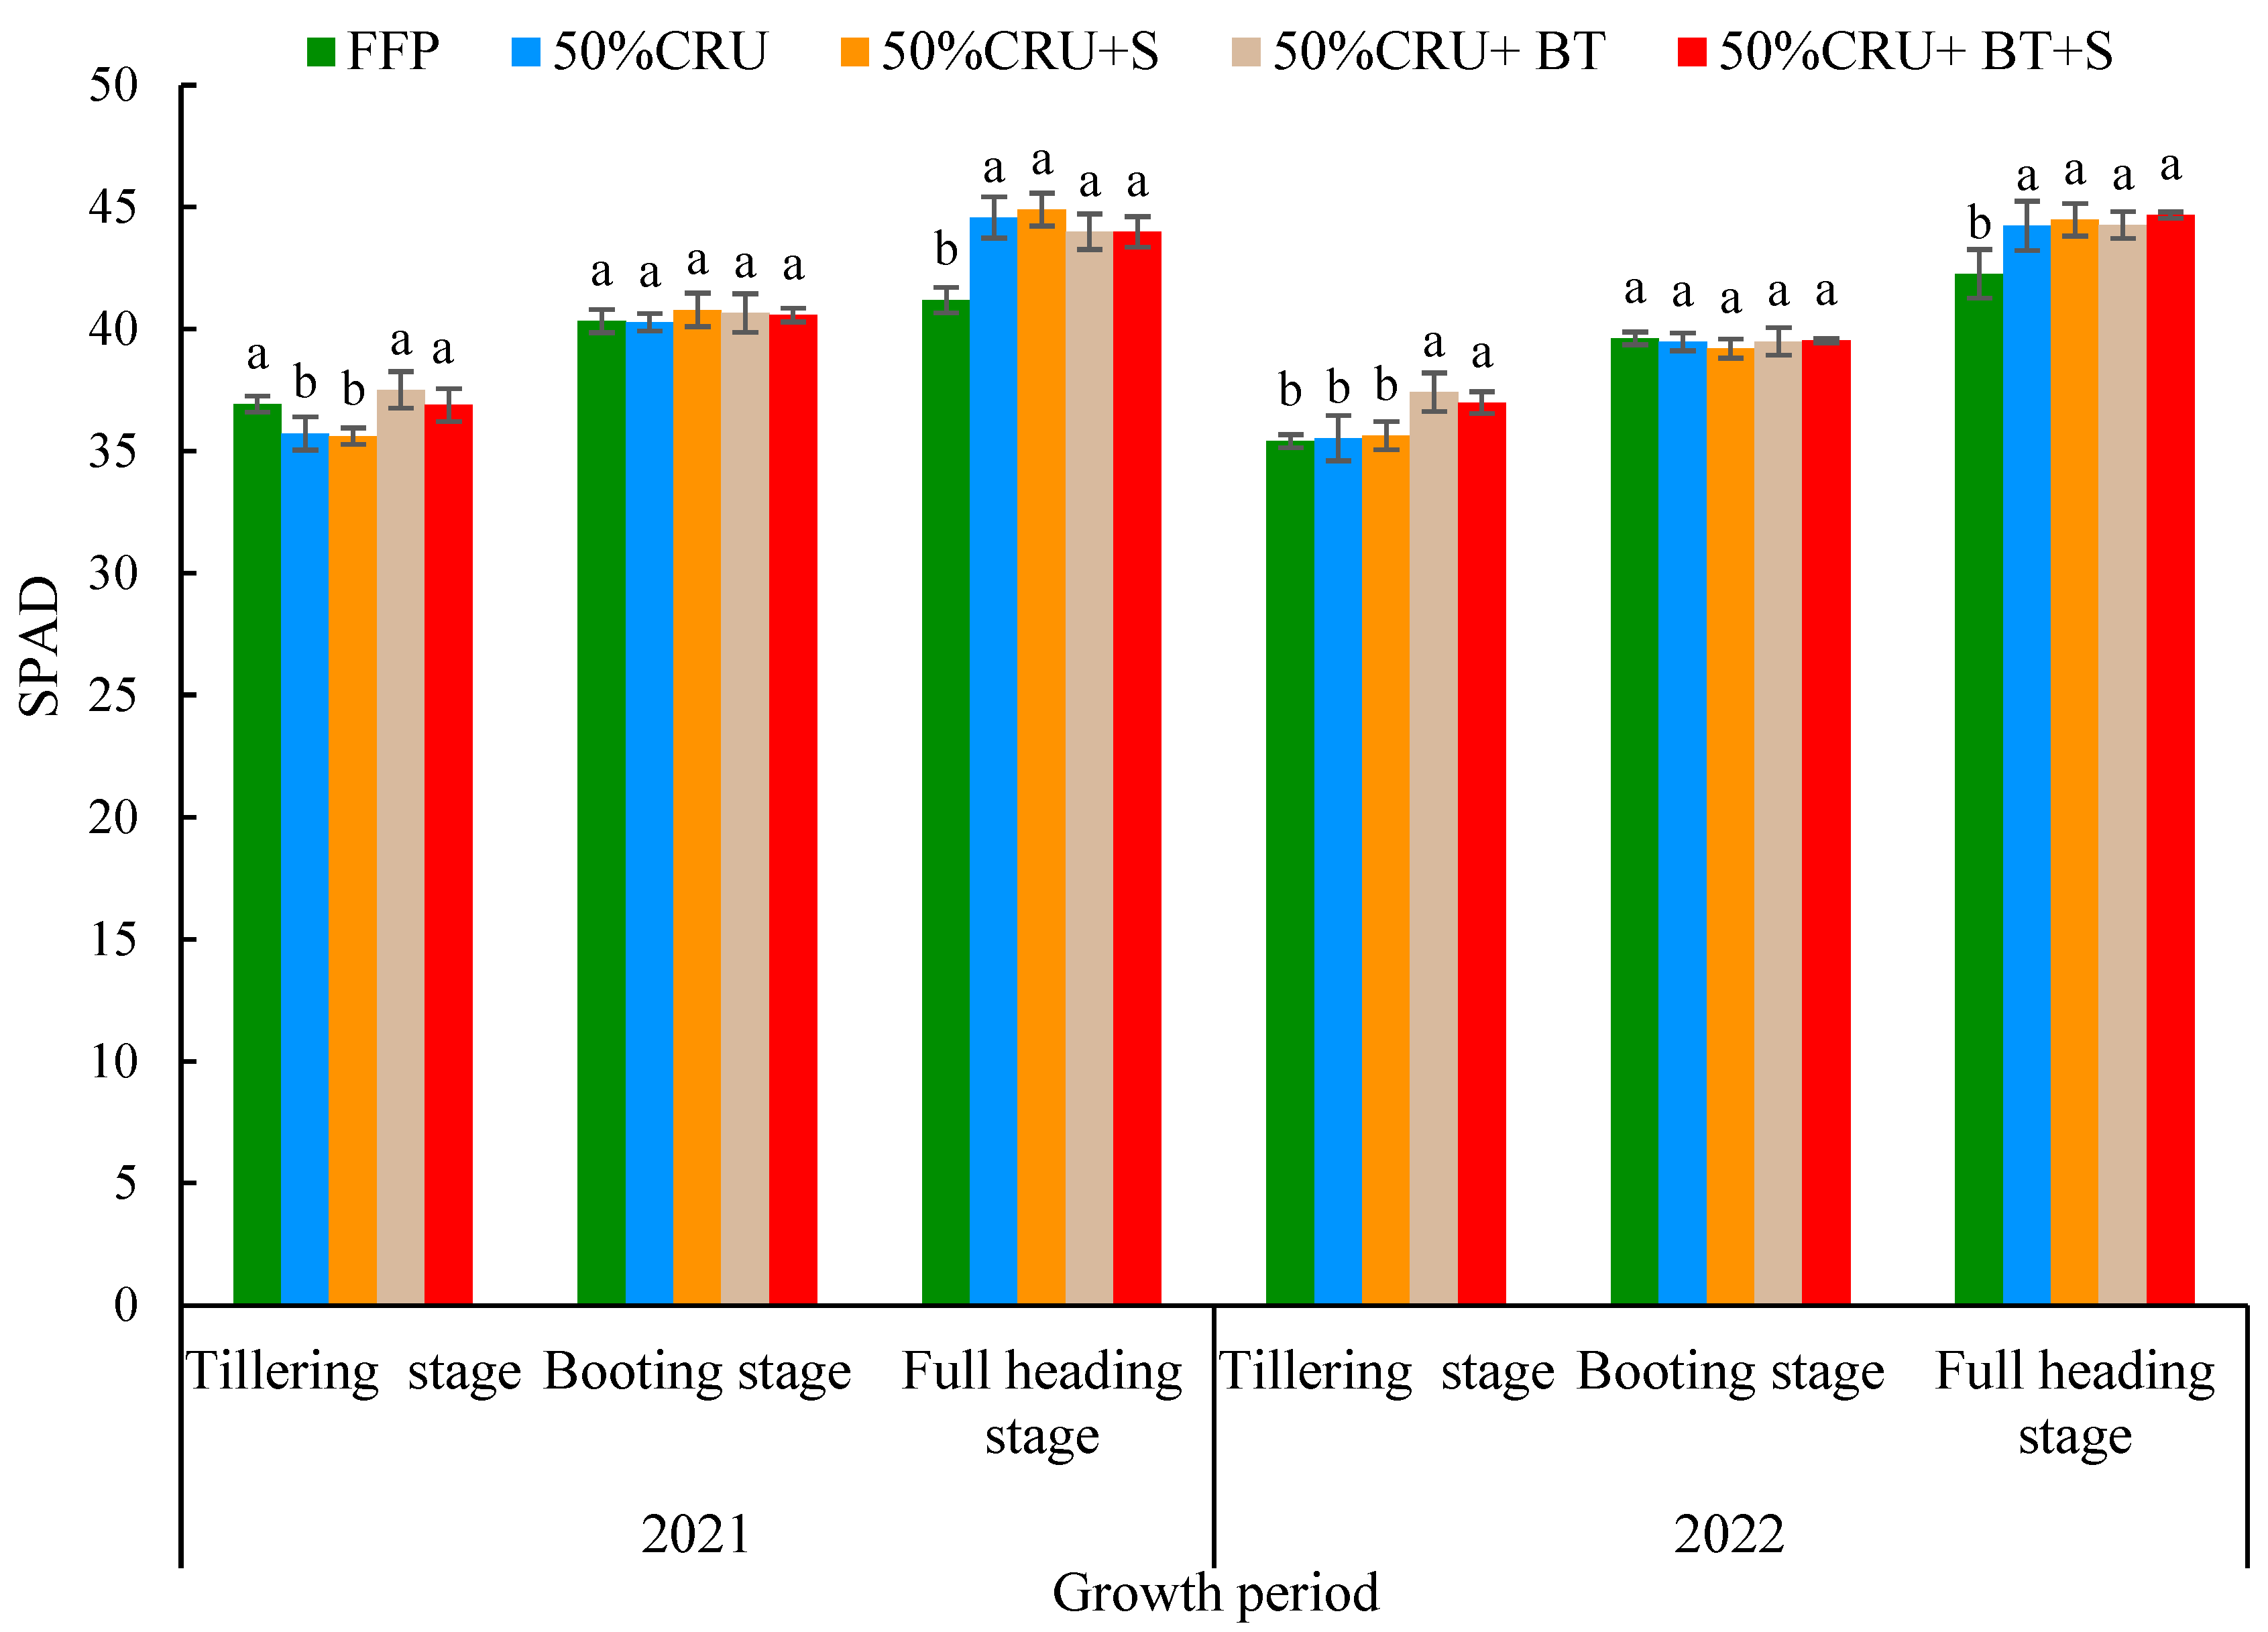
3.4. Effects of Controlled-Release Urea Contact Application on SPAD in Different Growth Stages of Rice

The SPAD values of rice in different growth stages followed different trends (Figure 5). No difference was observed in the SPAD values between the FFP and 50% CRU + BT/50% CRU + BT + S treatments in the tillering stage in 2021. However, the values were significantly higher than those under 50% CRU and 50% CRU + S treatments, with a significant increase of 3.25–5.21%. The SPAD values under 50% CRU + BT and 50% CRU + BT + S treatments were significantly higher than those under the FFP, 50% CRU, and 50% CRU + S treatments in the tillering stage in 2022, with a significant increase of 3.97–5.68%. No significant difference was found in the SPAD value under each treatment in the booting stage in 2 years. After reaching the full-heading stage, significant differences were found between the four fertilization treatments and the farmers’ conventional treatments. The SPAD value under fertilization treatments significantly increased by 6.80–9.01% in 2021 and 4.64–5.68% in 2022 compared with the FFP treatment.

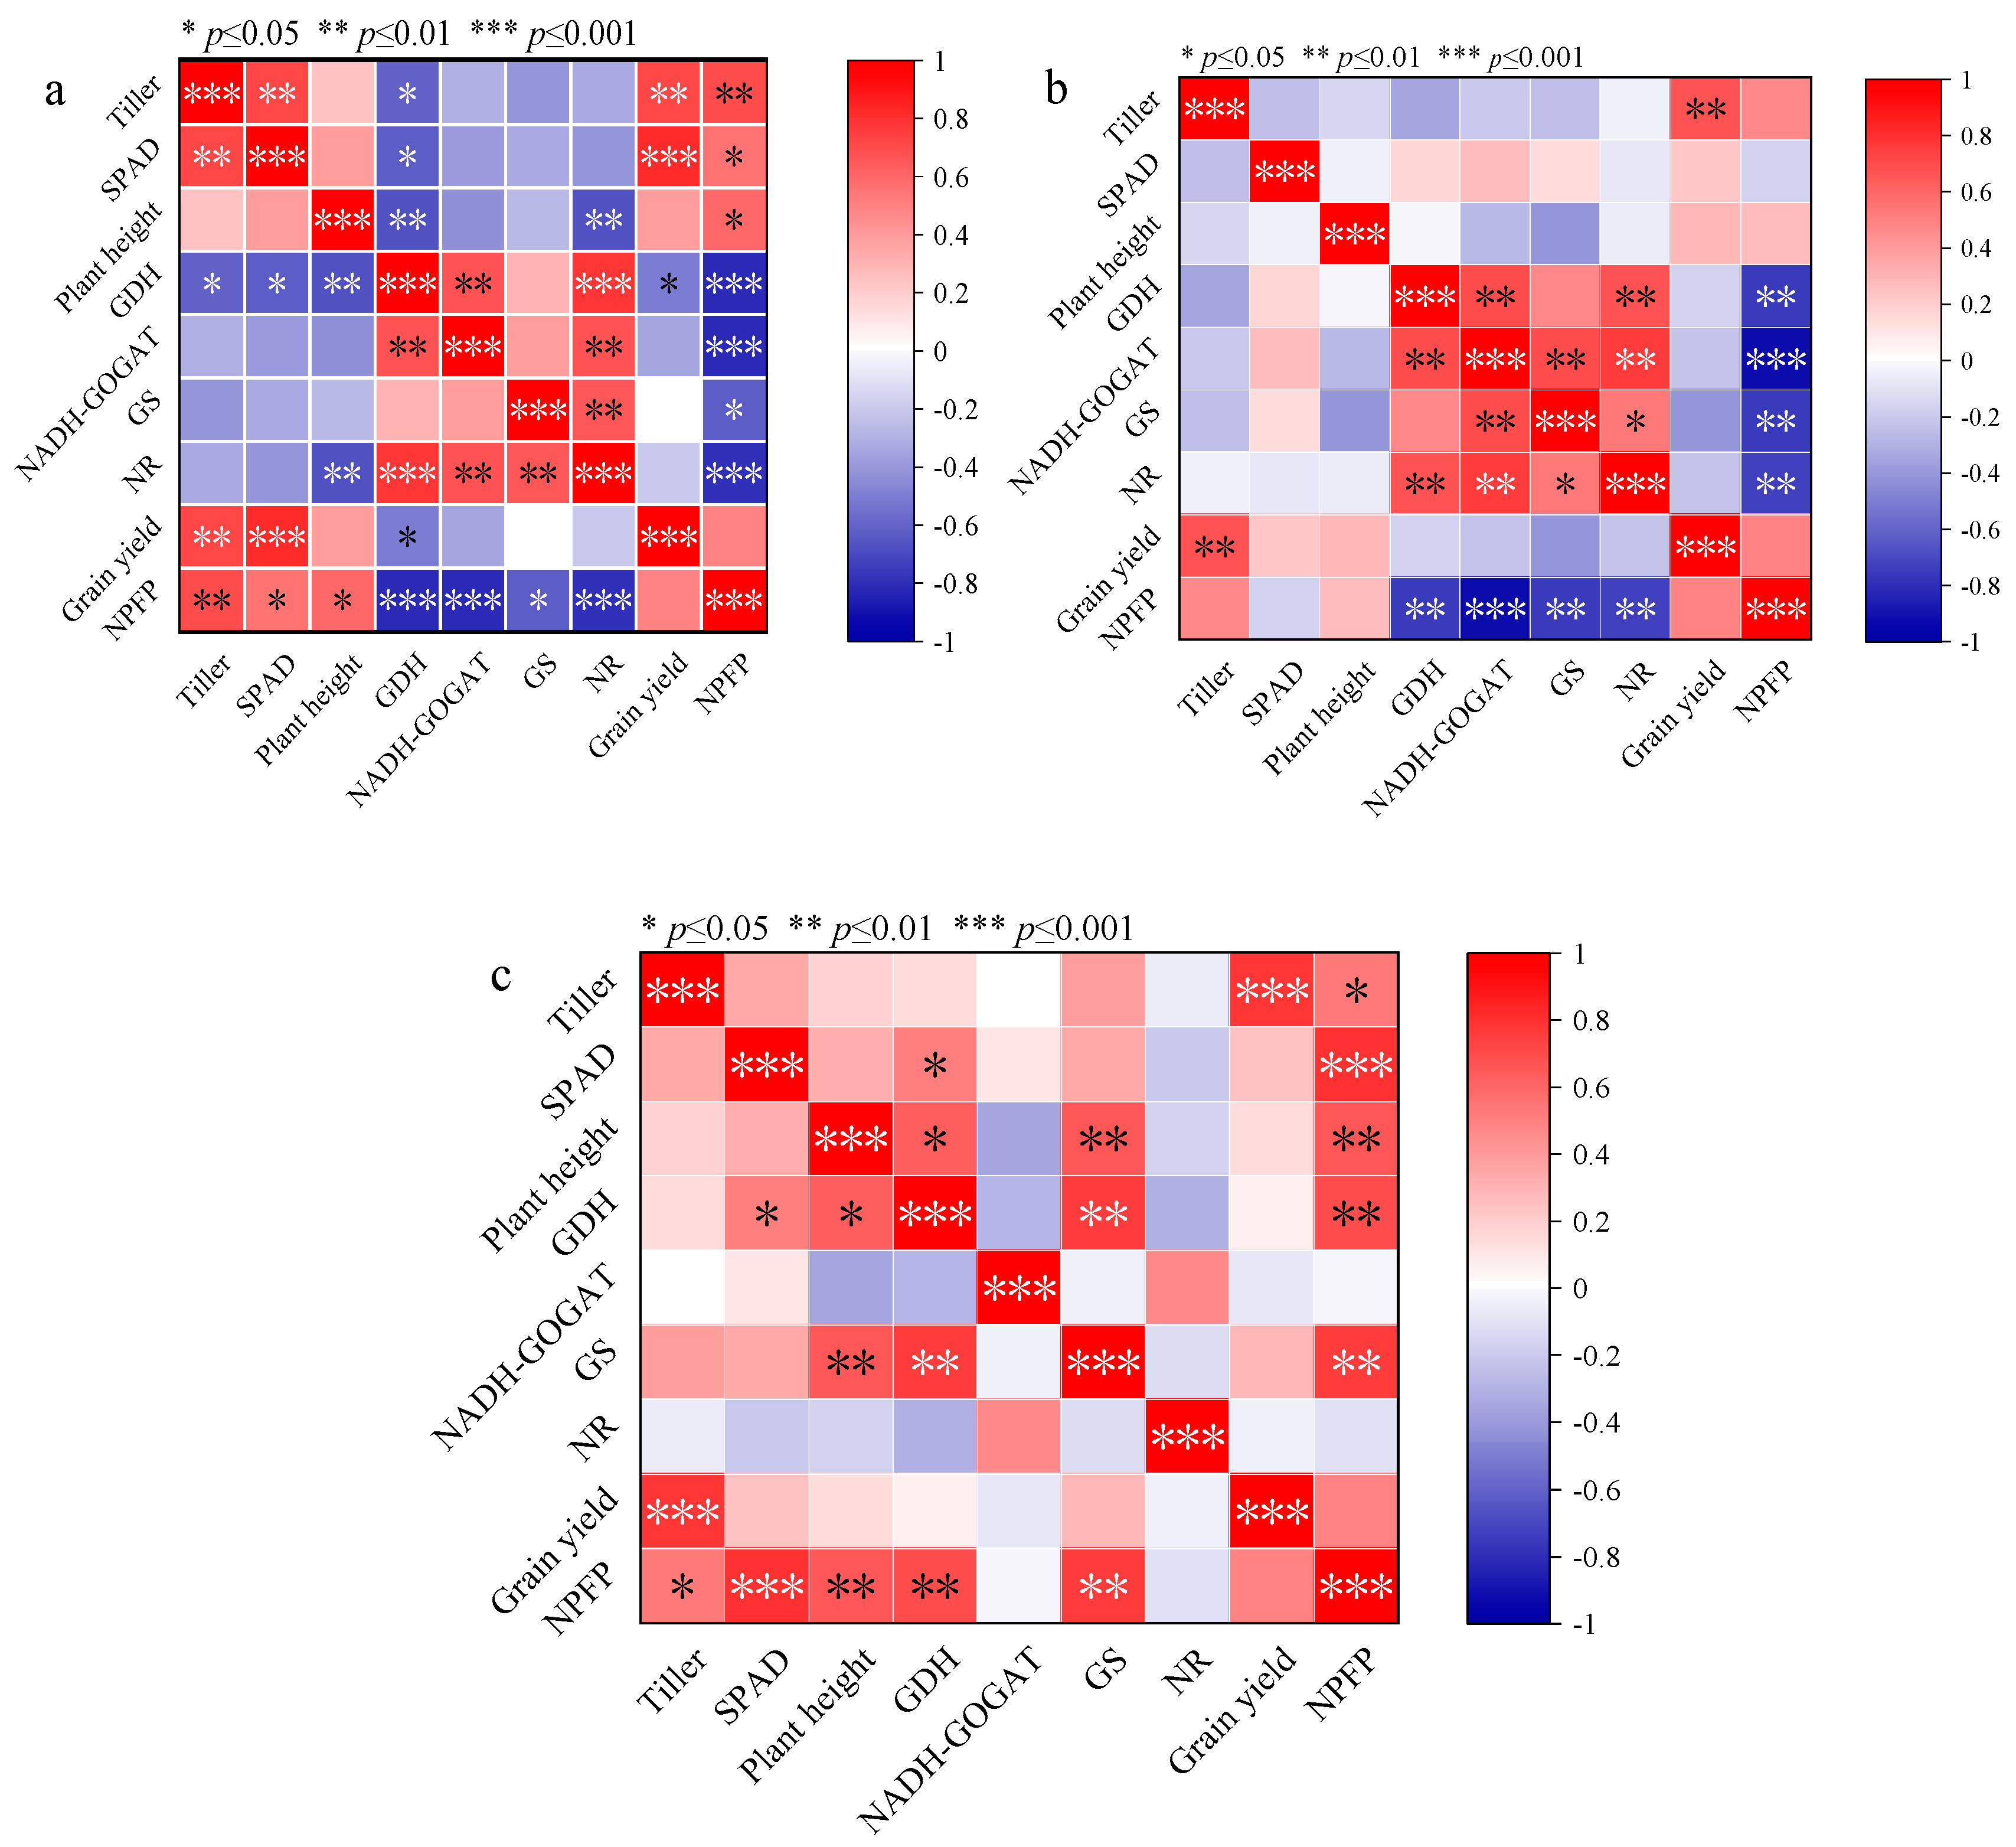
3.5. Effects of Controlled-Release Urea Contact Application on Leaf Enzyme Levels in Different Growth Stages of Rice

The four enzymes were the key enzymes in the process of N transfer, and their contents were significantly higher in the two topdressing stages (tillering and booting stages) under conventional treatment than under the four treatments with controlled-release urea (Table 3). Specifically, the GDH levels significantly increased by 5.13–8.29% in the tillering stage and 5.80–6.97% in the booting stage under the FFP compared with four controlled-release urea treatments. The NADH-GOGAT levels significantly increased by 5.68–8.21% in the tillering stage and 10.30–10.80% in the booting stage. The GS level significantly increased by 13.38–16.33% in the tillering stage and 15.51–20.65% in the booting stage. The NR enzyme levels significantly increased by 2.83–3.72% in the tillering stage and 4.98–6.05% in the booting stage. In the full heading stage, the GDH and GS enzymes under four controlled-release urea treatments were significantly higher than those under the FPP. However, no significant differences were found in the NADH-GOGAT and NR levels between the four controlled-release urea treatments and FPP. The GDH and GS levels significantly increased by 4.50–6.09% and 8.15–12.22% under four controlled-release urea treatments compared with the FFP.

3.6. Yield and N Partial Productivity under Each Treatment

The data in the two interannual repeats (Table 4) showed that the yield formation factor affecting the final yield was the number of effective panicles. The number of effective panicles under 50% CRU + BT and 50% CRU + BT + S treatments was higher than those under the other three treatments in 2 years and significantly increased by 11.62–16.31% in 2021 and 7.32–14.60% in 2022. No significant difference was observed in the number of effective panicles and 1000-grain weight among all treatments. The yields observed under 50% CRU + BT and 50% CRU + BT + S treatments exhibited a similar trend, attributed to the influence of the number of effective panicles. The yield significantly increased by 10.83–12.61% and 7.50–10.17% under the 50% CRU + BT + S treatment compared with the other three treatments in 2021 and 2022, respectively. The regularity of N fertilizer partial productivity in the 2 years was the same (Table 4).
In 2021, treatments with 50% CRU + BT and 50% CRU + BT + S showed a significant increase of 10.94–12.61% compared with 50% CRU and 50% CRU + S. Additionally, it exhibited a significant increase of 122.02–123.63% compared with the FFP. Also, compared with the FFP, treatments with 50% CRU and 50% CRU + S showed a significant increase of 98.60–100.13%. In 2022, treatments with 50% CRU + BT and 50% CRU + BT + S displayed a significant increase of 9.81–10.43% compared with 50% CRU and 50% CRU + S. Moreover, they showed a substantial increase of 115.89–116.61% compared with the FFP. Further, compared with the FFP, treatments with 50% CRU and 50% CRU + S exhibited a significant increase of 96.15–96.60%. The linear fitting of yield with the number of tillers, SPAD, and plant height during the three periods showed that the yield and number of tillers had an obvious linear fitting, indicating that the yield and number of tillers during each period were positively correlated. Therefore, the increase in the number of tillers increased the yield (Figure 6). The number of tillers, SPAD value, plant height, and levels of four leaf enzymes (GHD, NADH-GOGAT, GS, NR) and N partial productivity during the three periods were analyzed using the heat map. A significant positive correlation was observed between the yield and number of tillers in the three stages (p < 0.01) and the SPAD value in the tillering stage (p < 0.001). Also, a significant positive correlation was noted between the N partial productivity and the number of tillers, SPAD value, and plant height in the tillering stage (p < 0.05). The yield was significantly positively correlated with the number of tillers, SPAD value, plant height, and levels of two leaf enzymes in the full-heading stage (p < 0.05) (Figure 7).

4. Discussion

4.1. Quality of Seedlings under Contact Fertilization and Optimal Management of Controlled-Release Fertilizers

In this study, no direct correlation was found between seedling emergence rate and seedling quality after emergence. When the emergence rate under the four fertilization treatments (50% CRU, 50% CRU + S, 50% CRU + BT, 50% CRU + BT + S) was significantly lower than that under the FFP treatment, the seedling quality (except uniformity) under the four fertilization treatments was significantly better than that under the FFP treatment. Ref. [17] showed that the N input during seedling rearing significantly affected the increase in rice emergence rate. However, the results of this study were contrary to those obtained in the present study. This was because the present study applied N as solid particles (controlled-release urea) together with seeds and nursery soil in the nursery pan. The controlled-release urea occupied part of the nursery pan and reduced the volume of nursery soil, decreasing the nursery environment’s ability to retain water. In addition, the slow release of controlled-release urea around the seeds resulted in a relatively high salt concentration, which affected seed germination and reduced the emergence rate. The seedling quality significantly improved after fertilization, which was consistent with previous findings [17]. The nutrient absorption of rice is directly related to the root system, and a good root system significantly contributes to the photosynthetic rate, stress resistance, and rice yield [18,19].
In this study, the 50% CRU + BT and 50% CRU + BT + S treatments adopted Boxingtanzhuang (in Chinese) seedling trays. The root system was divided into cells at the bottom of the tray, resulting in a significantly lower root breaking rate compared with other treatments (Table 2). This provided a better guarantee for the growth of rice after transplanting. The shock damage of rice roots during machine transplanting prolonged the recovery period of seedlings, and the delay in entering the tillering stage limited the number of panicles, which was the main controlling factor for the yield of rice transplanting by a machine [20,21]. The number of tillers and SPAD values under all treatments in each stage showed a certain linear correlation with the root breaking rate during seedling transplantation (the lower the root breaking rate, the higher the number of tillers and SPAD value) (Figure 2). In this study, the 50% CRU + BT and 50% CRU + BT + S treatments were conducted in BTs. The photosynthetic rate, number of effective panicles, and yield were significantly higher than those under the other treatments (Figure 3b, Figure 4 and Figure S2, Table 4). This showed that the BTs could reduce the root damage during machine transplanting, thus facilitating transplanting into the field with a lower root damage rate, entering the tillering stage earlier, and achieving a higher yield with more panicles.

4.2. Effects of Contact Fertilization and Optimal Management of Controlled-Release Fertilizers on N Transferase Level, SPAD Value, and Photosynthetic Rate of Rice

GHD, NADH-GOGAT, GS, and NR all play important roles in the N metabolism of rice [22,23,24]. The controlled-release urea used in this study was less in the early stage and released in large quantities in the middle and late stages (Figure 1b). The four controlled-release urea treatments were applied with one-time fertilization, whereas the FFP treatment was applied with topdressing. The activities of GHD, NADH-GOGAT, GS, and NR under the four controlled-release urea treatments were significantly higher than those under the four controlled-release urea treatments in the tillering and booting stages (Table 3). This indicated that N metabolism under the FFP treatment reached a higher level after applying tillering and ear fertilizer. Ref. [25] believed that deep N fertilization in the tillering stage could improve the activity of N-metabolizing enzymes in rice, thus providing the basis for improving the N use efficiency of rice. It was consistent with the conclusion reached in the present study. Further, the parameters of plant height, number of tillers, SPAD value, leaf area index, and the FFP showed no significant differences in the tillering and booting stages compared with those under the two nonoptimal fertilization treatments (50% CRU, 50% CRU + S). This suggested that in this study, controlled-release urea was applied once and reduced by 50% along the root system, which was deeply embedded in the soil. The amount of accumulated N absorbed and assimilated by rice was consistent with the amount accumulated by rice after the FFP multiple topdressing treatments. In the full-heading stage, the activities of GHD and GS under four controlled-release urea treatments were significantly higher than those under the FFP, indicating that a large amount of controlled-release urea in the later stage maintained the high N metabolism level in rice. The SPAD value was positively correlated with the N concentration in rice leaves [26]. In the tillering stage, the FFP applied tiller fertilizer, and the controlled-release urea treated with four controlled-release urea treatments was also slowly released. The SPAD value under the FFP treatment in the tillering stage was significantly higher than that under 50% CRU and 50% CRU + S treatments (2021), or equal to that under these treatments (2022), which was normal. In 50% CRU + BT, 50% CRU + BT + S, because of the use of BTs, the SPAD value was at a higher level in the tillering stage. The SPAD value under all treatments reached the same level with the continuous release of N by controlled-release urea in the booting stage. The advantages of deep application and continuous release of N by controlled-release urea were evident in the full-heading stage. The SPAD values under the four fertilization treatments were significantly higher than those under the FFP treatment in the full-heading stage, which was caused by the large release of N by controlled-release urea in the later stage.
Previous studies have shown significant effects of the deep application of N fertilizers in terms of improving N use efficiency and promoting the root growth of rice, thus increasing yield [27,28]. The rice seedling box contact fertilization technology is also a deep application technique for N fertilizers. It can maintain the FFP yield even at a 50% reduction (50% CRU, 50% CRU + S). This is because the rice seedling box contact fertilization technology involves direct contact of N fertilizer with the root system. The nutrients released by controlled-release urea are directly absorbed by the rice root system, and N loss is further reduced. In conclusion, excellent N fertilizer management has significant effects on rice growth, yield, and N use efficiency [29]. The application of controlled-release urea could improve the seedling quality, and with high seedling quality after transplanting, the seedlings displayed high stress resistance and passed the slow seedling stage faster. In the later stage, the yield increased due to the high N utilization rate using the box contact fertilization technology, and the application of appropriate N fertilizer in the seedling stage had a significant effect on the seedling quality, which was consistent with the findings of He et al. [30].
The two loading methods in this study had no significant impact on the final result. However, from the perspective of actual operation and future mechanization, the loading method of “S0” was relatively simple, whereas that of “S” required the mixing of seedling soil and fertilizer. This made the operation difficult. However, considering the mixing of soil and fertilizer, it is better to ensure that the fertilizer does not fall off during the machine transplanting process, resulting in the wastage of fertilizer. Further, it is recommended to use the “S” loading method after mechanization.

5. Conclusions

The NBTF combined with the pot blanket seedling tray could achieve an increase in yield when N consumption was reduced by 50%. Also, a stable yield could still be achieved when N consumption was halved using the common seedling tray. This outcome was achievable provided that the root system was developed, the leaf N transferase level increased in the tillering and booting stages, and the chlorophyll content and photosynthetic rate significantly increased. The NBTF technology needs continuous improvement in the seedling emergence rate by increasing the height of the seedling tray. Also, a controlled-release urea dedicated to the rice seedling box contact fertilization technology should be developed. Further, the N release should be as low as possible within 20 days, while the membrane can be easily degraded, potentially facilitating the widespread adoption of NBTF technology.

Supplementary Materials

The following supporting information can be downloaded at: https://www.mdpi.com/article/10.3390/agronomy14040781/s1, Table S1: Soil moisture content and soil specific conductance in seedling experiment (2021 data). Figure S1: photosynthetic rate at booting stage in 2021 and 2022. Figure S2: Relationship between tillering number, leaf SPAD and plant height and nitrogen partial productivity.

Author Contributions

J.L.: writing—original draft preparation, data curation, and editing. Z.D.: investigation. X.M.: investigation and conceptualization. Y.C.: data collection. Z.M.: data collection. Y.Q.: data collection. H.Y.: data collection. J.H.: methodology and reviewing. B.C.: Provide technical support, revise manuscripts, provide funding. All authors have read and agreed to the published version of the manuscript.

Funding

This work is supported by the Beijing Academy of Agriculture and Forestry Sciences Innovation Capacity Building Special (KJCX20230304) and Platform Construction of the Beijing Academy of Agriculture and Forestry Sciences (PT2024-47), the Key Research and Development Plan of Hubei Province in 2022 (2022BBA002), and the Engineering Research Center of Ecology and Agricultural Use of Wetland, Ministry of Education (KF202109).

Data Availability Statement

The original contributions presented in the study are included in the article and Supplementary Materials.

Acknowledgments

We particularly appreciate the guidance of the editor and reviewers on the refinement of this paper.

Conflicts of Interest

The authors declare that they have no known competing financial interests or personal relationships that could have appeared to influence the work reported in this paper.

Abbreviations

NBTFnursery-box total fertilization
Nnitrogen
S0the order being “soil + fertilizer + seed + soil”
Sthe order being “soil mixture + seed + soil”
Bcommon seedling tray
BTBoxingtanzhuang (in Chinese) seedling tray
FFPfarmers’ familiar practice
CRUControlled-release urea
SPADsoil and plant analyzer development. The SPAD value is usually used to indicate the chlorophyll content in the handheld chlorophyll meter, and SPAD is actually the abbreviation of the “Soil and Plant Analyzer Development” of the Agriculture and Horticulture Bureau of the Ministry of Agriculture, Forestry, and Fisheries of Japan. The Japanese are accustomed to using leaf color to study crop yield, quality, and fertilization management, so the SPAD chlorophyll meter is called the leaf color meter, and the SPAD readings are called leaf color values. In practical application, it is found that the chlorophyll content of plants is positively correlated with the SPAD value (SPAD readings).

References

  1. Sun, T.; Yang, X.; Tan, X.; Han, K.; Tang, S.; Tong, W.; Zhu, S.; Hu, Z.; Wu, L. Comparison of agronomic performance between japonica/indica hybrid and japonica cultivars of rice based on different nitrogen rates. Agronomy 2020, 10, 171. [Google Scholar] [CrossRef]
  2. Champagne, E.T.; Bett-Garber, K.L.; Thomson, J.L.; Fitzgerald, M.A. Unraveling the impact of nitrogen nutrition on cooked rice flavor and texture. Cereal Chem. 2009, 86, 274–280. [Google Scholar] [CrossRef]
  3. Ma, G.H.; Yuan, L.P. Hybrid rice achievements, development and prospect in China. J. Integr. Agric. 2015, 14, 197–205. [Google Scholar] [CrossRef]
  4. IFA. Fertilizer Use by Crop and Country for the 2017–2018 Period; IFA: Paris, France, 2022; pp. 9–10. [Google Scholar]
  5. Zhang, F.S.; Wang, J.Q.; Zhang, W.F.; Cui, Z.L.; Ma, W.Q.; Chen, X.P.; Jiang, R.F. Nutrient use efficiencies of major cereal crops in China and measures for improvement. Acta Pedol. Sin. 2008, 45, 915–924. (In Chinese) [Google Scholar]
  6. Xing, Y.; Claudia, K.; Yu, Z.; Alex, N.; Feike, A. Global meta-analysis of nitrogen fertilizer use efficiency in rice, wheat and maize. Agric. Ecosyst. Environ. 2022, 338, 108089. [Google Scholar]
  7. Li, W.W.; Ahmad, S.; Liu, D.; Gao, S.; Wang, Y.H.; Tao, W.K.; Chen, L.; Liu, Z.H.; Jiang, Y.; Li, G.H.; et al. Subsurface banding of blended controlled-release urea can optimize rice yields while minimizing yield-scaled greenhouse gas emissions. Crop J. 2023, 11, 914–921. [Google Scholar] [CrossRef]
  8. Ding, Z.J.; Li, J.T.; Hu, R.; Xia, D.K.; Huang, F.; Peng, S.; Huang, J.L.; Li, C.F.; Hou, J.; Tian, Y.B.; et al. Root-zone fertilization of controlled-release urea reduces nitrous oxide emissions and ammonia volatilization under two irrigation practices in a ratoon rice field. Field Crops Res. 2022, 2287, 108673. [Google Scholar] [CrossRef]
  9. Tian, C.; Sun, M.X.; Zhou, X.; Li, J.; Xie, G.X.; Yang, X.D.; Peng, J.W. Increase in yield and nitrogen use efficiency of double rice with long-term application of controlled-release urea. J. Integr. Agric. 2022, 21, 2106–2118. [Google Scholar] [CrossRef]
  10. Lan, T.; Li, M.X.; Han, Y.; Deng, O.P.; Tang, X.Y.; Luo, L.; Zeng, J.; Chen, J.D.; Yu, S.; Wang, C.Q.; et al. How are annual CH4, N2O, and NO emissions from rice–wheat system affected by nitrogen fertilizer rate and type? Appl. Soil Ecol. 2020, 150, 103469. [Google Scholar] [CrossRef]
  11. Zhang, A.P.; Gao, J.; Liu, R.L.; Chen, Z.; Yang, S.; Yang, Z.; Shao, H.; Zhang, Q.; Yoshikazu, N. Nursery-box total fertilization technology application for increasing nitrogen use efficiency in Chinese irrigated riceland: N-soil interactions. Land Degrad. Dev. 2016, 27, 1255–1265. [Google Scholar] [CrossRef]
  12. Yang, Y.C.; Zhang, M.; Li, Y.C.; Fan, X.; Geng, Y. Controlled-release urea commingled with rice seeds reduced emission of ammonia and nitrous oxide in rice paddy soil. J. Environ. Qual. 2013, 42, 1661. [Google Scholar] [CrossRef] [PubMed]
  13. Li, J.T.; Hu, Y.; Li, X.; Ding, Z.J.; Yang, S.; Nie, X.B.; Huang, F.; Hou, J.; Cao, B. The effect of controlled release urea contact application on the growth of rice seedlings. Chin. J. Soil Fertil. 2023, 01, 57–64. (In Chinese) [Google Scholar]
  14. Yang Yue, C.; Zhang, M.; Chen, J.Q.; Duan, L.L.; Geng, Y.Q.; Zheng, L. Effects of controlled release nitrogen fertilizer on morphological and physiological characteristics of rice seedlings. Plant Nutr. Fertil. Sci. 2010, 16, 1126–1135. (In Chinese) [Google Scholar]
  15. Chen, H.Z.; Xu, Y.C.; Zhang, Y.P.; Xiang, J.; Zhang, Y.K.; Zhu, D.F. Mechanical transplanting effect and yield formation of super early rice pot blanket seedlings. Sci. Agric. Sin. 2019, 52, 4240–4250. (In Chinese) [Google Scholar]
  16. Ye, C.; Li, Y.D.; Cao, Z.S.; Huang, J.B.; Sun, B.F.; Shu, S.F.; Wu, L.F. Effects of different seedling trays on plant type and yield of double-cropping rice. Chin. J. Rice Sci. 2020, 34, 435–442. (In Chinese) [Google Scholar]
  17. Erinaldo, G.; Brisa, R.; Layzza, R.; St’efanny, A.; Carlos, A.; Leandro, A.; Manlio, S.; Claudia, A. Nutripriming with ammonium nitrate improves emergence and root architecture and promotes an increase in nitrogen content in upland rice seedlings. Biocatal. Agric. Biotechnol. 2022, 42, 102331. [Google Scholar]
  18. Nitika, S.; Sushil, R.; Vikas, K.; Pallavi, S.; Santosh, K.; Singh, S.; Surya, K.; Madhav, P.; Ram, B.; Rajeev, K. Deciphering the genetic basis of root morphology, nutrient uptake, yield, and yield-related traits in rice under dry direct-seeded cultivation systems. Sci. Rep. 2019, 9, 9334. [Google Scholar]
  19. Sadiah, S.; Insha, S.; Aaqif, Z.; Sajad, M.; Asif, B.; Anuj, R.; Prasad, P.V.V.; Parvaze, A. The resilience of rice under water stress will be driven by better roots: Evidence from root phenotyping, physiological, and yield experiments. Plant Stress 2023, 10, 100211. [Google Scholar]
  20. Liu, Q.H.; Wu, X.S.; Ma, J.Q.; Chen, B.C.; Xin, C.Y. Effects of delaying transplanting on agronomic traits and grain yield of rice under mechanical transplantation pattern. PLoS ONE 2015, 10, e0123330. [Google Scholar] [CrossRef] [PubMed]
  21. Pinson, S.R.M.; Jia, Y.L. QTLs for early tiller production and relationships with rapid seedling growth and increased panicle number in rice. Crop Sci. 2016, 56, 505–519. [Google Scholar] [CrossRef]
  22. Tomomi, A.; Masataka, W.; Akira, K.; Mitsuhiro, O.; Hiroaki, K.; Tetsuya, M.; Naohiro, A.; Ryu, O. Changes in nitrogen assimilation, metabolism, and growth in transgenic rice plants expressing a fungal NADP(H)-dependent glutamate dehydrogenase (gdhA). Planta 2010, 232, 299–311. [Google Scholar]
  23. Lu, Y.; Luo, F.; Yang, M.; Li, X.H.; Lian, X.M. Suppression of glutamate synthase genes significantly affects carbon and nitrogen metabolism in rice (Oryza sativa L.). Sci. China Life Sci. 2011, 54, 651–663. [Google Scholar] [CrossRef] [PubMed]
  24. Kronzucker, H.J.; Kirk, G.J.D.; Siddiqi, M.Y.; Glass, A.D.M. Effects of hypoxia on 13NH4+ fluxes in rice roots. Plant Physiol. 1998, 116, 581–587. [Google Scholar] [CrossRef] [PubMed]
  25. Zhang, Z.; Wang, Y.F.; Wang, Z.M.; Ashraf, U.; Mo, Z.M.; Tian, H.; Duan, M.Y.; Li, Y.Q.; Tang, X.R.; Pan, S.G. Precise delivery of nitrogen at tillering stage enhances grain yield and nitrogen use efficiency in double rice cropping systems of South China. Field Crops Res. 2022, 289, 108736. [Google Scholar] [CrossRef]
  26. Arvind, K.S.; Ladha, J.K.; Vinod, K.S.; Dwivedi, B.S.; Balasubramanian, V.; Raj, K.G.; Seema, S.; Yashvir, S.; Himanshu, P.; Pragya, P.; et al. Calibrating the Leaf Color Chart for Nitrogen Management in Different Genotypes of Rice and Wheat in a Systems Perspective. Agron. J. 2004, 96, 1606–1621. [Google Scholar]
  27. Du, B.; Luo, H.W.; He, L.X.; Zheng, A.X.; Chen, Y.L.; Zhang, T.T.; Wang, Z.M.; Hu, L.; Tang, X.R. Deep fertilizer placement improves rice growth and yield in zero tillage. Appl. Ecol. Environ. Res. 2018, 16, 8045–8054. [Google Scholar] [CrossRef]
  28. Chen, Y.Y.; Fan, P.S.; Mo, Z.W.; Kong, L.L.; Tian, H.; Duan, M.Y.; Li, L.; Wu, L.J.; Wang, Z.M.; Tang, X.R.; et al. Deep placement of nitrogen fertilizer affects grain yield, nitrogen recovery efficiency, and root characteristics in direct seeded rice in South China. J. Plant Growth Regul. 2021, 40, 379–387. [Google Scholar] [CrossRef]
  29. Wang, D.Y.; Xu, C.M.; Ye, C.; Chen, S.; Chu, G.; Zhang, X.F. Low recovery efficiency of basal fertilizer-N in plants does not indicate high basal fertilizer-N loss from split-applied N in transplanted rice. Field Crops Res. 2018, 229, 8–16. [Google Scholar] [CrossRef]
  30. He, W.; He, B.; Wu, B.Y.; Yu-hui, W.A.N.G.; Yan, F.F.; Ding, Y.F.; Li, G.H. Growth of tandem long-mat rice seedlings using controlled release fertilizers: Mechanical transplantation could be more economical and high yielding. J. Integr. Agric. 2023, 22, 3652–3666. [Google Scholar] [CrossRef]
Figure 1. Nitrogen release characteristics of slow-release urea in 25 °C still water (a) and rice field soil (b); Boxingtanzhuang (in Chinese) seedling tray (c) [15]; and seedling filling methods S0 and S (d).
Agronomy 14 00781 g001
Figure 2. The number of tillers and SPAD of leaves were affected by the root breaking rate ((a,b) tillering stage, (c,d) booting stage, (e,f) full heading stage).
Agronomy 14 00781 g002
Figure 3. Plant height (a) and number of tillers (b) in different growth stages under different treatments in 2021 and 2022. Passed Tukey’s test at a 5% significance level, with the same letter indicating no significant difference.
Agronomy 14 00781 g003
Figure 4. Leaf area index in different growth stages under different treatments in 2021 and 2022. Passed Tukey’s test at a 5% significance level, with the same letter indicating no significant difference.
Agronomy 14 00781 g004
Figure 5. SPAD in different growth stages under different treatments in 2021 and 2022. Passed Tukey’s test at a 5% significance level, with the same letter indicating no significant difference.
Agronomy 14 00781 g005
Figure 6. The relationship between tillering number, leaf SPAD, plant height, and yield was fitted. ((ac) tillering stage, (df) booting stage, (gi) full heading stage).
Agronomy 14 00781 g006
Figure 7. The relationship between biological traits (tillering number, SPAD, plant height, N transferase GDG, NADH-GOGAT, GS, NR), yield, and NPFP, in which (ac) are tillering stage, booting stage, and full heading stage.
Agronomy 14 00781 g007
Table 1. Design of seedling and micro-plot field experiments with contact fertilization.
TreatmentSeedling Stage
Fertilizer Application MethodAmount of Controlled-Release Urea per PlateN Application RateNursery TrayFilling Method for Seedling Soil
(g)(kg ha−1)
FFPConventional fertilization--BS0
50%CRUCRU contact fertilization75590BS0
50%CRU + SCRU contact fertilization75590BS
50%CRU + BTCRU contact fertilization75590BTS0
50%CRU + BT + SCRU contact fertilization75590BTS
TreatmentMicro-Plot Growth Stage
Base FertilizerTillering FertilizerFertilization for Head SproutingN Application Method
(g plot−1)(g plot−1)(g plot−1)
UreaCalcium SuperphosphatePotassium ChlorideUreaUrea
(P2O5, 12%)(K2O, 60%)
FFP3.5213.53.62.121.43 times
50%CRU -13.53.6--1 time
50%CRU + S 1 time
50%CRU + BT-13.53.6--1 time
50%CRU + BT + S-13.53.6--1 time
Table 2. Seedling emergence rate, plant height (day 12), root breaking rate of each treatment, and seedling quality at the seedling stage (2022 data).
TreatmentRate of Emergence (%)Plant Height (cm)Root Breaking Rate (%)Above Ground Dry Weight (mg) Fullness Seedling Index Uniformity (%)
FFP88.68% ± 0.01 a *11.37 ± 0.42 b42.38% ± 0.02 a12.87 ± 0.26 b0.11 ± 0.01 c0.20 ± 0.02 b90.63% ± 0.01 a
50% CRU79.35% ± 0.01 b13.39 ± 0.83 a43.51% ± 0.02 a22.71 ± 1.10 a0.17 ± 0.01 ab0.34 ± 0.02 a87.21% ± 0.01 b
50% CRU + S79.15% ± 0.03 b13.34 ± 0.30 a42.81% ± 0.03 a23.32 ± 0.92 a0.18 ± 0.01 a0.28 ± 0.07 a86.18% ± 0.01 b
50% CRU + BT78.15% ± 0.02 b14.16 ± 0.29 a25.02% ± 0.01 b22.56 ± 1.27 a0.16 ± 0.01 ab0.28 ± 0.03 a86.58% ± 0.02 b
50% CRU + BT + S81.82% ± 0.05 b13.95 ± 0.82 a27.15% ± 0.02 b22.91 ± 1.19 a0.16 ± 0.01 ab0.29 ± 0.03 a87.06% ± 0.02 b
*: Means followed by a common letter are not significantly different by the Tukey’s test at the 5% level of significance.
Table 3. Leaf N transferase (2022 data).
Growth PeriodTreatmentGDH (nmol min−1 g−1)NADH-GOGAT (nmol min−1 g−1)GS (μmol h−1 g−1)NR (nmol min−1 g−1)
Tillering stageFFP286.5 ± 4.28 a *387.7 ± 6.83 a17.77 ± 0.75 a775.9 ± 6.91 a
50% CRU270.3 ± 8.96 b366.9 ± 7.49 b15.65 ± 0.46 b750.3 ± 7.44 b
50% CRU + S272.5 ± 6.55 b358.8 ± 9.48 b15.27 ± 1.14 b751.3 ± 8.33 b
50% CRU + BT265.7 ± 5.43 b358.3 ± 8.81 b15.51 ± 0.63 b754.7 ± 8.69 b
50% CRU + BT + S264.6 ± 8.94 b364.3 ± 7.99 b15.67 ± 1.90 b748.1 ± 7.27 b
Booting stageFFP364.6 ± 7.83 a461.1 ± 7.43 a30.46 ± 0.78 a426.5 ± 8.06 a
50% CRU341.2 ± 11.50 b417.6 ± 9.90 b26.37 ± 1.62 b406.6 ± 7.10 b
50% CRU + S344.6 ± 10.55 b416.2 ± 7.25 b25.97 ± 2.62 b406.3 ± 11.26 b
50% CRU + BT341.8 ± 6.77 b417.6 ± 9.50 b25.25 ± 1.18 b402.2 ± 7.48 b
50% CRU + BT + S340.8 ± 2.17 b418.1 ± 2.65 b25.87 ± 3.23 b404.4 ± 12.21 b
Full heading stageFFP449.01 ± 5.76 b524.3 ± 5.29 a33.29 ± 1.55 b331.1 ± 7.14 a
50% CRU473.7 ± 7.89 a524.6 ± 8.16 a37.36 ± 12.26 a328.3 ± 4.30 a
50% CRU + S476.4 ± 8.95 a527.1 ± 9.84 a36.00 ± 1.04 a331.6 ± 7.68 a
50% CRU + BT471.7 ± 12.05 a521.2 ± 7.67 a36.59 ± 0.62 a330.0 ± 4.99 a
50% CRU + BT + S469.3 ± 13.10 a524.0 ± 11.76 a36.68 ± 0.86 a327.9 ± 5.38 a
*: Means followed by a common letter are not significantly different by the Tukey’s test at the 5% level of significance.
Table 4. Yield and yield formation and N fertilizer productivity of different treatments in 2021 and 2022.
YearTreatmentPanicle NumberNumber of Grains per PanicleTGW (g)Grain Yield (kg m−2)NPFP(kg kg−1)
2021CK15.83 ± 0.58 b *207.1 ± 1.72 a23.36 ± 0.39 a1.20 ± 0.01 b71.66 ± 0.59 c
50% CRU15.33 ± 0.29 b209.1 ± 2.89 a23.45 ± 0.24 a1.20 ± 0.02 b143.4 ± 2.17 b
50% CRU + S15.67 ± 0.29 b207.7 ± 1.85 a23.53 ± 0.32 a1.19 ± 0.04 b142.3 ± 5.25 b
50% CRU + BT17.83 ± 0.58 a206.1 ± 8.89 a23.43 ± 0.29 a1.33 ± 0.01 a159.1 ± 0.77 a
50% CRU + BT + S17.67 ± 0.29 a206.9 ± 4.27 a23.52 ± 0.14 a1.34 ± 0.02 a160.3 ± 2.76 a
2022CK14.75 ± 0.50 b206.6 ± 6.30 a23.18 ± 0.63 a1.20 ± 0.02 b71.76 ± 1.28 c
50% CRU14.25 ± 0.25 b208.6 ± 10.57 a23.25 ± 0.40 a1.18 ± 0.02 b141.1 ± 2.82 b
50% CRU + S14.75 ± 0.25 b206.3 ± 8.16 a23.26 ± 0.95 a1.18 ± 0.04 b140.8 ± 5.36 b
50% CRU + BT15.83 ± 00.29 a208.1 ± 10.08 a23.15 ± 1.02 a1.30 ± 0.04 a155.4 ± 4.29 a
50% CRU + BT + S16.33 ± 0.14 a207.3 ± 6.71 a23.18 ± 0.35 a1.29 ± 0.04 a154.9 ± 5.19 a
*: Means followed by a common letter are not significantly different by the Tukey’s test at the 5% level of significance.
Disclaimer/Publisher’s Note: The statements, opinions and data contained in all publications are solely those of the individual author(s) and contributor(s) and not of MDPI and/or the editor(s). MDPI and/or the editor(s) disclaim responsibility for any injury to people or property resulting from any ideas, methods, instructions or products referred to in the content.

