
Lentil Cultivar Evaluation in Diverse Organic Mediterranean Environments
 , ,
, ,  , , ,
, , ,  , and
, and
Abstract
:1. Introduction
2. Materials and Methods
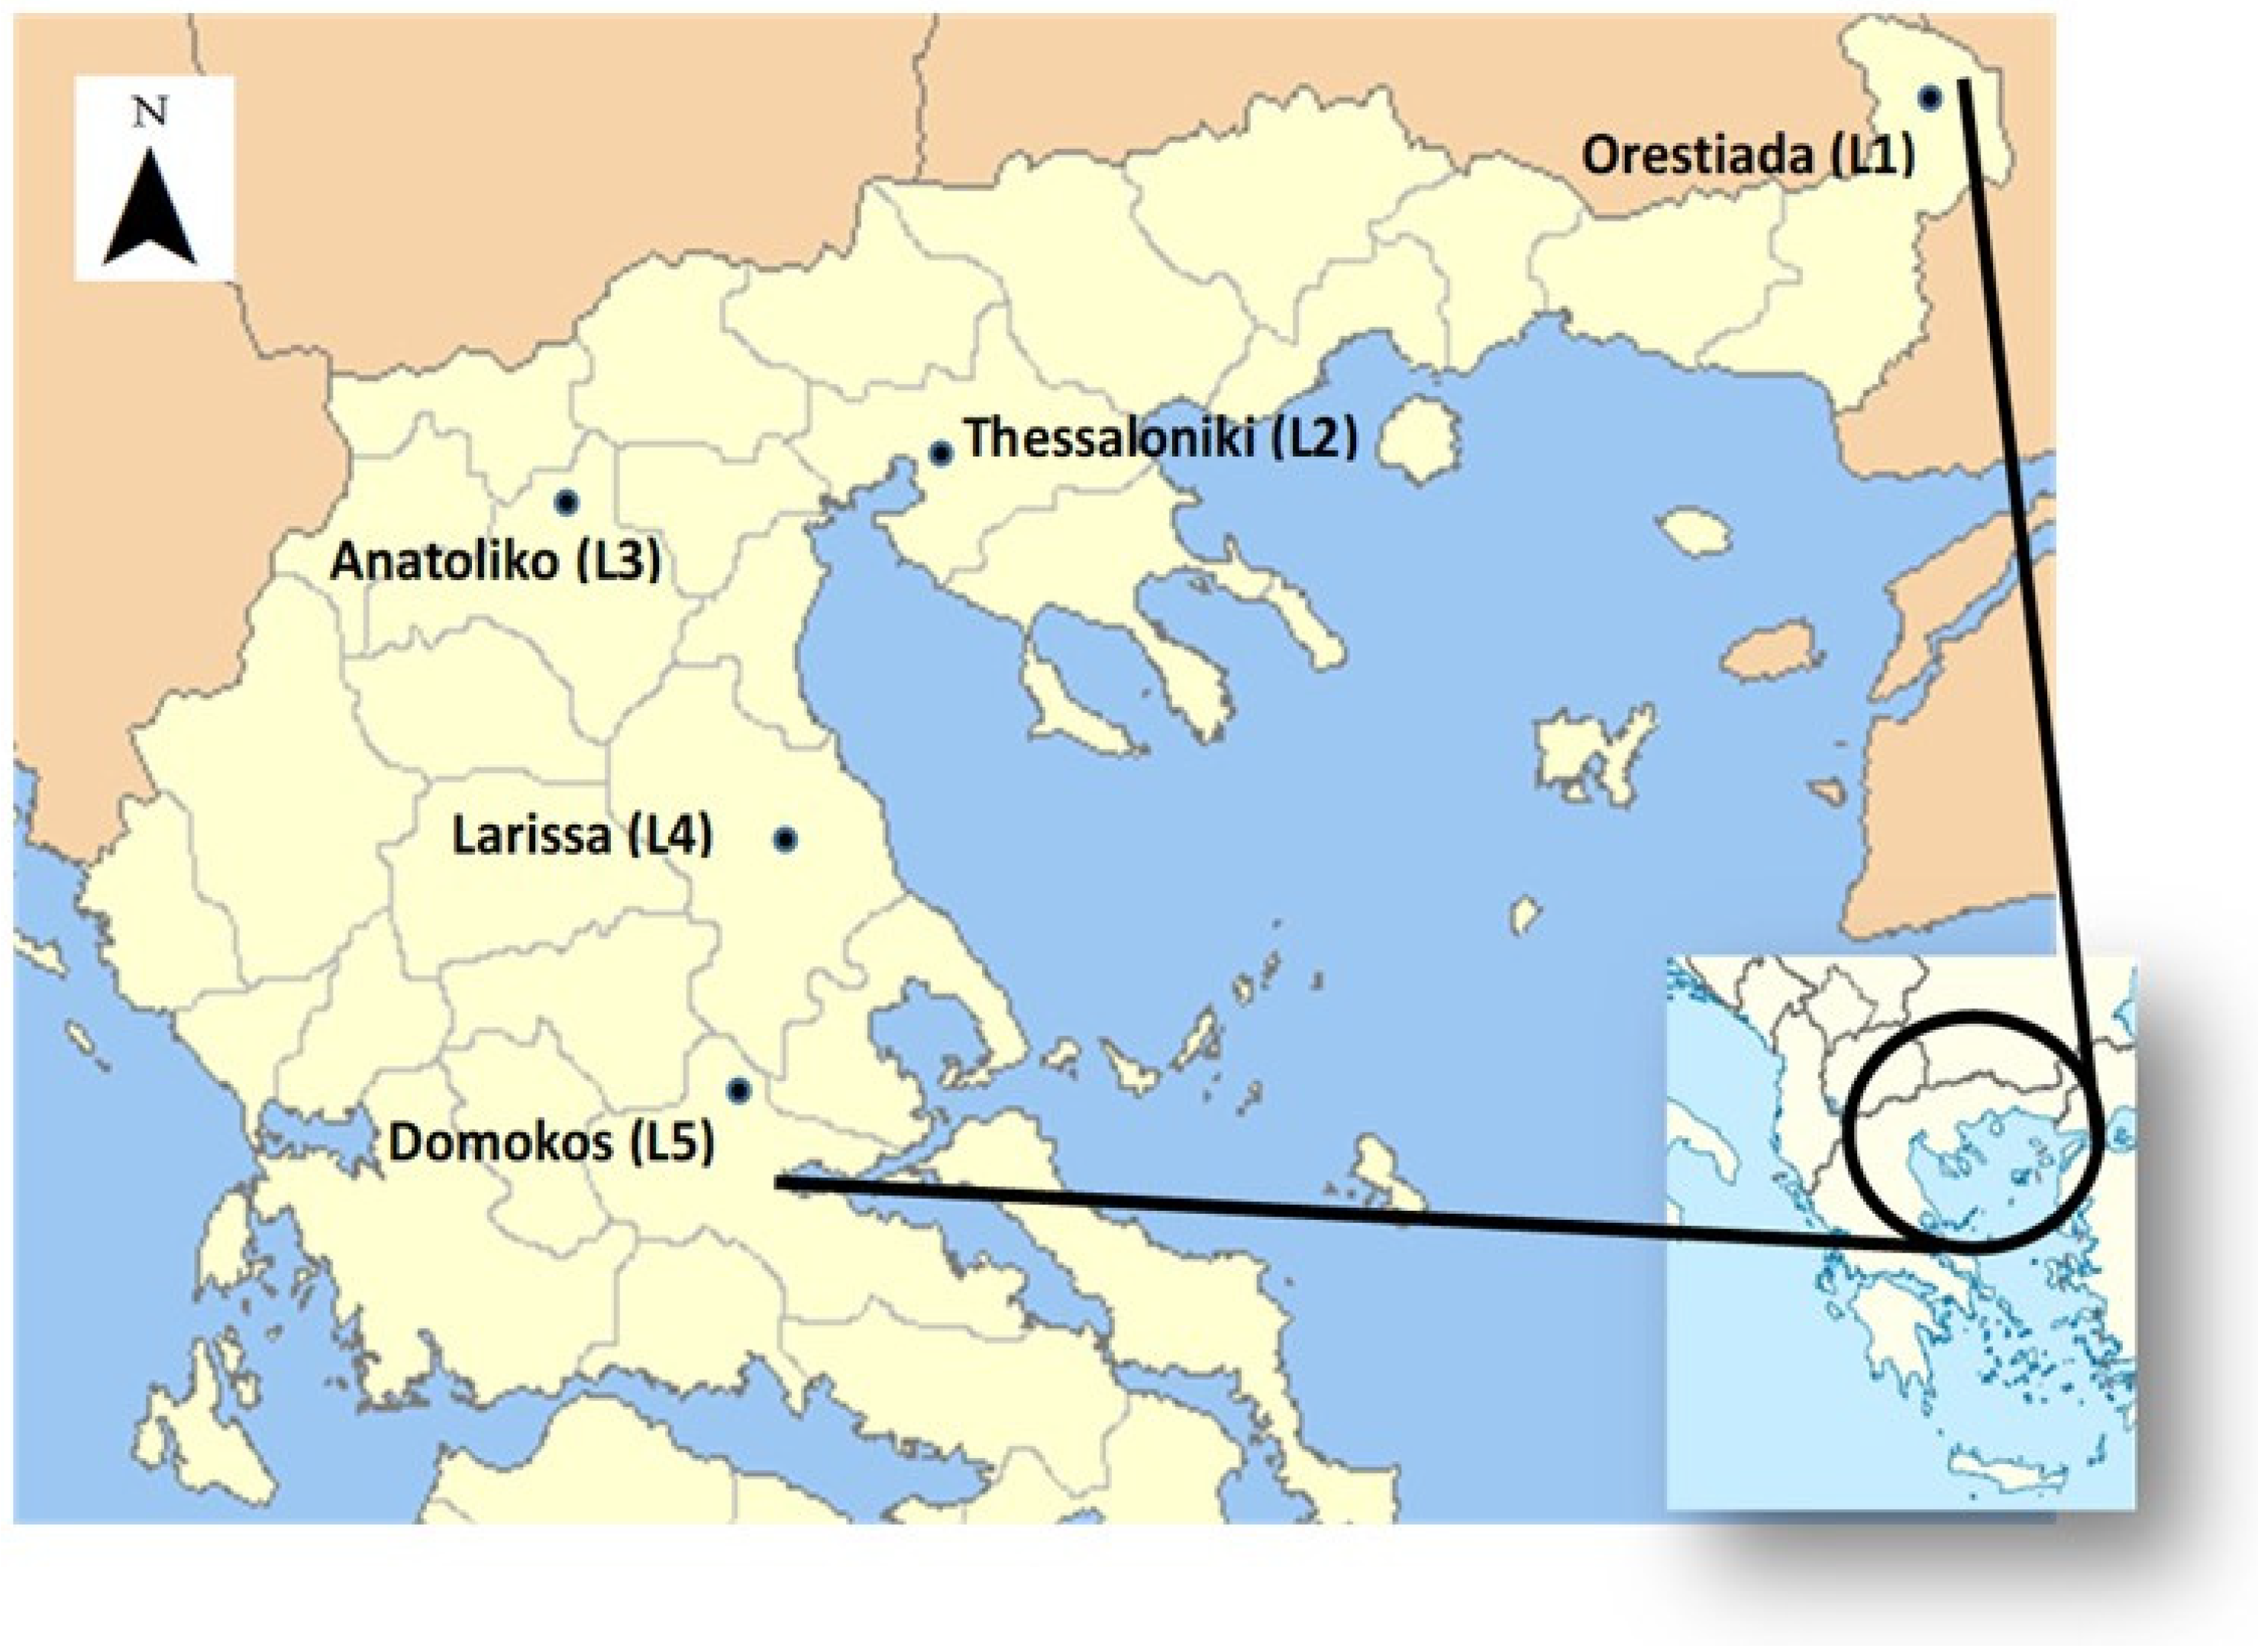
2.1. Locations and Experimental Management
2.2. Genetic Materials
2.3. Yield, Yield Components, and Seed Bruchid Infection
2.4. Cooking Time and Protein
2.5. Statistical Analysis
3. Results
3.1. Locations, Yields, and Agronomic Traits
3.2. Seed Loss Percentage and Yield Loss
3.3. Protein and Cooking Time
3.4. Correlations among Traits
4. Discussion
5. Conclusions
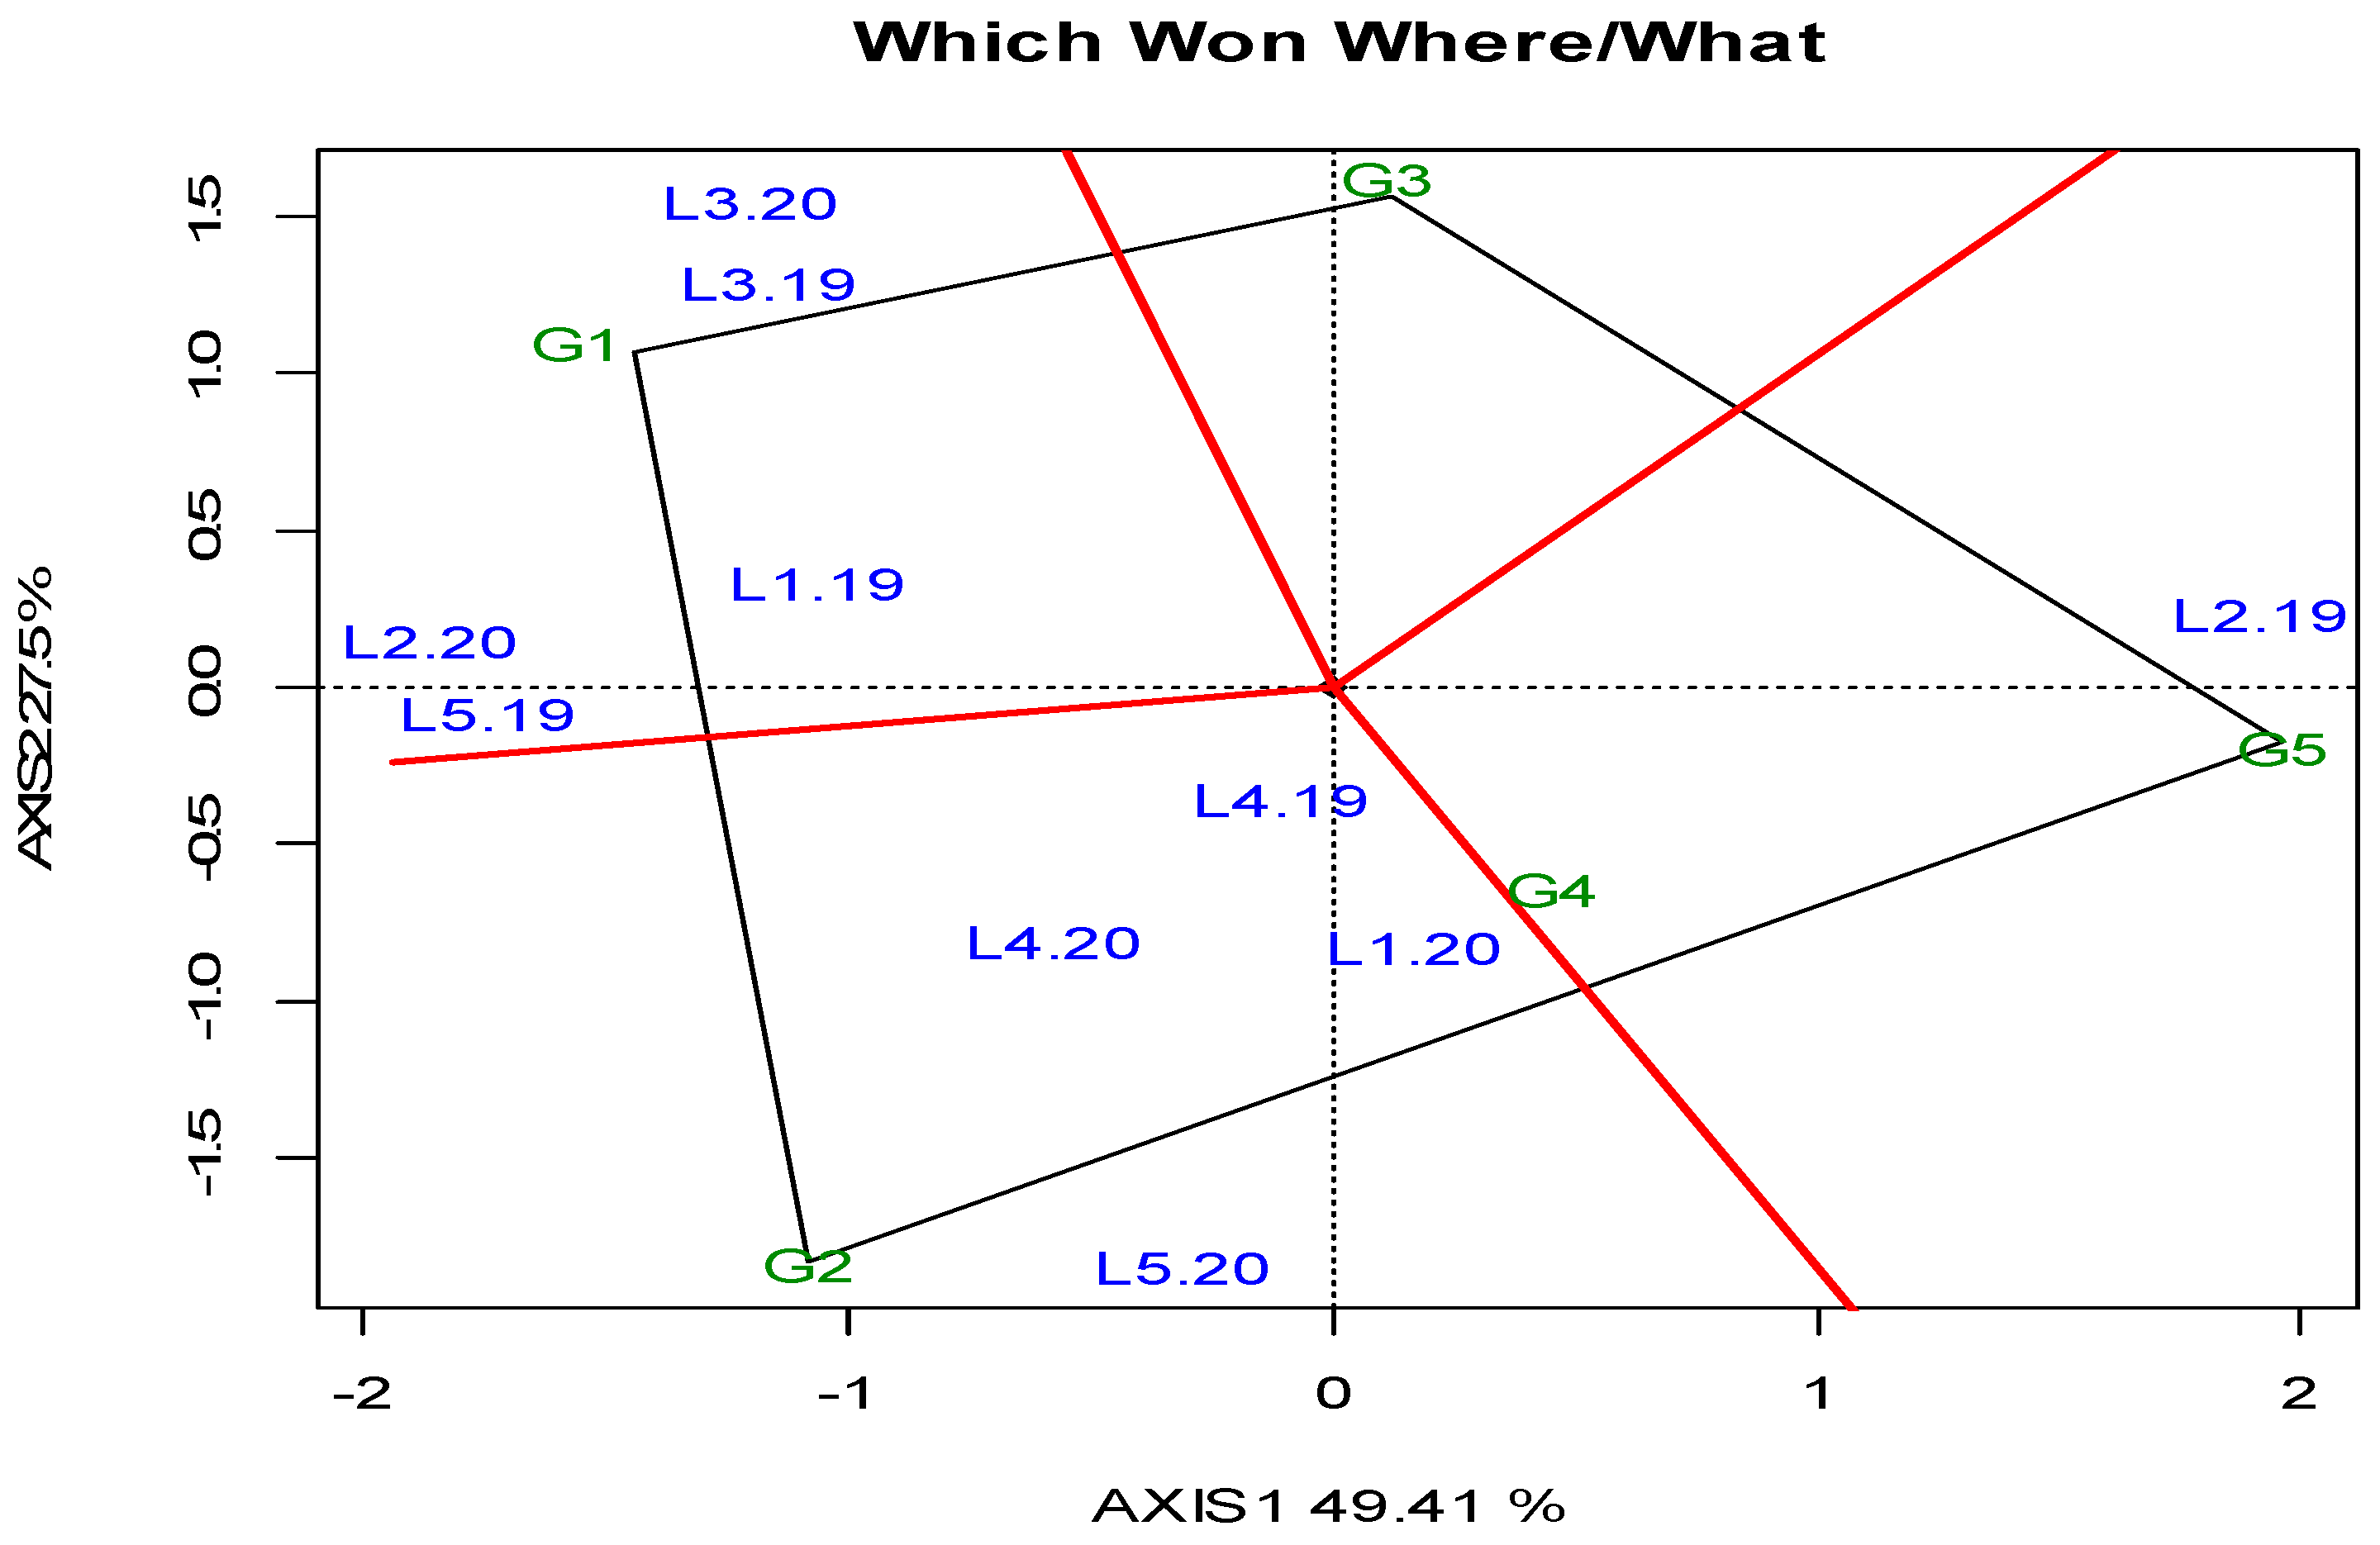
- (i)
- High-yielding organic environments with long CTs (L1): In such environments, cultivars with short CTs (such as G1, G2, or G3) are recommended for maximizing quality.
- (ii)
- Regions with a high bruchid populations (L4): In areas where there is a significant presence of bruchids, organic production might not be economically viable due to pest pressure. Conventional production methods might be more suitable in such cases. These areas can serve as screening sites for identifying genetic resistance to bruchids, with attention given to cultivars like G2, which are known for their lower YL.
- (iii)
- High-elevation environments for spring planting (L3): In such areas, where productivity is significantly lower, there is a need for earlier-maturing cultivars and supplemental irrigation during critical stages like flowering and early pod filling. However, it is noted that spring crops may not be sustainable for Mediterranean conditions, indicating the need for alternative approaches.
- (iv)
- High elevation for autumn planting (L5): Similar to spring planting in high-elevation environments, low productivity is observed here as well. To address this, planting winter-hardy cultivars at optimal dates with a good agronomic package is advised.
Supplementary Materials
Author Contributions
Funding
Institutional Review Board Statement
Informed Consent Statement
Data Availability Statement
Acknowledgments
Conflicts of Interest
References
- Thavarajah, D.; Thavarajah, P.; Wejesuriya, A.; Rutzke, M.; Glahn, R.P.; Combs, G.F., Jr.; Vandenberg, A. The potential of lentil (Lens culinaris L.) as a whole food for increased selenium, iron, and zinc intake: Preliminary results from a 3 year study. Euphytica 2011, 180, 123–128. [Google Scholar] [CrossRef]
- Mudryj, A.N.; Yu, N.; Aukema, H.M. Nutritional and health benefits of pulses. Appl. Physiol. Nutr. Metab. 2014, 39, 1197–1204. [Google Scholar] [CrossRef]
- Vasconcelos, M.W.; Balázs, B.; Kelemen, E.; Squire, G.R.; Iannetta, P.P.M. Editorial: Transitions to sustainable food and feed systems. Front. Plant Sci. 2019, 10, 1283. [Google Scholar] [CrossRef] [PubMed]
- Kafatos, A.; Verhagen, H.; Moschandreas, J.; Apostolaki, I.; Van Westerop, J.J.M. Mediterranean diet of Crete: Food and nutrient content. J. Am. Diet. Assoc. 2000, 100, 1487–1493. [Google Scholar] [CrossRef] [PubMed]
- Kwan, H.Y.; Chao, X.; Su, T.; Fu, X.; Kai Wing Tse, A.; Fong, W.F.; Yu, Z.L. The anticancer and antiobesity effects of Mediterranean diet. Crit. Rev. Food Sci. Nutr. 2017, 57, 82–94. [Google Scholar] [CrossRef] [PubMed]
- Pandey, S.P.; Yadav, C.R.; Sah, K.; Pande, S.; Joshi, P.K. Legumes in Nepal. In Legumes in Rice and Wheat Cropping Systems of the Indo-Gangetic Plain—Constraints and Opportunities; Johansen, C., Duxbury, J.M., Virmani, S.M., Gowda, C.L., Pande, S., Joshi, P.K., Eds.; International Crops Research Institute for the Semi-Arid Tropics: Patancheru, India; Cornell University: Ithaca, NY, USA, 2000; pp. 71–97. [Google Scholar]
- Stevenson, P.C.; Dhillon, M.K.; Sharma, H.C.; El Bouhssini, M. Insect pests of lentil and their management. In Lentil: An Ancient Crop for Modern Times; Yadav, S.S., McNeil, D., Stevenson, P.C., Eds.; Springer: Dordrecht, The Netherlands, 2007; pp. 342–343. [Google Scholar]
- Segers, A.; Caparros Megido, R.; Lognay, G.; Francis, F. Overview of Bruchus rufimanus Boheman 1833 (Coleoptera: Chrysomelidae): Biology, chemical ecology and semiochemical opportunities in integrated pest management programs. Crop Prot. 2021, 140, 105411. [Google Scholar] [CrossRef]
- Erskine, W.; Sarker, A. Lentil: The Bangladesh breakthrough. Caravan 1997, 6, 8–9. [Google Scholar]
- Muehkbauer, F.J.; Kaiser, W.J. Using host plant resistance to manage biotic stresses in cool season food legumes. Euphytica 1994, 73, 233–246. [Google Scholar]
- Kumari, S.G.; Larsen, R.; Makkouk, K.M.; Bashir, M. Virus diseases and their control. In The Lentil: Botany, Production and Uses; Erskine, W., Muehlbauer, F.J., Sarker, A., Eds.; CAB International: Oxfordshire, UK, 2009; pp. 306–325. [Google Scholar]
- Saeidi, K.; Shahab-Ghayoor, H. Evaluation of botanical insecticides against lentil weevil, Bruchus lentis Frolich (Coleoptera: Chrysomelidae: Bruchinae) under laboratory conditions. Agric. Commun. 2015, 3, 23–27. [Google Scholar]
- Hussain, S.; Ali, A.; Zahid, M.A.; Iqbal, S.M. Multiple disease resistance in lentil germplasm from Pakistan. Pak. J. Bot. 2008, 40, 897–903. [Google Scholar]
- Laserna-Ruiz, I.; De-Los-Mozos-Pascual, M.; Santana-Méridas, O.; Sánchez-Vioque, R.; Rodríguez-Conde, M.F. Screening and selection of lentil (Lens Miller) germplasm resistant to seed bruchids (Bruchus spp.). Euphytica 2012, 188, 153–162. [Google Scholar] [CrossRef]
- Vlachostergios, D.; Lithourgidis, A.; Roupakias, D. Adaptability to organic farming of lentil (Lens culinaris Medik.) varieties developed from conventional breeding programs. J. Agric. Sci. 2011, 149, 85–93. [Google Scholar] [CrossRef]
- Vlachostergios, D.N.; Roupakias, D.G. Response to conventional and organic environment of thirty-six lentil (Lens culinaris Medik) varieties. Euphytica 2008, 163, 449–457. [Google Scholar] [CrossRef]
- Joshi, M.; Timilsena, Y.; Adhikari, B. Global production, processing and utilization of lentil: A review. J. Integr. Agric. 2017, 16, 2898–2913. [Google Scholar] [CrossRef]
- Theologidou, G.S.; Lazaridou, A.; Zori’c, L.; Tsialtas, I.T. Cooking Quality of Lentils Produced under Mediterranean Conditions. Crop Sci. 2018, 58, 2121–2130. [Google Scholar] [CrossRef]
- Vlachostergios, D.N.; Noulas, C.; Kargiotidou, A.; Baxevanos, D.; Tigka, E.; Pankou, C.; Kostoula, S.; Beslemes, D.; Irakli, M.; Tziouvalekas, M.; et al. Identification of the Optimum Environments for the High Yield and Quality Traits of Lentil Genotypes Evaluated in Multi-Location Trials. Sustainability 2021, 13, 8247. [Google Scholar] [CrossRef]
- Hellenic Statistical Authority. Available online: https://www.statistics.gr/el/statistics/-/publication/SPG06/-2019 (accessed on 6 April 2020).
- Tziouvalekas, M.; Tigka, E.; Kargiotidou, A.; Beslemes, D.; Irakli, M.; Pankou, C.; Arabatzi, P.; Aggelakoudi, M.; Tokatlidis, I.; Mavromatis, A.; et al. Seed Yield, Crude Protein and Mineral Nutrients of Lentil Genotypes Evaluated across Diverse Environments under Organic and Conventional Farming. Plants 2022, 11, 3328. [Google Scholar] [CrossRef] [PubMed]
- Watson, C.A.; Reckling, M.; Preissel, S.; Bachinger, J.; Bergkvist, G.; Kuhlman, T.; Lindström, K.; Nemecek, T.; Topp, C.F.E.; Vanhatalo, A.; et al. Grain Legume Production and Use in European Agricultural Systems. Adv. Agron. 2017, 144, 235–303. [Google Scholar]
- Iliadis, C. Influence of genotype and soil type on cooking time in lentil (Lens culinaris Medikus). Int. J. Food Sci. Technol. 2003, 38, 89–93. [Google Scholar] [CrossRef]
- Giannakopoulos, C.; Kostopoulou, E.; Varotsos, K.V.; Tziotziou, K.; Plitharas, A. An integrated assessment of climate change impacts for Greece in the near future. Reg. Environ. Change 2011, 11, 829–843. [Google Scholar] [CrossRef]
- Ergon, Å.; Seddaiu, G.; Korhonen, P.; Virkajärvi, P.; Bellocchi, G.; Jørgensen, M.; Østrem, L.; Reheul, D.; Volaire, F. How can forage production in Nordic and Mediterranean Europe adapt to the challenges and opportunities arising from climate change? Eur. J. Agron. 2018, 92, 97–106. [Google Scholar] [CrossRef]
- Sakar, D.; Durutan, N.; Meyveci, K. World Crops: Cool Season Food Legumes; Summerfield, R.J., Ed.; Kluwer Academic Publishers: Dordrecht, The Netherlands, 1988; pp. 137–146. [Google Scholar]
- Erskine, W.; Tufail, M.; Russell, A.; Tyagi, M.C.; Rahman, M.M.; Saxena, M.C. Current and future strategies in breeding lentil for resistance to biotic and abiotic stresses. Euphytica 1994, 73, 127–135. [Google Scholar] [CrossRef]
- Vlachostergios, D.N.; Lithourgidis, A.; Baxevanos, D.V.; Mavromatis, A.G.; Noulas, C.S.; Roupakias, D.G. Evaluation of lentil varieties and farming system effect on seed damage and yield loss due to bruchid (Bruchus spp.) infestation. Crop Pasture Sci. 2018, 69, 387–394. [Google Scholar] [CrossRef]
- WRB (World Reference Base for Soil Resources). World Reference Base for Soil Resources 2014, Update 2015 International Soil Classification System for Naming Soils and Creating Legends for Soil Maps; World Soil Resources Reports No. 106; International Union of Soil Sciences; FAO: Rome, Italy, 2015. [Google Scholar]
- Gee, G.W.; Bauder, J.W. Particle-size analysis. In Methods of Soil Analysis: Part. 1–Physical and Mineralogical Methods; Soil Society of America: Madison, WI, USA, 1986; pp. 383–411. [Google Scholar]
- McLean, E.O. Soil pH and lime requirement. In Methods of Soil Analysis: Part 2—Chemical and Microbiological Properties; American Society Agronomy: Madison, WI, USA, 1982; pp. 199–224. [Google Scholar]
- Bower, C.A.; Wilcox, L.V. Soluble salts. In Methods of Soil Chemical Analysis: Part 2—Chemical and Microbiological Properties; American Society Agronomy: Madison, WI, USA, 1965; pp. 933–951. [Google Scholar]
- Nelson, D.W.; Sommers, L.E. Total carbon, organic carbon and organic matter. In Methods of Soil Analysis: Part 2—Chemical and Microbiological Properties; American Society Agronomy: Madison, WI, USA, 1982; pp. 539–579. [Google Scholar]
- Allison, L.E.; Moodie, C.D. Carbonates. In Methods of Soil Analysis: Part 2—Chemical and Microbiological Properties; American Society Agronomy: Madison, WI, USA, 1965; pp. 1389–1396. [Google Scholar]
- Olsen, S.R.; Dean, L.A. Phosphorus. In Methods of Soil Chemical Analysis: Part 2—Chemical and Microbiological Properties; American Society Agronomy: Madison, WI, USA, 1965; pp. 1035–1049. [Google Scholar]
- Lindsay, W.L.; Norvell, W.A. Development of a DTPA soil test for zinc, iron, manganese and copper. Soil Sci. Soc. Am. J. 1978, 42, 421–428. [Google Scholar] [CrossRef]
- Peel, M.C.; Finlayson, B.L.; McMahon, T.A. Updated world map of the Köppen-Geiger climate classification. Hydrol. Earth Syst. Sci. 2007, 11, 1633–1644. [Google Scholar] [CrossRef]
- Beck, H.E.; Zimmermann, N.E.; McVicar, T.R.; Vergopolan, N.; Berg, A.; Wood, E.F. Present and future Köppen-Geiger climate classification maps at 1-km resolution. Sci. Data 2018, 5, 180214. [Google Scholar] [CrossRef] [PubMed]
- Tokatlidis, I.; Vlachostergios, D. Sustainable Stewardship of the Landrace Diversity. Diversity 2016, 8, 29. [Google Scholar] [CrossRef]
- Meier, U. Growth Stages of Mono-and Dicotyledonous Plants. In BBCH Monograph, 2nd ed.; Blackwell Science: Berlin, Germany, 2001; p. 158. [Google Scholar]
- Tsialtas, I.T.; Irakli, M.; Lazaridou, A. Traits related to bruchid resistance and its parasitoid in vetch seeds. Euphytica 2018, 214, 238. [Google Scholar] [CrossRef]
- Taiwo, A.; Akanbi, O.C.; Ajibola, O.O. The effects of soaking and cooking time on the cooking properties of two cowpea varieties. J. Food Eng. 1997, 33, 337–346. [Google Scholar] [CrossRef]
- McIntosh, M.S. Analysis of combined experiments. Agro. J. 1983, 75, 153–155. [Google Scholar] [CrossRef]
- SAS Institute. JMP 11.0.0; SAS Institute Inc.: Cary, NC, USA, 2013. [Google Scholar]
- Yan, W.; Kang, M.S. GGE Biplot Analysis: A Graphical Tool for Breeders, Geneticists, and Agronomists, 1st ed.; CRC Press: Boca Raton, FL, USA, 2002. [Google Scholar]
- Frutos, E.; Galindo, M.P.; Leiva, V. An interactive biplot implementation in R for modeling genotype-by-environment interaction. Stoch. Environ. Res. Risk. Assess. 2014, 28, 1629–1641. [Google Scholar] [CrossRef]
- Kang, M.S. Using genotype-by-environment interaction for crop cultivar development. Adv. Agron. 1997, 62, 199–252. [Google Scholar]
- Annicchiarico, P. Advances in the definition of adaptation strategies and yield-stability targets in breeding programs. In Quantitative Genetics, Genomics and Plant Breeding, 2nd ed.; Kang, M.S., Ed.; CAB International: Wallingford, UK, 2020; pp. 194–209. [Google Scholar]
- Duc, G.; Agrama, H.; Bao, S.; Berger, J.; Bourion, V.; De Ron, A.M.; Gowda, C.L.L.; Mikic, A.; Millot, D.; Singh, K.B.; et al. Breeding Annual Grain Legumes for Sustainable Agriculture: New Methods to Approach Complex Traits and Target New Cultivar Ideotypes. Crit. Rev. Plant Sci. 2015, 34, 381–411. [Google Scholar] [CrossRef]
- Dehghani, H.; Sabaghpour, S.H.; Sabaghnia, N. Genotype × environment interaction for grain yield of some lentil genotypes and relationship among univariate stability statistics. Span. J. Agric. Res. 2008, 6, 385–394. [Google Scholar] [CrossRef]
- Silim, S.N.; Saxena, M.C.; Erskine, W. Adaptation of Lentil to the Mediterranean Environment. II. Response to Moisture Supply. Exper. Agric. 1993, 29, 21–28. [Google Scholar] [CrossRef]
- Siddique, K.H.M.; Loss, S.P.; Pritchard, D.L.; Regan, K.L.; Tennant, D.; Jettner, R.L.; Wilkinson, D. Adaptation of lentil (Lens culinaris Medik.) to Mediterranean-type environments: Effect of time of sowing on growth, yield, and water use. Austr. J. Agric. Res. 1998, 49, 613–626. [Google Scholar] [CrossRef]
- Zhang, H.; Pala, M.; Oweis, T.; Harris, H. Water use and water-use efficiency of chickpea and lentil in a Mediterranean environment. Austr. J. Agric. Res. 2000, 51, 295–304. [Google Scholar] [CrossRef]
- Liu, K.; Blackshaw, R.E.; Johnson, E.N.; Hossain, Z.; Hamel, C.; St-Arnaud, M.; Gana, Y. Lentil enhances the productivity and stability of oilseed-cereal cropping systems across different environments. Eur. J. Agron. 2019, 105, 24–31. [Google Scholar] [CrossRef]
- Ramegowda, V.; Senthil-Kumar, M. The interactive effects of simultaneous biotic and abiotic stresses on plants: Mechanistic understanding from drought and pathogen combination. J. Plant Physiol. 2015, 176, 47–54. [Google Scholar] [CrossRef]
- Prysiazhniuk, O.; Mostoviak, I.; Yevchuk, Y.; Tkachenko, H.; Prokopenko, E.; Kononenko, L.; Prykhodko, V.; Vyshnevska, L.; Poltoretska, N. Lentil Yield Performance and Quality as Affected by Moisture Supply. Ecol. Eng. Environ. Technol. 2022, 23, 25–33. [Google Scholar] [CrossRef]
- El Fakhouri, K.; Sabraoui, A.; Kehel, Z.; El Bouhssini, M. Population Dynamics and Yield Loss Assessment for Pea Aphid, Acyrthosiphon pisum (Harris) (Homoptera: Aphididae), on Lentil in Morocco. Insects 2021, 12, 1080. [Google Scholar] [CrossRef] [PubMed]
- Pradhan, A.; Nag, S.K.; Mukherjee, S.C. Thermal requirement of small millets in Chhattisgarh plateau under rainfed cropping situation. J. Agro Meteorol. 2018, 20, 244–245. [Google Scholar] [CrossRef]
- Maphosa, L.; Preston, A.; Richards, M.F. Effect of Sowing Date and Environment on Phenology, Growth and Yield of Lentil (Lens culinaris Medikus.) Genotypes. Plants 2023, 12, 474. [Google Scholar] [CrossRef]
- Ludlow, M.M. Strategies of response to water stress. In Structural and Functional Responses to Environmental Stresses; Kreeb, K.H., Ritcher, H., Hinckley, T.M., Eds.; SPB Academic Publishing: Gravenhage, The Netherlands, 1989; p. 269281. [Google Scholar]
- Alia Johnson, D.L.; Stushnoff, C. Screening lentil (Lens culinaris) for cold hardiness under controlled conditions. J. Agric. Sci. 1999, 133, 313–319. [Google Scholar]
- Yan, W.; Hunt, L.A.; Sheng, Q.; Szlavnics, Z. Cultivar evaluation and mega-environment investigation based on the GGE biplot. Crop Sci. 2000, 40, 597–605. [Google Scholar] [CrossRef]
- Tsialtas, I.T.; Irakli, M. Bruchid Infestation Was Associated With Agronomic Traits in Field-grown Faba Bean Genotypes. J. Crop Health 2024, 76, 461–470. [Google Scholar] [CrossRef]
- Chopra, N.; Pajni, H.R. Resistance of different lentil varieties to the attack of Bruchus lentis. Lens Newslett. 1987, 23, 45–48. [Google Scholar]
- Pajni, H.R.; Sidhu, N.S.; Girdhar, A.K. Infestation of Lens culinaris Medik. by Bruchus lentis Froel. as affected by cropping pattern and other practices in Chandigarh Area, India. Lens Newslett. 1996, 23, 45–48. [Google Scholar]
- Khazaei, H.; Subedi, M.; Nickerson, M.; Martínez-Villaluenga, C.; Frias, J.; Vandenberg, A. Seed Protein of Lentils: Current Status, Progress, and Food Applications. Foods 2019, 8, 391. [Google Scholar] [CrossRef]
- Bhatty, R.S.; Slinkard, A.E.; Sosulski, F.W. Chemical composition and protein characteristics of lentils. Can. J. Plant Sci. 1976, 56, 787–794. [Google Scholar] [CrossRef]
- Lizarazo, C.I.; Lampi, A.M.; Liu, J.; Sontag-Strohm, T.; Piironen, V.; Stoddard, F.L. Nutritive quality and protein production from grain legumes in a boreal climate. J. Sci. Food Agric. 2015, 95, 2053–2064. [Google Scholar] [CrossRef] [PubMed]
- Stoddard, F.L.; Marshall, D.R.; Ali, S.M. Variability in grain protein concentration of peas and lentils grown in Australia. Aust. J. Agric. Res. 1993, 44, 1415–1419. [Google Scholar] [CrossRef]
- Hamdi, A.; Erskine, W.; Gates, P. Adaptation of Lentil Seed Yield to Varying Moisture Supply. Crop Sci. 1992, 32, 987–990. [Google Scholar] [CrossRef]
- Nikolova, I. Pea weevil damage and chemical characteristics of pea cultivars determining their resistance to Bruchus pisorum L. Bull. Entomol. Res. 2016, 106, 268–277. [Google Scholar] [CrossRef] [PubMed]
- Zubareva, C. Structural and Biochemical Characteristics of Pisum sativum L., Which Determine Resistance to Bruchus pisorum L. Ph.D. Thesis, Orel State Agrarian University, Orel, Russia, 2006. [Google Scholar]
- Lawrence, P.K.; Koundal, K.R. Plant protease inhibitors in control of phytophagous insects. Electron. J. Biotechnol. 2002, 5, 93–109. [Google Scholar] [CrossRef]
- Erskine, W.; Williams, P.C.; Nakkoul, H. Genetic and environmental variation in the seed size, protein, yield, and cooking quality of lentils. Field Crop. Res. 1985, 12, 153–161. [Google Scholar] [CrossRef]
- Ross, K.A.; Alejo-Lucas, D.; Malcolmson, L.; Arntfield, S.D.; Cenkowski, S. Interpretation of the force–deformation curves of cooked red lentils (Lens culinaris). J. Texture Stud. 2009, 40, 109–126. [Google Scholar] [CrossRef]
- Wang, N. Effect of variety and crude protein content on dehulling quality and on the resulting chemical composition of red lentil (Lens culinaris). J. Sci. Food Agric. 2008, 88, 885–890. [Google Scholar] [CrossRef]


| Location | Orestiada (L1) | Thessaloniki (L2) | Anatoliko (L3) | Larissa (L4) | Domokos (L5) | |||||
|---|---|---|---|---|---|---|---|---|---|---|
| Soil Order 1 | Fluvisols | Fluvisols | Luvisols | Fluvisols | Vertisols | |||||
| Soil texture | SiCL | CL | CL | C | C | |||||
| pH (1:1) | 7.3 | 8.0 | 7.2 | 7.8 | 7.0 | |||||
| EC 2 | 0.72 | 0.70 | 0.57 | 0.52 | 0.39 | |||||
| SOM 3 % | 2.0 | 1.3 | 2.0 | 1.8 | 1.4 | |||||
| CaCO3 % | 2.0 | 4.5 | 1.3 | 1.2 | 1.5 | |||||
| POlsen mg kg−1 | 7.3 | 6.7 | 13.0 | 7.3 | 18.5 | |||||
| CEC 4 | 28.6 | 38.3 | 44.9 | 13.3 | 27.7 | |||||
| Cu 5 | 2.5 | 2.1 | 2.0 | 2.2 | 5.2 | |||||
| Fe 5 | 19 | 12 | 21 | 10 | 40 | |||||
| Mn 5 | 31 | 16 | 32 | 19 | 59 | |||||
| Zn 5 | 3.0 | 0.86 | 0.60 | 0.68 | 1.10 | |||||
| B mg kg−1 | 1.40 | 1.23 | 0.54 | 1.40 | 0.74 | |||||
| Altitude (m) | 26 | 5 | 624 | 77 | 570 | |||||
| Year | 2019 | 2020 | 2019 | 2020 | 2019 | 2020 | 2019 | 2020 | 2019 | 2020 |
| PrS 6 (mm) | 367.2 | 432.6 | 399.6 | 524.8 | 558.3 | 402.5 | 479.2 | 453.2 | 566.1 | 684.7 |
| PrA-M 7 (mm) | 118.3 | 182.8 | 107.8 | 168.4 | 144.7 | 158.4 | 72.0 | 99.0 | 81.8 | 186.4 |
| Ts (°C) 8 | 12.6 | 12.5 | 14.0 | 14.4 | 10.1 | 11.1 | 13.9 | 14.4 | 11.3 | 11.5 |
| TA-M (°C) 9 | 15.0 | 14.5 | 16.4 | 15.6 | 13.2 | 13.5 | 16.4 | 16.2 | 13.6 | 13.7 |
| Tmin Jan (°C) 10 | 0.7 | −3.1 | 0.5 | 0.4 | −5.9 | −3.7 | −0.2 | −1.0 | −2.2 | −3.5 |
| TDmin Jan (°C) 11 | −6.2 | −9.5 | −8.7 | −6.1 | −17.9 | −9.4 | −10.7 | −6.1 | −12.8 | −10.5 |
| Name/Code | Cotyledon Color | Seed Size | Flowering 1 | Maturity |
|---|---|---|---|---|
| Samos (G1) | Yellow | Medium | 22 | Medium |
| Dimitra (G2) | Yellow | Small | 20 | Medium |
| Thessalia (G3) | Yellow | Medium | 21 | Medium |
| Elpida (G4) | Yellow | Large | 4 | Very early |
| 03-04L (G5) | Red | Medium | 12 | Early |
| Source | df | SY | PP | 1000 SW | PH | SL | YL | CP | CT |
|---|---|---|---|---|---|---|---|---|---|
| Year (Y) | 1 | 2.07 ** | 933.12 ** | 189.54 ** | 22.78 ns | 999.04 ** | 0.07 ** | 8.60 ** | 3.54 ** |
| Location (L) | 4 | 62.37 ** | 11,680.93 ** | 1280.83 ** | 1390.08 ** | 35,074.40 ** | 6.18 ** | 848.13 ** | 680.23 ** |
| Genotype (G) | 4 | 1.3 * | 1632.83 ** | 13,652.65 ** | 1111.58 ** | 350.20 ** | 0.10 ** | 67.51 ** | 1418.79 ** |
| Y × L | 4 | 8.19 ** | 802.03 * | 1711.044 ** | 104.4 * | 816.44 ** | 0.06 ** | 187.84 ** | 223.07 ** |
| G × Y | 4 | 1.15 * | 220.93 ns | 147.787 ** | 7.95 ns | 90.11 ns | 0.01 ns | 21.55 ** | 120.00 ** |
| G × L | 16 | 3.74 * | 1498.07 * | 944.12 ** | 543.67 ** | 1329.49 ** | 0.15 ** | 77.83 ** | 75.61 ** |
| Y × L × G | 16 | 8.29 ** | 482.67 ns | 570.49 ** | 76.4 ns | 731.83 ** | 0.09 ** | 44.65 ** | 31.45 ** |
| Blocks (LY) | 16 | 3.76 ns | 1044.8 ns | 37.124 ns | 273.83 ns | 506.02 ns | 0.05 ns | 3.48 * | 11.74 ns |
| Error | 120 | 100.35 | 3884 | 94.09 | 730.1 | 1516 | 0.18 | 8.24 | 35.58 |
| % of the SSTRMT | |||||||||
| SSY | 2.38 | 5.41 | 1.02 | 0.70 | 2.54 | 1.05 | 0.69 | 0.14 | |
| SSL | 71.60 | 67.72 | 6.92 | 42.69 | 89.04 | 92.79 | 67.53 | 26.65 | |
| SSG | 1.49 | 9.47 | 73.81 | 34.14 | 0.89 | 1.50 | 5.38 | 55.58 | |
| SSY×L | 9.40 | 4.65 | 9.25 | 3.21 | 2.07 | 0.90 | 14.96 | 8.74 | |
| SSG×Y | 1.32 | 1.28 | 0.80 | 0.24 | 0.23 | 0.15 | 1.72 | 4.70 | |
| SSG×L | 4.29 | 8.68 | 5.10 | 16.70 | 3.38 | 2.25 | 6.20 | 2.96 | |
| SSY×L×G | 9.52 | 2.80 | 3.08 | 2.35 | 1.86 | 1.35 | 3.56 | 1.23 | |
| SY | PP | 1000 SW | PH | |||||||||
|---|---|---|---|---|---|---|---|---|---|---|---|---|
| Genotypes | Mean | 2019 | 2020 | Mean | 2019 | 2020 | Mean | 2019 | 2020 | Mean | 2019 | 2020 |
| G1 | 1.29a | 1.25ab | 1.34a | 35.10a | 36.95b | 33.25a | 39.41d | 37.67d | 41.16c | 37.20a | 37.65a | 36.75a |
| G2 | 1.16bc | 1.26ab | 1.06b | 30.92b | 33.05c | 28.80b | 32.98e | 31.75e | 34.22d | 34.43c | 34.45b | 34.40b |
| G3 | 1.20ab | 1.37a | 1.02b | 35.10a | 35.80a | 34.40a | 45.69b | 43.93b | 47.46b | 37.24a | 37.50a | 36.98a |
| G4 | 1.11bc | 1.25ab | 0.97b | 30.42b | 34.40c | 26.45b | 57.85a | 57.17a | 58.53a | 36.08b | 36.70a | 35.45ab |
| G5 | 1.06c | 1.19b | 0.92b | 27.75c | 29.90d | 25.60b | 41.72c | 42.27c | 41.17c | 30.93d | 31.25c | 30.60c |
| Locations | ||||||||||||
| L1 | 2.00a | 1.78b | 2.21a | 38.68a | 38.30a | 39.05a | 47.05a | 40.59b | 53.52a | 33.54c | 34.15c | 32.93bc |
| L2 | 1.63b | 1.97a | 1.30b | 28.85c | 32.25bc | 25.45c | 44.67b | 46.30a | 43.04b | 39.73a | 41.30a | 38.15a |
| L3 | 0.53e | 0.58d | 0.48d | 40.90a | 43.20ab | 38.60a | 44.65b | 45.81a | 43.50b | 32.18d | 32.10d | 32.25c |
| L4 | 0.75d | 1.06c | 0.44d | 31.45b | 31.80ab | 31.10b | 40.21d | 40.35b | 40.08d | 36.30b | 35.75b | 36.85a |
| L5 | 0.90c | 0.94c | 0.87c | 19.42d | 24.55c | 14.30d | 41.07c | 39.75c | 42.40c | 34.13c | 34.25bc | 34.00b |
| Mean | 1.16 | 1.26 | 1.06 | 31.86 | 34.02 | 29.70 | 43.53 | 42.56 | 44.51 | 35.18 | 35.51 | 34.84 |
| LSD0.05 | 0.124 | 0.147 | 0.207 | 2.518 | 3.408 | 3.774 | 0.392 | 0.547 | 0.641 | 1.090 | 1.57 | 1.67 |
| CV (%) | 24.13 | 18.25 | 31.03 | 17.82 | 11.64 | 20.16 | 2.02 | 2.01 | 2.28 | 6.99 | 7.01 | 7.63 |
| Orestiada (L1) | Thessaloniki (L2) | Anatoliko (L3) | Larissa (L4) | Domokos (L5) | |||||||||||
|---|---|---|---|---|---|---|---|---|---|---|---|---|---|---|---|
| Cultivar | Mean | 2019 | 2020 | Mean | 2019 | 2020 | Mean | 2019 | 2020 | Mean | 2019 | 2020 | Mean | 2019 | 2020 |
| G1 | 2.12ab | 1.72b | 2.52 | 1.97a | 1.70c | 2.24a | 0.73a | 0.81 | 0.65a | 0.79c | 1.08b | 0.45b | 0.87 | 0.91 | 0.83 |
| G2 | 2.30a | 2.29a | 2.32 | 1.35b | 1.69c | 1.00bc | 0.49b | 0.47 | 0.50a | 0.92a | 1.13a | 0.54a | 0.97 | 0.88 | 1.07 |
| G3 | 2.19a | 2.41a | 1.97 | 1.67ab | 1.83bc | 1.50b | 0.57b | 0.64 | 0.50a | 0.73c | 1.05b | 0.38c | 0.84 | 0.91 | 0.77 |
| G4 | 1.70b | 1.37bc | 2.04 | 1.61ab | 2.20ab | 1.03bc | 0.52b | 0.55 | 0.50a | 0.73c | 0.95c | 0.42b | 0.97 | 1.17 | 0.77 |
| G5 | 1.68b | 1.14c | 2.23 | 1.58b | 2.43a | 0.72c | 0.35c | 0.42 | 0.27b | 0.81b | 1.09b | 0.40b | 0.87 | 0.83 | 0.90 |
| Mean | 2.00 | 1.78 | 2.21 | 1.63 | 1.97 | 1.30 | 0.53 | 0.58 | 0.48 | 0.75 | 1.06 | 0.44 | 0.90 | 0.94 | 0.87 |
| LSD0.05 | 0.467 | 0.461 | ns | 1.269 | 0.378 | 0.644 | 0.25 | ns | 0.180 | 0.101 | 0.102 | 0.025 | ns | ns | ns |
| CV% | 22.9 | 16.8 | 24.4 | 22.6 | 12.2 | 32.3 | 31.5 | 31.5 | 24.2 | 20.3 | 15.3 | 19.9 | 22.8 | 18.7 | 25.7 |
| SL | YL | CP | CT | |||||||||
|---|---|---|---|---|---|---|---|---|---|---|---|---|
| Genotypes | Mean | 2019 | 2020 | Mean | 2019 | 2020 | Mean | 2019 | 2020 | Mean | 2019 | 2020 |
| G1 | 11.66b | 9.70a | 13.6b | 0.16bc | 0.14ab | 0.18b | 25.14d | 25.65d | 24.63d | 25.12b | 25.12b | 25.12b |
| G2 | 10.50bc | 8.47ab | 12.6b | 0.12d | 0.10c | 0.14c | 25.97b | 26.20c | 25.73b | 24.24a | 23.71a | 24.77a |
| G3 | 13.60a | 10.00a | 17.2a | 0.19a | 0.16a | 0.22a | 25.78c | 26.36b | 25.19c | 26.87c | 26.87c | 26.87c |
| G4 | 10.51bc | 8.85ab | 12.20b | 0.17ab | 0.16a | 0.18b | 24.83e | 24.52e | 25.15c | 27.51d | 27.02d | 28.01d |
| G5 | 9.82c | 7.90b | 11.80b | 0.15c | 0.13b | 0.17b | 26.45a | 26.48a | 26.43a | 27.49d | 28.27e | 26.72c |
| Locations | ||||||||||||
| L1 | 0.88d | 1.40d | 0.38d | 0.03d | 0.04d | 0.02d | 23.73c | 25.01b | 22.45d | 29.61d | 29.61d | 30.57d |
| L2 | 10.37b | 6.50b | 14.30b | 0.12b | 0.08b | 0.16b | 27.99a | 28.61a | 27.38a | 24.91a | 24.91a | 25.01b |
| L3 | 2.33d | 1.77cd | 2.90d | 0.06c | 0.05cd | 0.08c | 23.17d | 23.35d | 22.98c | 26.14c | 26.14c | 26.17c |
| L4 | 36.90a | 32.00a | 41.80a | 0.51a | 0.47a | 0.55a | 28.04a | 28.59a | 27.49a | 25.54b | 25.54b | 25.22b |
| L5 | 5.65c | 3.35c | 7.95c | 0.07c | 0.06bc | 0.08c | 25.24b | 23.65c | 26.84b | 24.99a | 24.99a | 24.52a |
| Mean | 11.23 | 9.00 | 13.46 | 0.15 | 0.14 | 0.17 | 25.63 | 25.84 | 25.42 | 26.24 | 26.24 | 26.29 |
| LSD0.05 | 1.57 | 1.592 | 2.823 | 0.017 | 0.021 | 0.286 | 0.114 | 0.095 | 0.226 | 0.114 | 0.158 | 0.189 |
| CV (%) | 31.16 | 28.01 | 33.2 | 24.68 | 23.74 | 25.28 | 1.03 | 0.58 | 1.37 | 1.36 | 24.22 | 1.14 |
Disclaimer/Publisher’s Note: The statements, opinions and data contained in all publications are solely those of the individual author(s) and contributor(s) and not of MDPI and/or the editor(s). MDPI and/or the editor(s) disclaim responsibility for any injury to people or property resulting from any ideas, methods, instructions or products referred to in the content. |
© 2024 by the authors. Licensee MDPI, Basel, Switzerland. This article is an open access article distributed under the terms and conditions of the Creative Commons Attribution (CC BY) license (https://creativecommons.org/licenses/by/4.0/).
Share and Cite
Baxevanos, D.; Kargiotidou, A.; Noulas, C.; Kouderi, A.-M.; Aggelakoudi, M.; Petsoulas, C.; Tigka, E.; Mavromatis, A.; Tokatlidis, I.; Beslemes, D.; et al. Lentil Cultivar Evaluation in Diverse Organic Mediterranean Environments. Agronomy 2024, 14, 790. https://doi.org/10.3390/agronomy14040790
Baxevanos D, Kargiotidou A, Noulas C, Kouderi A-M, Aggelakoudi M, Petsoulas C, Tigka E, Mavromatis A, Tokatlidis I, Beslemes D, et al. Lentil Cultivar Evaluation in Diverse Organic Mediterranean Environments. Agronomy. 2024; 14(4):790. https://doi.org/10.3390/agronomy14040790
Chicago/Turabian StyleBaxevanos, Dimitrios, Anastasia Kargiotidou, Christos Noulas, Antigoni-Maria Kouderi, Maria Aggelakoudi, Christos Petsoulas, Evangelia Tigka, Athanasios Mavromatis, Ioannis Tokatlidis, Dimitrios Beslemes, and et al. 2024. "Lentil Cultivar Evaluation in Diverse Organic Mediterranean Environments" Agronomy 14, no. 4: 790. https://doi.org/10.3390/agronomy14040790