Article

Prediction of Thrips Damage Distribution in Mango Orchards Using a Novel Maximum Likelihood Classifier

1
Sanya Institute, China Agricultural University, Sanya 572019, China
2
School of Intelligent Manufacturing, Hunan University of Science and Engineering, Yongzhou 425100, China
3
Hainan Penghui Agricultural Technology Co., Ltd., Ledong 572500, China
4
College of Science, China Agricultural University, Beijing 100091, China
*
Author to whom correspondence should be addressed.
Agronomy 2024, 14(4), 795; https://doi.org/10.3390/agronomy14040795
Submission received: 26 February 2024 / Revised: 27 March 2024 / Accepted: 6 April 2024 / Published: 11 April 2024

Abstract

:
Thrips constitute the primary pest responsible for reducing mango yield and quality every year in Asia. Therefore, the efficient monitoring of thrips damage across mango orchards on a large scale to aid farmers in devising rational pesticide application strategies poses a significant challenge within the current mango industry. This study designs a mango thrips damage inversion prediction method based on the maximum likelihood classifier (MLC). Initially, drone multispectral remote sensing technology is utilized to acquire multispectral data from mango orchards, which are then combined with ground hyperspectral information to identify sensitive bands indicative of mango leaf damage caused by thrips. Subsequently, correlation analysis is conducted on various vegetation indices, leading to the selection of the Greenness Normalized Difference Vegetation Index (GNDVI), which exhibits a strong correlation coefficient of 0.82, as the spectral characteristic parameter for the inversion prediction model. The construction of a remote sensing prediction model for thrips damage distribution in mango orchards is then undertaken based on the MLC. Acknowledging the bias-variance trade-off inherent in the MLC when processing spectral data and its potential limitations in feature extraction and robustness, this study proposes a modification wherein neighboring pixels are weighted differently to enhance the model’s feature extraction capabilities. Experimental results show that the novel MLC maintains stable estimation levels across various numbers of domain pixels, achieving an inversion accuracy of 91.23%. Through the reconstruction of the pixel matrix, the damage distribution of thrips in mango orchards can be swiftly and comprehensively visualized over extensive areas.

1. Introduction

Mango is popular among consumers due to its unique flavor and taste. Mango planting areas are widely distributed in tropical and subtropical regions, with Asia’s mango production accounting for 72.9% of the world’s production [1]. However, due to the climate’s high temperature and humidity, pests and disease outbreaks in mango orchards are frequent, becoming a difficult and painful aspect of mango plant protection operations [2]. Thrips is the most important insect pest in Asian mango, which mainly inserts its mouthparts into the mango leaf or fruit flesh to suck the sap, destroying the internal tissues and chlorophyll cells, thus affecting the gathering of water and nutrients required for photosynthesis [3]. Rapid monitoring of thrips damage in mango orchards over a wide area, along with effective evaluation of control measures, is essential to support the formulation of the “Double Reduction” policy for mango quality improvement and efficiency. This will also better assist farmers in formulating application programs to improve management practices, as well as to improve mango yield and quality.
Researchers have conducted numerous studies employing hyperspectral imaging for ground-based spectral observations aimed at characterizing the spectral response of fruit trees under pest and disease damage [4,5,6]. For instance, Carlos et al. employed hyperspectrometry to evaluate the progression of early anthracnose in mango fruits, achieving an accuracy exceeding 91% through the integration of a prediction algorithm. This non-destructive early detection approach holds promise for enhancing mango quality, increasing commercial value, and mitigating farmers’ losses [7]. Despite ground-based spectral observation offering high pixel resolution, the data collection process is intricate and inefficient, often lacking non-destructive detection capabilities, thus falling short of meeting the demands for rapid and large-scale detection. Particularly for seasonal thrips outbreaks in mangoes, precise and rapid assessment of thrips damage conditions at critical stages, such as tip and blossom, could enable the formulation of targeted application protocols to minimize the risk of thrips resistance due to inappropriate medication usage. Although satellite remote sensing technology has been extensively utilized for large-scale crop pest and disease monitoring, limitations in spatial resolution and relatively long revisit times constrain its potential for continuous dynamic and accurate monitoring of agricultural conditions in the field. In recent years, the application of unmanned aerial vehicles (drones) equipped with spectral cameras for observing damage characteristics of fruit trees through ground experiments and spectroradiometers has emerged as a burgeoning trend in pest and disease monitoring. Numerous studies have reported the adoption of drone-based spectral remote sensing methods for monitoring pest and disease agro-industrial conditions in forestry and field environments. For instance, Luo Qingqing et al. utilized drone hyperspectral remote sensing data to effectively predict various damage levels of small girdling insect pests across 60 different pest classes in Sevier’s apples by establishing relevant index models and regression equations [8]. Zheng Beijun et al., extracted characteristic wavelengths, indices, and spectral parameters from canopy spectra closely related to damage degrees from the poisonous moth on bristlecone bamboo using Fisher’s discriminant method. The study demonstrated the feasibility of drone spectral remote sensing for large-area detection of the poisonous moth [9]. Ma Yunqiang employed drone spectral images combined with deep learning technology to accurately map the distribution of the cutter moth, providing crucial data support for local decision-making authorities in Yunnan to manage and control cutter moth infestations, thereby contributing significantly to ecological protection and forestry resource management in the region [10]. Furthermore, Roope et al. utilized a multispectral drone to collect canopy spectral information of European spruce infested with beetles in Lahti, Finland, employing a machine learning algorithm to automatically identify beetle-induced damage levels. Their study illustrated the potential of remote sensing spectral images for single-tree analysis and corrected spectral imagery in detecting the health status of urban greening forests [11]. Lastly, Marston et al. applied a simple linear regression method to determine contingency responses induced by soybean aphids based on drone hyperspectral reflectance data, highlighting the efficacy of such methods in pest monitoring [12].
The utilization of vegetation indices for characterizing pigments, water, carbon, nitrogen, and other chemical components of fruit trees has emerged as a focal point in the application of spectral remote sensing within agricultural contexts. Common indicators for damage vegetation analysis encompass the normalized vegetation index (NVI), canopy chlorophyll content index (CPI), summed greenness index (SGI), and color infrared composite index (CIRCI), among others. Nonetheless, these indices fail to discriminate between damage induced by pest and disease infestation in fruit trees and damage stemming from other sources. Moreover, they might solely suffice for monitoring temporal alterations in the distribution of pests and diseases within fruit trees known to be under damage [13]. Thrips, the focus of this study, provoke several longitudinal reddish-brown stripes near the primary veins of affected mango tree leaves, resulting in rust spots, reduced pigmentation, and diminished water content. There exists a certain correlation between the chemical content and spectral characteristics of leaves at varying damage levels. Consequently, in orchards where thrips emerge as the predominant pest, leveraging drone spectral remote sensing imagery in conjunction with diverse vegetation indices facilitates meticulous detection of mango tree canopies exhibiting yellowing rust spots or senescence characteristics. Nevertheless, further refinement of key algorithms and models is imperative to ensure reliable and user-friendly inversion predictions. Spectral remote sensing inversion prediction algorithms broadly fall into two categories: empirical algorithms and model-based quantitative inversion algorithms. Empirical algorithms primarily adopt the ratio method, exemplified by the polynomial algorithm [14] and SeaWiFS algorithm [15]. Conversely, with the evolution of bio-optical models, model-based quantitative inversion algorithms have gained prominence for inverting the correlation between canopy features and spectral radiance features indicative of pest and disease damage. These quantitative inversion algorithms predominantly employ linear regression models, such as simple linear regression [16], Lasso regression [17], and partial least squares regression [18]. However, due to the substantial redundancy in original spectra and the nonlinear relationship between spectra and vegetation canopy, linear models inadequately capture the intricate relationship between remote sensing observation indicators and canopy covariates, leading to information loss and distortion, thereby constraining practicality. Nonlinear quantitative inversion models chiefly involve the utilization of machine learning classifiers to categorize and analyze pixel vectors. Commonly employed models include the maximum likelihood classifier (MLC) [19], support vector machine (SVM) [20], neural network [21], and logistic regression [22], among others, which obviate the necessity for feature extraction to derive classification outcomes. Among these machine learning algorithms, the MLC, grounded in Bayesian theory and augmented with prior knowledge fusion for classification, emerges as straightforward and user-friendly. Moreover, its density distribution function effectively elucidates classification outcomes, rendering it more suitable for classifying multispectral data with fewer bands [23]. Given that this study is based on DJI P4 multispectral drone data capturing spectral features of mango canopy with limited bands, the MLC will primarily underpin the spectral remote sensing inversion prediction of mango thrips damage levels.
In this study, we leverage drone-based spectral remote sensing data along with field survey sampling methods to establish machine learning models for predicting and analyzing the damage caused by thrips in various regions of mango orchards. The aim is to provide preliminary data support for the intelligent and precise operation of modernized new pesticide application machinery. To enhance the adaptability of the prediction models to anomalous spectral pixels, we propose a novel MLC model to infer the extent of thrips damage across the entire experimental area. Through the methodology presented in this paper, a new dynamic monitoring approach is provided for investigating the harmful characteristics and occurrence patterns of mango thrips. Additionally, it offers a rapid research method for evaluating the effectiveness of thrips control pesticides, thereby holding significant importance for effective orchard management among mango cultivators.

2. Materials and Methods

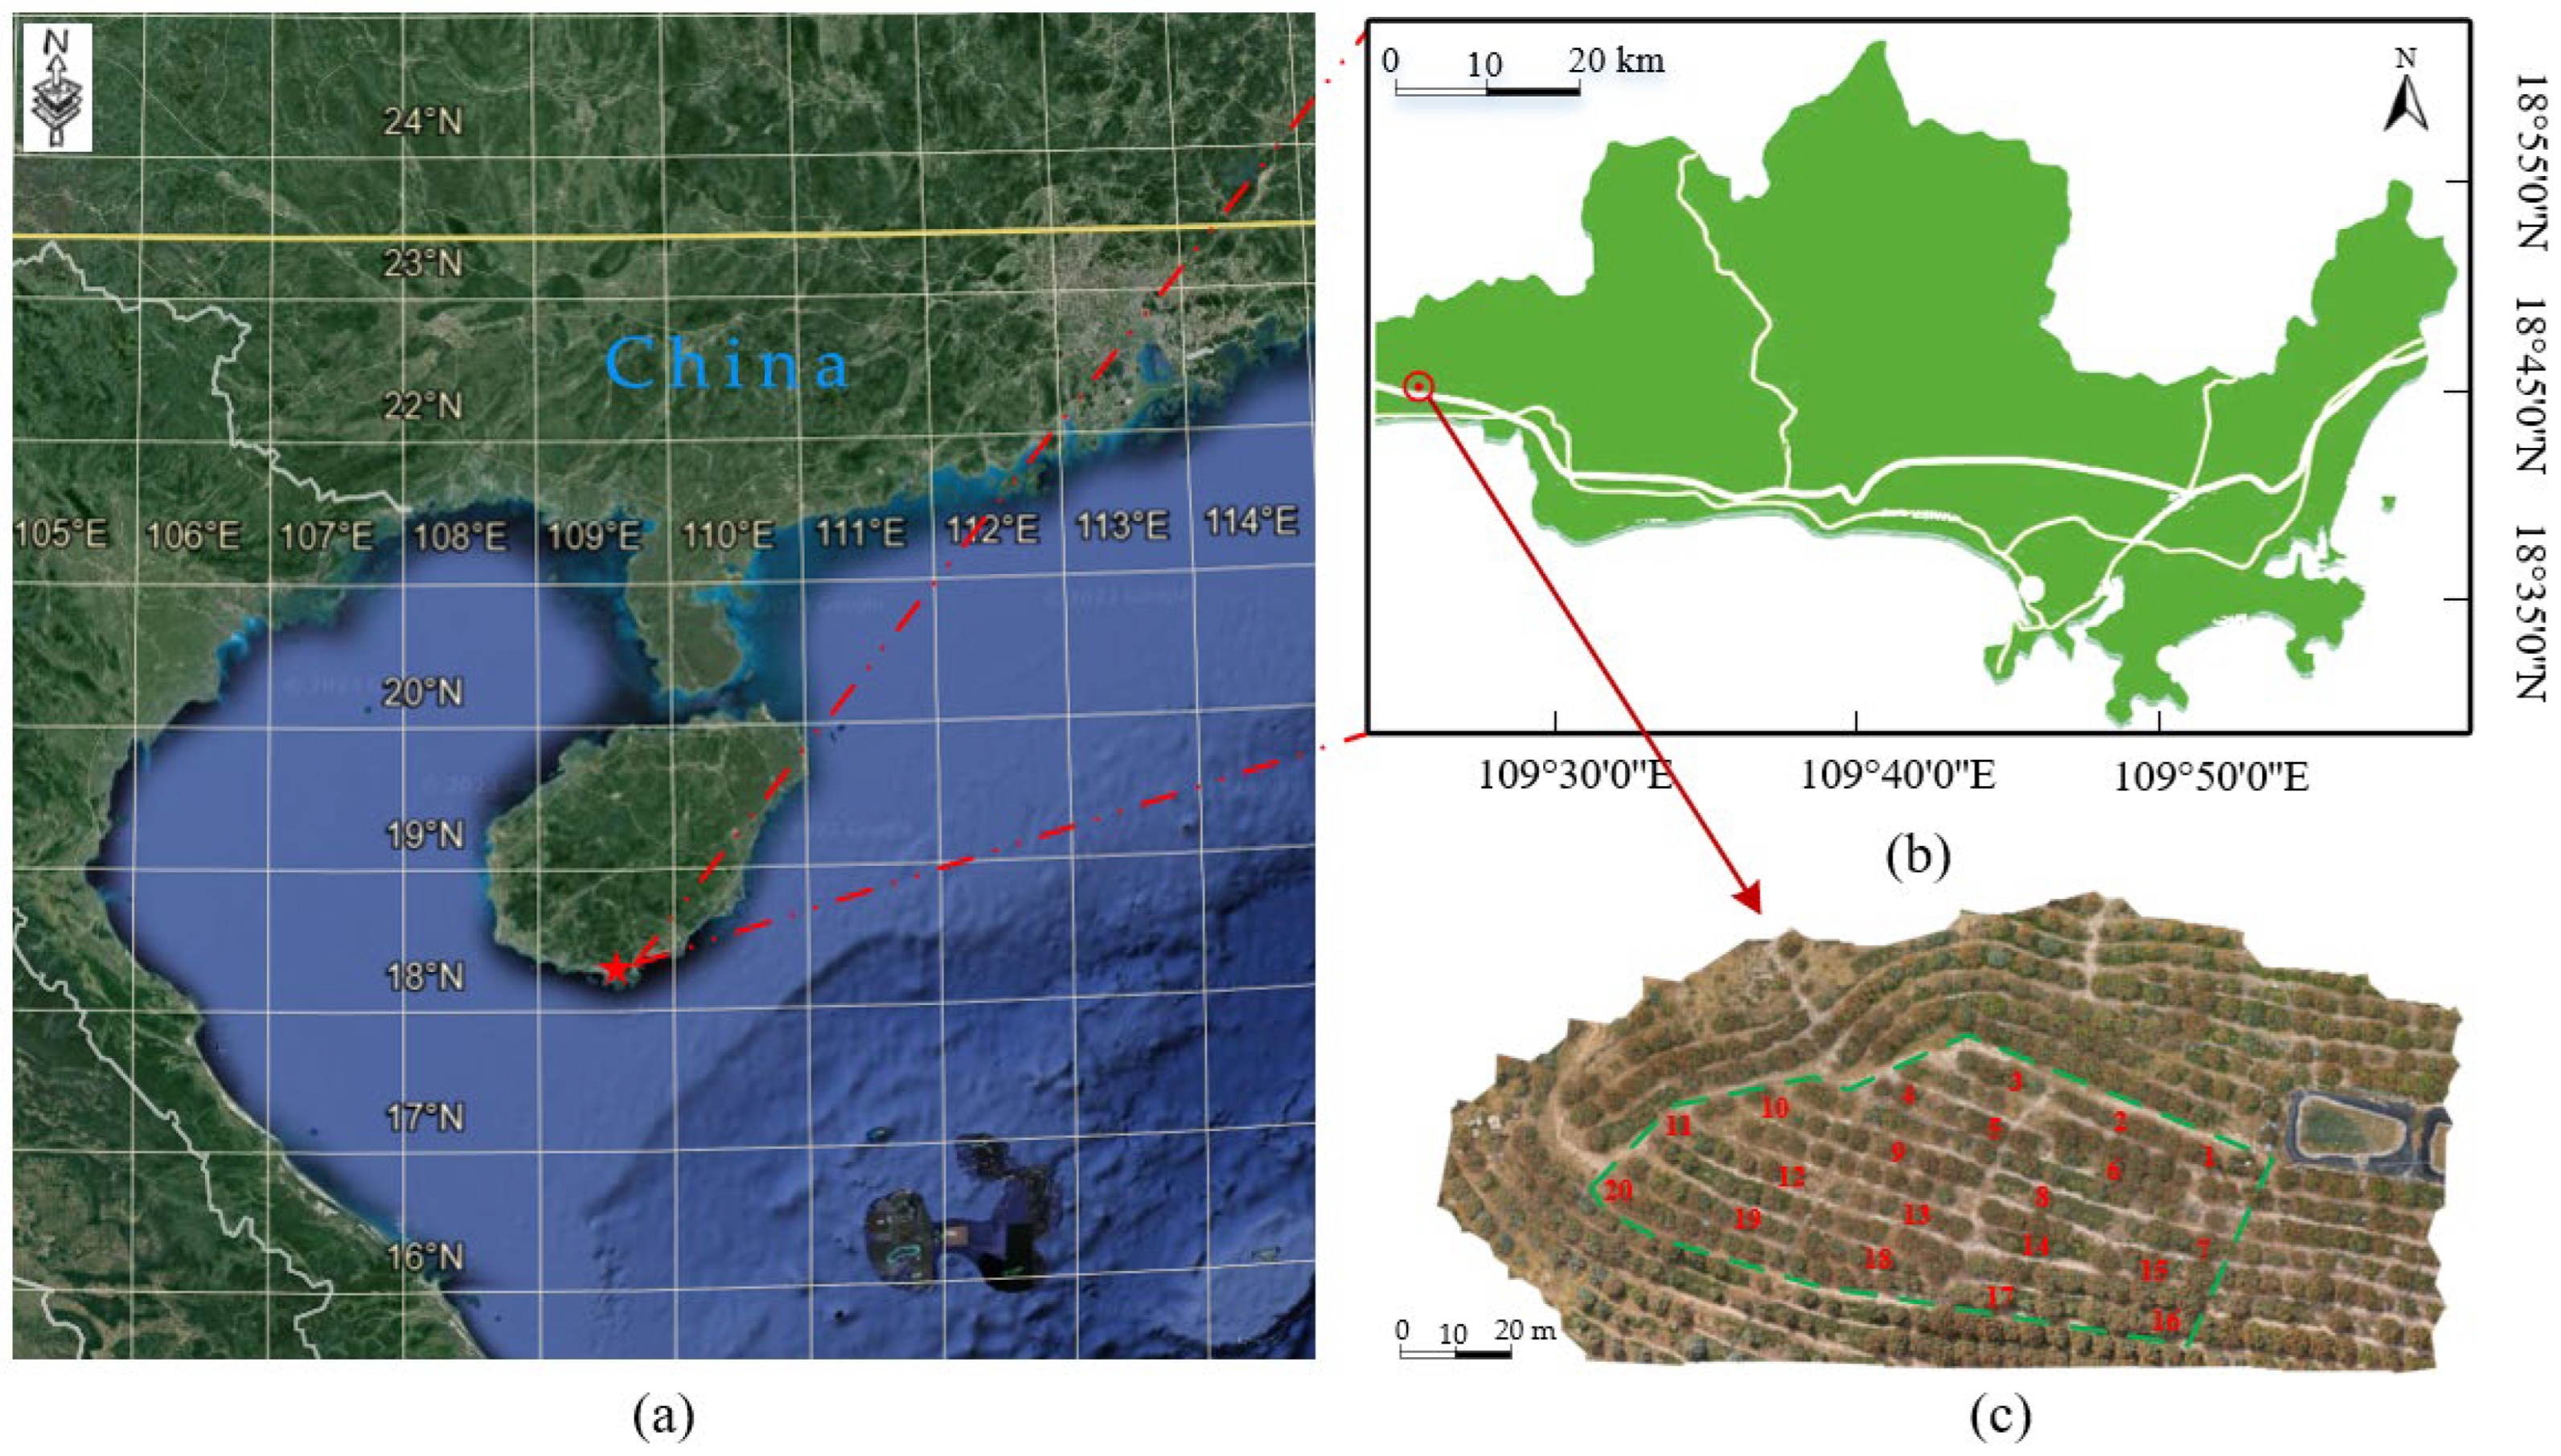
2.1. Experimental Site

The experimental site is located within a mountainous mango orchard in Sanya City, Yazhou District, Hainan Province, China, specifically at Sangongli Village (109°18′9578″ E, 18°42′2322″ N), as indicated by the green dashed box in Figure 1c. The orchard primarily cultivates Guifei mango, with trees aged 7–8 years, averaging a height of 2.7–2.9 m and a canopy diameter of 3.2 m. The spacing between trees is 4.5 m, with rows spaced 5 m apart. Mango trees exhibit robust growth, with fully developed leaves distributed in an umbrella-like manner across the canopy, with almost no leaves within the canopy interior.

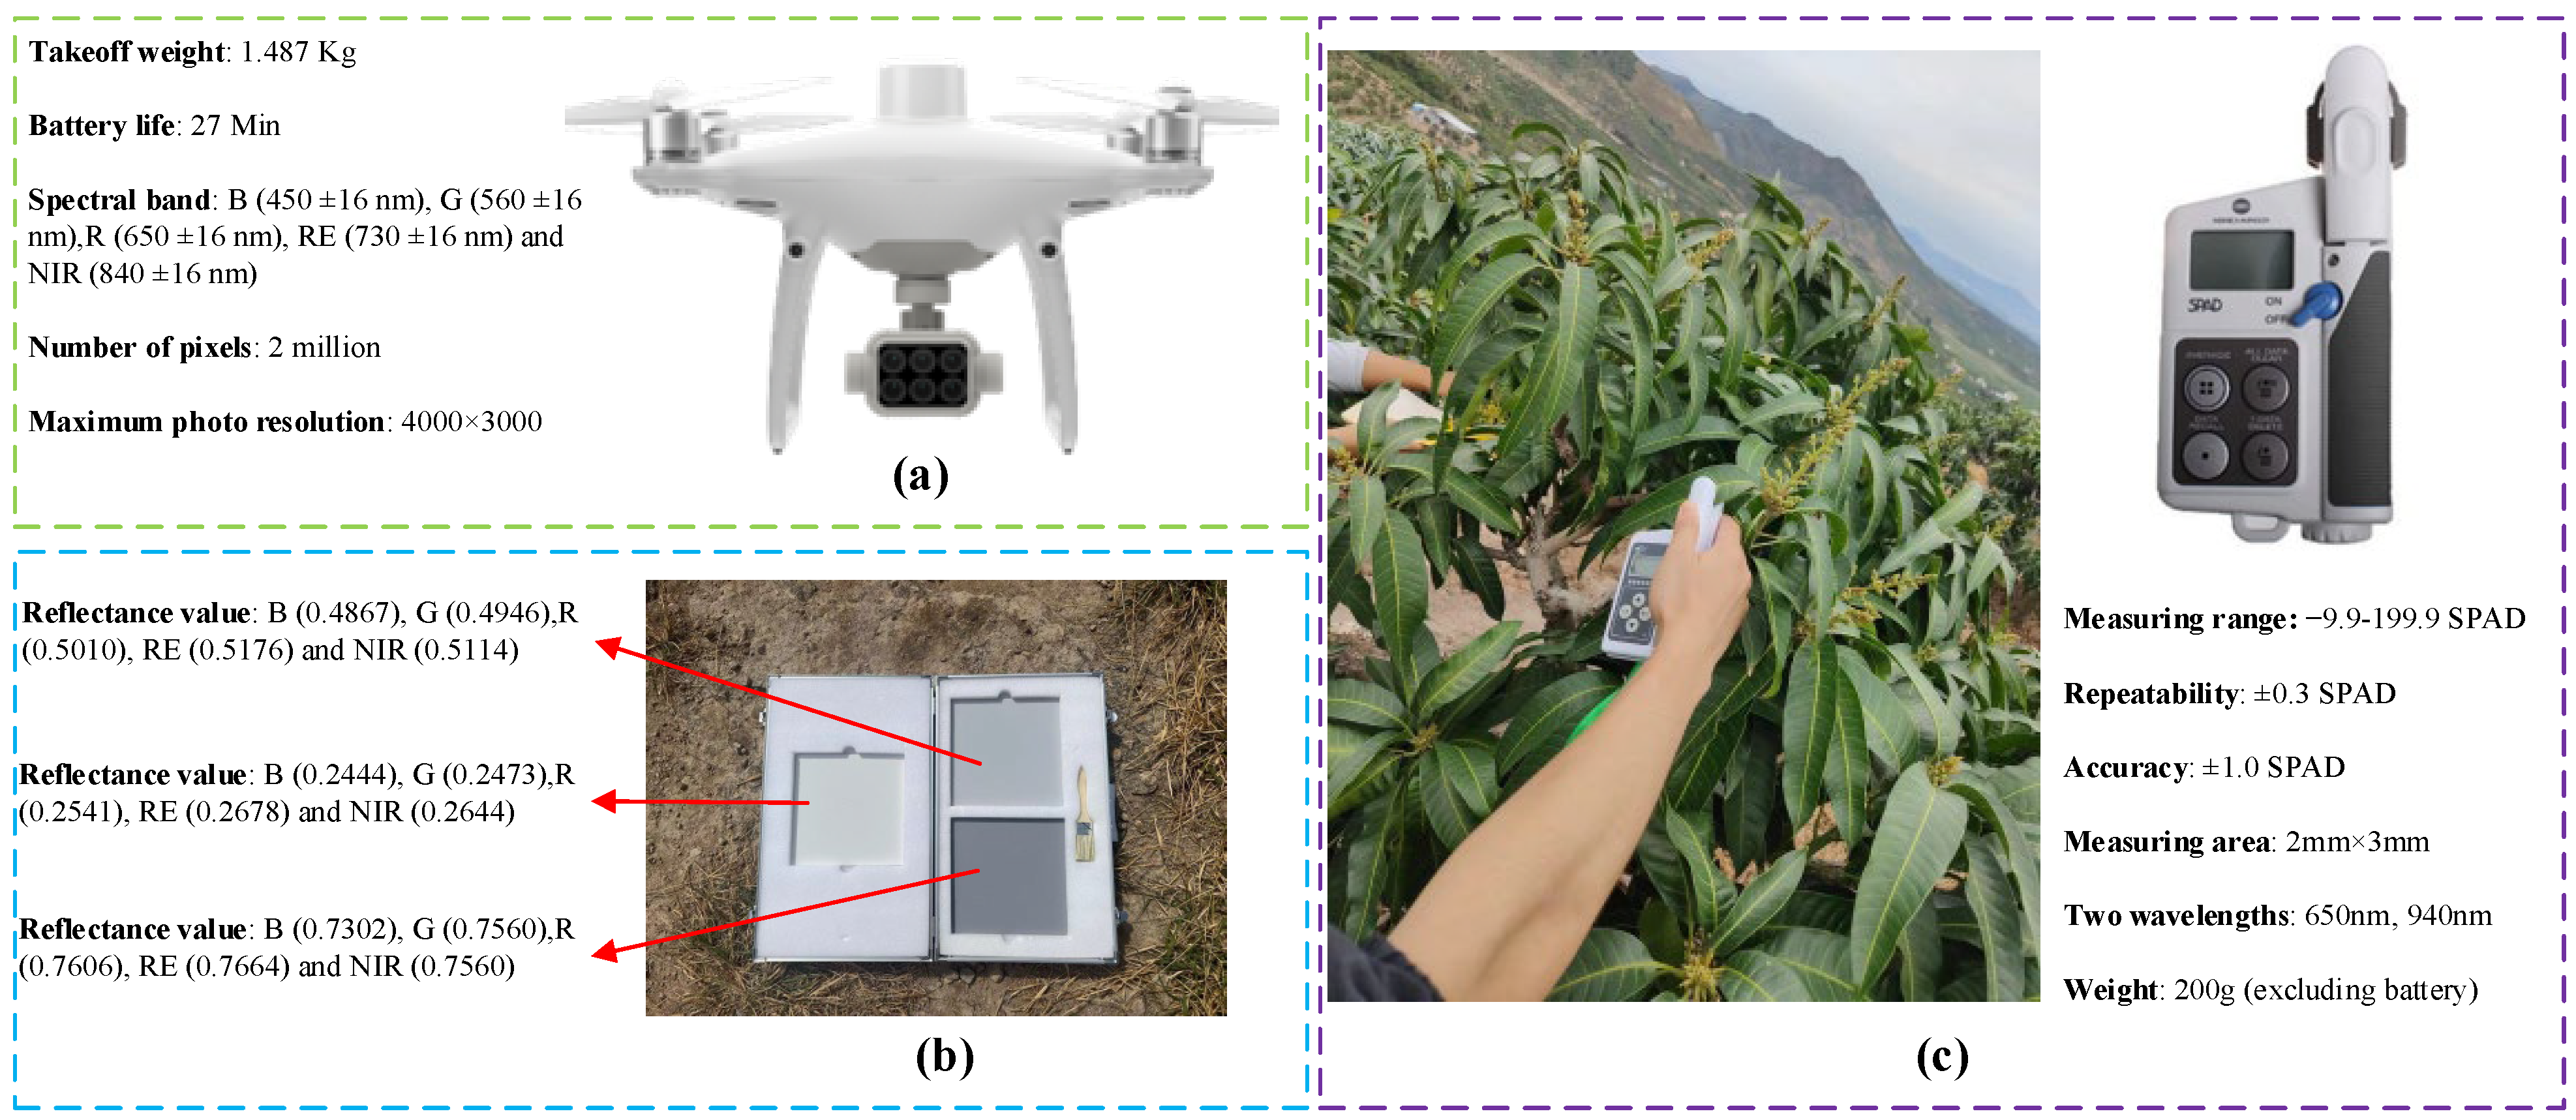
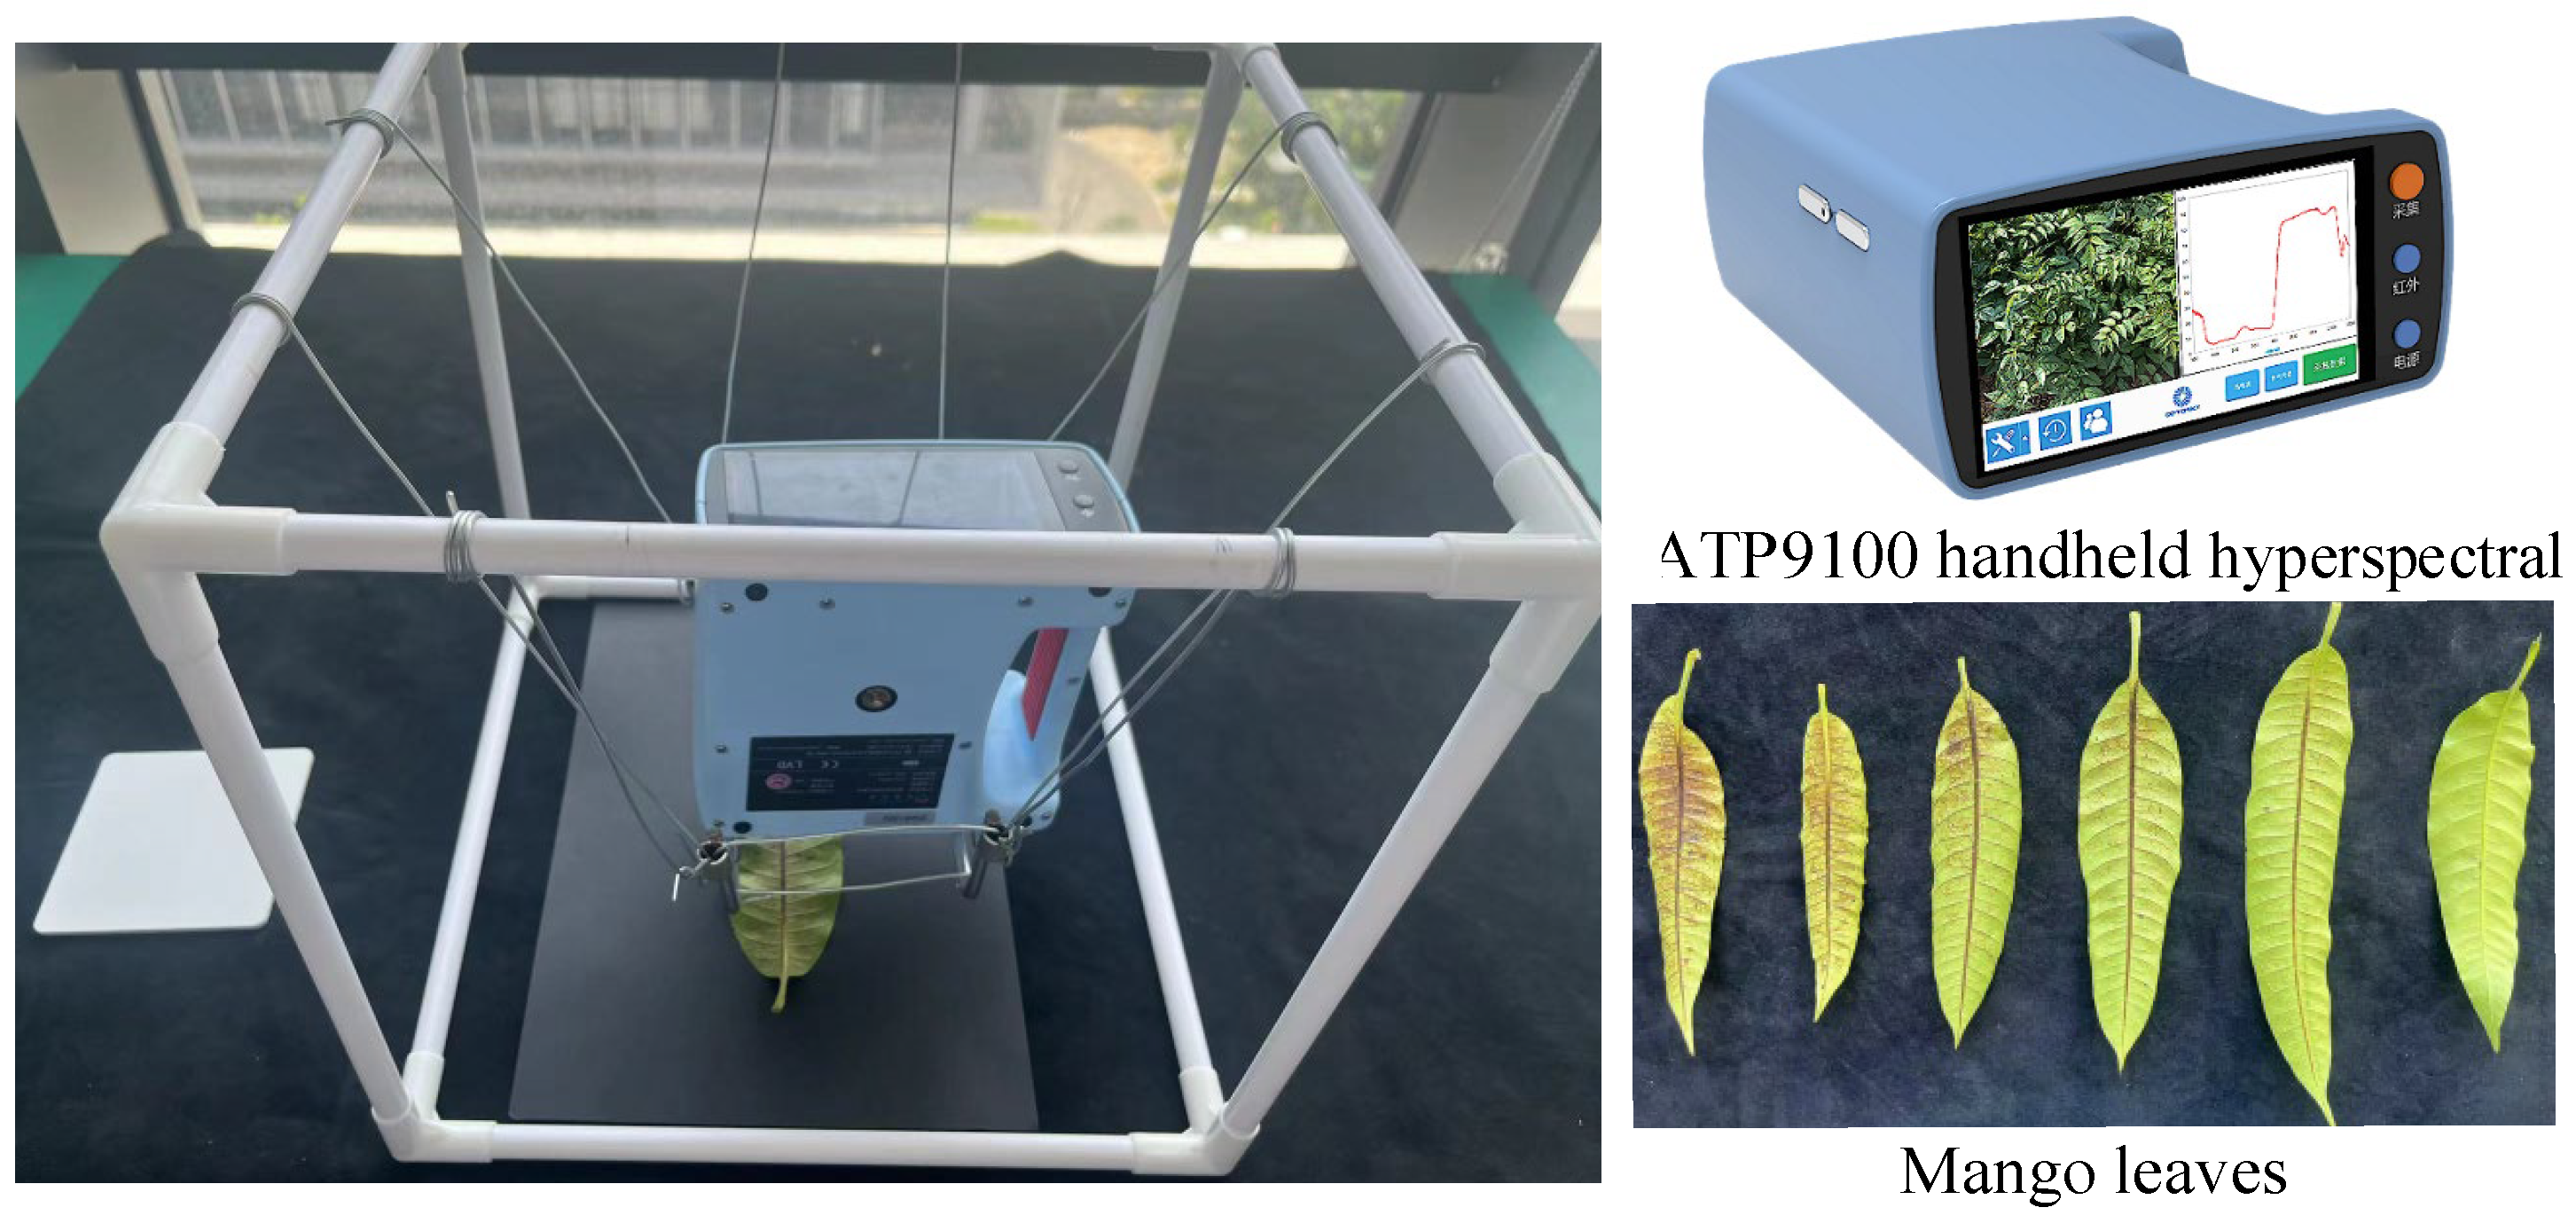
2.2. Drone Remote Sensing System and Data Acquisition

A DJI P4 multispectral drone (Shenzhen Dajiang Innovation Technology Co., Ltd, Shenzhen City, China, https://www.dji.com/cn, accessed on 5 April 2024) in Figure 2a, was utilized for collecting multispectral images (Figure 1c). The resolution of the DJI P4 multispectral sensor is 1600 × 1300 pixels, encompassing six spectral bands, with the specific bands (central wavelength, wavelength width) being blue band (B, 450 ± 16 nm), green band (G, 560 ± 16 nm), red band (R, 630 ± 16 nm), red-edge band (RE, 730 ± 16 nm), and near-infrared band (NIR, 840 ± 16 nm).
The images were captured during the mango flowering period from 12 to 22 September 2023, under clear weather conditions with a wind speed of 3 levels. The flight route of the drone was preset and automatically controlled by a DJI GS Pro station (Shenzhen Dajiang Innovation Technology Co., Ltd., Shenzhen City, China) around 11 a.m., with a forward overlap rate of 80% and a side overlap rate of 70%. Before each image capture, three standard reference whiteboards were preset, and the reflectance of the calibration whiteboard (Figure 2b) was synchronously measured to calibrate the radiance of the drone images (multispectral and hyperspectral).
To ensure the diversity and representativeness of sampling points, 20 trees were randomly selected within the experimental area, as depicted in Figure 1c. Five sampling points were then randomly designated on each tree. Utilizing a SPAD 502 Plus chlorophyll concentration meter (Konica Minolta Holdings, Inc., Tokyo, Japan) equipped with five-point sensors, the chlorophyll concentration values of the leaves at each sampling point were measured sequentially. The average of the five chlorophyll readings was calculated to represent the chlorophyll value for each sampling point. Simultaneously, high-precision GPS was employed to record the positions of different sampling points, facilitating subsequent inversion processes.

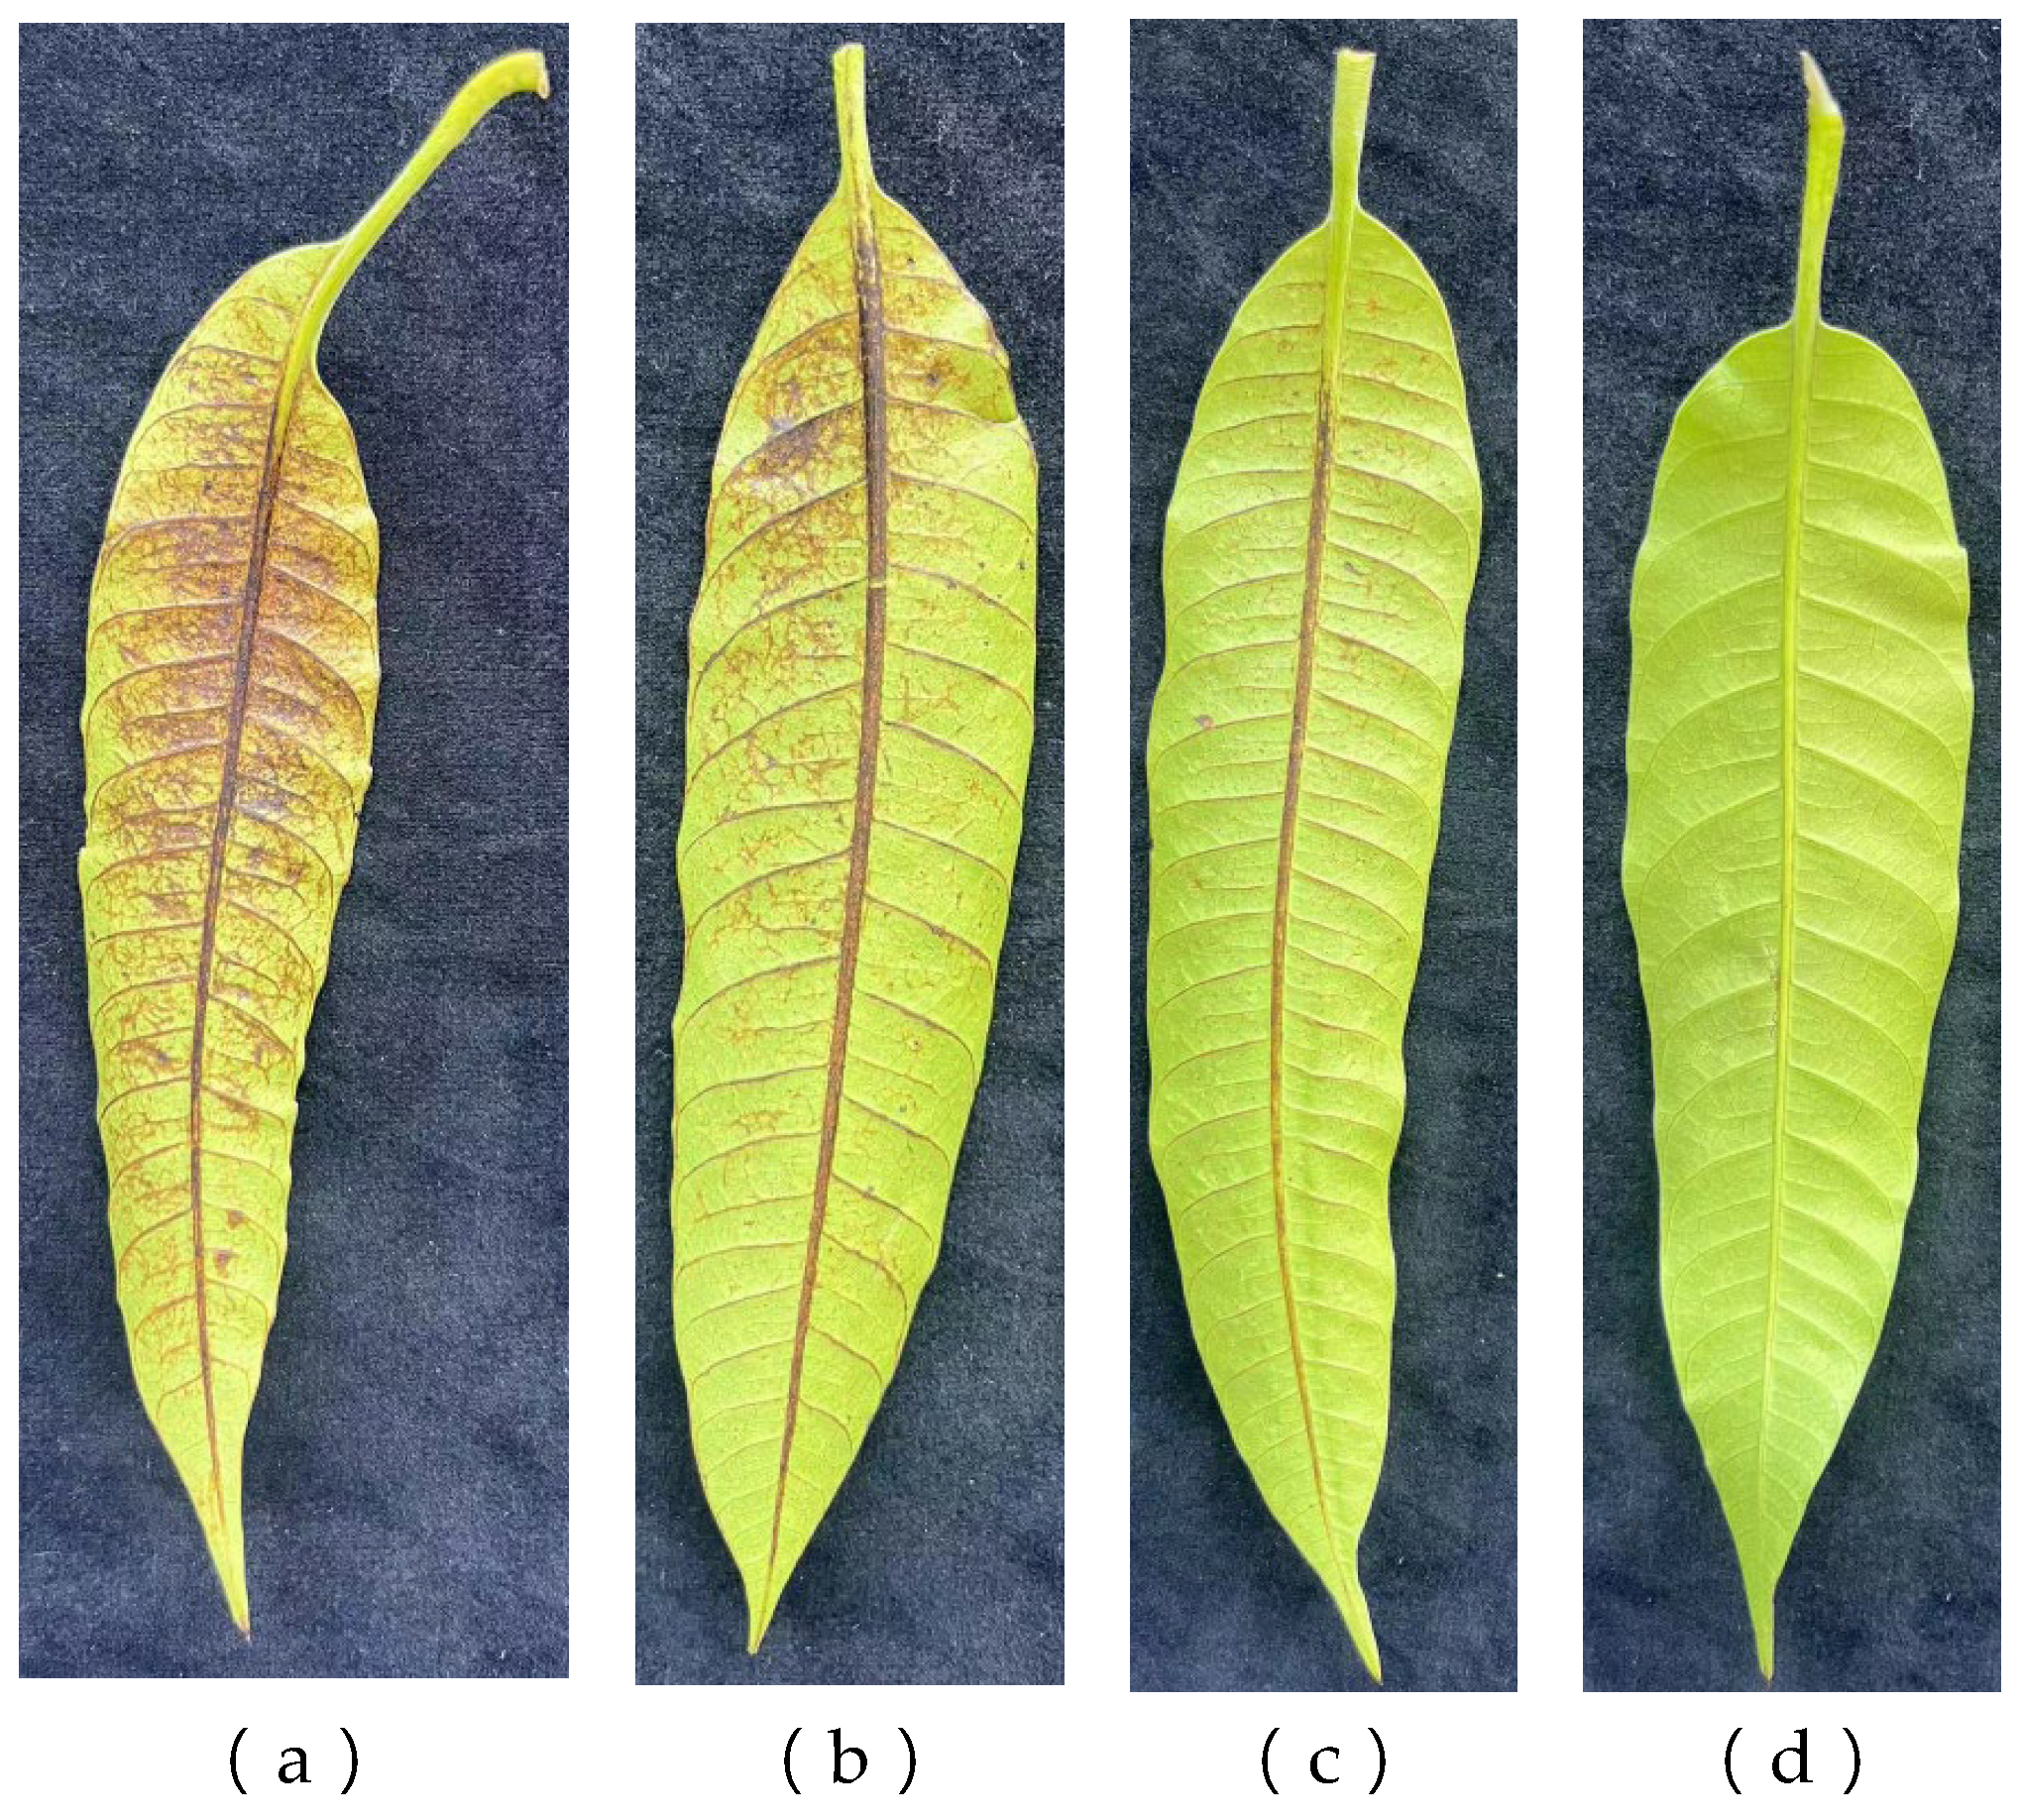
2.3. Classification of Mango Thrips Damage Levels

Thrips primarily damage fruit trees by inserting their mouthparts into mango leaves or fruit tissues to feed on sap. Affected leaves exhibit several longitudinal reddish-brown streaks near the main vein, forming rust spots. The incidence of rust spots varies with the severity of infestation, as illustrated in Figure 3. Following the grading criteria for mango thrips damage outlined in the “Standards for Disaster Assessment of Forestry Pests”, the severity of rust spots is categorized, recorded, and photographed. The grading of different rust spot rates is shown in Table 1. Subsequently, the collected data are utilized as sample and validation datasets for constructing the information inversion model and assessing its accuracy.

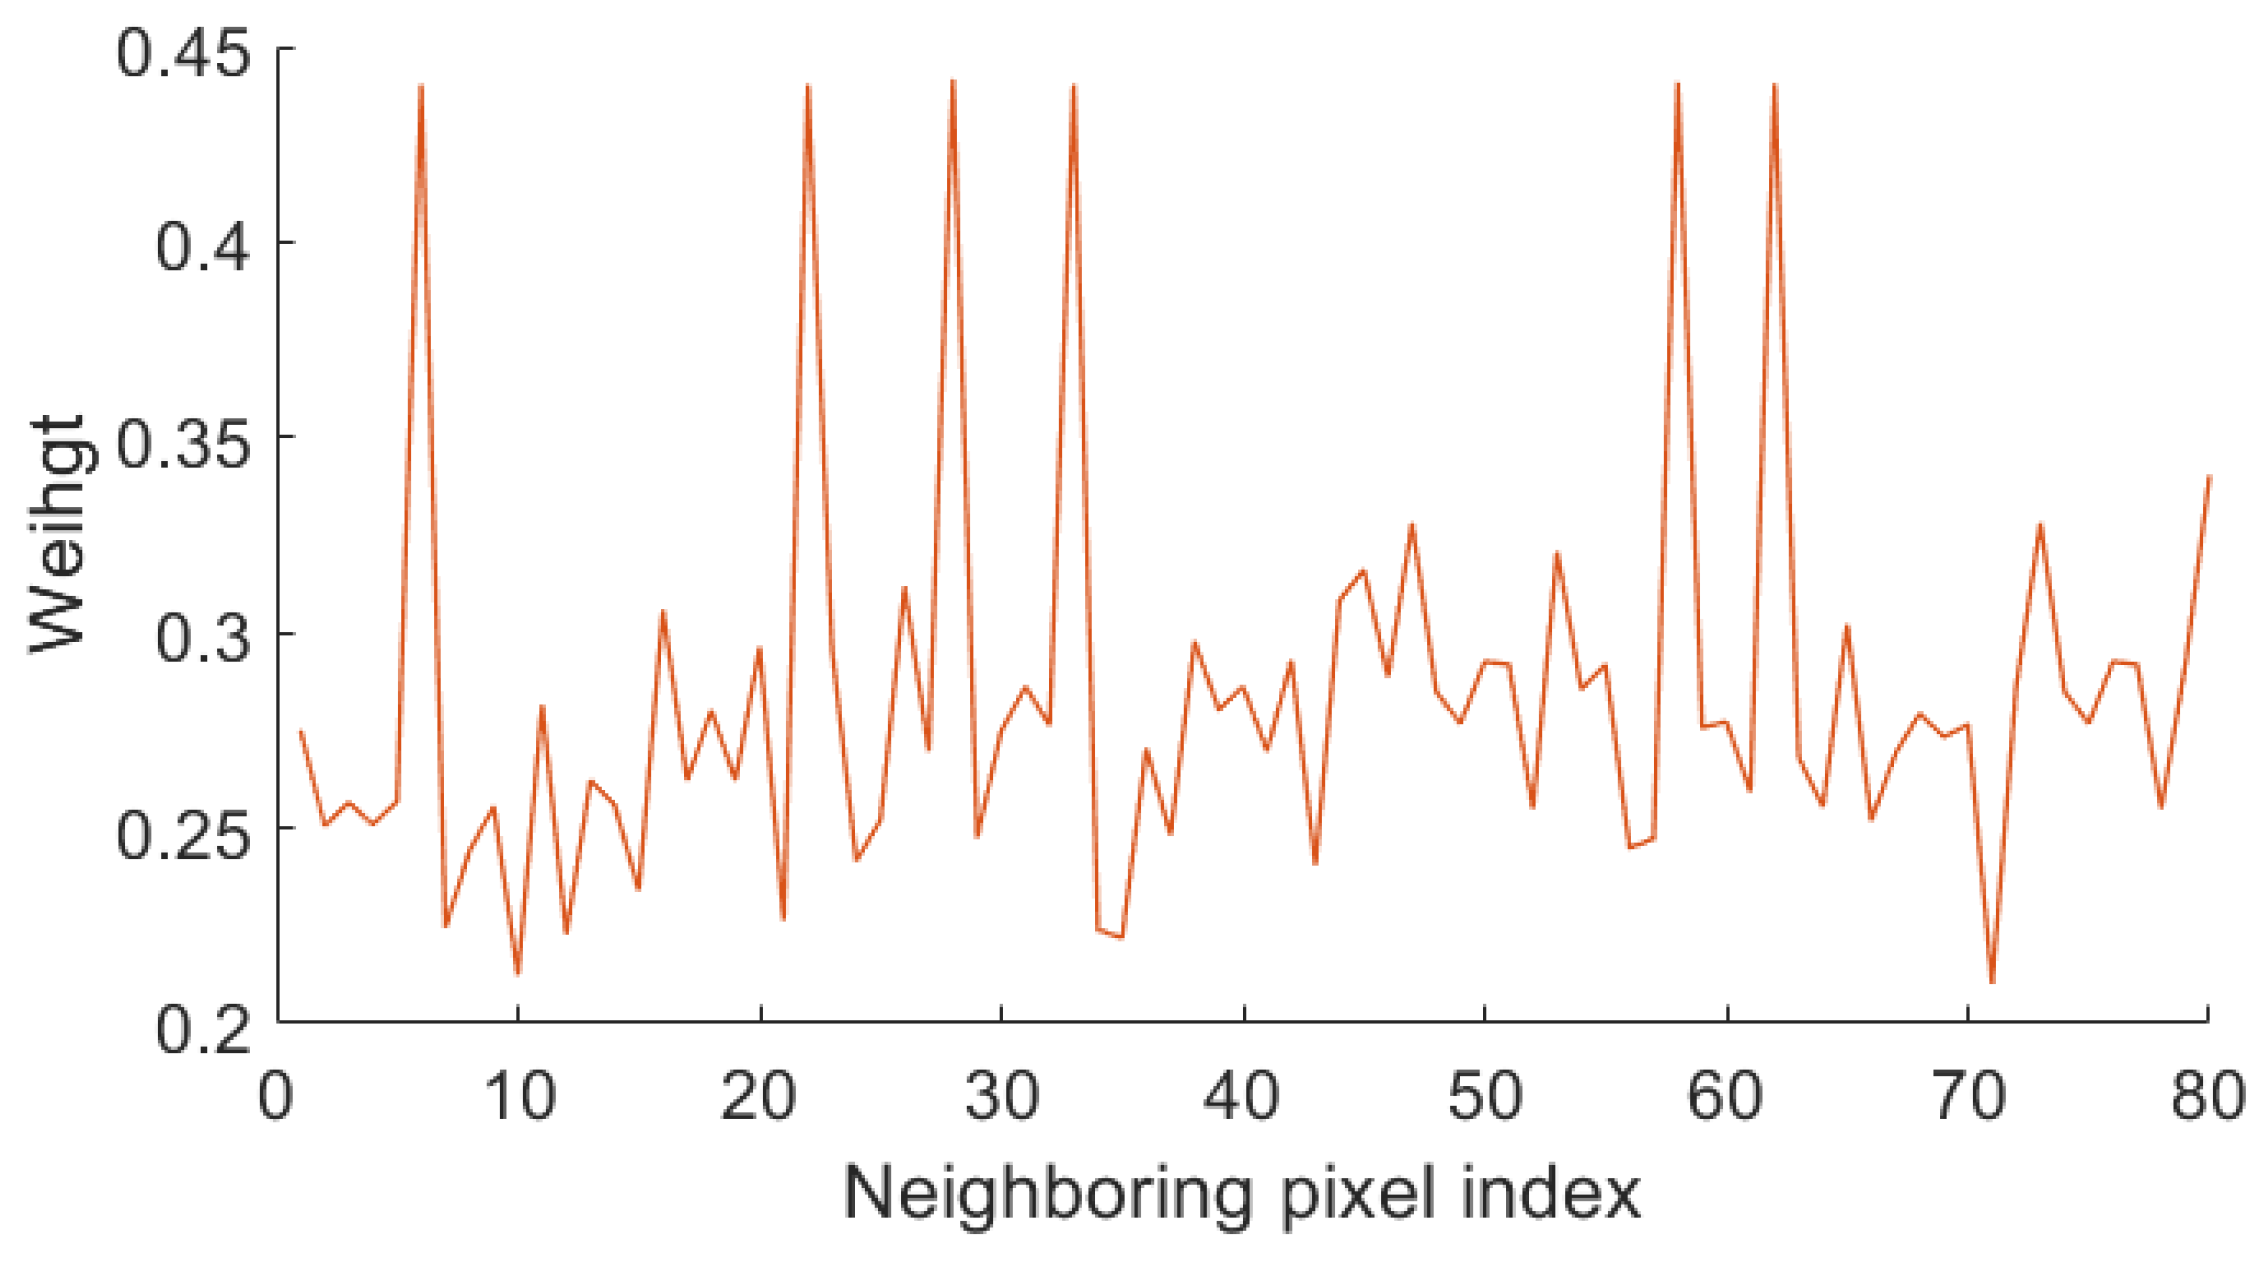
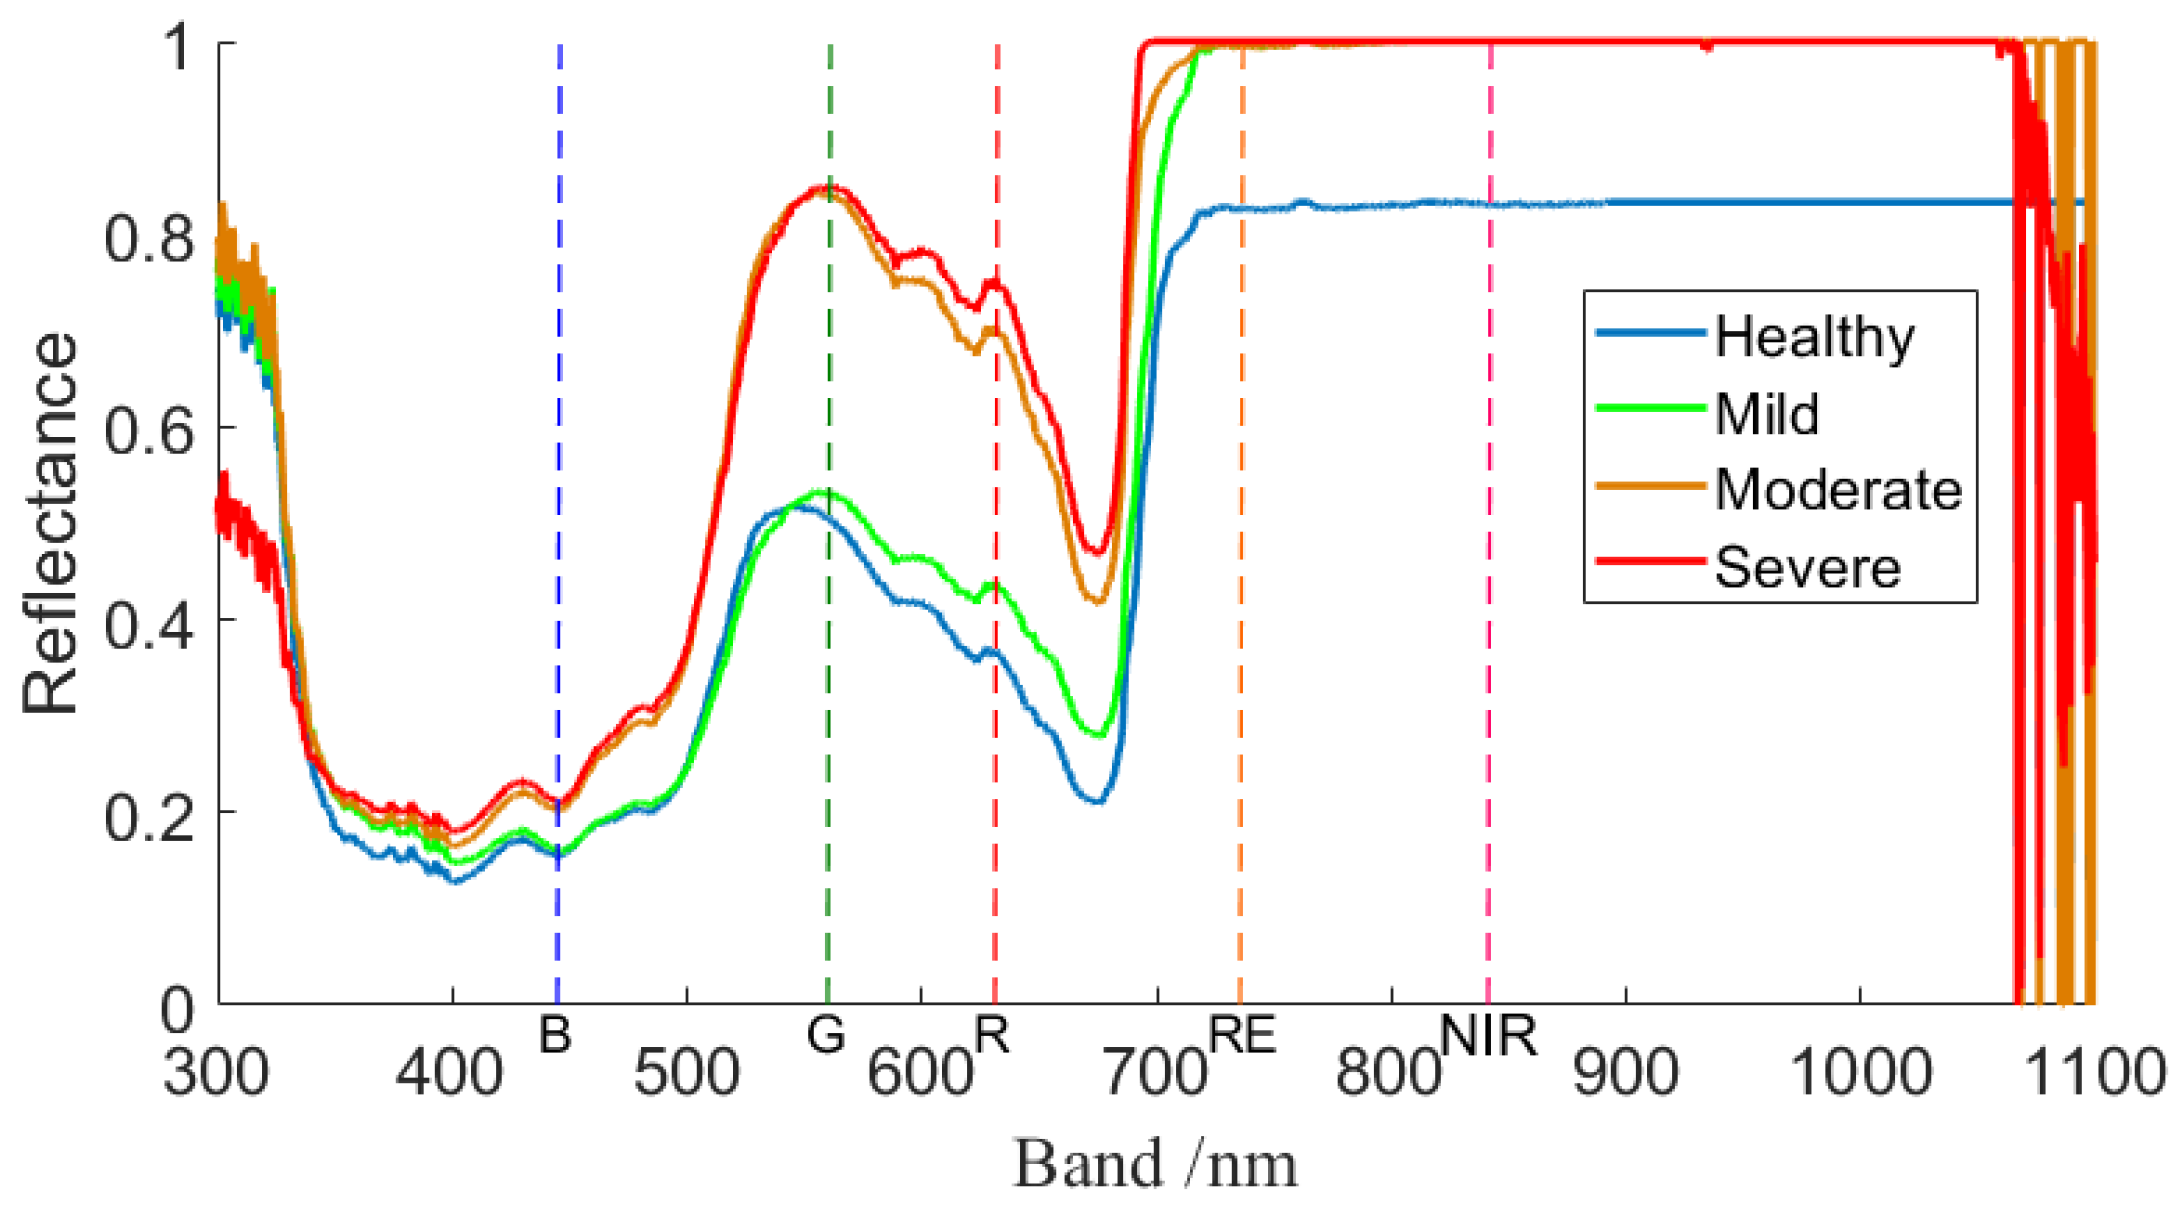
2.4. Feature Wavelength Extraction

Affected by thrips, the spectral characteristics of the mango canopy change, and as the severity of the pest damage increases, these spectral changes become more pronounced. Therefore, starting from the spectral characteristics of the canopy affected by thrips at different degrees of damage, model inversion, classification, and accuracy verification are conducted through band combination operations combined with machine learning algorithms.
The absorption and reflection characteristics of plants vary with the wavelength of electromagnetic radiation and their characteristics. Plants exhibit different degrees of changes in absorption and reflection characteristics at different wavelengths under conditions such as pest and disease infections, known as spectral response to pests and diseases. The spectral reflectance of mango leaves at various damage levels was collected by using ATP9100 handheld hyperspectral spectrometer (spectral range: 300–1100 nm; wavelength accuracy: ±0.5 nm; spectral resolution: 1.4 nm@756 nm; spectral sampling interval: 0.4 nm. OPTOSKY photonics, Inc., Xiamen, China), as shown in Figure 4.
Ten mango leaf samples were collected under different levels of stress, with 10 samples taken from each of the following three parts of the leaf: base, middle, and tip. Hyperspectral data were acquired for each leaf sample at these three locations. The reflectance values of the spectral data for the same stress level were averaged across different bands to obtain the spectral curves as shown in Figure 5.
Through comparative analysis from Figure 5, it was observed that in the B, G, and R bands, characteristics where the reflectance decreases with the degree of damage are evident. Conversely, in the NIR and RE bands, the differences in radiance values of mango leaves under varying degrees of damage—light, moderate, and severe—are relatively indistinct. To enhance the sample size of the dataset, this study used the B, G, R, RE, and NIR bands as the feature bands for subsequent computation of various vegetation indices, aiming to quantitatively predict the degree of mango thrips damage across the entire remote sensing image.

2.5. Vegetation Index Construction

This study selected commonly used vegetation indices, such as the Normalized Difference Vegetation Index (NDVI), Enhanced Vegetation Index (EVI), Soil Adjusted Vegetation Index (SAVI), Leaf Chlorophyll Content Index (IC), Visible Vegetation Index (VDV), Red–Green Ratio Index (RGR), Normalized Green–Red Difference Index (NGRD), Excessive Greenness Index (EXG), Excessive Greenness and Redness Difference Index (EXGR), Vegetation Color Index (CIVE), Difference Vegetation Index (DV), Greenness Normalized Difference Vegetation Index (GNDVI), Normalized Difference Greenness Index (INDG), and Wide Dynamic Range Vegetation Index (WDRV), to establish the spectral characteristics of mango leaf reflectance. The computational formulas and reference sources for various vegetation indices are presented in Table 2. Through correlation coefficient analysis, the relationship between each vegetation index and the measured rust incidence on mango canopies was investigated, with highly correlated vegetation indices selected for subsequent inversion prediction tasks.

2.6. Prediction Model of Mango Thrips Leaf Damage Degree Based on the Novel MLC

The MLC is a typical supervised classification method widely applied in the field of spectral remote sensing. Its fundamental approach involves utilizing spectral reflectance values within regions of interest to classify entire spectral images based on similar reflectance values, assuming that the data follow a normal distribution [28]. Through analysis using SPSS software (version 19.0), it was determined that the spectral image data involved in this study conform to a normal distribution. Consequently, the MLC was selected as the predictive model for assessing the degree of mango thrips leaf damage in this study.
Spectral reflectance values from sampling points with different levels of damage were used as training samples, with reflectance values ranging between 0 and 1. The determination of the probability density function of the normal distribution depends on the mean and variance. In this study, the mean and variance of the spectral reflectance of the training samples were used as the mean and variance of the probability density function of the reflectance values corresponding to each level of damage. Assuming there are n spectral bands in the imagery, the expression for the conditional density function of the i -th damage level corresponding to a normal distribution class is:
P x | y i = e i 1 1 2 2 π n 2 e x p 1 2 x μ i τ e i 1 x μ i
where x represents the spectral reflectance values of pixels in the region of interest, and   y i   denotes the categories of damage severity for pixels in the region of interest. e i   represents the variance of the n bands for the i -th damage level, and μ i represents the mean vector.
The damage levels set in this study were divided into four categories. Therefore, there are four corresponding probability density functions, allowing for the calculation of the probability of each type. This is equivalent to calculating the probability that the reflectance value x * of a random pixel point A belongs to the i -th category among the four categories. According to Bayes’ theorem, the expression for the posterior probability of the i -th category among the four categories can be obtained as follows:
P A y i | x * = P x | y i × P y i P x *
Here, P y i serves as the prior probability, denoting the proportion of rust rates corresponding to a particular level of severity within the entire spectral image, with an initial estimated value set to 1/4. Combining Equations (1) and (2) and simplifying through logarithmic transformation yields the expression:
P A y i | x * = 1 2 ln 2 π n e i 1 2 x μ i τ e i 1 x μ i
However, traditional maximum likelihood models exhibit varying degrees of deviation from data points, primarily due to the bias-variance trade-off inherent in modeling. Insufficient model complexity, inadequate extraction of relevant features, or features that are not entirely correlated with the original data can all impact the robustness and generalization ability of the model. To address this issue, this study proposes weighting the neighboring pixels of spectral images using different weights calculated by the maximum likelihood method to enhance the model’s adaptability to uneven pixels. Following the approach outlined in reference [29], MLC is equivalent to minimizing the weights of adjacent uneven pixels, that is, minimizing the following objective function:
min θ ln L θ e t = t = 1 T ρ θ e t
where θ represents the adjacent pixels of A and T denotes the number of adjacent pixels. We define the weight logic function of MLC as:
L θ e t = exp φ δ φ e t 2 1 + exp φ δ φ e t 2
φ and δ are scalars. Particularly, as δ approaches infinity, the weight L θ tends to 1. It is evident that the weight logistic function of MLC is bounded within the interval [0, 1], where the parameter φ regulates the degree of attenuation, and δ controls the position of the boundary point. By adjusting φ and δ , uneven pixels can automatically be assigned smaller weight values, thereby enhancing the robustness of the model. Finally, by combining Equations (4) and (5) and performing a straightforward integration, the objective function of the MLC with minimal weights for adjacent non-uniform pixels can be obtained as follows:
ρ θ e t = 0 e t ρ θ ' e t d e t = 0 e t e t L θ e t d e t = 1 2 φ ln 1 + e x p φ δ φ e t 2 1 + e x p φ δ

3. Results

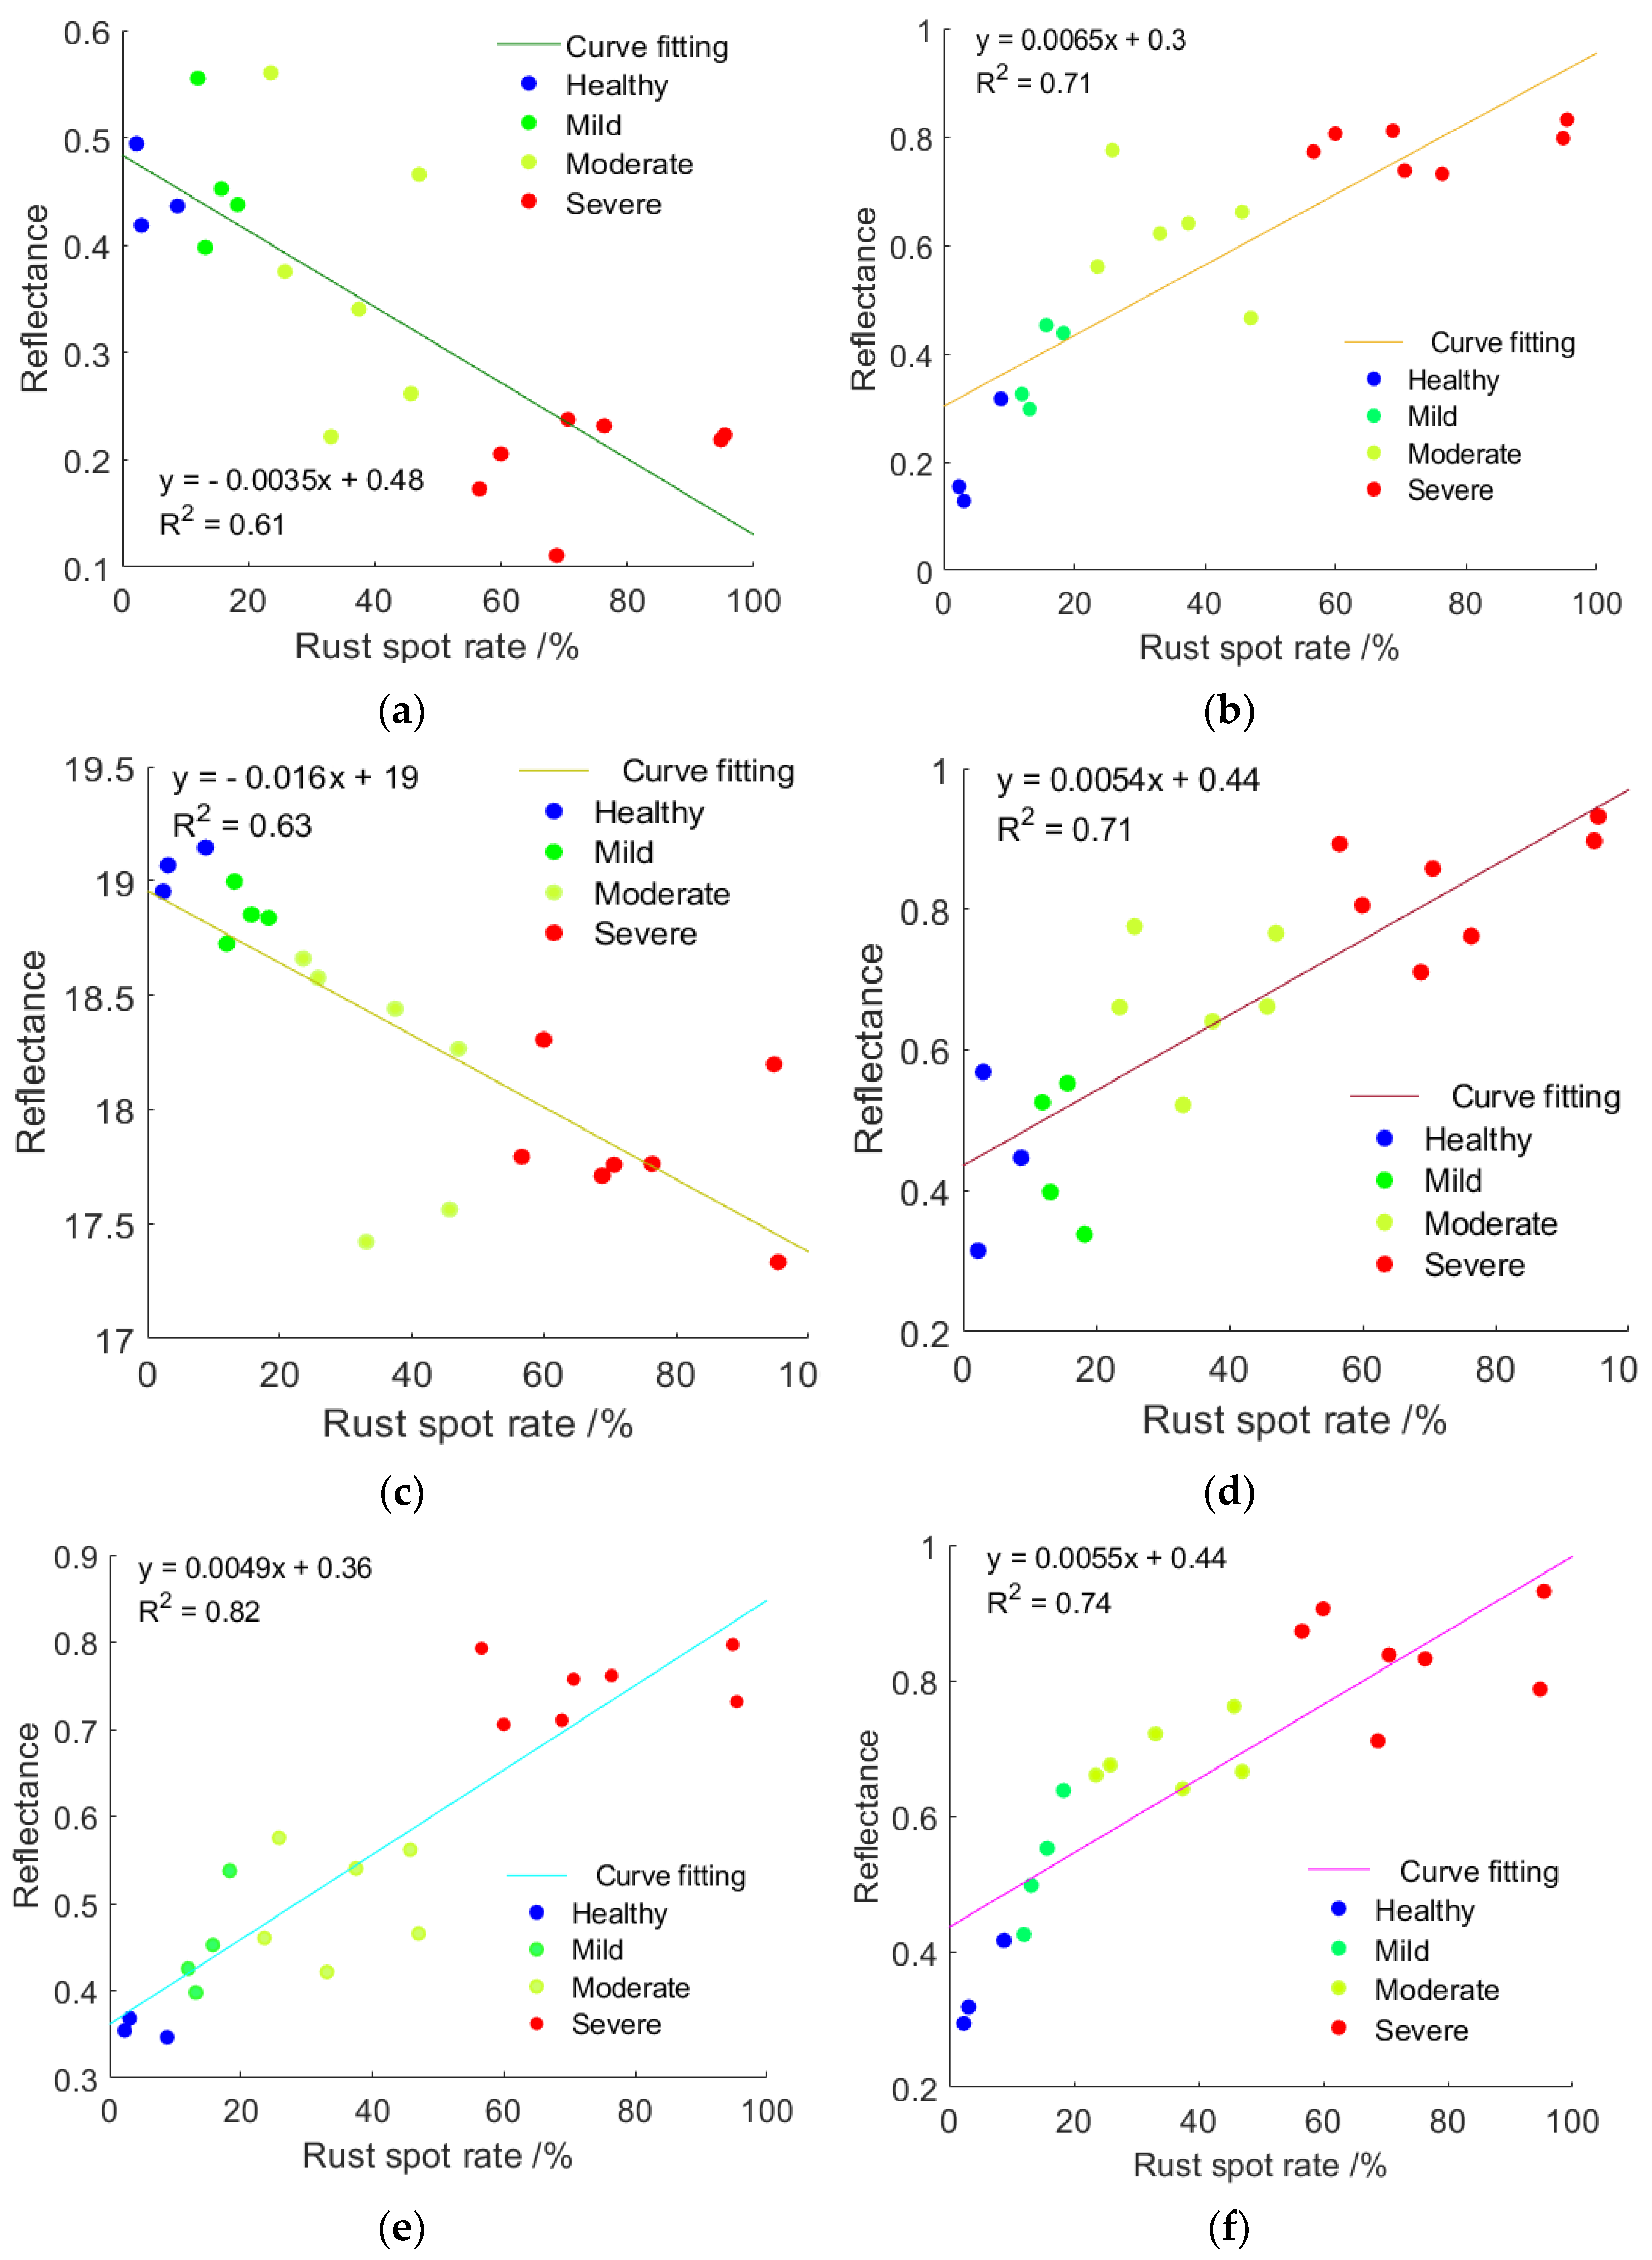
3.1. Correlation Analysis of Different Vegetation Indices and Pest Infestation Levels

Various vegetation indices were subjected to Pearson correlation analysis with the measured damage rust rates at 20 sampling points, and the results are shown in Table 3. Vegetation indices demonstrating strong correlations ( R 2 > 0.6 ) and significance levels p < 0.05 were selected as feature spectra for MLC analysis.
As shown in Table 3, six vegetation indices, including NDVI, SAV, NGRD, CIVE, GNDVI, and NDG, meet the criteria. To visually comprehend the correlation between different vegetation indices and pest damage levels, linear regression analyses were conducted between the six vegetation indices and the corresponding measured values of rust infection rates at 20 sampling points, yielding the results depicted in Figure 6.
Based on the analysis of the results in Figure 6, it is inferred that the feeding behavior of mango thrips affects the transportation of water and nutrients in the sieve tubes and conductive tissues of tender mango leaves. This interference leads to a deprivation of water and nutrient supply to the upper part of the leaf above the feeding hole, consequently impacting chlorophyll synthesis. As a result, the leaf exhibits decreased absorption in the blue, red, and red-edge spectral bands while showing increased absorption in the green and near-infrared spectral bands under severe thrips damage conditions. This phenomenon correlates with smaller values of NDVI and NGRD and larger values of the remaining four vegetation indices. Furthermore, correlation analysis indicates a strong correlation coefficient of 0.82 for GNDVI, meeting the criterion for strong correlation. Consequently, the GNDVI vegetation index will primarily serve as the modeling dataset for the maximum likelihood model in subsequent stages.

3.2. Analysis of Performance Testing Results of the Novel MLC

According to the conclusions drawn in Section 3.1, we sampled the novel MLC method to process and analyze the GNDVI spectral images. Since GNDVI represents a fused band, with the number of bands n = 1 , the probability function for the severity categories of damage for a random pixel A is:
P A y i | x * = 1 2 ln 2 π e i 1 2 x μ i τ e i 1 x μ i
Meanwhile, we recalibrated the weights of all neighboring pixels of random pixel A within the GNDVI spectral image using Equation (6), yielding the results shown in Figure 7.
As indicated by the results depicted in Figure 7, only six adjacent pixels exhibit substantial weights, while the majority of adjacent pixels are predominantly constrained. This observation underscores the effectiveness of our approach in mitigating the impact of uneven neighboring pixels on the overall classification prediction.
We compared our proposed novel MLC with SVM [30], JSR [31], ASOMP [32], and the MLC. Each model was run five times, and the average results from these five runs were recorded, as presented in Table 4.
From the results in Table 4, it is evident that SVM exhibits the poorest classification predictive performance, while JSR and ASOMP show relatively better performance but still fall short of the MLC method. In comparison with the original MLC approach, our proposed novel MLC achieves the highest classification predictive accuracy, with an average of 91.23%.

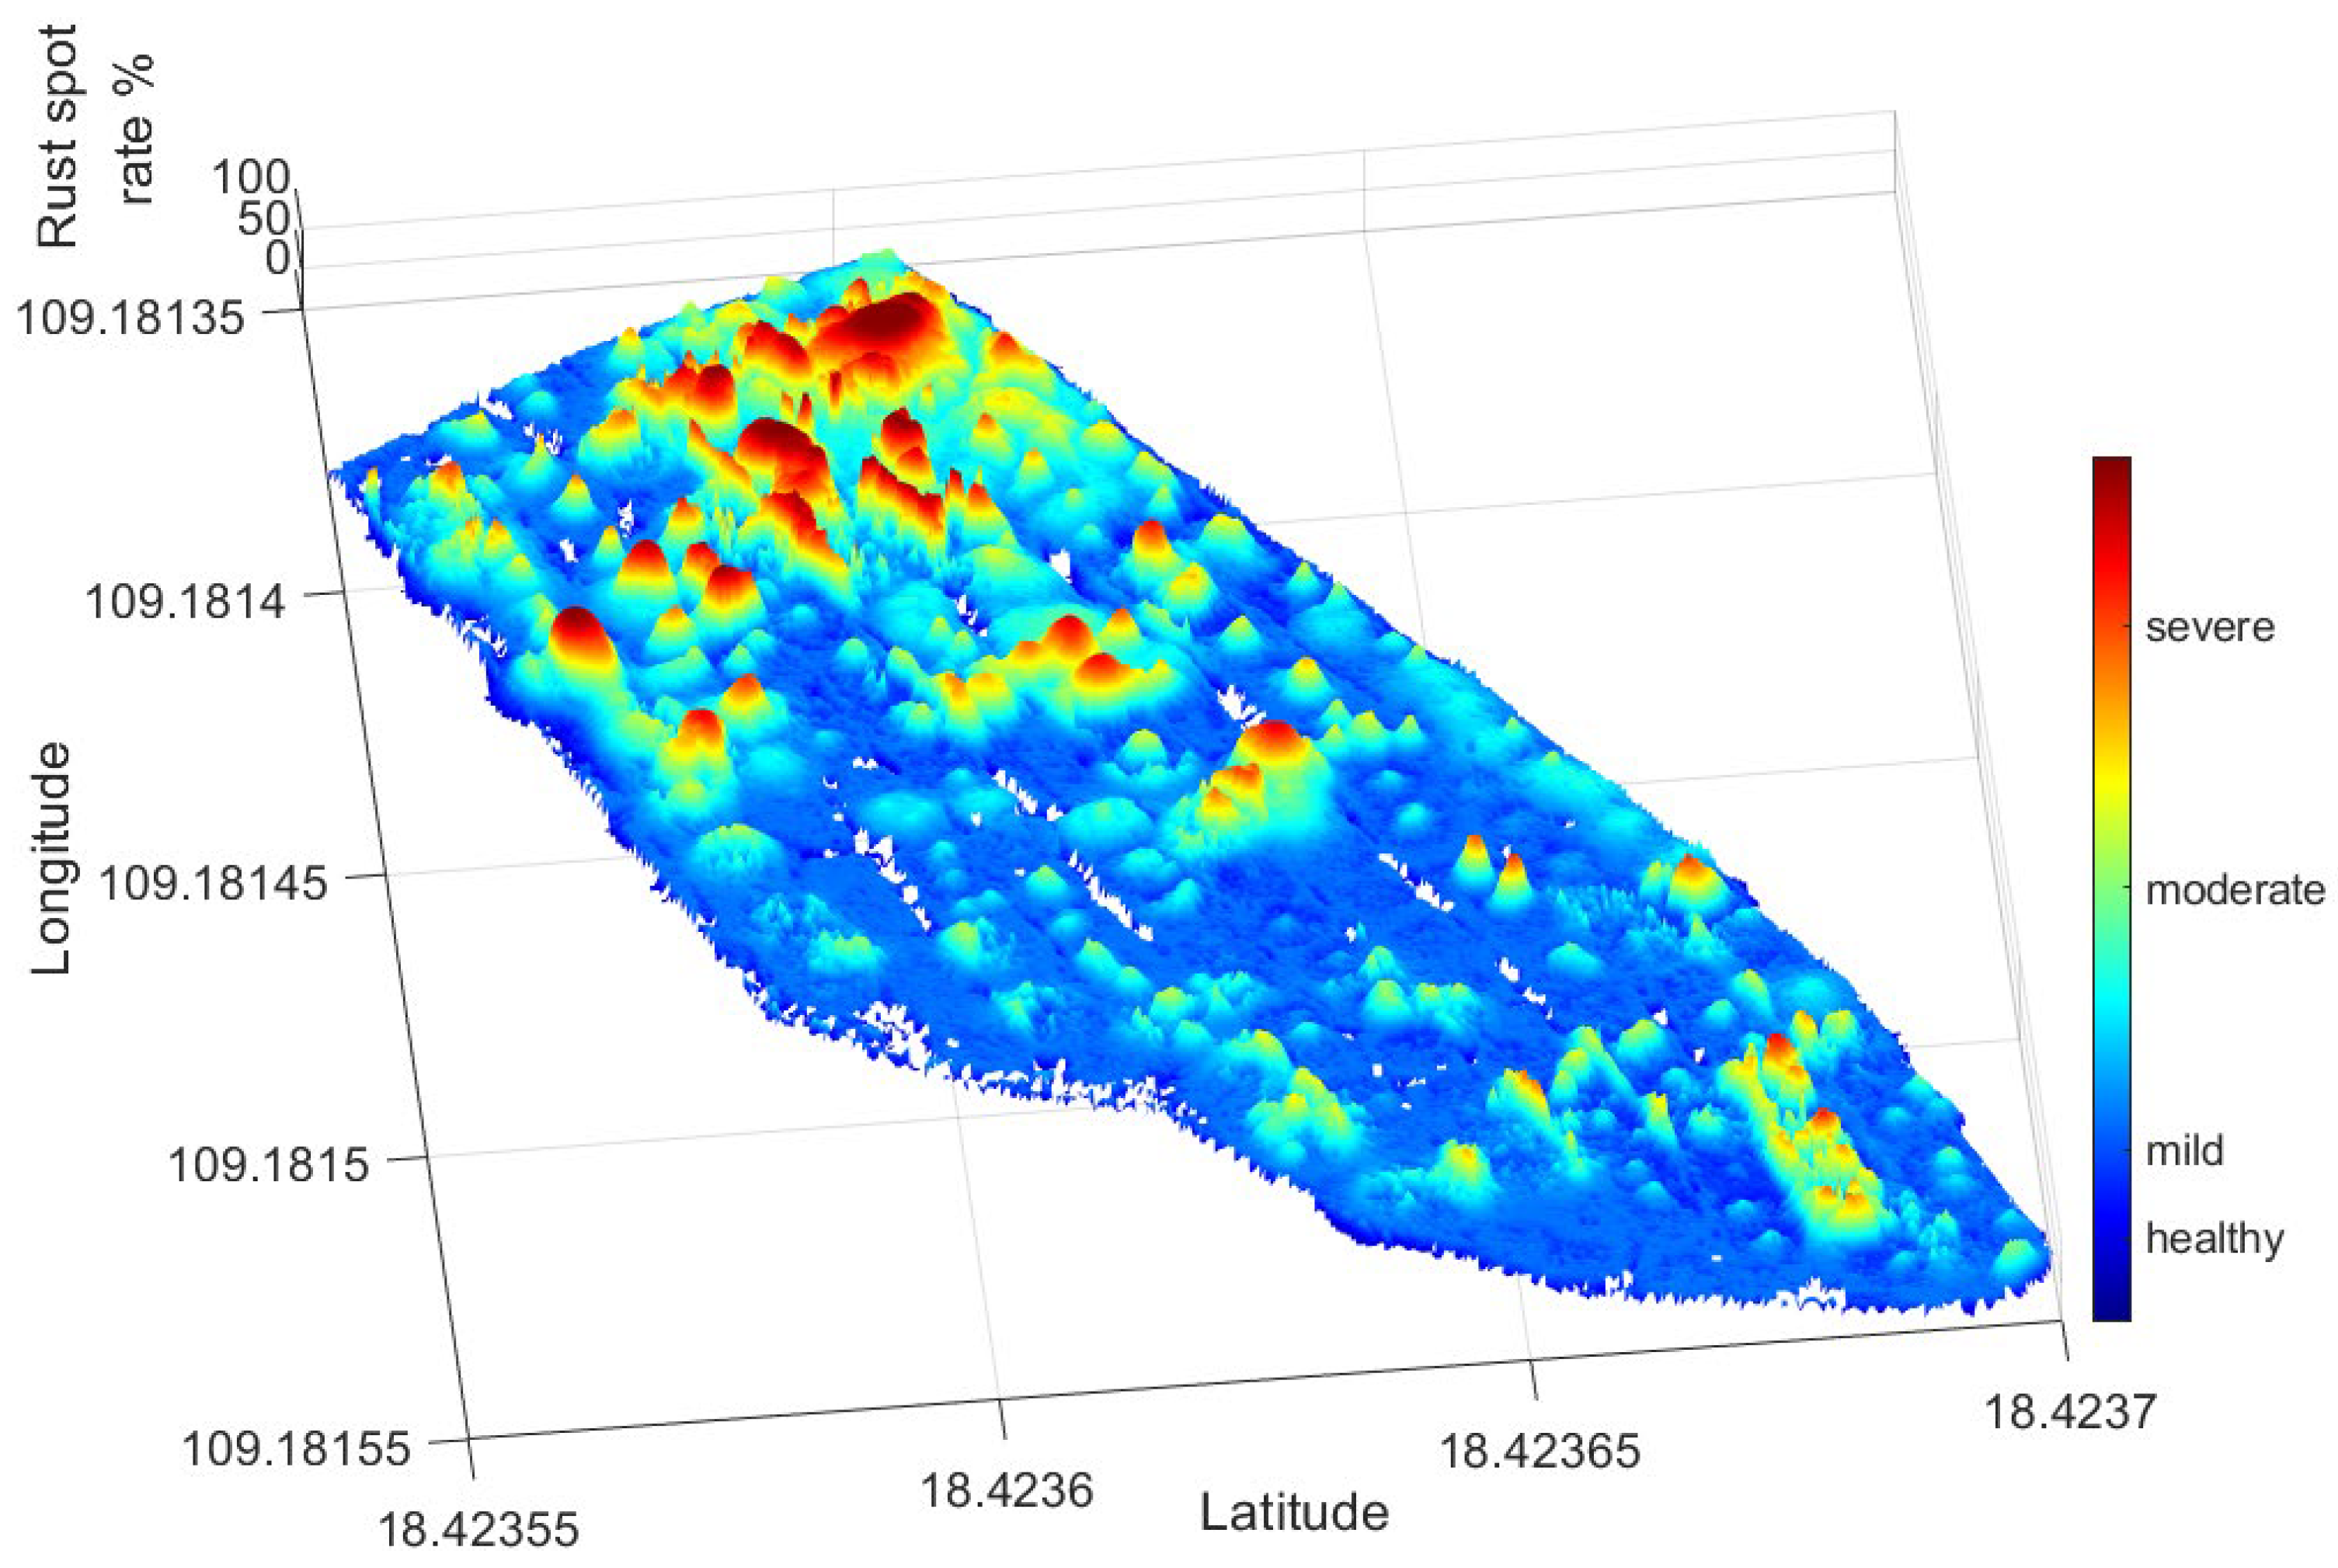
3.3. Analysis of Predicted Distribution Results of Thrips Levels

Finally, based on the classification prediction results obtained using our method, the predicted rust incidence was mapped against matrix pixel values using Hyperspectral Toolbox of MATLAB (version 2016b). The plot3D function was utilized to generate a 3D map of thistle mite-induced rust incidence. Figure 8 illustrates the 3D inversion heat map of spectral data acquired on 18 September 2023.
From the entire process, it is evident that the novel MLC effectively suppresses uneven pixels or outliers. As shown in Figure 8, areas with relatively severe pest damage in the entire experimental area are mainly distributed in the upper right corner region (longitude 109.18140, latitude 18.4236). Through on-site investigations, it was found that this area has abundant tender mango leaves, leading to the aggregation of thrips populations. The three-dimensional inversion diagrams provide a clear and intuitive understanding of the thrip damage situation in orchards, laying the foundation for the formulation of variable prescription maps for pesticide application in the next step.
To precisely quantify the areas of damage at different levels of mango thrips damage, data from sampling times on 18 September 2023 and 4 January 2024 were subjected to inversion prediction using the method proposed in this study. The pixel values corresponding to different damage levels within the three-dimensional heatmap were statistically analyzed, yielding the results shown in Table 5.
Based on the spatial distribution of thrips detection, it can be observed that the sampling data on 18 September 2023 showed the highest proportion of mild-level infestation. The sampling data on 4 January 2024 indicated predominantly moderate to severe levels of thrips damage. Field investigations revealed that during the sampling period on 18 September 2023, mango shoots were in the early stage, with a certain amount of tender leaves attracting thrips aggregation in the orchard. The sampling period on 4 January 2024 coincided with the flowering stage, which is considered a peak period for mango thrips occurrence. Additionally, during this period, the average temperature in Sanya was 20 degrees Celsius, characterized by strong monsoon winds and relatively dry climate conditions, leading to an outbreak of thrips in Yazhou District. The inversion results and field survey statistics suggest that the proposed method in this study yielded anticipated detection outcomes, thus demonstrating its suitability for large-scale and rapid monitoring of thrip damage in mango orchards.

4. Discussion

This study presents a method for predicting the infestation of mango thrips, utilizing unmanned aerial vehicle (UAV) multispectral remote sensing technology and a novel maximum likelihood classifier. Through correlation analysis between various vegetation indices and the severity levels of sampled data, the Green Normalized Difference Vegetation Index (GNDVI), exhibiting a high correlation coefficient of 0.82, was selected as the spectral feature parameter for the novel maximum likelihood classifier model. A remote sensing prediction model for mango orchard thrips infestation distribution was constructed. This model maintains a stable estimation level across various numbers of domain pixels, with an average inversion accuracy of 91.23% across all sample types. Finally, through pixel matrix reconstruction, the distribution of mango thrips damage can be rapidly and comprehensively visualized over a large area.

5. Conclusions

The results of this study offer a novel dynamic monitoring approach for scholars and farmers to investigate the characteristics and occurrence patterns of mango thrips damage. Additionally, it provides a rapid research method for evaluating the efficacy of pesticides targeting thrips control. These findings hold significant importance for effective orchard management among mango growers. Possible future endeavors include increasing the number of spectral bands, expanding the volume of sensitive feature data, and integrating additional features to enhance the accuracy of prediction and inversion. Furthermore, we believe that extending our study to the collaborative operation of multiple UAVs for large-scale inversion of orchards would be of interest.

Author Contributions

Conceptualization, X.H. and M.Z.; methodology, L.W. and J.L.; software and algorithm, L.W.; validation, X.H.; formal analysis, X.H.; investigation, J.L. and L.W.; resources, Y.T.; data curation, X.H.; writing—original draft preparation, L.W.; writing—review and editing, X.H., W.S. and Y.T.; visualization, L.W.; supervision, Z.L.; project administration, X.H.; funding acquisition, X.H., L.W. and M.Z. All authors have read and agreed to the published version of the manuscript.

Funding

This research was funded by the Scientific Research Project of the Natural Science Foundation of Hunan Province, grant number 2024JJ6226. This research was also partly supported by the Scientific Research Project of the Hunan Provincial Department of Education, grant number 21B0741; the Horizontal service project—efficient pesticide application technology system for typical tropical fruits and science and technology backyard. Xiongkui He is the corresponding author.

Institutional Review Board Statement

Not applicable.

Informed Consent Statement

Not applicable.

Data Availability Statement

Data are contained within the article.

Conflicts of Interest

The authors declare that this study received funding from Hainan Penghui Agricultural Technology Co., Ltd. The funder Mianpeng Zheng had the following involvement with the study: Conceptualization.

References

  1. Manhongo, M.M.; Chimphango, A.; Thornley, P.; Röder, M. Techno-economic and environmental evaluation of integrated mango waste biorefineries. J. Clean. Prod. 2021, 325, 129335. [Google Scholar] [CrossRef]
  2. Venkata, R.R.P.; Gundappa, B.; Chakravarthy, A.K. Pests of mango. In Pests and Their Management; Springer: Singapore, 2018; pp. 415–440. [Google Scholar]
  3. Han, D.Y.; Li, L.; Niu, L.; Chen, J.; Zhang, F.; Ding, S.; Fu, Y. Spatial Distribution Pattern and Sampling of Thrips on Mango Trees. Chin. J. Trop. Crops 2019, 40, 323–327. [Google Scholar]
  4. Renzullo, L.J.; Blanchfield, A.L.; Powell, K.S. Insights into the early detection of grapevine phylloxera from in situ hyperspectral data. Acta Hortic. 2007, 733, 59–74. [Google Scholar] [CrossRef]
  5. Mei, H.; Deng, X.; Hong, T.; Luo, X. Early detection and grading of citrus Huanglongbing using hyperspectral imaging technique. Trans. Chin. Soc. Agric. Eng. (Trans. CSAE) 2014, 30, 140–147. [Google Scholar]
  6. Deng, X.; Lan, Y.; Hong, T.; Chen, J. Citrus greening detection using visible spectrum imaging and C-SVC. Comput. Electron. Agric. 2016, 130, 177–183. [Google Scholar] [CrossRef]
  7. Carlos, E.C.A.; Leonardo, A.R.; Flavio, A.O. Spectral analysis for the early detection of anthracnose in fruits of Sugar Mango (Mangifera indica). Comput. Electron. Agric. 2020, 173, 105357. [Google Scholar]
  8. Luo, Q.; Huang, T.; Chen, S.; Chen, M.; Jia, X.; Zhu, X.; Lai, F.; Wu, H.; Zhao, W.; Li, C.; et al. Quantitative evaluation of Sewei apple insect damage levels based on spectral reflectance. J. Jiangsu Agric. 2019, 35, 798–803. [Google Scholar]
  9. Zheng, B.; Chen, Y.; Li, K.; Wang, X.; Xu, Z.; Huang, X.; Hu, X. Detection of Pest Degree of Phyllostachys Chinese with Hyperspectral Data. Spectrosc. Spectr. Anal. 2021, 41, 3200–3207. [Google Scholar]
  10. Ma, Y.; Li, Y.; Liu, M.; Shi, L.; Zhang, J.; Zhang, Z. Harm Monitoring and Inversion Study on Tomicus yunnanensis Based on Multispectral Image of Unmanned Aerial Vehicle. Southwest. China J. Agric. Sci. 2021, 34, 1878–1884. [Google Scholar]
  11. Roope, N.; Honkavaara, E.; Blomqvist, M.; Päivi, L.; Teemu, H.; Niko, V.; Tuula, K.; Markus, H. Remote sensing of bark beetle damage in urban forests at individual tree level using a novel hyperspectral camera from UAV and aircraft. Urban For. Urban Green. 2018, 1, 72–83. [Google Scholar]
  12. Marston, Z.P.D.; Cira, T.M.; Hodgson, E.W.; Knight, J.F.; MacRae, I.V.; Koch, R.L. Detection of damage induced by soybean aphid (Hemiptera: Aphididae) using multispectral imagery from unmanned aerial vehicles. J. Econ. Entomol. 2020, 113, 779. [Google Scholar] [CrossRef]
  13. Frazier, P.; Whiting, J.; Powell, K.; Lamb, D. Characterising the development of grape phylloxera infestation with multi-temporal near-infrared aerial photography. Aust. N. Z. Grapegrow. Winemak. 2004, 485, 133–136. [Google Scholar]
  14. Shi, Y.; Huang, W.; Luo, J.; Huang, L.; Zhou, X. Detection and discrimination of pests and diseases in winter wheat based on spectral indices and kernel discriminant analysis. Comput. Electron. Agric. 2017, 141, 171–180. [Google Scholar] [CrossRef]
  15. Elbeih, S.F.; El-Zeiny, A.M. Qualitative assessment of groundwater quality based on land use spectral retrieved indices: Case study Sohag Governorate, Egypt. Rem. Sens. Appl. Soc. Environ. 2018, 10, 82–92. [Google Scholar] [CrossRef]
  16. Xu, Z.; Li, B.; Yu, H.; Zhang, H.; Guo, X.; Li, Z.; Wang, L.; Liu, Z.; Li, Y.; He, A.; et al. Changing Relationships between Water Content and Spectral Features in Moso Bamboo Leaves under Pantana phyllostachysae Chao damage. Forests 2023, 14, 702. [Google Scholar] [CrossRef]
  17. Bian, C.; Shi, H.; Wu, S.; Zhang, K.; Wei, M.; Zhao, Y.; Sun, Y.; Zhuang, H.; Zhang, X.; Chen, S. Prediction of Field-Scale Wheat Yield Using Machine Learning Method and Multi-Spectral UAV Data. Remote Sens. 2022, 14, 1474. [Google Scholar] [CrossRef]
  18. Chen, X.; Dong, Z.; Liu, J.; Wang, H.; Zhang, Y.; Chen, T.; Du, Y.; Shao, L.; Xie, J. Hyperspectral characteristics and quantitative analysis of leaf chlorophyll by reflectance spectroscopy based on a genetic algorithm in combination with partial least squares regression. Spectrochim. Acta Part A Mol. Biomol. Spectrosc. 2020, 243. [Google Scholar] [CrossRef] [PubMed]
  19. Tao, W.; Wang, X.; Xue, J.H.; Su, W.; Zhang, M.; Yin, D.; Zhu, D.; Xie, Z.; Zhang, Y. Monitoring the damage of armyworm as a pest in summer corn by unmanned aerial vehicle imaging. Pest Manag. Sci. 2022, 78, 2265–2276. [Google Scholar] [CrossRef] [PubMed]
  20. Melgani, F.; Bruzzone, L. Classification of hyperspectral remote sensing images with support vector machines. IEEE Trans. Geosci. Remote Sens. 2004, 42, 1778–1790. [Google Scholar] [CrossRef]
  21. Zhong, Y.; Zhang, L. An adaptive artificial immune network for supervised classification of multi-hyperspectral remote sensing imagery. IEEE Trans. Geosci. Remote Sens. 2011, 50, 894–909. [Google Scholar] [CrossRef]
  22. Li, J.; Bioucas-Dias, J.M.; Plaza, A. Semisupervised hyperspectral image classification using soft sparse multinomial logistic regression. IEEE Geosci. Remote Sens. Lett. 2012, 10, 318–322. [Google Scholar]
  23. Banlawe, I.A.P.; Cruz, J.C.D.; Gaspar, J.C.P.; Gutierrez, E.J.I. Decision Tree Learning Algorithm and Naïve Bayes Classifier Algorithm Comparative Classification for Mango Pulp Weevil Mating Activity. In Proceedings of the 2021 IEEE International Conference on Automatic Control & Intelligent Systems (I2CACIS), Shah Alam, Malaysia, 26 June 2021; pp. 317–322. [Google Scholar]
  24. Sifiso, X.; Nkanyiso, M.; Kabir, P.; Michael, G.; Naeem, A. Comparison of different spectral indices to differentiate the impact of insect attack on planted forest stands. Remote Sens. Appl. Soc. Environ. 2024, 33, 101087. [Google Scholar]
  25. Li, P.; Huang, X.; Yin, S.; Bao, Y.; Bao, G.; Tong, S.; Dashzeveg, G.; Nanzad, T.; Dorjsuren, A.; Enkhnasan, D.; et al. Optimizing spectral index to estimate the relative chlorophyll content of the forest under the damage of Erannis jacobsoni Djak in Mongolia. Ecol. Indic. 2023, 154, 110714. [Google Scholar] [CrossRef]
  26. Berger, K.; Machwitz, M.; Kycko, M.; Kefauver, S.C.; Van Wittenberghe, S.; Gerhards, M.; Verrelst, J.; Atzberger, C.; Van der Tol, C.; Damm, A.; et al. Multi-sensor spectral synergies for crop damage detection and monitoring in the optical domain: A review. Remote Sens. Environ. 2022, 280, 113198. [Google Scholar] [CrossRef] [PubMed]
  27. Lin, X.; Sun, J.; Yang, L.; Liu, H.; Wang, T.; Zhao, H. Application of UAV Multispectral Remote Sensing to Monitor Damage Level of Leaf-feeding Insect Pests of Oak. J. Northeast. For. Univ. 2023, 51, 138–144. [Google Scholar]
  28. Chen, S.; Webb, G.I.; Liu, L.; Ma, X. A novel selective naïve Bayes algorithm. Knowl.-Based Syst. 2020, 192, 105361. [Google Scholar] [CrossRef]
  29. Peng, J.; Li, L.; Tang, Y.Y. Maximum Likelihood Estimation-Based Joint Sparse Representation for the Classification of Hyperspectral Remote Sensing Images. IEEE Trans. Neural Netw. Learn. Syst. 2018, 30, 1790–1802. [Google Scholar] [CrossRef]
  30. Camps-Valls, G.; Gomez-Chova, L.; Muñoz-Marí, J.; Vila-Francés, J.; Calpe-Maravilla, J. Composite kernels for hyperspectral image classification. IEEE Geosci. Remote Sens. Lett. 2006, 3, 93–97. [Google Scholar] [CrossRef]
  31. Chen, Y.; Nasrabadi, N.M.; Tran, T.D. Hyperspectral image classification using dictionary-based sparse representation. IEEE Trans. Geosci. Remote Sens. 2011, 49, 3973–3985. [Google Scholar] [CrossRef]
  32. Zou, J.; Li, W.; Huang, X.; Du, Q. Classification of hyperspectral urban data using adaptive simultaneous orthogonal matching pursuit. J. Appl. Remote Sens. 2014, 8, 085099. [Google Scholar] [CrossRef]
Figure 1. Experimental site. (a) Hainan Province geographical location; (b) Sanya City geographical coordinates; (c) mango orchard in Sangongli Village.
Agronomy 14 00795 g001
Figure 2. Data collection equipment. (a) Multispectral remote sensing drone (DJI P4M); (b) spectral calibration whiteboard; (c) SPAD 502 Plus chlorophyll concentration meter.
Agronomy 14 00795 g002
Figure 3. Leaf samples of different levels of thrips damage: (a) severe; (b) moderate; (c) mild; (d) healthy.
Agronomy 14 00795 g003
Figure 4. ATP9100 handheld hyperspectral detection platform.
Agronomy 14 00795 g004
Figure 5. Spectral reflectance of different damage levels.
Agronomy 14 00795 g005
Figure 6. Fitting functions for different vegetation indices. (a) NDVI; (b) SAV; (c) NGRD; (d) CIVE; (e) GNDVI; (f) NDG.
Agronomy 14 00795 g006
Figure 7. The weight of the novel MLC.
Agronomy 14 00795 g007
Figure 8. Novel MLC-based 3D heatmap of rust spot rate distribution based on spectral data acquired on 18 September 2023.
Agronomy 14 00795 g008
Table 1. Sample.
Table 1. Sample.
LevelsSample SizeRust Spot Rate/%
severe3551~100
moderate3021~50
mild2011~20
healthy150~10
Table 2. Mango thrips monitoring vegetation index.
Vegetation IndexFormulaSource
NDVI NDVI = NIR R NIR + R [10,24]
EVI EVI = 2.5 NIR R NIR + 6 R 7.5 B + 1 [24]
SAV SAV = NIR R × 1.5 NIR + R + 0.5 [16]
IC IC = NIR RE NIR + RE [13,25]
VDV VDV = 2 G R B 2 G + R + B [8,26]
RGR RGR = R G [26]
NGRD NGRD = G R G + R [8,10]
EXG EXG = 2 G R B [27]
EXGR EXGR = G 2.4 R B [27]
CIVE CIVE = 0.44 R 0.88 G + 0.39 B + 18.79 [11,27]
DV DV = NIR R [12,27]
GNDVI GNDVI = NIR G NIR + G [10,27]
NDG NDG = G R G + R [27]
WDRV WDRV = 0.1 NIR RE 0.1 NIR + RE [26,27]
Table 3. Correlation between vegetation index and damage level.
Vegetation Index R 2 pVegetation Index R 2 p
NDVI0.610 *EXG0.260.142
EVI0.370.150EXGR0.570.019 *
SAV0.710.006 *CIVE0.630.040 *
IC0.300.481DV0.410.524
VDV0.570.002 *GNDVI0.810.045 *
RGR0.370 *NDG0.740.876
NGRD0.710 *WDRV0.550.001 *
* Indicates that it passed the significance test at the 0.05 level.
Table 4. Prediction accuracy results of different models.
LevelsSVMJSRASOMPMLCOurs
severe62.45%74.56%68.56%85.47%90.17%
moderate67.89%77.14%70.15%88.69%93.11%
mild66.54%69.41%74.17%88.21%91.57%
healthy69.01%70.55%79.00%90.78%90.05%
Table 5. Statistical results of mango thrips damage.
Sampling TimeHealthyMildModerateSevere
Area / m 2 Proportion/% Area / m 2 Proportion/% Area / m 2 Proportion/% Area / m 2 Proportion/%
2023.09.181042.628.41387.437.9845.123.1384.710.5
2024.01.04405.710.81155.431.5987.026.91111.730.8
Disclaimer/Publisher’s Note: The statements, opinions and data contained in all publications are solely those of the individual author(s) and contributor(s) and not of MDPI and/or the editor(s). MDPI and/or the editor(s) disclaim responsibility for any injury to people or property resulting from any ideas, methods, instructions or products referred to in the content.

