Article

Spatial Heterogeneity in the Response of Winter Wheat Yield to Meteorological Dryness/Wetness Variations in Henan Province, China

1
Department of Ecology, School of Plant Protection, Joint International Research Laboratory of Agriculture and Agri-Product Safety of the Ministry of Education, Yangzhou University, Yangzhou 225009, China
2
Nanjing Municipal Academy of Ecological and Environmental Protection Science, Nanjing 210013, China
3
School of Ecology and Applied Meteorology, Nanjing University of Information Science and Technology, Nanjing 210044, China
4
College of Hydraulic Science and Engineering, Yangzhou University, Yangzhou 225009, China
5
CATE School of Architecture and Environment, University of the West of England, Bristol BS16 1QY, UK
*
Authors to whom correspondence should be addressed.
Agronomy 2024, 14(4), 817; https://doi.org/10.3390/agronomy14040817
Submission received: 18 February 2024 / Revised: 2 April 2024 / Accepted: 11 April 2024 / Published: 14 April 2024

Abstract

:
Knowledge of the responses of winter wheat yield to meteorological dryness/wetness variations is crucial for reducing yield losses in Henan province, China’s largest winter wheat production region, under the background of climate change. Data on climate, yield and atmospheric circulation indices were collected from 1987 to 2017, and monthly self-calibrating Palmer drought severity index (sc-PDSI) values were calculated during the winter wheat growing season. The main results were as follows: (1) Henan could be partitioned into four sub-regions, namely, western, central-western, central-northern and eastern regions, based on the evolution characteristics of the time series of winter wheat yield in 17 cities during the period of 1988–2017. Among them, winter wheat yield was high and stable in the central-northern and eastern regions, with a remarkable increasing trend (p < 0.05). (2) The sc-PDSI in February had significantly positive impacts on climate-driven winter wheat yield in the western and central-western regions (p < 0.05), while the sc-PDSI in December and the sc-PDSI in May had significantly negative impacts on climate-driven winter wheat yield in the central-northern and eastern regions, respectively (p < 0.05). (3) There were time-lag relationships between the sc-PDSI for a specific month and the atmospheric circulation indices in the four sub-regions. Furthermore, we constructed multifactorial models based on selected atmospheric circulation indices, and they had the ability to simulate the sc-PDSI for a specific month in the four sub-regions. These findings will provide scientific references for meteorological dryness/wetness monitoring and risk assessments of winter wheat production.

1. Introduction

Global warming has led to an ever-intensifying water cycle, and in particular, increasing rates of evaporation and precipitation, which have also changed the occurrence and severity of meteorological dryness/wetness events in different regions of the world [1,2,3,4]. Crop farming has been the backbone of human society, providing food and other basic needs for people [5]. With the rapid development of urbanization and industrialization, a large amount of cultivated land has been occupied, so improving crop yield per unit area has proven to be an important approach to boost food production [6,7]. However, the weight of observational evidence indicates that unfavorable meteorological dryness/wetness events during the crop growing season can lead to reduced crop yields and even threaten food security [8,9,10]. Therefore, analyzing the spatial heterogeneity of yield variability and its response to meteorological dryness/wetness conditions is of great importance in evaluating regional yield vulnerability and proposing adaptation strategies under global warming.
With the increasing importance of long time-series data, time series clustering methods have become widespread in the field of hydrometeorology [11,12]; they divide a large amount of data into smaller groups according to their similarity so that the data belonging to the same group are as similar as possible. Traditional clustering methods designed for static data are susceptible to noise when dealing with the time series clustering problem due to the high dimensionality of the time series [13]. Under these circumstances, the characteristic-based time series clustering method was proposed [14], which clusters based on structural characteristics extracted from the time series rather than using a distance measure to cluster point values. The characteristic measures used to reflect the time series are derived from statistical operations, such as statistical, time-domain and frequency-domain characteristics, and they are then input into arbitrary clustering algorithms. For example, Garcia-Gutierrez et al. (2022) [15] used a K-means clustering algorithm to regionalize solar radiation in Spain based on statistical parameters computed from clear-sky index series. As a typical example of time series data, the regionalization of crop yield for a given region not only analyzes spatial variations in yield but also provides fine-grained strategies to cope with unfavorable meteorological dryness/wetness conditions [16]. Despite the widespread interest in the mean values of and trends in crop yield [17], the statistical, time-domain and frequency-domain characteristics of yield data have rarely been systematically examined in previous studies.
To understand the response of crop yield to meteorological dryness/wetness variations, several meteorological dryness/wetness indices have been proposed in recent decades [3,18,19], such as the standardized precipitation index (SPI), standardized precipitation evapotranspiration index (SPEI) and self-calibrating Palmer drought severity index (sc-PDSI). Both SPI and SPEI have similar multi-timescale characteristics, with the former considering only precipitation and the latter considering precipitation and potential evapotranspiration [20]. In contrast to the SPI and SPEI, the sc-PDSI is more physical, as it takes into account the water balance using a two-layer bucket model and uses self-calibrating processes that can adjust the original PDSI to the local climate [21]. Recent studies have suggested that the sc-PDSI demonstrates good performance in monitoring meteorological dryness/wetness variations in China, and studies have also been carried out to show that climate–yield relationships vary between regions and crop types [22,23]. Taking China as an example, the sc-PDSI showed positive relationships with maize yield anomalies in Northeast China and wheat in North, South and Northwest China, but some regions (rice in East and Southeast China) had negative correlations [23]. These existing studies have focused mainly on relationships by considering the entire crop-growing season as a whole [24,25]. Few studies have examined seasonal differences in yield responses to meteorological dryness/wetness conditions, particularly the key month affecting yield and the corresponding key meteorological drought/wetness index (KMDWI). Considering that atmospheric circulations can be regarded as important premonitory influencing signals in the analysis of meteorological dryness/wetness variations [26,27], it is necessary to investigate the relationships between the KMDWI and atmospheric circulation indices in order to construct an appropriate simulation model, which may be a valuable approach to sustainable crop production and agricultural water management.
Wheat is an ancient and important grain crop. China is the world’s largest winter wheat producer, accounting for nearly 20% of the global wheat yield [28]. As the largest winter wheat production region in China, Henan province accounts for nearly 25% of the winter wheat yield in China [29]. However, an uneven spatio-temporal distribution of precipitation has severely affected sustainable winter wheat production in Henan [30]. Although drought and flood events frequently occur in Henan [31], the spatial heterogeneity of yield variability and its response to meteorological dryness/wetness conditions are still unclear in this region. Therefore, the main research objectives are (1) to understand the spatial difference in winter wheat yield using a characteristic-based time series clustering analysis and (2) to identify the KMDWIs that affect yield fluctuations in different sub-regions and evaluate the potential impacts of atmospheric circulation indices. The detailed results are of great significance for meteorological dryness/wetness monitoring and risk assessments of winter wheat production.

2. Materials and Methods
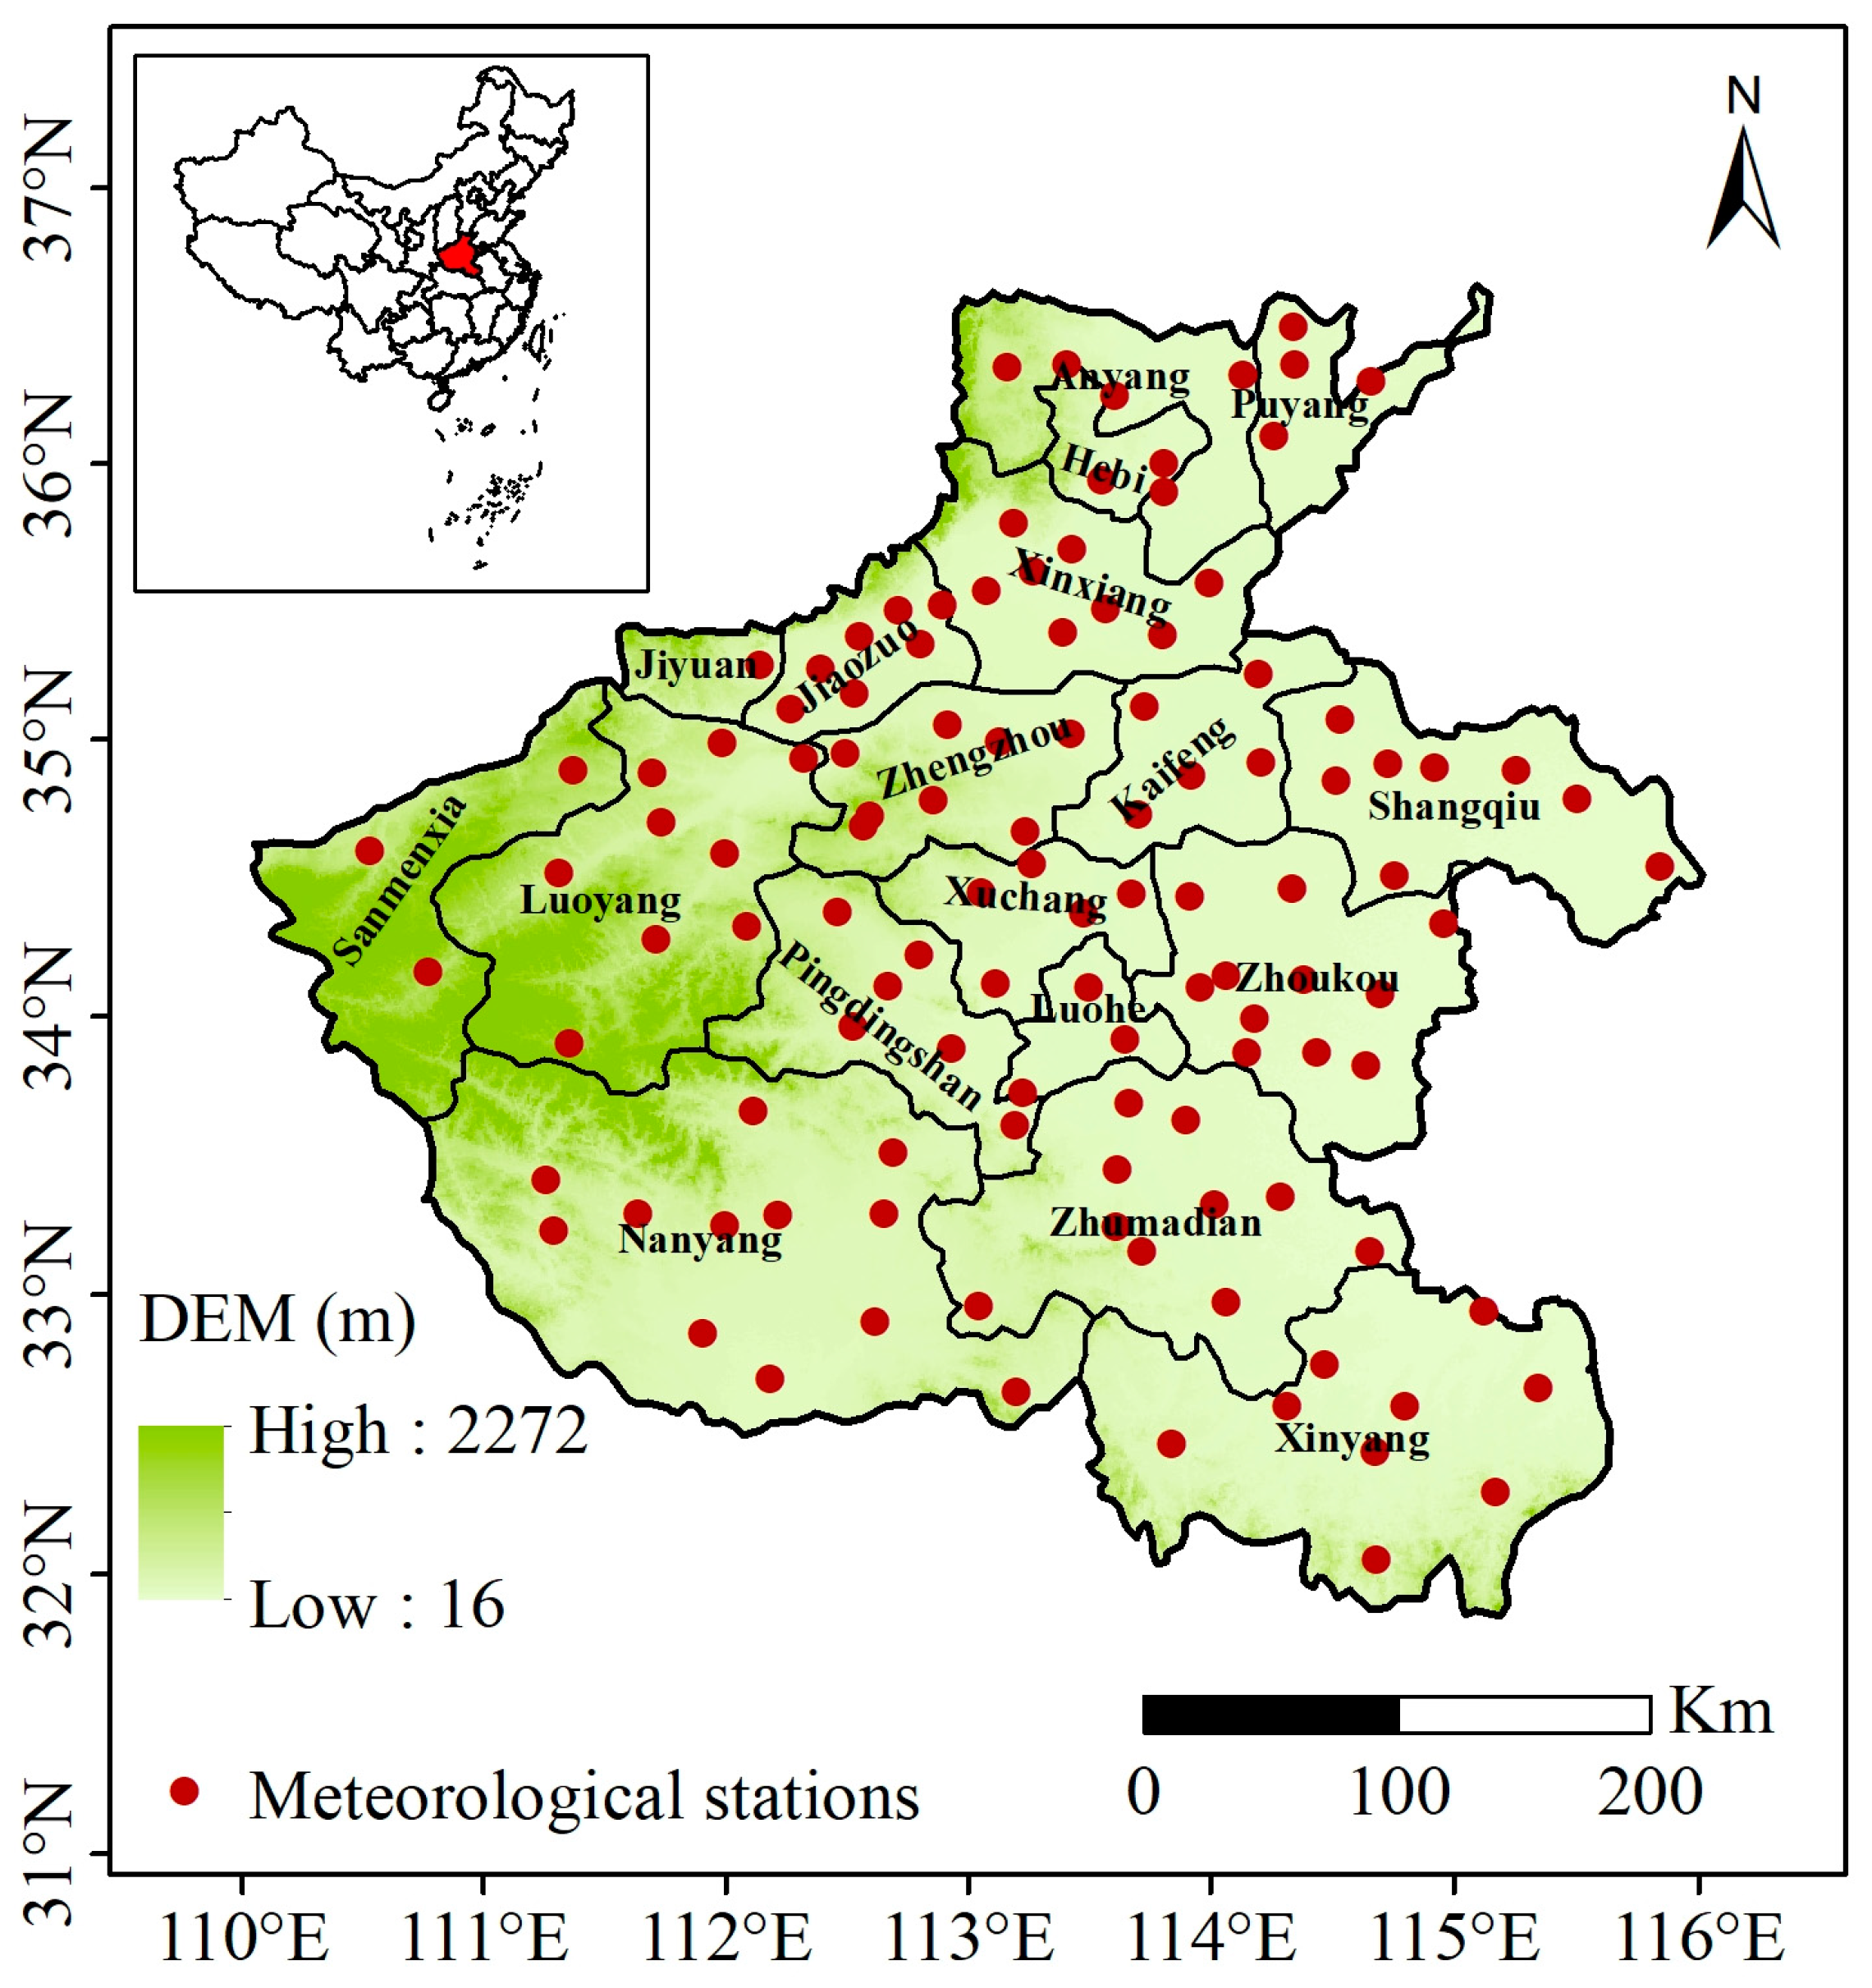
2.1. Study Region

Located in central China (Figure 1), Henan province covers an area of 167,000 km2. It consists of 18 cities, i.e., Zhengzhou, Kaifeng, Luoyang, Pingdingshan, Anyang, Hebi, Xinxiang, Jiaozuo, Puyang, Xuchang, Luohe, Sanmenxia, Shangqiu, Zhoukou, Zhumadian, Nanyang, Xinyang and Jiyuan, and it has a wide altitude ranging from 16 to 2272 m. Henan is located mainly in the warm temperate zone, with four distinct seasons and frequent meteorological disasters [31]. The annual average temperature ranges from 10.5 °C in the north to 16.7 °C in the south, and the annual precipitation ranges from 407.7 mm to 1295.8 mm, mainly concentrated between June and August [16]. As a major grain-producing province in China, the output of major agricultural products such as grain, cotton and oil in Henan ranks at the forefront of the country. Among them, winter wheat is the first grain crop in Henan, with 1/16 of the nation’s arable land producing 1/4 of the winter wheat in China [29].

2.2. Datasets

The homogenized datasets of monthly temperature, precipitation, atmospheric pressure, relative humidity, sunshine and wind speed from 116 stations in Henan during the period of 1987–2017 were obtained from the National Climate Center of China. Data on annual winter wheat yield (AWWY, unit: kg/hm2) in 17 cities in Henan, with the exception of Jiyuan, during the period of 1987–2017 were obtained from the Henan Province Bureau of Statistics. Monthly atmospheric circulation indices that may drive the regional climate in Henan were used to analyze the premonitory influencing signals of meteorological dryness/wetness variations, which included Niño 1+2, Niño 3, Niño 3.4, Niño 4, North Atlantic Oscillation (NAO), Arctic Oscillation (AO) and Pacific Decadal Oscillation (PDO), and they were obtained from http://www.cpc.ncep.noaa.gov/products/precip/CWlink/ (accessed on 5 November 2023). All data used in this study were obtained from official sources and were subjected to rigorous quality controls.

2.3. Methods

2.3.1. Characteristic-Based Time Series Clustering Analysis

In this study, AWWY was selected for a given indicator, and a series of characteristic-based indices were constructed and are presented in Table 1. As shown in Table 1, we calculated the statistical characteristics of the AWWY time series, such as the minimum value (MIN), maximum value (MAX), mean value (AVE), range value (RNG), standard deviation (STD) and coefficient of variation (CV). Furthermore, a trend analysis is one of the most important measurements in studying time series data, and it can reflect their time-domain characteristics. In this study, the Z statistic (ZMK), Sen’s slope (MAG) and the Hurst index (H) were used to describe the trends and persistent patterns of the AWWY time series using the Mann–Kendall test, Sen’s slope estimator and the Hurst method, respectively [32]. In addition to a trend analysis, multi-time scale characteristics are also important in studying time series data. For example, the AWWY time series can be decomposed into three periodic oscillation intrinsic mode functions (IMFs) and a trend component, and this was achieved in this study using ensemble empirical mode decomposition (EEMD) [33]. The variance contribution of each IMF (i.e., CIMF1, CIMF2 and CIMF3) and the trend component (CTrend) to AWWY was selected to reflect the frequency-domain characteristics of the AWWY time series. More details about the Mann–Kendall test, Sen’s slope estimator, the Hurst method and EEMD are shown in the Supplementary Materials [34,35,36,37,38,39,40,41].
Taking into account the potential collinearity and redundancy among these indices, a principal component analysis (PCA) and a K-means clustering analysis were used in our study to partition the 17 cities into k clusters, and the clustering result was evaluated using silhouette coefficients (SCs) [11,42]. The highest SC value determined the optimum number of clusters. More details about the PCA and K-means clustering analysis are shown in the Supplementary Materials [43,44,45,46,47,48,49,50].

2.3.2. Calculation of sc-PDSI

The sc-PDSI is a typical meteorological dryness/wetness index based on a physical water balance model, calculated from precipitation and potential evapotranspiration, together with parameters related to the characteristics of the soil/surface at each location [51]. In the calculation of the sc-PDSI, potential evapotranspiration is based on the Penman–Monteith equation, which takes into account energy balance and aerodynamic theory, rather than the Thornthwaite method [52]. The sc-PDSI values range from −4 to +4, with a negative (positive) value indicating a dry (wet) period. In this study, we calculated the monthly sc-PDSI during the winter wheat growing season (from October of the previous year to May of the current year) in Henan using climate data on temperature, precipitation, relative humidity, sunshine and wind speed to reflect meteorological dryness/wetness conditions, and this was achieved using an open-access R package (https://github.com/Sibada/scPDSI, accessed on 5 November 2023).

2.3.3. Calculations of Climate-Driven Winter Wheat Yield (CDWWY)

Crop yield is affected by a variety of factors such as crop varieties, agricultural technology and meteorological conditions, which is a combination of trend yield and climate-driven yield [53]. Extracting the climate-driven yield is a crucial step in understanding the yield impacts of meteorological dryness/wetness variations [9]. In this study, four statistical methods, namely, EEMD, linear regression (LR), logistic function (LF) and the Hodrick–Prescott (HP) filter, were used to extract CDWWY [54].
In this study, we mainly focused on the relationships between time series variables (i.e., CDWWY and sc-PDSI) during the period of 1987–2017. Therefore, we used a Pearson correlation analysis to examine the relationships between the CDWWY time series and sc-PDSI time series during the winter wheat growing season, which allowed us to select the key month that affected the yield and the corresponding KMDWI in Henan. Furthermore, a regression equation was constructed between the KMDWI and CDWWY using the following formula [42]:
std (CDWWY) = a × std (KMDWI) + b
where std (CDWWY) and std (KMDWI) are the standardized values of the KMDWI and CDWWY, respectively. Coefficient a is the sensitivity of the yield to the KMDWI, and it is multiplied by the trend of the KMDWI for a given period to determine the impact of the KMDWI trend on yield [42].

2.3.4. Relationships between the KMDWI and Atmospheric Circulation Indices

Atmospheric circulation indices are considered important premonitory influencing signals in the analysis of meteorological dryness/wetness variations [26,27]. A time-lag correlation analysis was performed to examine the relationships between the KMDWI and seven atmospheric circulation indices [55,56], and a time lag of 0–11 months was selected in this study. According to the results of the correlation analysis, we then selected the atmospheric circulation indices with the highest correlation with the corresponding KMDWI for each month as the premonitory influencing signals. Finally, we used the multiple linear regression method to construct an empirical KMDWI simulation model based on the atmospheric circulation indices selected in this study. Two indicators were used to evaluate the performance of the multiple linear regression model: the determination coefficients (R2) and root-mean-square error (RMSE) [57]. More details about the time-lag correlation analysis and multiple linear regression method are shown in the Supplementary Materials.

3. Results

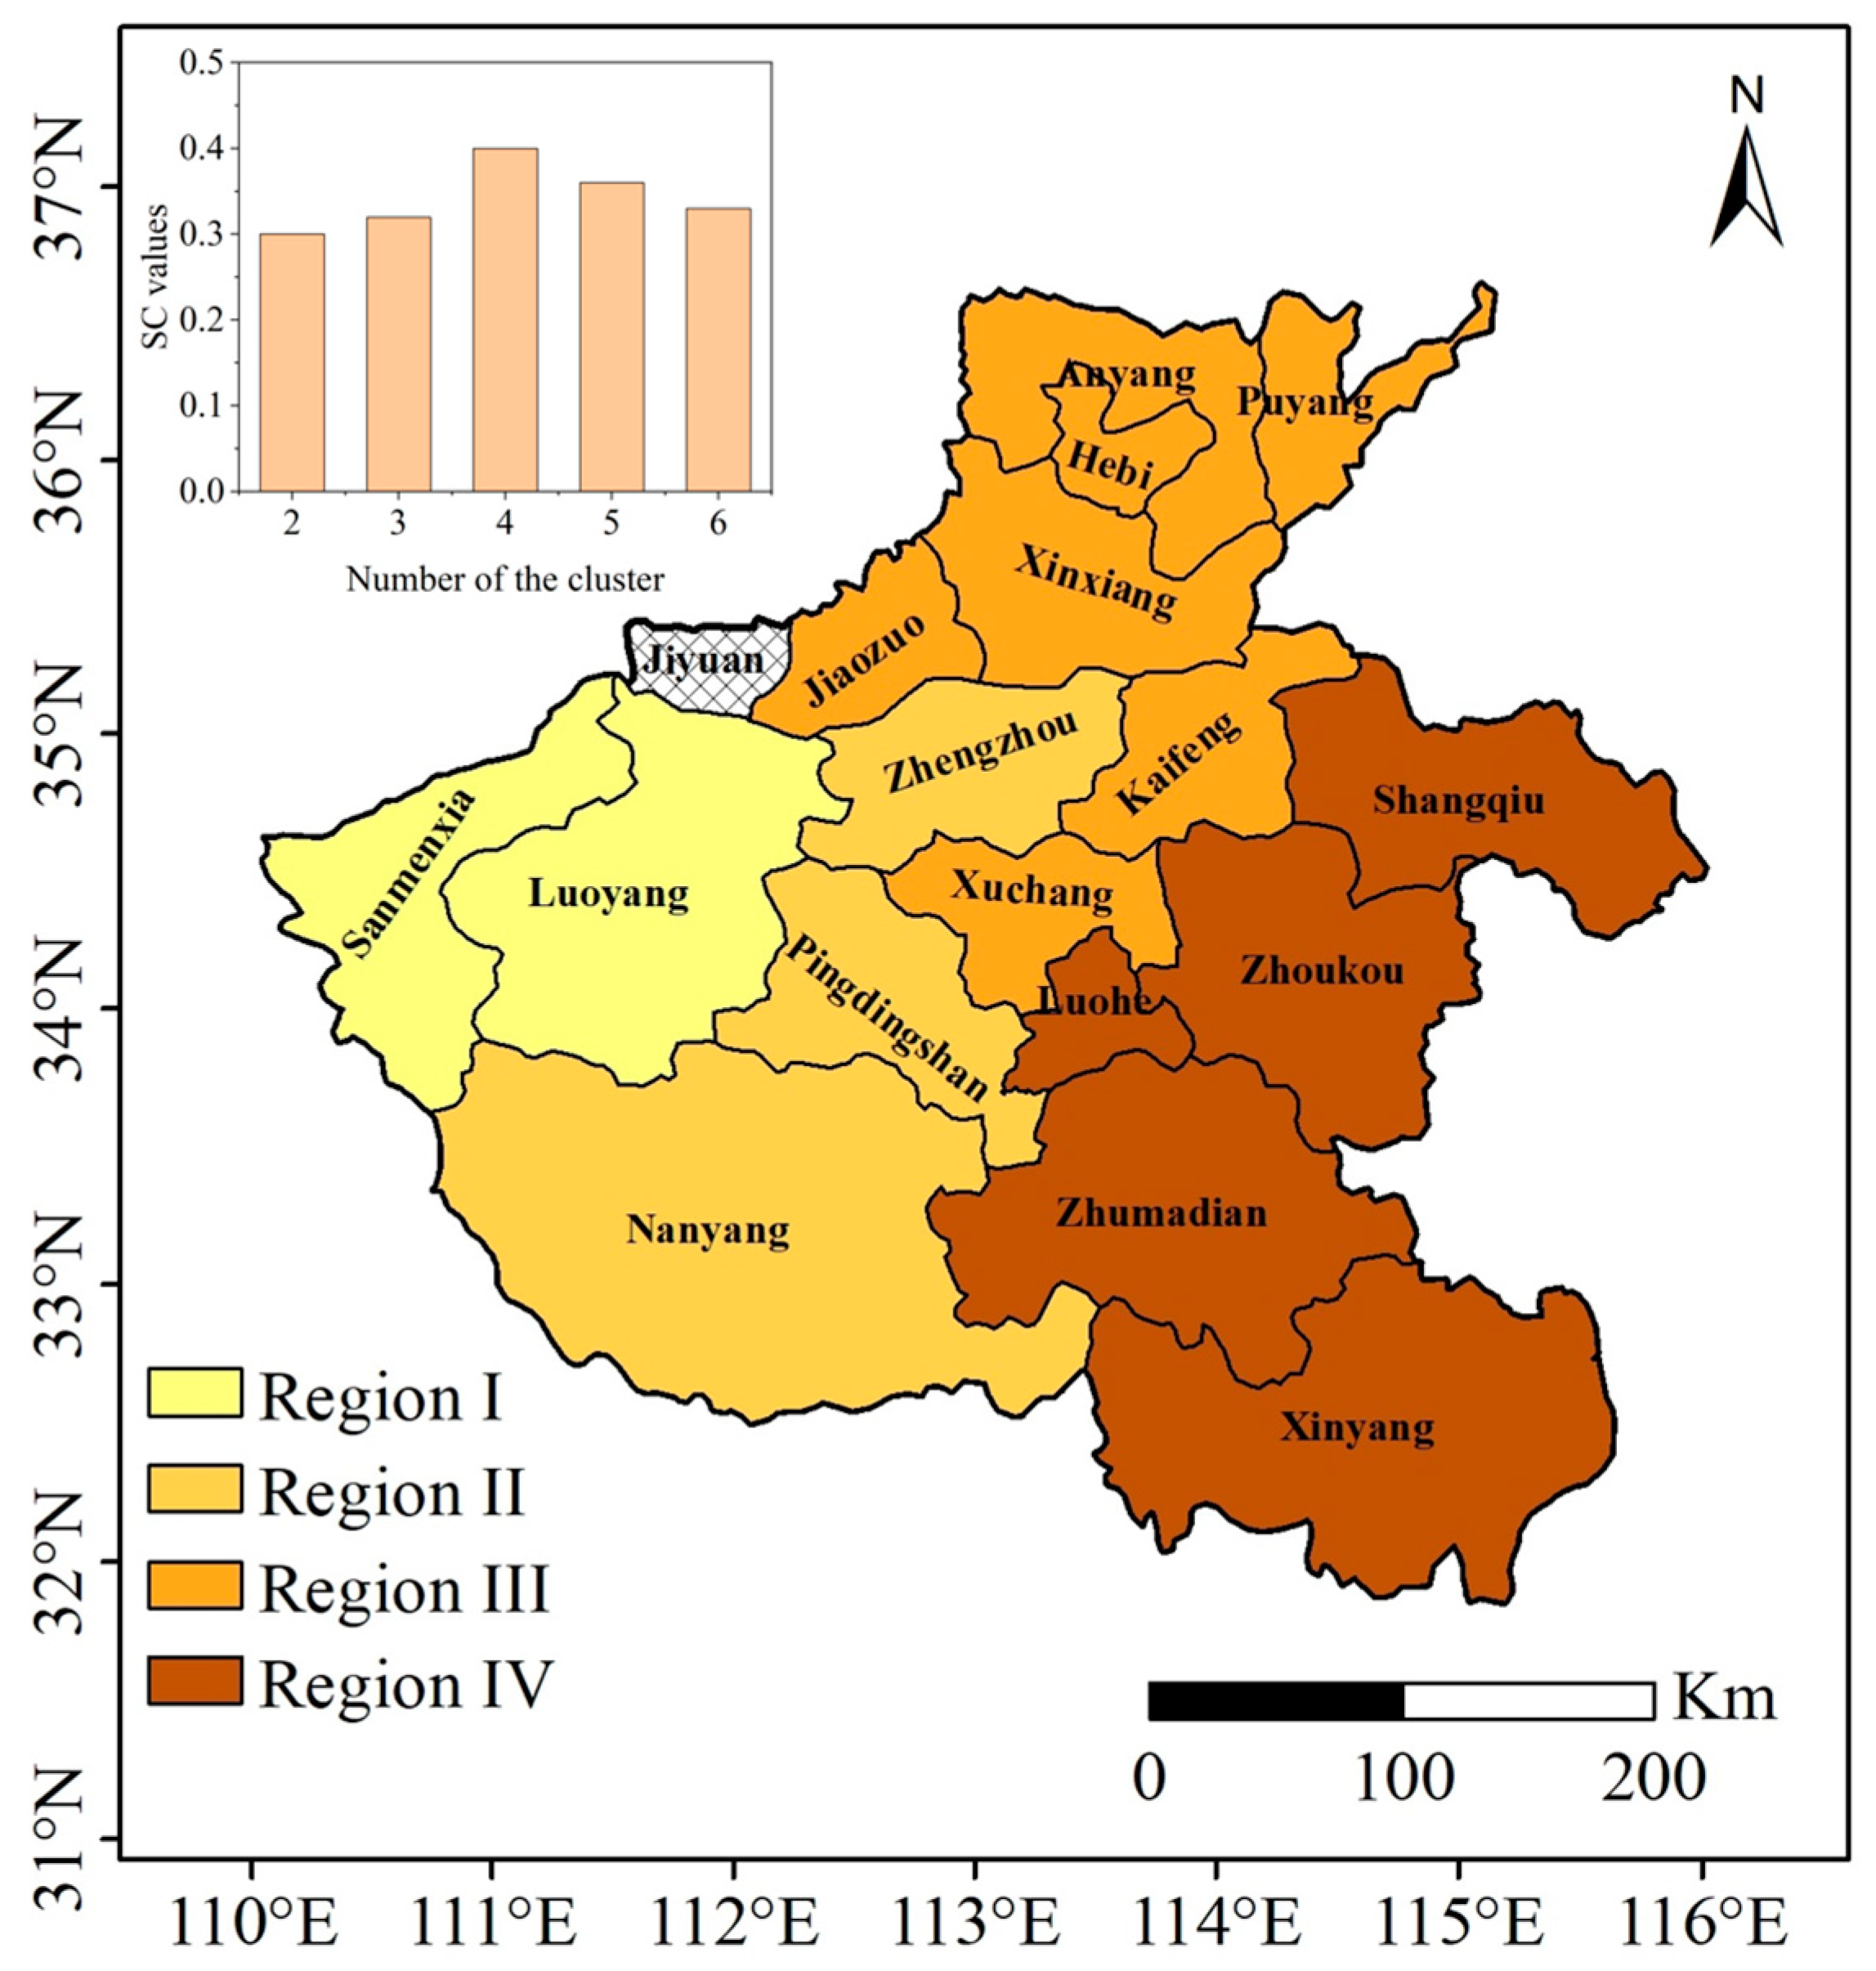
3.1. AWWY-Based Regionalization in Henan

As described in Section 2.3.1, the values of 13 indices in 17 cities in Henan were first calculated. Then, the principal components of 13 columns (13 indices) × 17 rows (17 cities) were analyzed using the PCA method (Table 2). To reduce the dimensionality of the data, we selected the first three principal components (PCs) because their eigenvalues were greater than 1, and their cumulative variances exceeded 89%. As shown in Table 2, PC1 had higher loadings on five indices, namely, ZMK, H, CIMF1, CIMF3 and Ctrend, representing the persistent trend of the AWWY time series. PC2 had higher loadings on four indices, namely, RNG, STD, CV and MAG, representing the magnitude of the change in AWWY. PC3 had higher loadings on three indices, namely, MIN, MAX and AVE, representing the high (or low) levels of AWWY. According to the first three PCs, we obtained their corresponding score sequences. A matrix of 3 columns (3 score sequences) × 17 rows (17 cities) was clustered using the K-means method.
As shown in Figure 2, the SC values varied for different numbers of clusters. The highest SC value occurred when the number of clusters reached four. Therefore, 17 cities in Henan could be partitioned into four sub-regions characterized by different AWWY variations, i.e., Sanmenxia and Luoyang in the western region (Region I); Zhengzhou, Pingdingshan and Nanyang in the central-western region (Region II); Xuchang, Kaifeng, Jiaozuo, Xinxiang, Hebi, Puyang and Anyang in the central-northern region (Region III); and Luohe, Shangqiu, Zhoukou, Zhumadian and Xinyang in the eastern region (Region IV) (Table S1).

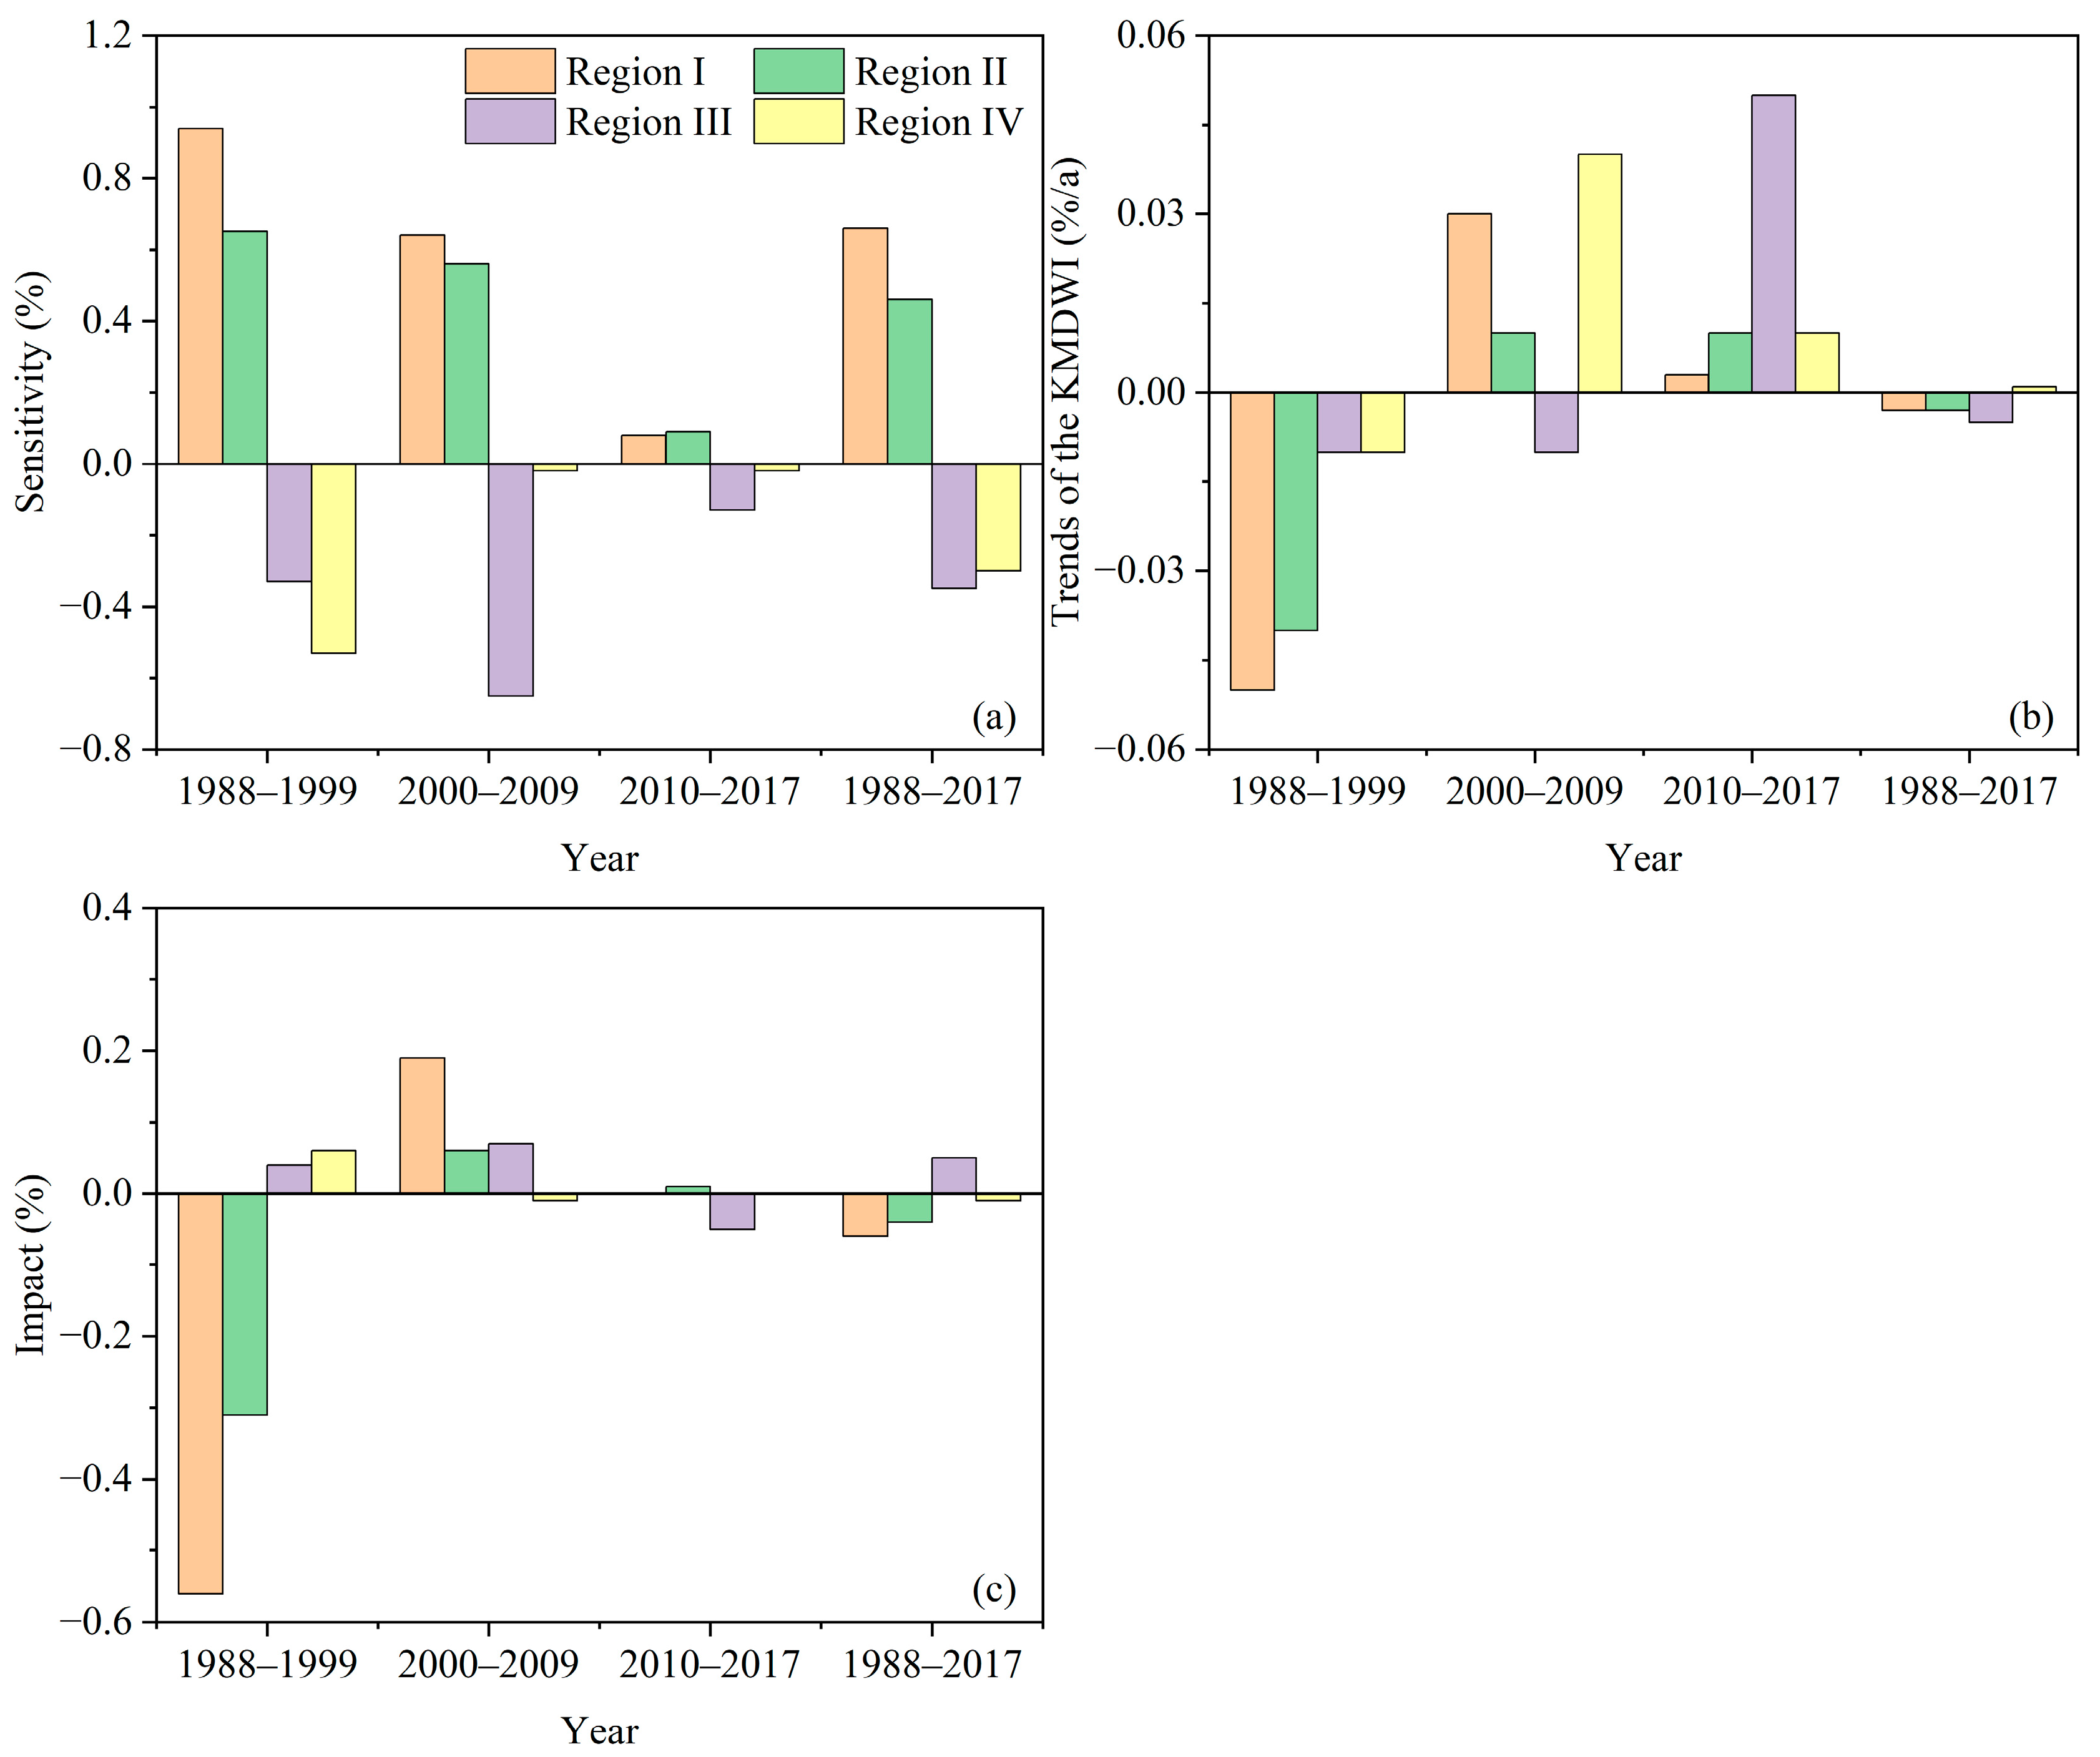
3.2. Spatial Differences in AWWY in Henan

The statistical values of 13 indices characterizing the AWWY time series in the four sub-regions are shown in Table 3. As shown in Table 3, the AVE of AWWY was the highest in Region III (5770.9 kg/hm2), followed by Region IV (5091.3 kg/hm2) and it was the lowest in Region I (3536.3 kg/hm2). Compared with the AVE, the RNG of AWWY was the highest in Region IV (4736 kg/hm2), followed by Region III (3561.2 kg/hm2) and it was the lowest in Region II (2543.8 kg/hm2). Furthermore, the ZMK, MAG and CTrend were higher in Regions III and IV than in Regions II and I. These results indicate that in Henan, Regions III and IV had a remarkable increasing trend in AWWY, as well as a high and stable yield.

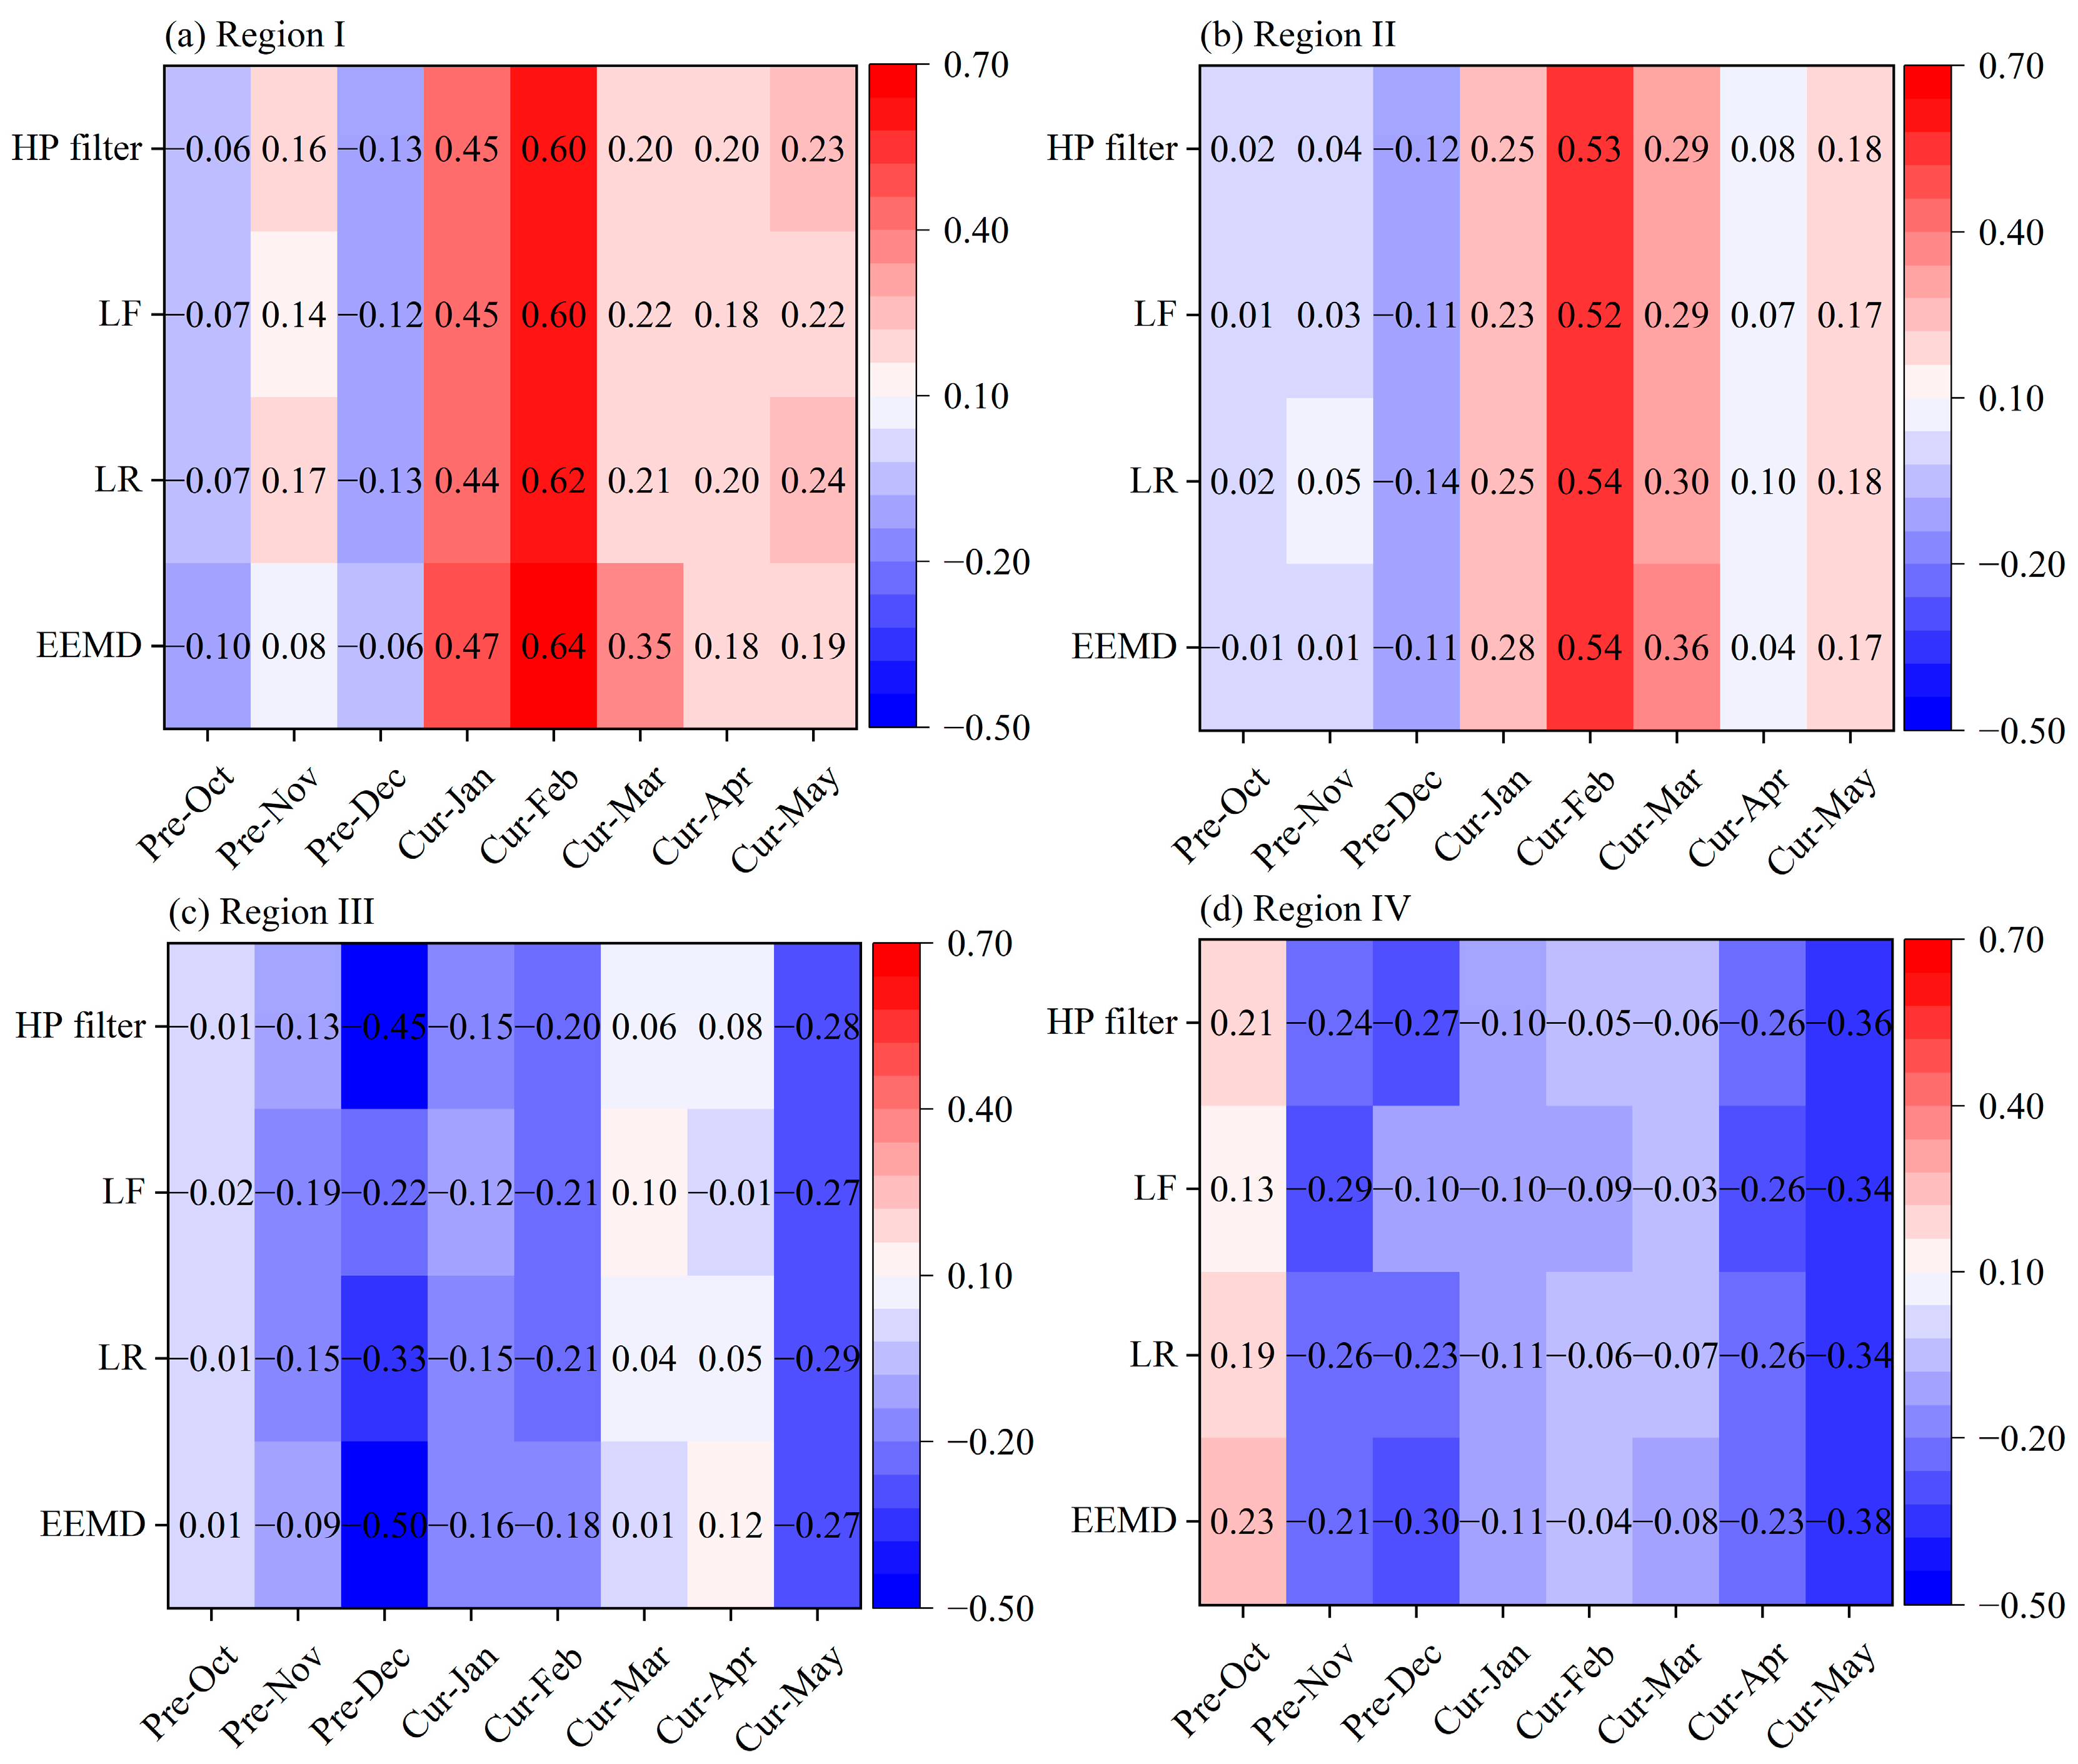
3.3. Relationships between CDWWY and sc-PDSIs during the Wheat Growing Season in Henan

In this study, we employed four commonly used methods to extract CDWWY (Figure 3). Compared with the LR, LF and HP filter, the CDWWY calculated using EEMD showed a higher correlation with the sc-PDSIs during the winter wheat growing season for the four sub-regions in Henan. Taking the CDWWY calculated using EEMD as an example, it was found that the sc-PDSIs from January to February of the current year had a significant positive impact on CDWWY in Region I (p < 0.05), and the sc-PDSI in February had the largest impact on CDWWY, which was considered the KMDWI in this sub-region. Similarly, the sc-PDSI in February also had the largest impact on CDWWY in Region II (p < 0.05), and a wet February was more favorable for winter wheat production in this sub-region. In contrast to Regions I and II, the sc-PDSI in December of the previous year and the sc-PDSI in May of the current year had significant negative impacts on CDWWY in Regions III and IV, respectively (p < 0.05), which were considered the KMDWI in both sub-regions, respectively. These results indicate that meteorological dryness/wetness conditions in different key months limited winter wheat production in Regions III and IV.
The responses of CDWWY to KMDWI changes in different sub-regions and periods are shown in Figure 4. If the KMDWI increased by 1% during the study period, CDWWY increased by 0.66% and 0.46% in Regions I and II, respectively, and it decreased by 0.35% and 0.30% in Regions III and IV, respectively (Figure 4a). However, limited impacts of the KMDWI trends on CDWWY were found for the four sub-regions, ranging from −0.06% to 0.05%, due to a weak KMDWI trend in each sub-region from 1988 to 2017 (Figure 4b,c). Furthermore, we classified the study period into three sub-periods, i.e., 1988–1999, 2000–2009 and 2010–2017, and we then found that the responses of CDWWY to KMDWI changes showed obvious interdecadal differences in Regions I and II. The sensitivities of CDWWY to KMDWI changes were the highest in 1988–1999, followed by 2000–2009 and they were the lowest in 2010–2017 in Regions I and II. Consequently, the impacts of the KMDWI trends on CDWWY gradually weakened from 1988–1999 to 2010–2017 in both sub-regions. Compared with Regions I and II, the impacts of the KMDWI trends on CDWWY were obviously weaker in Regions III and IV during the three sub-periods.

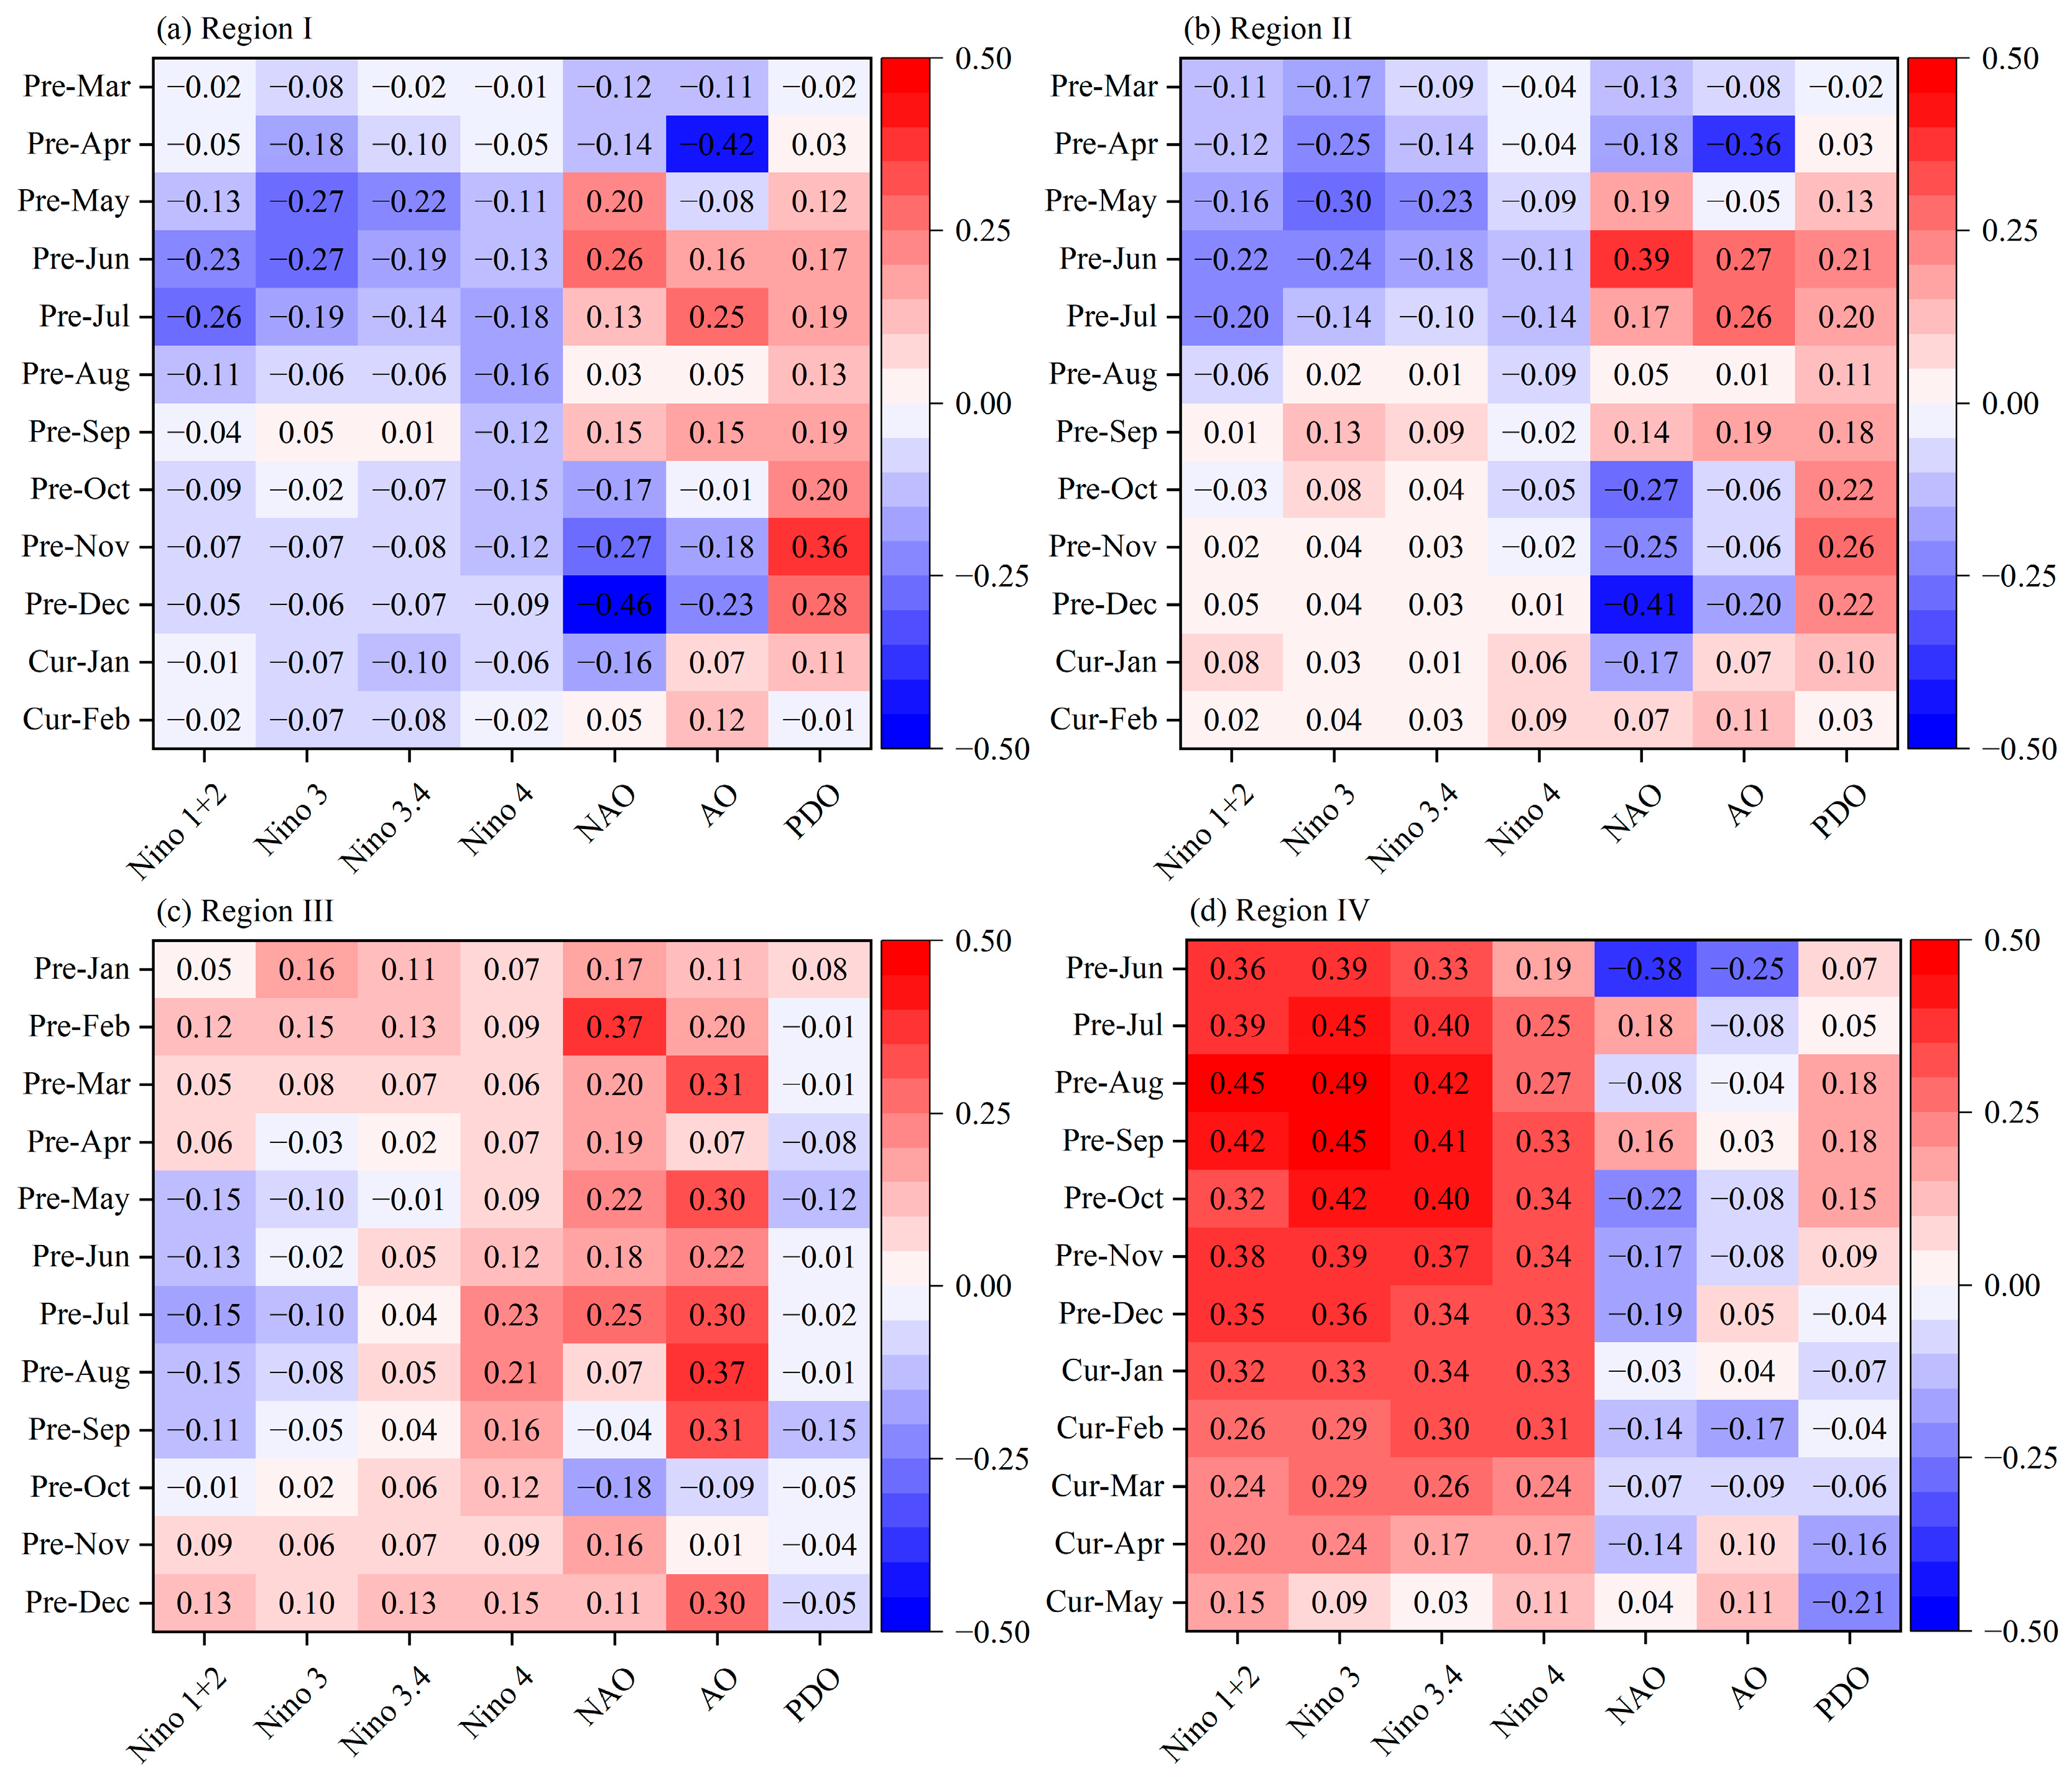
3.4. Relationships between the KMDWI and Atmospheric Circulation Indices in Henan

We used a Pearson correlation analysis to examine the relationship between the KMDWI of the key month and seven atmospheric circulation indices of the 12 months previous to that key month (Figure 5). As shown in Figure 5, the most significant correlation was found in Region IV, with the highest absolute value of 0.49. Compared with this, the highest correlation coefficient in Region III was less than 0.40. Furthermore, the atmospheric circulation indices had time-lag effects on the KMDWIs in the different sub-regions. For example, NAO in December, PDO in November and AO in April of the previous year had a significant impact on the KMDWI (p < 0.05) in Region I (Figure 5a), while NAO in June and December and AO in April of the previous year had a significant impact on the KMDWI (p < 0.05) in Region II (Figure 5b). As for Regions III and IV, NAO in February and AO in August of the previous year had a significant impact on the KMDWI (p < 0.05) in Region III (Figure 5c), while the atmospheric circulation indices that affected the KMDWI in Region IV (p < 0.05) mainly included Niño 1+2, Niño 3 and Niño 3.4 from June to November of the previous year, as well as NAO in June of the previous year (Figure 5d).
Given the results of the correlation analysis described above, we selected the atmospheric circulation indices with the highest correlation with the corresponding KMDWI for each month as the premonitory influencing signals in different sub-regions. Then, we constructed regression models between the KMDWI and selected atmospheric circulation indices in each sub-region. As shown in Table 4, the multifactorial models that we constructed had the ability to simulate the KMDWIs for the four sub-regions. Their R2 values were in the range of 0.49 to 0.65, and the corresponding RMSE values were in the range of 0.58 to 0.72 in the different sub-regions.

4. Discussion

According to the AWWY time series from 17 cities, Henan province could be partitioned into four sub-regions using a characteristic-based time series clustering analysis (Figure 2). The complex geographical environment could be one of the important factors responsible for the spatial differences in AWWY. Regions I and II are surrounded by the Taihang Mountains and the Funiu Mountains (Figure 1), and the high mountain terrain restricts the use of agricultural machinery [58]. Furthermore, the complex climate, poor quality of arable land and low level of irrigation in the mountainous areas have a combined effect on the production of winter wheat in both sub-regions [30,58,59,60]. However, our finding is similar to that of a risk assessment of an agrometeorological disaster in Henan, which was the result of a combination of four main factors (hazard, exposure, vulnerability and restorability) [59]. Therefore, a characteristic-based time series clustering analysis could also provide a new perspective for the regionalization of crop production risk under the background of climate change due to its simple data requirements and reliable results [14].
The sc-PDSIs in February, May and December were the KMDWIs that influenced yield in the four sub-regions (Figure 3). Among them, the sc-PDSI in February had significantly positive impacts on yield in Regions I and II (p < 0.05), while the sc-PDSI in December and the sc-PDSI in May had significantly negative impacts on yield in Regions III and IV, respectively (p < 0.05). The uneven distribution of precipitation during the winter wheat growing season led to a severe water shortage in the greening stage, and the drought risk gradually decreased from western to eastern Henan [31,61]. Thus, the higher the sc-PDSI in February of the current year, the higher the yields in Regions I and II. The impacts of drought risk on yield could be alleviated by maintaining soil moisture through appropriate tillage methods, improving irrigation efficiency and using drought-resistant varieties of wheat [62,63]. Spring waterlogging disasters occurred mainly in the eastern parts of Henan, and a wetter climate in the maturity stage was unfavorable to spike development and grain formation [64,65], resulting in lower yields in Region IV with a higher sc-PDSI in May of the current year. Therefore, conducting farmland drainage measures in a timely manner is critical for achieving drainage and water logging, as well as coordinated regulation [66,67]. Additionally, the occurrence of wheat lodging caused by heavy rainfall and high winds should also be noted [68]. Chill damage in the overwintering stage was the main unfavorable factor for the growth of winter wheat in the northern parts of Henan, and more rainfall exacerbated low temperatures and low sunshine [69,70], which led to lower yields in Region III with a higher sc-PDSI in December of the previous year. Therefore, shifting the wheat planting calendar, spraying foliar fertilizers and using cold-resistant winter wheat varieties could reduce the negative effects of chill damage in the overwintering stage [71,72,73].
In addition to identifying the KMDWIs that affect yield fluctuations, we also found a time-lag relationship between the KMDWIs and atmospheric circulation indices. Although similar results have been reported in previous studies [9,55,56], our study indicates that the time-lag relationship exhibited spatial differences in the different sub-regions (Figure 5). In particular, the time lag of the same KMDWI response was different for the different atmospheric circulation indices in the four sub-regions. Furthermore, the multifactorial models used to simulate the KMDWIs for the four sub-regions were constructed by selecting suitable atmospheric circulation indices (Table 4). Compared with previous studies conducted at a larger spatial scale [74,75], the accuracy of our empirical models, together with R2 and RMSE, could give a reliable output and be applied at the provincial scale. Furthermore, atmospheric circulation indices can be forecasted about 6 to 9 months in advance by the National Climate Center of China [76], suggesting that our empirical models obtain KMDWIs for the four sub-regions at an early stage, and they are of great significance for meteorological dryness/wetness monitoring for winter wheat production and providing some coping strategies in each sub-region [77,78].
The limitations of our study are based on two main aspects. First, we mainly focused on the response of winter wheat yield to meteorological dryness/wetness variations in Henan using statistical data from the perspective of the agricultural climate, without fully considering the effects of other yield-related factors, e.g., plant cultivation, soil category and treatments [79,80]. Second, we constructed multifactorial models capable of simulating KMDWIs in four sub-regions. However, the mechanisms of the natural and anthropogenic factors, including atmospheric circulation, underlying the KMDWIs are more complex and still need to be studied in depth [81]. Therefore, we will collect more data on climate, soil and crop management to understand climate–yield relationships and to improve the simulation performance of unfavorable meteorological dryness/wetness conditions by incorporating machine learning methods [82,83,84].

5. Conclusions

Using long-term data on climate, yield and atmospheric circulation indices, this study analyzed the response of winter wheat yield to sc-PDSI variations in Henan from 1987 to 2017. The main results were as follows:
(1)
A PCA and a K-means clustering analysis were used to partition the AWWY time series from 17 cities into four sub-regions. Although AWWY exhibited an increasing trend in all of the four sub-regions (p < 0.05), it was high and stable in Regions III and IV.
(2)
The sc-PDSI for a specific month could be considered the KMDWI affecting CDWWY in each sub-region, for example, the sc-PDSI in February of the current year for Regions I and II, the sc-PDSI in December of the previous year for Region III and the sc-PDSI in May of the current year for Region IV.
(3)
The atmospheric circulation indices had time-lag effects on the KMDWIs, and empirical KMDWI simulation models were constructed based on selected atmospheric circulation indices in the four sub-regions. Their R2 values were in the range of 0.49 to 0.65, and the corresponding RMSE values were in the range of 0.58 to 0.72.

Supplementary Materials

The following supporting information can be downloaded at: https://www.mdpi.com/article/10.3390/agronomy14040817/s1, Table S1: statistical values of climate elements for four sub-regions in Henan. Section S1: detailed explanation of statistical methods used in our study.

Author Contributions

Conceptualization, C.L. and H.X.; methodology, Y.G. and J.H.; software, C.L.; formal analysis, H.X. and J.H.; data curation, B.L.; writing—original draft preparation, C.L. and Y.G.; writing—review and editing, H.X., J.H., B.L., K.P.C. and T.O.; funding acquisition, C.L. and K.P.C. All authors have read and agreed to the published version of the manuscript.

Funding

This research was funded by the National Natural Science Foundation of China (41801013), the Royal Society International Exchanges 2022 (IEC\NSFC\223132), the Young Scientific and Technological Talents Support Project of Jiangsu Association for Science and Technology (TJ-2023-032), the Humanities and Social Sciences Foundation of Yangzhou University (xjj2023-05) and the Qinglan Project of Yangzhou University.

Data Availability Statement

The data presented in this study are available on request from the corresponding author.

Conflicts of Interest

The authors declare no conflicts of interest.

References

  1. Konapala, G.; Mishra, A.K.; Wada, Y.; Mann, M.E. Climate change will affect global water availability through compounding changes in seasonal precipitation and evaporation. Nat. Commun. 2020, 11, 3044. [Google Scholar] [CrossRef] [PubMed]
  2. Tabari, H. Climate change impact on flood and extreme precipitation increases with water availability. Sci. Rep. 2020, 10, 13768. [Google Scholar] [CrossRef]
  3. Huang, Q.; Zhang, Q.; Singh, V.P.; Shi, P.; Zheng, Y. Variations of dryness/wetness across China: Changing properties, drought risks, and causes. Global Planet. Chang. 2017, 155, 1–12. [Google Scholar] [CrossRef]
  4. Wei, W.; Wang, J.; Ma, L.; Wang, X.; Xie, B.; Zhou, J.; Zhang, H. Global Drought-Wetness Conditions Monitoring Based on Multi-Source Remote Sensing Data. Land 2024, 13, 95. [Google Scholar] [CrossRef]
  5. Chen, S.; Gong, B. Response and adaptation of agriculture to climate change: Evidence from China. J. Dev. Econ. 2021, 148, 102557. [Google Scholar] [CrossRef]
  6. Kang, L.; Zhao, R.; Wu, K.; Huang, Q.; Zhang, S. Impacts of Farming Layer Constructions on Cultivated Land Quality under the Cultivated Land Balance Policy. Agronomy 2021, 11, 2403. [Google Scholar] [CrossRef]
  7. Tian, X.; Engel, B.A.; Qian, H.; Hua, E.; Sun, S.; Wang, Y. Will reaching the maximum achievable yield potential meet future global food demand? J. Clean. Prod. 2021, 294, 126285. [Google Scholar] [CrossRef]
  8. Hasegawa, T.; Sakurai, G.; Fujimori, S.; Takahashi, K.; Hijioka, Y.; Masui, T. Extreme climate events increase risk of global food insecurity and adaptation needs. Nat. Food 2021, 2, 587–595. [Google Scholar] [CrossRef] [PubMed]
  9. Li, C.; Wang, R.; Xu, J.; Luo, Y.; Tan, M.L.; Jiang, Y. Analysis of meteorological dryness/wetness features for spring wheat production in the Ili River basin, China. Int. J. Biometeorol. 2018, 62, 2197–2204. [Google Scholar] [CrossRef]
  10. Wang, X.; Qian, L.; Dong, C.; Tang, R. Evaluating the Impacts of Waterlogging Disasters on Wheat and Maize Yields in the Middle and Lower Yangtze River Region, China, by an Agrometeorological Index. Agronomy 2023, 13, 2590. [Google Scholar] [CrossRef]
  11. Li, C.; Chen, J.; Wang, R.; Huang, J.; Qian, Z.; Xu, Y. Multi-indices analysis of heavy precipitation changes in Anhui Province, China. Meteorol. Atmos. Phys. 2021, 133, 1317–1325. [Google Scholar] [CrossRef]
  12. Huang, J.; Zhang, F.; Zhou, L.; Hu, Z.; Li, Y. Regional changes of climate extremes and its effect on rice yield in Jiangsu province, southeast China. Environ. Earth. Sci. 2018, 77, 106. [Google Scholar] [CrossRef]
  13. Song, C.; Pei, T. Research Progress in Time Series Clustering Methods Based on Characteristics. Prog. Geogr. 2012, 10, 1307–1317, (In Chinese with English abstract). [Google Scholar]
  14. Wang, X.; Smith, K.; Hyndman, R. Characteristic-Based Clustering for Time Series Data. Data Min. Knowl. Discov. 2006, 13, 335–364. [Google Scholar] [CrossRef]
  15. Garcia-Gutierrez, L.; Voyant, C.; Notton, G.; Almorox, J. Evaluation and Comparison of Spatial Clustering for Solar Irradiance Time Series. Appl. Sci. 2022, 12, 8529. [Google Scholar] [CrossRef]
  16. Huang, J.; Zhou, L.; Zhang, F.; Hu, Z.; Tian, H. Responses of yield variability of summer maize in Henan province, north China, to large-scale atmospheric circulation anomalies. Theor. Appl. Climatol. 2021, 143, 1655–1665. [Google Scholar] [CrossRef]
  17. Iizumi, T.; Sakai, T. The global dataset of historical yields for major crops 1981–2016. Sci. Data 2020, 7, 97. [Google Scholar] [CrossRef] [PubMed]
  18. Li, L.; She, D.; Zheng, H.; Lin, P.; Yang, Z. Elucidating diverse drought characteristics from two meteorological drought indices (SPI and SPEI) in China. J. Hydrometeorol. 2020, 21, 1513–1530. [Google Scholar] [CrossRef]
  19. Liu, Q.; Zhang, J.; Zhang, H.; Yao, F.; Bai, Y.; Zhang, S.; Meng, X.; Liu, Q. Evaluating the performance of eight drought indices for capturing soil moisture dynamics in various vegetation regions over China. Sci. Total Environ. 2021, 789, 147803. [Google Scholar] [CrossRef]
  20. Saharwardi, M.S.; Kumar, P. Future drought changes and associated uncertainty over the homogenous regions of India: A multimodel approach. Int. J. Climatol. 2022, 42, 652–670. [Google Scholar] [CrossRef]
  21. Wang, H.; Chen, Y.; Pan, Y.; Li, W. Spatial and temporal variability of drought in the arid region of China and its relationships to teleconnection indices. J. Hydrometeorol. 2015, 523, 283–296. [Google Scholar] [CrossRef]
  22. Zhao, H.; Gao, G.; An, W.; Zou, X.; Li, H.; Hou, M. Timescale differences between sc-PDSI and SPEI for drought monitoring in China. Phys. Chem. Earth 2017, 102, 48–58. [Google Scholar] [CrossRef]
  23. Faiz, M.A.; Zhang, Y.; Tian, X.; Tian, J.; Zhang, X.; Ma, N.; Aryal, S. Drought index revisited to assess its response to vegetation in different agro-climatic zones. J. Hydrometeorol. 2022, 614, 128543. [Google Scholar]
  24. Ray, D.; Gerber, J.; MacDonald, G.; West, P.C. Climate variation explains a third of global crop yield variability. Nat. Commun. 2015, 6, 5989. [Google Scholar] [CrossRef] [PubMed]
  25. Shi, W.; Tao, F.; Zhang, Z. A review on statistical models for identifying climate contributions to crop yields. J. Geogr. Sci. 2013, 23, 567–576. [Google Scholar] [CrossRef]
  26. Nikraftar, Z.; Mostafaie, A.; Sadegh, M.; Afkueieh, J.H.; Pradhan, B. Multi-type assessment of global droughts and teleconnections. Weather Clim. Extrem. 2021, 34, 100402. [Google Scholar] [CrossRef]
  27. Kretschmer, M.; Adams, S.V.; Arribas, A.; Prudden, R.; Robinson, N.; Saggioro, E.; Shepherd, T.G. Quantifying causal pathways of teleconnections. Bull. Am. Meteorol. Soc. 2021, 102, E2247–E2263. [Google Scholar] [CrossRef]
  28. Shiferaw, B.; Smale, M.; Braun, H.J.; Duveiller, E.; Reynolds, M.; Muricho, G. Crops that feed the world 10. Past successes and future challenges to the role played by wheat in global food security. Food Secur. 2013, 5, 291–317. [Google Scholar] [CrossRef]
  29. Wang, T.; Zhang, L.; Zhou, S.; Zhang, T.; Zhai, S.; Yang, Z.; Wang, D.; Song, H. Effects of ground-level ozone pollution on yield and economic losses of winter wheat in Henan, China. Atmos. Environ. 2021, 262, 118654. [Google Scholar] [CrossRef]
  30. Zheng, H.; Huang, J.; Chen, J. Climate-Induced Yield Losses for Winter Wheat in Henan Province, North China and Their Relationship with Circulation Anomalies. Water 2021, 13, 3341. [Google Scholar] [CrossRef]
  31. Shi, B.; Zhu, X.; Hu, Y.; Yang, Y. Drought characteristics of Henan province in 1961-2013 based on Standardized Precipitation Evapotranspiration Index. J. Geogr. Sci. 2017, 27, 311–325. [Google Scholar] [CrossRef]
  32. Liu, X.; Cao, K.; Li, M. Assessing the impact of meteorological and agricultural drought on maize yields to optimize irrigation in Heilongjiang Province, China. J. Clean. Prod. 2024, 434, 139897. [Google Scholar] [CrossRef]
  33. Ghose, B.; Islam, A.R.M.T.; Islam, H.M.T.; Hasanuzzaman, M.; Huang, J.; Hu, Z.; Moniruzzaman, M.; Gustave, W.; Karim, M.; Ibrahim, S.M. Rain-fed rice yield fluctuation to climatic anomalies in Bangladesh. Int. J. Plant Prod. 2021, 15, 183–201. [Google Scholar] [CrossRef]
  34. Gocic, M.; Trajkovic, S. Analysis of changes in meteorological variables using Mann-Kendall and Sen’s slope estimator statistical tests in Serbia. Global Planet. Chang. 2013, 100, 172–182. [Google Scholar] [CrossRef]
  35. Wang, W.; Chen, X.; Shi, P.; van Gelder, P.H.A.J.M. Detecting changes in extreme precipitation and extreme streamflow in the Dongjiang River basin in southern China. Hydrol. Earth Syst. Sci. 2008, 12, 207–221. [Google Scholar] [CrossRef]
  36. Sen, P.K. Estimates of the regression coefficient based on Kendall’s tau. J. Am. Stat. Assoc. 1968, 63, 1379–1389. [Google Scholar] [CrossRef]
  37. Mandelbrot, B.; Willis, J.R. Robustness of the rescaled range R/S in the measurement of noncyclic long-run statistical dependence. Water Resour. Res. 1969, 5, 967–988. [Google Scholar] [CrossRef]
  38. Peng, J.; Liu, Z.; Liu, Y.; Wu, J.; Han, Y. Trend analysis of vegetation dynamics in Qinghai-Tibet Plateau using Hurst Exponent. Ecol. Indic. 2012, 14, 28–39. [Google Scholar] [CrossRef]
  39. Kim, T.; Shin, J.Y.; Kim, S.; Heo, J.H. Identification of relationships between climate indices and long-term precipitation in South Korea using ensemble empirical mode decomposition. J. Hydrol. 2018, 557, 726–739. [Google Scholar] [CrossRef]
  40. Wu, Z.; Huang, N.E. Ensemble empirical mode decomposition: A noise-assisted data analysis method. Adv. Adapt. Data Anal. 2009, 1, 1–41. [Google Scholar] [CrossRef]
  41. Lei, Y.; He, Z.; Zi, Y. Application of the EEMD method to rotor fault diagnosis of rotating machinery. Mech. Syst. Signal Process. 2009, 23, 1327–1338. [Google Scholar] [CrossRef]
  42. Li, C.; Li, Z.; Xu, H.; Huang, J.; Zhang, F.; Qian, Z. Fluctuation Characteristics of Wheat Yield and Their Relationships with Precipitation Anomalies in Anhui Province, China. Int. J. Plant Prod. 2022, 16, 483–494. [Google Scholar] [CrossRef]
  43. Santos, J.F.; Pulido-Calvo, I.; Portela, M.M. Spatial and temporal variability of droughts in Portugal. Water Resour Res. 2010, 46, W03503. [Google Scholar] [CrossRef]
  44. Bonaccorso, B.; Bordi, I.; Cancelliere, A.; Rossi, G.; Sutera, A. Spatial variability of drought: An analysis of the SPI in Sicily. Water Resour. Manag. 2003, 17, 273–296. [Google Scholar] [CrossRef]
  45. Bordi, I.; Sutera, A. Fifty years of precipitation: Some spatially remote teleconnections. Water Resour. Manag. 2001, 15, 247–280. [Google Scholar] [CrossRef]
  46. Jain, A.K. Data clustering: 50 years beyond K-means. Pattern Recogn. Lett. 2010, 31, 651–666. [Google Scholar] [CrossRef]
  47. Liu, H.; Zhan, Q.; Yang, C.; Wang, J. Characterizing the Spatio-temporal pattern of land surface temperature through time series clustering: Based on the latent pattern and morphology. Remote Sens. 2018, 10, 654. [Google Scholar] [CrossRef]
  48. Kazor, K.; Hering, A.S. Assessing the performance of model-based clustering methods in multivariate time series with application to identifying regional wind regimes. Agric. Biol. Environ. Stat. 2015, 20, 192–217. [Google Scholar] [CrossRef]
  49. Zhe, M.; Zhang, X. Time-lag effects of NDVI responses to climate change in the Yamzhog Yumco Basin, South Tibet. Ecol. Indic. 2021, 124, 107431. [Google Scholar] [CrossRef]
  50. Li, Z.; Wu, Y.; Wang, R.; Liu, B.; Qian, Z.; Li, C. Assessment of Climatic Impact on Vegetation Spring Phenology in Northern China. Atmosphere 2023, 14, 117. [Google Scholar] [CrossRef]
  51. Wells, N.; Goddard, S.; Hayes, M.J. A self-calibrating Palmer drought severity index. J. Clim. 2004, 17, 2335–2351. [Google Scholar] [CrossRef]
  52. Han, J.; Singh, V.P. A review of widely used drought indices and the challenges of drought assessment under climate change. Environ. Monit. Assess. 2023, 195, 1438. [Google Scholar] [CrossRef]
  53. Najafi, E.; Devineni, N.; Khanbilvardi, R.M.; Kogan, F. Understanding the changes in global crop yields through changes in climate and technology. Earth’s Future 2018, 6, 410–427. [Google Scholar] [CrossRef]
  54. Huang, J.; Chen, X.; Zhou, L.; Xue, Y.; Lin, J. Statistical analysis of the relationship between climate-induced maize yield and rainy-season precipitation across Inner Mongolia, North China. Theor. Appl. Climatol. 2017, 129, 1145–1156. [Google Scholar] [CrossRef]
  55. Fan, L.; Wang, Y.; Cao, C.; Chen, W. Teleconnections of Atmospheric Circulations to Meteorological Drought in the Lancang-Mekong River Basin. Atmosphere 2024, 15, 89. [Google Scholar] [CrossRef]
  56. Yue, Y.; Shen, S.; Wang, Q. Trend and Variability in Droughts in Northeast China Based on the Reconnaissance Drought Index. Water 2018, 10, 318. [Google Scholar] [CrossRef]
  57. Zhou, W.; Guan, K.; Peng, B.; Shi, J.; Jiang, C.; Wardlow, B.; Pan, M.; Kimball, J.S.; Franz, T.E.; Gentine, P.; et al. Connections between the hydrological cycle and crop yield in the rainfed US Corn Belt. J. Hydrometeorol. 2020, 590, 125398. [Google Scholar]
  58. Liu, Y.; Wu, K.; Li, X.; Li, X.; Cao, H. Adaptive Management of Cultivated Land Use Zoning Based on Land Types Classification: A Case Study of Henan Province. Land 2022, 11, 346. [Google Scholar] [CrossRef]
  59. Hu, Z.; Wu, Z.; Islam, A.R.M.T.; You, X.; Liu, C.; Li, Q.; Zhang, S. Spatiotemporal characteristics and risk assessment of agricultural drought disasters during the winter wheat-growing season on the Huang-Huai-Hai Plain, China. Theor. Appl. Climatol. 2021, 143, 1393–1407. [Google Scholar] [CrossRef]
  60. Guan, X.; Wang, X.; Chen, W. Risk Assessment and Regulation Strategy of Farmland Marginalization: A Case Study of Mengjin County, Henan Province. Front. Environ. Sci. 2022, 10, 892665. [Google Scholar] [CrossRef]
  61. Zeng, R.; Yao, F.; Zhang, S.; Yang, S.; Bai, Y.; Zhang, J.; Wang, J.; Wang, X. Assessing the effects of precipitation and irrigation on winter wheat yield and water productivity in North China Plain. Agric. Water Manag. 2021, 256, 107063. [Google Scholar] [CrossRef]
  62. Wang, C.; Zhao, J.; Feng, Y.; Shang, M.; Bo, X.; Gao, Z.; Chen, F.; Chu, Q. Optimizing tillage method and irrigation schedule for greenhouse gas mitigation, yield improvement, and water conservation in wheat–maize cropping systems. Agric. Water Manag. 2021, 248, 106762. [Google Scholar] [CrossRef]
  63. Mwadzingeni, L.; Shimelis, H.; Dube, E.; Laing, M.D.; Tsilo, T.J. Breeding wheat for drought tolerance: Progress and technologies. J. Integr. Agric. 2016, 15, 935–943. [Google Scholar] [CrossRef]
  64. Chen, C.; Lu, W.; Sun, X.; Yu, H. Regional differences of winter wheat phenophase and grain yields response to global warming in the Huang-Huai-Hai plain in China since 1980s. Int. J. Plant Prod. 2018, 12, 33–41. [Google Scholar] [CrossRef]
  65. Song, Y.; Linderholm, H.W.; Wang, C.; Tian, J.; Huo, Z.; Gao, P.; Song, Y.; Guo, A. The influence of excess precipitation on winter wheat under climate change in China from 1961 to 2017. Sci. Total Environ. 2019, 690, 189–196. [Google Scholar] [CrossRef]
  66. Schultz, B.; Wrachien, D.D. Irrigation and drainage systems research and development in the 21st century. Irrig. Drain. 2002, 51, 311–327. [Google Scholar] [CrossRef]
  67. Tang, R.; Wang, X.; Han, X.; Yan, Y.; Huang, S.; Huang, J.; Shen, T.; Wang, Y.; Liu, J. Effects of Combined Main Ditch and Field Ditch Control Measures on Crop Yield and Drainage Discharge in the Northern Huaihe River Plain, Anhui Province, China. Agriculture 2022, 12, 1167. [Google Scholar] [CrossRef]
  68. Martinez-Vazquez, P. Crop Lodging Induced by Wind and Rain. Agric. For. Meteorol. 2016, 228, 265–275. [Google Scholar] [CrossRef]
  69. Zheng, D.; Yang, X.; Mínguez, M.I.; Mu, C.; He, Q.; Wu, X. Effect of freezing temperature and duration on winter survival and grain yield of winter wheat. Agric. For. Meteorol. 2018, 260, 1–8. [Google Scholar] [CrossRef]
  70. Hao, Z.; Geng, X.; Wang, F.; Zheng, J. Impacts of climate change on agrometeorological indices at winter wheat overwintering stage in Northern China during 2021–2050. Int. J. Climatol. 2018, 38, 5576–5588. [Google Scholar] [CrossRef]
  71. Nouri, M.; Homaee, M.; Bannayan, M.; Hoogenboom, G. Towards shifting planting date as an adaptation practice for rainfed wheat response to climate change. Agric. Water Manag. 2017, 186, 108–109. [Google Scholar] [CrossRef]
  72. Rafiullah; Khan, M.J.; Muhammad, D.; Fahad, S.; Adnan, M.; Wahid, F.; Alamri, S.; Khan, F.; Dawar, K.M.; Irshad, I.; et al. Phosphorus Nutrient Management through Synchronization of Application Methods and Rates in Wheat and Maize Crops. Plants 2020, 9, 1389. [Google Scholar] [CrossRef] [PubMed]
  73. Dong, Y.; Wei, B.; Wang, L.; Zhang, Y.; Zhang, H.; Zhang, Y. Performance of Winter-Seeded Spring Wheat in Inner Mongolia. Agronomy 2019, 9, 507. [Google Scholar] [CrossRef]
  74. Sigaroodi, S.K.; Chen, Q.; Ebrahimi, S.; Nazari, A.; Choobin, B. Long-term precipitation forecast for drought relief using atmospheric circulation factors: A study on the Maharloo Basin in Iran. Hydrol. Earth Syst. Sci. 2014, 18, 1995–2006. [Google Scholar] [CrossRef]
  75. Tian, Y.; Xu, Y.P.; Wang, G. Agricultural drought prediction using climate indices based on Support Vector Regression in Xiangjiang River basin. Sci. Total Environ. 2018, 622–623, 710–720. [Google Scholar] [CrossRef] [PubMed]
  76. Han, Y.G.; Kim, J.H.; Luo, J.J. Deep learning for multi-year ENSO forecasts. Nature 2019, 573, 568–572. [Google Scholar]
  77. Schillerberg, T.A.; Tian, D.; Miao, R. Spatiotemporal patterns of maize and winter wheat yields in the United States: Predictability and impact from climate oscillations. Agric. For. Meteorol. 2019, 275, 208–222. [Google Scholar] [CrossRef]
  78. Feng, P.; Wang, B.; Luo, J.J.; Liu, D.L.; Waters, C.; Ji, F.; Ruan, H.; Xiao, D.; Shi, L.; Yu, Q. Using large-scale climate drivers to forecast meteorological drought condition in growing season across the Australian wheatbelt. Sci. Total Environ. 2020, 724, 138162. [Google Scholar] [CrossRef] [PubMed]
  79. Iwańska, M.; Paderewski, J.; Stępień, M.; Rodrigues, P.C. Adaptation of Winter Wheat Cultivars to Different Environments: A Case Study in Poland. Agronomy 2020, 10, 632. [Google Scholar] [CrossRef]
  80. Ljubičić, N.; Popović, V.; Ćirić, V.; Kostić, M.; Ivošević, B.; Popović, D.; Pandžić, M.; El Musafah, S.; Janković, S. Multivariate Interaction Analysis of Winter Wheat Grown in Environment of Limited Soil Conditions. Plants 2021, 10, 604. [Google Scholar] [CrossRef]
  81. Allen, R.J.; Sherwood, S.C. The impact of natural versus anthropogenic aerosols on atmospheric circulation in the Community Atmosphere Model. Clim. Dynam. 2011, 36, 1959–1978. [Google Scholar] [CrossRef]
  82. Arshad, S.; Kazmi, J.H.; Prodhan, F.A.; Mohammed, S. Exploring dynamic response of agrometeorological droughts towards winter wheat yield loss risk using machine learning approach at a regional scale in Pakistan. Field Crop Res. 2023, 302, 109057. [Google Scholar] [CrossRef]
  83. Farooq, A.; Farooq, N.; Akbar, H.; Hassan, Z.U.; Gheewala, S.H. A Critical Review of Climate Change Impact at a Global Scale on Cereal Crop Production. Agronomy 2023, 13, 162. [Google Scholar] [CrossRef]
  84. Li, C.; Li, Z.Z.; Zhang, F.M.; Lu, Y.Y.; Duan, C.F.; Xu, Y. Seasonal dynamics of carbon dioxide and water fluxes in a rice-wheat rotation system in the Yangtze-Huaihe region of China. Agric. Water Manag. 2023, 275, 107992. [Google Scholar] [CrossRef]
Figure 1. Geographical location of the study region and distribution of meteorological stations.
Agronomy 14 00817 g001
Figure 2. The clustering results of AWWY in Henan.
Agronomy 14 00817 g002
Figure 3. Relationships between the climate-driven winter wheat yield (CDWWY) and the self-calibrating Palmer drought severity index (sc-PDSI) during the wheat growing season in Henan. Note: Pre- and Cur- denote the previous year and current year, respectively. A correlation coefficient value of 0.36 corresponds to the 5% significance level.
Agronomy 14 00817 g003
Figure 4. Responses of CDWWY to key meteorological drought/wetness index (KMDWI) changes in Henan. (a) Sensitivity of the yield to the KMDWI. (b) Trends of the KMDWI. (c) Impact of the KMDWI trend on yield.
Agronomy 14 00817 g004
Figure 5. Relationships between KMDWIs and atmospheric circulation indices in Henan. Note: Pre- and Cur- denote the previous year and current year, respectively. A correlation coefficient value of 0.36 corresponds to the 5% significance level.
Agronomy 14 00817 g005
Table 1. Definitions of characteristic-based indices of annual winter wheat yield (AWWY).
No.TypesIndicesDefinition
1Statistical characteristicsMINThe minimum value of the AWWY time series
2MAXThe maximum value of the AWWY time series
3AVEThe mean value of the AWWY time series
4RNGThe range value of the AWWY time series
5STDThe standard deviation of the AWWY time series
6CVThe coefficient of variation in the AWWY time series
7Time-domain characteristicsZMKThe Z statistic of the AWWY time series
8MAGThe magnitude of the AWWY time series
9HThe persistent pattern of the AWWY time series
10Frequency-domain characteristicsCIMF1The variance contribution of a short-period oscillation component to AWWY
11CIMF2The variance contribution of a medium-period oscillation component to AWWY
12CIMF3The variance contribution of a long-period oscillation component to AWWY
13CTrendThe variance contribution of a trend component to AWWY
Note: MIN, MAX, AVE, RNG, STD, CV, ZMK, MAG, H, CIMF1, CIMF2, CIMF3 and CTrend are abbreviations for the minimum value, maximum value, mean value, range value, standard deviation, coefficient of variation, Z statistic, Sen’s slope, Hurst index and variance contribution of each IMF and a trend component, respectively.
Table 2. The results of the application of the principal component analysis (PCA) method to a matrix composed of 13 characteristic-based indices of AWWY in 17 cities in Henan.
EigenvalueVariance (%)Cumulative (%)
PC16.6451.1151.11
PC23.6127.8078.90
PC31.4210.9289.83
The loadings of PC1, PC2 and PC3 on 13 indices
MINMAXAVERNGSTDCVZMK MAGHCIMF1CIMF2CIMF3Ctrend
PC10.510.510.520.140.23−0.140.930.510.86−0.90−0.57−0.840.98
PC2−0.330.590.370.960.980.850.360.920.32−0.07−0.490.080.17
PC30.820.900.980.300.35−0.320.660.460.71−0.63−0.21−0.290.60
Note: PC1, PC2 and PC3 are abbreviations for the first three principal components. MIN, MAX, AVE, RNG, STD, CV, ZMK, MAG, H, CIMF1, CIMF2, CIMF3 and CTrend are abbreviations for the minimum value, maximum value, mean value, range value, standard deviation, coefficient of variation, Z statistic, Sen’s slope, Hurst index and variance contribution of each IMF and a trend component, respectively.
Table 3. Statistical values of characteristic-based indices of AWWY for four sub-regions in Henan.
No.IndicesRegion IRegion IIRegion IIIRegion IV
1MIN (kg/hm2)1861.02554.33592.82118.3
2MAX (kg/hm2)4812.05098.17154.06855.2
3AVE (kg/hm2)3536.34023.15770.95091.3
4RNG (kg/hm2)2951.02543.83561.24736.9
5STD796.0710.11048.81416.1
6CV (%)22.517.818.327.8
7ZMK4.25.26.96.5
8MAG (kg/(hm2·a))62.263.3111.5138.1
9H0.70.80.80.8
10CIMF1 (%)26.916.82.311.2
11CIMF2 (%)5.84.42.62.6
12CIMF3 (%)3.42.41.12.5
13CTrend (%)63.976.494.083.8
Note: MIN, MAX, AVE, RNG, STD, CV, ZMK, MAG, H, CIMF1, CIMF2, CIMF3 and CTrend are abbreviations for the minimum value, maximum value, mean value, range value, standard deviation, coefficient of variation, Z statistic, Sen’s slope, Hurst index and variance contribution of each IMF and a trend component, respectively.
Table 4. Regression results between KMDWIs and selected atmospheric circulation indices in Henan.
Lag TimeRegion IRegion IIRegion IIIRegion IV
IndicesCoefficientsIndicesCoefficientsIndicesCoefficientsIndicesCoefficients
0AO−0.08AO0.02AO0.06PDO−0.45
1NAO0.19NAO0.10NAO0.35Niño 30.27
2NAO−0.30NAO−0.39NAO−0.10Niño 3−0.11
3PDO0.30PDO0.27AO0.73Niño 40.92
4PDO0.13NAO−0.11AO1.07Niño 3.4−0.62
5PDO0.08AO0.35AO0.44Niño 3−0.50
6Niño 4−0.57PDO−0.05AO0.25Niño 31.19
7Niño 1+2−0.18AO−0.05AO0.17Niño 3−0.97
8Niño 30.29NAO0.38NAO−0.04Niño 3−0.11
9Niño 3−0.53Niño 3−0.04AO0.19Niño 31.90
10AO−0.08AO−0.13NAO0.08Niño 3−0.99
11NAO−0.10Niño 3−0.14NAO−0.29Niño 30.24
Intercept27.295.16−0.02−32.42
R20.500.550.650.49
RMSE0.660.640.580.72
Note: Niño 1+2, Niño 3, Niño 3.4 and Niño 4 reflect the Niño regions, which are areas of the tropical Pacific Ocean that are used to monitor and measure the El Niño–Southern Oscillation climate pattern, and each Niño region covers a different area of the Pacific Ocean. AO, NAO and PDO are abbreviations for North Atlantic Oscillation, Arctic Oscillation and Pacific Decadal Oscillation.
Disclaimer/Publisher’s Note: The statements, opinions and data contained in all publications are solely those of the individual author(s) and contributor(s) and not of MDPI and/or the editor(s). MDPI and/or the editor(s) disclaim responsibility for any injury to people or property resulting from any ideas, methods, instructions or products referred to in the content.

