Article

Response Surface Methodology for Development of Nutrient Solution Formula for Hydroponic Lettuce Based on the Micro-Elements Fertilizer Requirements at Different Growth Stages

1
Collaborative Innovation Center of Vegetable Industry in Hebei, Baoding 071001, China
2
Key Laboratory of North China Water-Saving Irrigation Engineering, Baoding 071001, China
3
College of Horticulture, Hebei Agricultural University, Baoding 071001, China
4
Hebei Academy of Agriculture and Forestry, Shijiazhuang 050035, China
*
Author to whom correspondence should be addressed.
These authors contributed equally to this work.
Agronomy 2024, 14(6), 1160; https://doi.org/10.3390/agronomy14061160
Submission received: 23 April 2024 / Revised: 10 May 2024 / Accepted: 27 May 2024 / Published: 29 May 2024
(This article belongs to the Special Issue Advances in Data, Models, and Their Applications in Agriculture)

Abstract

:
In order to precisely obtain the impact of nutritional elements on lettuce yield and quality, in the present study, a nutrient solution formula suitable for lettuce hydroponic production was development using response surface methodology based on the determination for micro-elements in three growth stages and taking the interaction between elements into account. Then, the formula was optimized and validated, aiming for the goal of improving lettuce yield and quality. The results showed that 200 healthy lettuce leaves contained similar amounts of macro-elements, and there was no significant difference in the unit content of micro-elements among the seedling, rosette, and harvest stages. Quadratic regression models between shoot fresh weight, SPAD value, soluble sugar content, Vc content, and nutrient content were established (R2 = 0.91, 0.95, 0.98, and 0.81, respectively). The optimal concentrations of P, K, Ca, and Mg obtained by multi-objective optimization of the quadratic regression models for fresh weight, SPAD value, soluble sugar content, and Vc content were 2.71 mmol·L−1, 6.42 mmol·L−1, 5.58 mmol·L−1, and 7.11 mmol·L−1, respectively. The nutrient solution formula (T1) was found to be the optimal nutrient solution formula for improving lettuce growth and quality. Overall, we developed a specific and targeted nutrient solution formulation for lettuce; this formulation not only meets lettuce’s demand for nutrients, but also improves lettuce yield and quality, providing more choices for lettuce production in a region with high salts and high pH in the irrigation water.

1. Introduction

Compared with traditional agriculture, hydroponics has many advantages, such as improving water and nutrient use efficiency [1], eliminating secondary salinization [2], and promoting plant growth [3]. Many vegetable species are suitable for hydroponic cultivation, including lettuce [4], tomato [5], spinach [6], and basil [7]. Moreover, due to the advantages of saving water, saving fertilizer, and vegetable growth promotion, an increasing number of producers choose to use hydroponics to produce vegetables. Compared with other kinds of these hydroponic vegetables, leafy vegetables have the advantages of a short production cycle, stable product quality, and considerable economic benefits. There are many varieties of leaf vegetables suitable for hydroponics; the more common varieties are lettuce, spinach, cress, broccoli, cabbage, rape, Chinese cabbage, kale, purple sunflower, etc. Lettuce is the largest crop of hydroponic leafy vegetables [8,9]. With the improvement of people’s living standards, the demand for high-quality vegetables is also increasing. Given that leafy vegetables constitute an important source of vegetables, it is important to improve the quality of leafy vegetables grown hydroponically to meet people’s demand for high-quality leafy vegetables. In the process of hydroponic cultivation, many factors affect the yield and quality of leafy vegetables, among which the nutrient solution is the most important. Specifically, the growth and quality of leafy vegetables grown hydroponically are significantly influenced by the nutrient solution concentration [10], nutrient solution temperature [11], and nutrient composition of the solution [12]. Therefore, regulating nutrient solutions is an effective method for controlling the growth and quality of leafy vegetables in hydroponic systems.
Leafy vegetables grow faster because vegetables in a hydroponic system can absorb water and nutrients better than vegetables cultivated in soil. However, the roots of hydroponic vegetables are more sensitive to changes in nutrient composition and concentration than are the roots of vegetables cultivated in the soil due to the lack of a buffer effect in hydroponic systems [13], which leads to the growth and quality of leafy vegetables grown hydroponically being easily influenced by changes in nutrient composition and concentration. Therefore, the precise and quantitative regulation of nutrient composition is important for controlling the yield and quality of leafy vegetables grown hydroponically [14,15]. A total nitrate requirement, which was supplied only at the start of cultivation, can reduce the nitrate content of Butterhead Lettuces without reducing yield [16]. The K and N requirements of spinach’s plant growth throughout the cultivation period were higher than the requirements of other elements [17]. The yield of the basil plant and the absorption of N and K were significantly influenced by different nutrient treatments [18]. However, the current commonly used nutrient solution formulas, such as those of Hoagland [19], Yamazaki [20], and Enshi [21] as well as compound water-soluble fertilizers [22], have often been used to prepare nutrient solutions for many types of vegetables. As such, a precise quantitative nutrient supply cannot be generated according to the different nutrient requirements of different leafy vegetable varieties, which not only leads to low nutrient use efficiency, but also decreases the yield and quality of vegetables. Therefore, it is increasingly important to develop specific and targeted nutrient solution formulas according to the nutrient requirements of different leafy vegetable varieties.
Previous studies on formulas for nutrient solutions for leafy vegetables have mainly been limited to the screening of existing nutrient solution formulas [23,24]. The response surface method is a method suitable for a quantitative analysis of response values by various factors and their interactions through nonlinear fitting of multiple factors [25]. With this method, relatively few experimental treatments and more appropriate factor ranges can be quickly obtained. This method is widely used in the fields of optimization of boron fertilizer application for flue-cured tobacco [26], optimizing the calibration of design points for diesel engines [27], the optimization of bacterial cultivation [28], the optimization of osmotic dehydration of cherry tomatoes [29], and the quality retention of fresh-cut` Rocha’ pear [30]; it has also been applied to research on formulating nutrient solutions for improving the yield and quality of fruit vegetables such as cucumber [31,32] and eggplant [33]. However, these studies focused only on the contents of N, P, and K in the nutrient solution based on yield traits and did not consider Ca, Mg, or interactions between macronutrients. A nutrient solution formula represents the optimal combination of multiple macronutrients, which determines the growth, yield, and quality of leafy vegetables. Therefore, it is highly important to develop a comprehensive nutrient solution formula considering both growth and quality synchronization with the use of the response surface method.
As the main kind of leafy vegetable grown hydroponically, lettuce (Lactuca sativa L.) is rich in vitamin C (Vc), fiber, folate, iron, and other bioactive compounds that are beneficial to human health [34]. An increasing number of producers have begun to produce lettuce hydroponically, and there are some studies on the formulations of nutrient solutions designed for lettuce [12,35,36]. However, these studies only investigated the effects of different preexisting nutrient solution formulas on the growth and quality of lettuce. In the present study, lettuce was used as the experimental material, and the response surface method was used to develop the nutrient solution formula for lettuce using irrigation water typical for the region, containing high salts and with a high pH value. A validation experiment was also conducted to verify the accuracy and reliability of the nutrient solution formulas developed via the response surface method. We hypothesized that an optimal nutrient solution, which was beneficial to the yield and quality of lettuce, could be developed via the response surface method.

2. Materials and Methods

2.1. Plant Material and Plant Cultivation

This experiment was conducted in the Key Open Laboratory of Intelligent Green-house and Horticultural Product Quality and Safety Standardization Technology of Hebei Agricultural University from March 2021 to October 2022. The lettuce variety with moderate nutritional requirements, Dasusheng (Lactuca sativa L. var. Dasusehng), Vegetable Seed (Company of Chinese Academy of Agricultural Sciences, Beijing, China), was used as the experimental material. Lettuce seeds were sown in sponge blocks (2.3 × 2.3 × 2.8 cm [L, W, H], 14.8 cm3) in a growth chamber (temperature: 18 °C, humidity: 90%). The seedling cultivation solution was 1/2 Hoagland’s nutrient solution, which we prepared ourselves. The EC and pH of the nutrient solution were adjusted to 1.2 dS m−1 and 6.0 ± 0.5, respectively. After 30 days, the seedlings were transplanted into a DFT hydroponic system (20 × 20 cm) that circulated a nutrient solution enriched with O2 by an air pump was set up for lettuce cultivation. After transplanting, three experiments were conducted. Experiment 1 was to determine the nutrient contents of lettuce at each growth stage (1, 20, and 35 days after transplanting) in order to design the concentration of nutrients in Experiment 2. Lettuce plants were grown in a plant factory (15–27 °C during light and 10–15 °C during dark hours; 13 h light–11 h dark cycle). Each stage measured two hundred lettuce plants. Experiment 2 was intended to establish the element response surface equation of the nutrient solution and determine the maximum proportion of P, K, Ca, and Mg. Lettuce plants were grown in a plant factory (15–27 °C during light and 10–15 °C during dark hours; 13 h light–11 h dark cycle), and all growth and quality indices were measured 30 days after transplanting. Each treatment involved 30 plants and was repeated three times. Experiment 3 was intended to verify the reliability of the nutrient solution formula. Lettuce plants were grown in a plant factory (15–27 °C during light and 10–15 °C during dark hours; 13 h light–11 h dark cycle), and all growth and quality indexes were measured 30 days after transplanting. A total of 30 plants were measured for each treatment, and this was repeated three times. The EC and pH of the three experiments were adjusted to 1.8–2.0 dS m−1 and 6.0 ± 0.5, respectively, and the wide range of pH was due to the high pH value of irrigation water in northern China.

2.2. Measurements

2.2.1. Nutrient Contents in Lettuce Plants

As shown in Figure 1, the experimental design was divided into four parts. In accordance with the plant chemical analysis method [37], two hundred lettuce plants at each growth stage (1, 20, and 35 days after transplanting) from the station were selected for the determination of their N, P, K, Ca, and Mg contents. The sample leaves were dried and crushed, and then the contents (mg·g−1) of N, K, P, Ca, and Mg were measured. The content was multiplied by the appropriate salt concentration of the nutrient solution (37 mmol) (refer to the millimoles of each nutrient element at this salt concentration). The experiment was repeated 5 times.

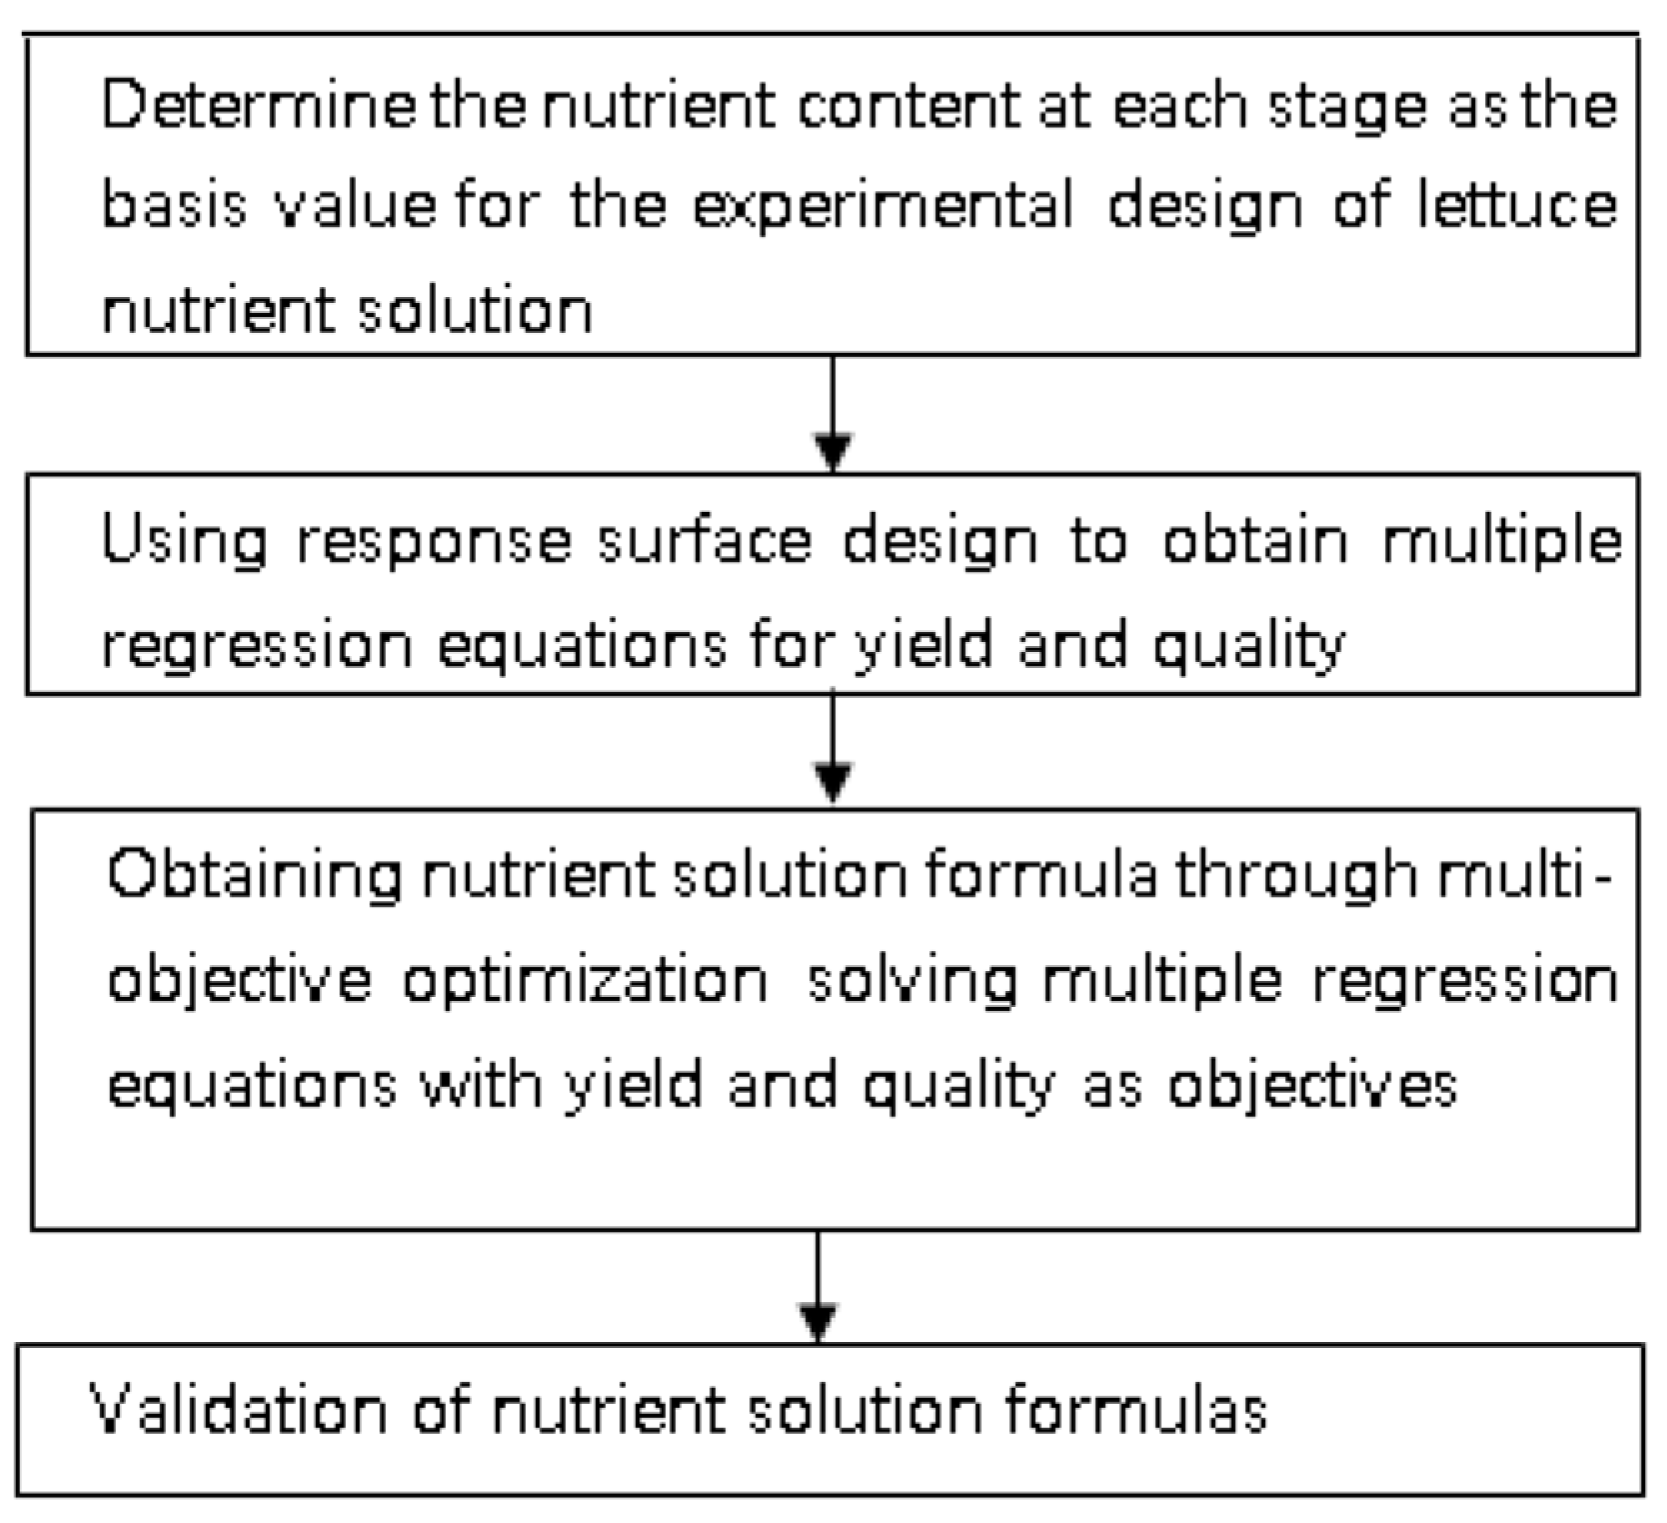
2.2.2. Nutrient Solution Response Surface Method Design

According to the nutrient concentration range obtained, four factors (P, K, Ca, and Mg) were used as test factors, and four factors and five levels (−1.682, −1, 0, 1, 1.682) (1/2) were used for the quadratic regression response surface design [29]. As shown in Table 1, the upper and lower limits and zero levels of the test were designed. There were 21 treatments in total and 5 center point tests, and the coding levels were −1.628, −1, 0, +1, and +1.628, respectively. The set concentration of N was 22 mmol·L−1, KH2PO4 was used to replace NH4H2PO4, and KCl was used to replace KNO3 in the treatment of excess N. NaNO3 was added to supplement N in the insufficient-N treatment.

2.2.3. Growth and Quality Indices under Different P, K, Ca, and Mg Concentrations and Nutrient Solution Formulas

At 30 days after transplanting, the lettuce plants were washed with distilled water and dried with filter paper, and then the shoots and roots were separated to measure the shoots’ and roots’ fresh weights. To measure the dry weights, the shoots and roots of the lettuce plants were oven-dried at 80 °C until a constant weight was obtained. The digestion method and hydrochloric acid extraction method were used to determine the contents of macronutrients in the lettuce leaves [38]. The contents of chlorophyll and carotenoids in the lettuce plants were determined through ethanol acetone extraction [37]. Anthrone colorimetry and the salicylic acid method were used to determine the soluble sugar content and nitrate content in the lettuce plants. The protein content in the lettuce plants was determined via Coomassie Brilliant Blue G-250 staining, and the content of free amino acids in the lettuce plants was determined by the use of ninhydrin reagent. The 2,6-dichlorophenol indophenol titration method was used to determine the Vc content in the lettuce plants [39]. SPAD was determined by a chlorophyll meter (SPAD-502, Konica Minolta Holdings, Inc., Tokyo, Japan).
To further verify the accuracy of different nutrient solution formulas, the two optimal nutrient solution formulas (T1, T2), three intermediate nutrient solution formulas (T3, T4, T5), and the two worst nutrient solution formulas (T6, T7) were selected to treat the lettuce plants. Hoagland’s formula was used as a control (CK). The growth and quality indices were also measured.

2.2.4. Establishment of the Regression Equation for Shoot Fresh Weight and Quality Indexes

Taking the shoot fresh weight and quality of lettuce as the objective function, we established quadratic regression mathematical models for P, K, Ca, and Mg, as shown in Formula (1).
Y k = a 0 + j = 1 4 a j x j + i < j a i j x i x j + j 4 a j j x j 2  
In Formula (1), Y k is the objective function of a lettuce plant; k is equal to 1, 2, 3, or 4; a 0 is the function constant term; a j is the primary term coefficient of the nutrient; aij is the interaction term coefficient of the nutrient; ajj is the secondary term coefficient of the nutrient; xj is the nutrient content; and j is equal to 1, 2, 3, or 4.

2.2.5. Multiobjective Optimization of the Nutrient Solution Formulas

The multiple quadratic regression equations of the fresh weight and quality indicators of lettuce as dependent variables were constructed. Based on the maximum fresh weight and the maximum quality indicator of lettuce plants as the multiobjective optimization, those regression equations were solved using Design Expert 8.0 software (Version 10, Stat-Ease Inc., Minneapolis, MN, USA) to obtain the optimal nutrient solution formula.

2.3. Data Analysis and Statistics

Design Expert 8.0 was used to establish quadratic regression mathematical models and conduct multiobjective optimization analysis. Excel 2016 was used to process the data. SPSS 22.0 software was used for analysis of variance (p < 0.05, Duncan’s test). There were 5 replicates for each treatment.

3. Results

3.1. Nutrient Content in Leaves of Lettuce Plants at Different Growth Stages

As shown in Table 2, the difference in the nutrient content in leaves of lettuce at different growth stages was not significant. Moreover, the content of K in the lettuce leaves was the highest, followed by those of N, Ca, Mg, and P. The average nutrient content at the three stages was taken as the basic nutrient content in this study. The reference contents of N, P, K, Ca, and Mg suitable for lettuce growth were 22.88 mmol·L−1, 1.97 mmol·L−1, 7.98 mmol·L−1, 5.49 mmol·L−1, and 5.03 mmol·L−1, respectively.

3.2. Shoot Fresh Weight, SPAD Value, Soluble Sugar Content, and Vc and Nitrate Content in the Lettuce at Different Nutrient Concentrations

The nutrient concentrations under different codes were designed using the response surface method, with reference to the coding levels in Table 3. The nutrient concentrations under coding level 0 were determined according to the actual measured nutrient concentrations in the lettuce plants, where the contents of P, K, Ca, and Mg were 2.00 mmol·L−1, 8.00 mmol·L−1, 5.50 mmol·L−1, and 5.00 mmol·L−1, respectively. As shown in Table 4, the fresh weight, SPAD value, soluble sugar content, Vc content, and nitrate content in the lettuce plants varied greatly under the different nutrient concentration combinations, and the content of the same nutrient also varied greatly under different coding levels. The fresh weight ranged from 78.10 g to 286.00 g, the SPAD values ranged from 28.10 to 36.55, the soluble sugar content ranged from 1.38 mg·g−1 to 3.67 mg·g−1, the Vc content ranged from 4.23 mg·100 g−1 to 8.31 mg·100 g−1, and the nitrate content ranged from 1.56 mg·g−1 to 5.51 mg·g−1.

3.3. Quadratic Regression Models between Shoot Fresh Weight, SPAD Value, Soluble Sugar Content, Vc Content and Nutrient Content

As shown in Table 5, the shoot fresh weight, SPAD value, soluble sugar content, and Vc content of lettuce had good correlations with the concentrations of P, K, Ca, and Mg. The R2 values of the four quadric models were 0.91, 0.95, 0.98, and 0.81, which indicated that the correlations between the nutrients and shoot fresh weight, SPAD value, soluble sugar content, and Vc content were significant; moreover, the p values of the four quadric models were less than 0.05. According to the regression coefficient of the equation in Table 5, the order of the influence of the four nutrients on the fresh weight was Ca > Mg > P > K; the SPAD values, K > Ca > P > Mg; the soluble sugar content, P > K > Mg > Ca; and the Vc content, Ca > P > Mg > K.

3.4. Optimization of Nutrient Concentrations for the Shoot Fresh Weight, SPAD Value, Soluble Sugar Content and Vc Content in Lettuce

As shown in Table 6, the concentrations of P, K, Ca, and Mg were 2.71 mmol·L−1, 6.42 mmol·L−1, 5.58 mmol·L−1, and 7.11 mmol·L−1, respectively. The shoot fresh weight (246.15 g), SPAD value (31.96), soluble sugar content (3.42 mg·g−1), and Vc content (6.84 mg·100 g−1) of the lettuce were maximized. The model fitting consensus value was 0.851.

3.5. The Seven Selected Nutrient Solution Formulas for the Validation Experiment

As shown in Table 7, to ensure the reliability and accuracy of the nutrient solution formulas, the two optimal nutrient solution formulas (T1, T2), three intermediate nutrient solution formulas (T3, T4, T5), and the two worst nutrient solution formulas (T6, T7) obtained via the response surface method were selected to treat the lettuce plants. The Hoagland solution formula was used as a CK.

3.6. Validation of Nutrient Solution Formulas

3.6.1. Effects of Different Formulations of Nutrient Solutions on the Growth Parameters of Lettuce

As shown in Table 8, the shoot fresh and dry weights were significantly higher under T1 and T2 than under CK. Compared with those under CK, the shoot fresh weights under T1 and T2 increased by 40.67% and 31.09%, respectively, and the shoot dry weights increased by 43.52% and 36.37%, respectively. However, there was no significant difference in shoot fresh and dry weight in the plants among the T3, T4, T5, and CK treatments. The shoot fresh and dry weights were significantly lower under T6 and T7 than under CK.

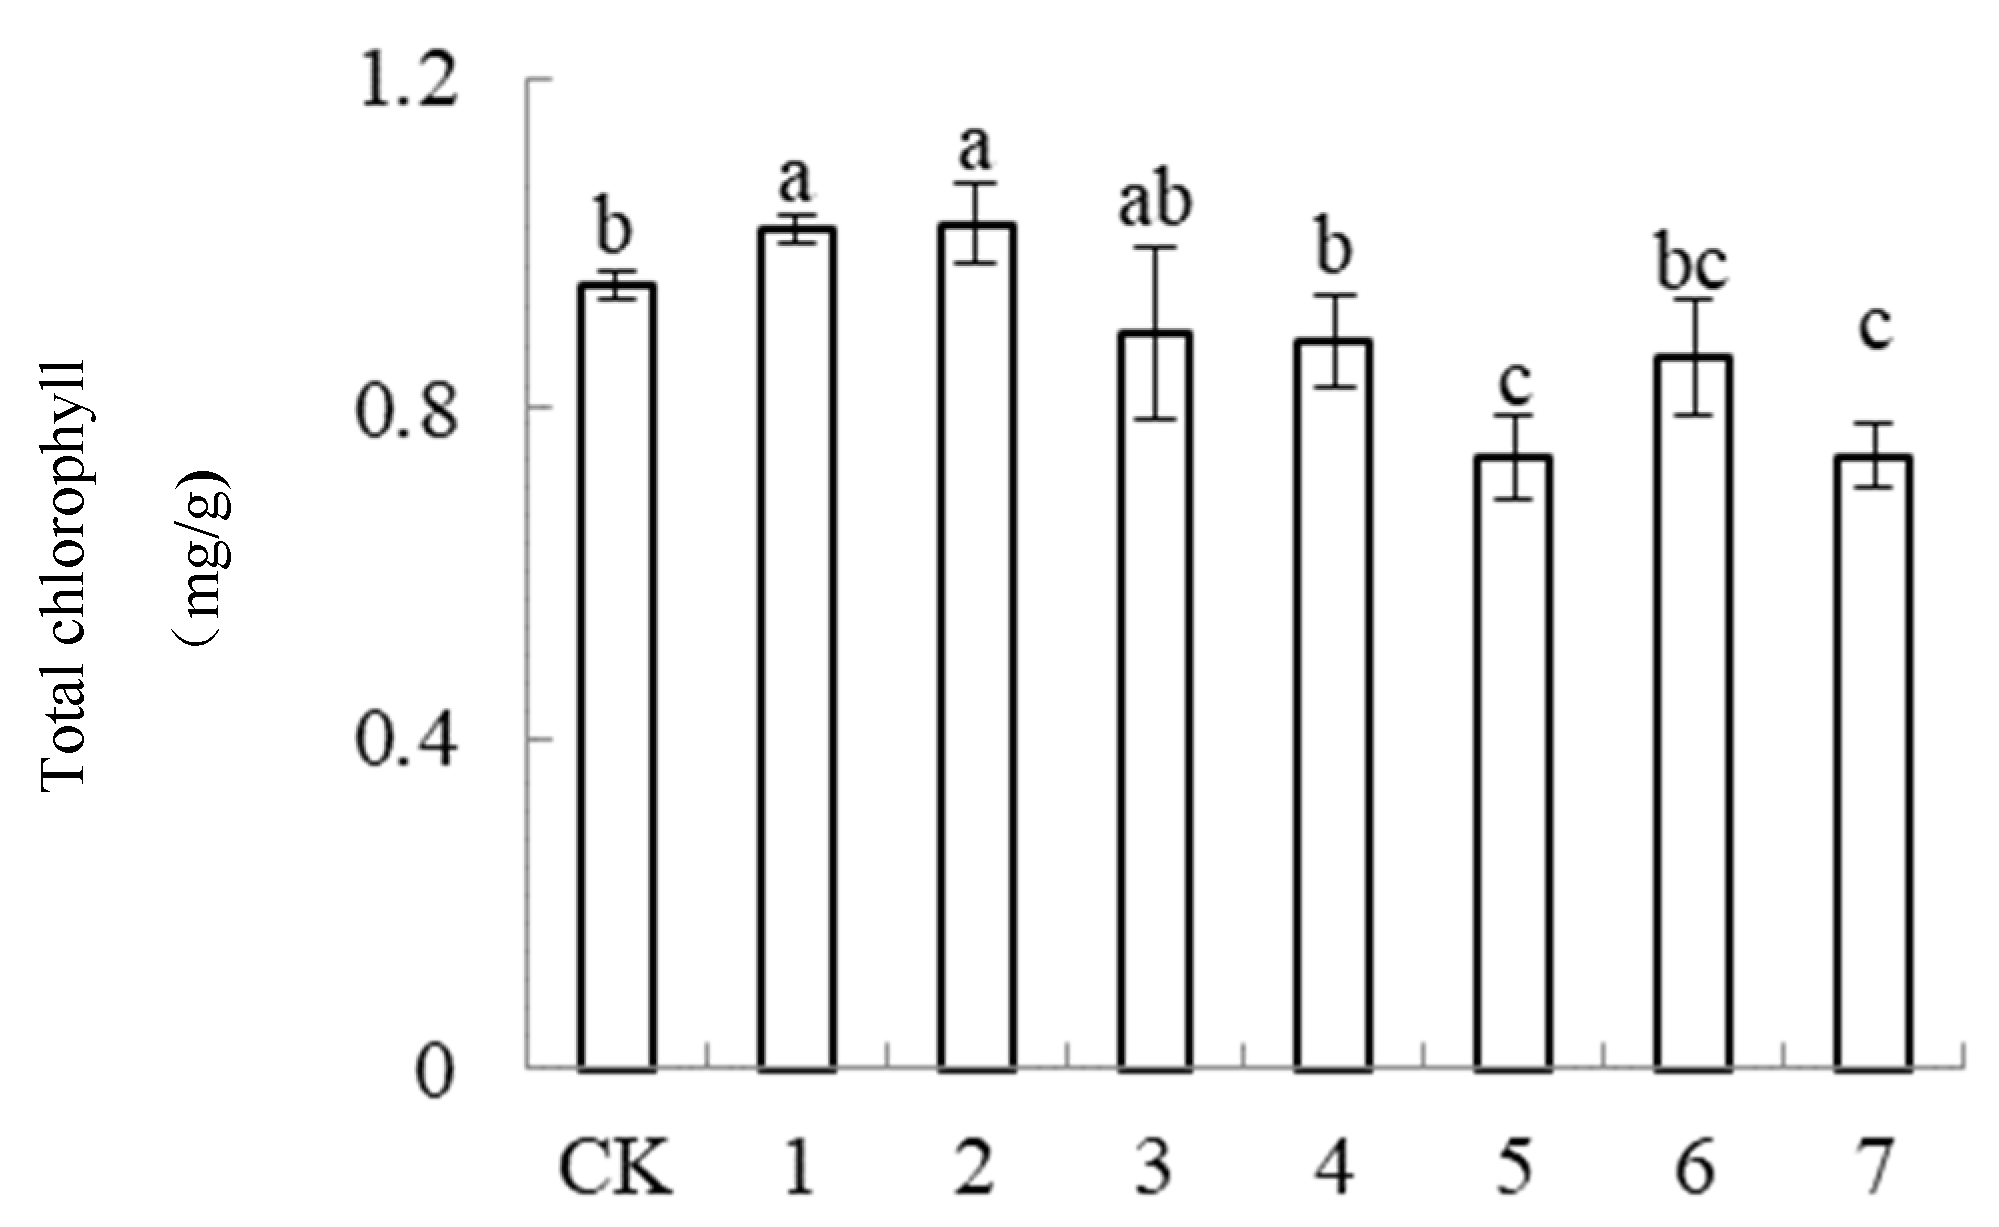
3.6.2. Effects of Different Formulations of Nutrient Solutions on the Chlorophyll Content in the Lettuce

As shown in Figure 2, the total chlorophyll content in the lettuce plants was significantly higher under T1 and T2 than under CK; the total chlorophyll contents increased by 10.5% and 7.4%, respectively, compared with that under CK. There was no significant difference in total chlorophyll content in the plants among the T3, T4, T6, and CK treatments. However, the total chlorophyll content was significantly lower under T5 and T7 than under CK.

3.6.3. Effects of Different Formulations of Nutrient Solutions on the Quality Parameters of Lettuce

As shown in Table 9, the soluble sugar content and soluble protein content were significantly higher under T1 than under CK; compared with those under CK, the soluble sugar content and soluble protein under T1 increased by 16% and 39%, respectively. Additionally, the soluble protein content was significantly higher under T2 than under CK. However, there was no significant difference in soluble sugar content or Vc content in the plants between the T2 and CK treatments. The Vc content was significantly higher under T4 than under CK, and the nitrate contents in the lettuce plants were significantly lower under T1, T2, T3, and T4 than under CK. Compared with that under CK, the nitrate contents under T1, T2, T3, and T4 decreased by 30%, 55%, 17% and 11%, respectively.

3.6.4. Effects of Different Formulations of Nutrient Solutions on the Amino Acid Content in Lettuce

As shown in Table 10, different formulations of nutrient solutions had significant impacts on the amino acid content in the lettuce plants. The total amino acid contents were significantly higher under T1 than under the other treatments.

4. Discussion

4.1. Plant Chemical Analysis Method

Many previous studies on the formulation screening of hydroponic nutrient solutions of lettuce have mainly compared and selected existing formulations [12,36] which were greatly influenced by the original formula, making it difficult to develop precise nutrient solution formulas. The content of elements in the nutrient solution formula is closely related to the content of elements in lettuce. This study adopted the element analysis method and took the nutrient content of lettuce at different growth stages as a fundamental value for the development of nutrient solutions (Table 2). It could provide a reliable basis for setting the range of nutrient element concentrations in the subsequent research. Also, we adjusted the nutrient solution concentration above that generally required for lettuce to accommodate regions where water quality is a problem, and for this purpose, we selected a lettuce variety with moderate nutritional requirements as the experimental material. Different lettuce varieties had significant differences in salt adaptability [40], and the concentration of the nutrient solution was made according to the lettuce variety.

4.2. Nutrient Solution Response Surface Method Design

The commonly studied method of nutrient solution concentration was an orthogonal experiment [17,25], which could only obtain the local optimal concentration, and it was difficult to obtain a concentration interaction relationship between nutrients. More and more new methods, such as the response surface method [32], big data analysis [41], and machine learning-based intelligent systems [42], have been applied to precision crop production. On the basis of setting a relatively broad concentration gradient, the response surface method could comprehensively reveal the relationships between factors and the optimal concentration results of the nutrient solution by constructing a multiple regression equation for the concentration of the nutrient solution with multiple factors. This study set the concentration ranges of P, K, Ca, and Mg with four factors and five gradients (Table 3) based on the nutrient contents of the lettuce as the reference values, and we obtained the multi factor regression equations for lettuce fresh weight and Vc (Table 5). This method obtained nutrient interaction information and the order of the influence. In the future, this method can be used to study the concentration of trace elements in nutrient solutions in order to obtain more accurate nutrient solution formulations.

4.3. Multiobjective Optimization of the Nutrient Solution Formulas

Many previous studies have mainly focused on the influence of nutrient solution formulation on yield and paid less attention to other quality indicators of lettuce [39,43]. In this study, quadratic regression models (Table 5) of four factors (P, K, Ca, Mg) of the yield and quality indices (SPAD, soluble sugar content, Vc content) of lettuce were established using the response surface method. The output and quality indicators were taken as objective functions, and the optimal formula of lettuce nutrient solution was obtained by a multiobjective optimization method. This method made up for the limitation in the screening process of the original nutrient solution and was more beneficial to the improvement in the yield and quality of lettuce.

4.4. Nutrient Contents in Different Formulations of Nutrient Solutions for Lettuce

To further verify the accuracy and reliability of the nutrient solution formulations obtained via the response surface method, we selected seven nutrient solution formulations with desired values of 0.851, 0.823, 0.769, 0.755, 0.712, 0.554, and 0.501 to study their effects on the growth and quality of lettuce in a validation experiment (Table 7). The results of the verification test showed that the prediction of the model was highly correct. The nutrient solution formulation (T1) with the highest desired value not only was beneficial to the growth of lettuce (Table 8), but was also able to promote the accumulation of chlorophyll (Figure 1), soluble sugars, soluble proteins, and amino acids (Table 9).
The higher Ca concentration and Mg concentration in T1 formula could better improve the yield and quality of lettuce, which was consistent with the law shown by the correlation coefficients of each nutrient element on the response surface. The Ca content under T1 (5.6 mmol·L−1) was more conducive to improving the growth of lettuce than the Ca content under CK (4.0 mmol·L−1) was. The dry weight of lettuce increased with increasing Ca concentration (from 1.3–5.0 mmol·L−1) [44]. Mg plays an important role in many biochemical processes of plants, such as chlorophyll synthesis, photosynthetic carbon fixation, and protein and nucleic acid synthesis [45,46]. The Mg content in the T1 treatment (7.1 mmol·L−1) is better for the growth of lettuce than the Mg content in the CK treatment (2.0 mmol·L−1).

5. Conclusions

In the present study, the response surface method was used to formulate nutrient solutions for lettuce. Moreover, the optimal nutrient solution formula (T1) for the shoot fresh weight, SPAD value, soluble sugar content, and Vc content in lettuce was determined using the response surface method. The concentrations of P, K, Ca, and Mg under T1 were 2.71 mmol·L−1, 6.42 mmol·L−1, 5.58 mmol·L−1, and 7.11 mmol·L−1, respectively. To further verify whether T1 was the best nutrient solution formula for the yield and quality of lettuce, we selected seven nutrient solution formulations to conduct a validation experiment. The results showed that the shoot fresh weight and the chlorophyll, soluble sugar, soluble protein, and amino acid contents were higher under T1 than under any other nutrient solution formulation, which showed that T1 was the optimal nutrient solution formulation for lettuce yield and quality. The results of this study provide lettuce producers with a nutrient solution formulation that is conducive to improving the yield and quality of lettuce.

Author Contributions

Experiments and editing of the manuscript, B.G.; writing of the manuscript, H.G.; methods and experiments, X.R.; data analysis, W.H.; supervision of the experimental design, J.L.; supervision of the experimental design, S.H.; collection of the literature, K.Y.; experimental design, X.W. All authors have read and agreed to the published version of the manuscript.

Funding

This research was funded by the Key Research and Develop Program of Hebei (21326903D, 22327214D), Hebei Facility vegetables Innovation Team of Modern Agroindustry Technology (HBCT2023100211).

Data Availability Statement

Data are contained within the article.

Conflicts of Interest

The authors declare no conflicts of interest. The authors declare that they have no known competing financial interests or personal relationships that could have appeared to influence the work reported in this paper.

References

  1. Richa, A.; Touil, S.; Fizir, M.; Martinez, V. Recent advances and perspectives in the treatment of hydroponic wastewater: A review. Rev. Environ. Sci. Biotechnol. 2020, 19, 945–966. [Google Scholar] [CrossRef]
  2. Sun, J.; Li, Q.S.; Yue, D. Research status and application prospects of soilless culture technology in the world. J. Nanjing Agric. Univ. 2022, 45, 898–915. [Google Scholar]
  3. Majid, M.; Khan, J.N.; Shah, Q.A.; Masoodi, K.Z.; Afroza, B.; Parvaze, S. Evaluation of hydroponic systems for the cultivation of Lettuce (Lactuca sativa L. var. Longifolia) and comparison with protected soil-based cultivation. Agric. Water Manag. 2021, 245, 106572. [Google Scholar] [CrossRef]
  4. Keller, R.; Perin, K.; Souza, W.G.; Cruz, L.S.; Goncalves, R.F. Use of polishing pond effluents to cultivate lettuce (Lactuca sativa) in a hydroponic system. Water Sci. Technol. 2008, 58, 2051–2057. [Google Scholar] [CrossRef]
  5. Short, T.H.; El-Attal, A.; Keener, H.M.; Fynn, R.P. A decision model for hydroponic greenhouse tomato production. Acta Hortic. 1998, 456, 493–504. [Google Scholar] [CrossRef]
  6. Ikeuraa, H.; Tsukadab, K.; Tamaki, M. Effect of microbubbles in deep flow hydroponic culture on spinach growth. J. Plant Nutr. 2017, 40, 2358–2364. [Google Scholar] [CrossRef]
  7. Ren, X.W.; Lu, N.; Xu, W.S.; Zhuang, Y.F.; Takagaki, M. Optimization of the Yield, Total Phenolic Content, and Antioxidant Capacity of Basil by Controlling the Electrical Conductivity of the Nutrient Solution. Horticulturae 2022, 8, 216. [Google Scholar] [CrossRef]
  8. Song, J.; Huang, H.; Hao, Y.; Song, S.; Zhang, Y.; Su, W.; Liu, H. Nutritional quality, mineral and antioxidant content in lettuce affected by interaction of light intensity and nutrient solution concentration. Sci. Rep. 2020, 10, 2796. [Google Scholar] [CrossRef] [PubMed]
  9. Sharma, N.; Acharya, S.; Kumar, K.; Singh, N. Hydroponics as an advanced technique for vegetable production: An overview. J. Soil Water Conserv. 2019, 17, 364–371. [Google Scholar] [CrossRef]
  10. Gillespie, D.P.; Papio, G.; Kubota, C. High nutrient concentrations of hydroponic solution can improve growth and nutrient uptake of spinach (Spinacia oleracea L.) grown in acidic nutrient solution. Hortscience 2021, 56, 687–694. [Google Scholar] [CrossRef]
  11. Cortella, G.; Saro, O.; Angelis, A.D.; Ceccotti, L.; Tomasi, N.; Costa, L.D. Temperature control of nutrient solution in floating system cultivation. Appl. Therm. Eng. 2014, 73, 1055–1065. [Google Scholar] [CrossRef]
  12. Frasetya, B.; Taofik, A.; Sholehah, M. The evaluation of various nutrient formulation on the growth of lettuce (Lactuca sativa Var. Arista) in hydroponic raft system at tropic region. J. Phys. Conf. Ser. 2019, 1402, 033025. [Google Scholar] [CrossRef]
  13. Xiao, S.; Liu, L.T.; Zhang, Y.J. Review on new methods of in situ observation of plant micro-roots and interpretation of root images. J. Plant Nutr. Fertil. 2020, 26, 370–385. [Google Scholar]
  14. Guo, J.T.; Dong, L.D.; Jiao, Y.G. Optimum Formula of Hydroponic Nutrient Solution for Low Nitrate Leaf Vegetables. J. Agric. 2017, 7, 28–32. [Google Scholar]
  15. Liu, C.W.; Sung, Y.; Chen, B.C.; Lai, H.Y. Effects of Nitrogen Fertilizers on the Growth and Nitrate Content of Lettuce (Lactuca sativa L.). Int. J. Environ. Res. Public Health 2014, 11, 4427–4444. [Google Scholar] [CrossRef] [PubMed]
  16. Yuki, S.; Airi, S. Quantitative nutrient management reduces nitrate accumulation in hydroponic butterhead lettuces grown under artificial lighting. Hortsci. A Publ. Am. Soc. Hortic. Sci. 2018, 53, 963–967. [Google Scholar] [CrossRef]
  17. Maneejantra, N.; Tsukagoshi, S.; Lu, N. A quantitative analysis of nutrient requirements for hydroponic spinach (Spinacia Oleracea L.) production under artificial light in a plant factory. J. Fertil. Pestic. 2016, 7, 170. [Google Scholar] [CrossRef]
  18. Ren, X.W.; Lu, N.; Xu, W.S.; Zhuang, Y.F.; Tsukagoshi, S.; Takagaki, M. Growth and Nutrient Utilization in Basil Plant as Affected by Applied Nutrient Quantity in Nutrient Solution and Light Spectrum. Biology 2022, 11, 991. [Google Scholar] [CrossRef] [PubMed]
  19. Yang, P.; Guo, Y.Z.; Qiu, L. Effects of ozone-treated domestic sludge on hydroponic lettuce growth and nutrition. J. Integr. Agric. 2018, 17, 593–602. [Google Scholar] [CrossRef]
  20. Qu, M.S.; Dong, H.Q.; Xing, W.X.; Guo, N.; Chen, B.H.; Ji, W. Effects of Adjustment of Yamazaki Lettuce Nutrient Solution Formula on Yield and Quality of Lettuce. J. Hebei Agric. Sci. 2012, 16, 31–35. [Google Scholar]
  21. Weerakkody, W.A.P.; Wakui, K.; Nukaya, A. Plant nutrient uptake in recirculation culture of tomato under growth stage based electrical conductivity adjustments. J. Natl. Sci. Found. Sri Lanka 2011, 39, 139–147. [Google Scholar] [CrossRef]
  22. Kagohashi, S.; Kano, H.; Kageyama, M. Effects of controlling the nutrient uptake on the plant growth and the fruit qualities of muskmelons cultivated in autumn and spring. J. Jpn. Soc. Hortic. Sci. 2007, 50, 306–316. [Google Scholar] [CrossRef]
  23. Kuronuma, T.; Ando, M.; Watanabe, H. Tipburn Incidence and Ca Acquisition and Distribution in Lisianthus (Eustoma grandiflorum (Raf.) Shinn.) Cultivars under Di_erent Ca Concentrations in Nutrient Solution. Agronomy 2020, 10, 216. [Google Scholar] [CrossRef]
  24. Stefanelli, D.; Brady, S.; Winkler, S.; Jones, R.B. Lettuce (Lactuca sativa L.) growth and quality response to applied nitrogen under hydroponic conditions. Acta Hortic. 2012, 927, 353–360. [Google Scholar] [CrossRef]
  25. Monforte, A.R.; Oliveira, C.; Martins SIFSFerreira, A.C.S. Response surface methodology: A tool to minimize aldehydes formation and oxygen consumption in wine model system. Food Chem. 2019, 283, 559–565. [Google Scholar] [CrossRef] [PubMed]
  26. Chen, X.J.; Zhang, Y.H.; Guo, S.P. Optimization of boron fertilizer application method using response surface design model for high-quality upper leaves of flue-cured tobacco. J. Plant Nutr. 2022, 28, 366–374. [Google Scholar]
  27. Wang, J.; Shen, L.Z.; Yang, Y.Z. Optimizing calibration of design points for non-road high pressure common rail diesel engine base on response surface methodology. Trans. Chin. Soc. Agric. Eng. 2017, 33, 31–39. [Google Scholar]
  28. Jokić, A.; Pajčin, I.; Lukić, N.; Vlajkov, V.; Kiralj, A.; Dmitrović, S.; Grahovac, J. Modeling and optimization of gas sparging-assisted bacterial cultivation broth microfiltration by response surface methodology and genetic algorithm. Membranes 2021, 11, 681. [Google Scholar] [CrossRef]
  29. Derossi, A.; Severini, C.; Mastro, A.D.; Pilli, T.D. Study and optimization of osmotic dehydration of cherry tomatoes in complex solution by response surface methodology and desirability approach. LWT—Food Sci. Technol. 2015, 60, 641–648. [Google Scholar] [CrossRef]
  30. Abreu, M.; Beiro-Da-Costa, S.; Gonalves, E.M.; Beiro-Da-Costa, M.L.; Moldo-Martins, M. Use of mild heat pre-treatments for quality retention of fresh-cut ‘Rocha’ pear. Postharvest Biol. Technol. 2003, 30, 153–160. [Google Scholar] [CrossRef]
  31. Song, X.X.; Shu, S.; Guo, S.R. Optimization of nutrient solution formula applied in cucumber cultivation with substrate. J. Nanjing Agric. Univ. 2015, 38, 197–204. [Google Scholar]
  32. Qu, F.; Zhang, J.; Wang, J.Z. Genetic algorithm-based optimization of nutrient solution formula for substrate-cultivated cucumber. Trans. Chin. Soc. Agric. Eng. 2021, 37, 96–104. [Google Scholar] [CrossRef]
  33. Ma, S.; Chen, Z.; Yang, F.J. Optimizing fertilization scheme of N,P2O5 and K2O concentration for eggplant under soilless culture. Chin. J. Appl. Ecol. 2018, 29, 2935–2942. [Google Scholar]
  34. Ruangraka, E.; Khummueng, W. Effects of artificial light sources on accumulation of phytochemical contents in hydroponic lettuce. J. Hortic. Sci. Biotechnol. Trust. 2018, 94, 378–388. [Google Scholar] [CrossRef]
  35. Eshkabilov, S.; Stenger, J.; Knutson, E.N.; Küçüktopcu, E. Hyperspectraln Image Data and Waveband Indexing Methods to Estimate Nutrient Concentration on Lettuce (Lactuca sativa L.) Cultivars. Sensors 2022, 22, 8158. [Google Scholar] [CrossRef] [PubMed]
  36. Ezziddine, M.; Liltved, H.; Seljåsen, R. Hydroponic Lettuce Cultivation Using Organic Nutrient Solution from Aerobic Digested Aquacultural Sludge. Agronomy 2021, 11, 1484. [Google Scholar] [CrossRef]
  37. Hoagland, D.R.; Arnon, D.I. The Water-Culture Method for Growing Plants without Soil. In Circular; California Agricultural Experiment Station: Davis, CA, USA, 2018. [Google Scholar]
  38. Pohl, P.; Stecka, H.; Greda, K.; Jamroz, P. Determination of the hydrophobic fraction of Ca, Fe, mg and Zn in dark color honeys using solid phase extraction and flame atomic absorption spectrometry. J. Braz. Chem. Soc. 2012, 23, 1098–1103. [Google Scholar] [CrossRef]
  39. Lee, J.G.; Lee, B.Y.; Lee, H.J. Accumulation of phytotoxic organic acids in reused nutrient solution during hydroponic cultivation of lettuce (Lactuca sativa L.). Sci. Hortic. 2006, 110, 119–128. [Google Scholar] [CrossRef]
  40. Moraes, V.H.; Giongo, P.R.; Giongo, A.M.M.; Cavalcante, T.J.; Arantes, B.H.T. Electrical conductivity in nutritive solution and influence on hydroponic production in lettuce culture (Lactuta sativa L.). Aust. J. Basic Appl. Sci. 2018, 12, 32–35. [Google Scholar]
  41. Li, S.; Cui, T.J.; Viriyasitavat, W. Edge Device Fault Probability Based Intelligent Calculations for Fault Probability of Smart Systems. Tsinghua Sci. Technol. 2024, 29, 1023–1036. [Google Scholar] [CrossRef]
  42. Shailendra, R.; Jayapalan, A.; Velayutham, S.; Baladhandapani, A.; Srivastava, A.; Gupta, S.K.; Kumar, M. An IoT and machine learning based intelligent system for the classification of therapeutic plants. Neural Process. Lett. 2022, 54, 4465–4493. [Google Scholar] [CrossRef]
  43. Yang, S.Y.; Lin, W.Y.; Hsiao, Y.M.; Chiou, T.J. Milestones in understanding transport, sensing, and signaling of the plant nutrient phosphorus. Plant Cell 2024, 36, 1504–1523. [Google Scholar] [CrossRef] [PubMed]
  44. Neeser, C.; Savidov, N.; Driedger, D. Production of hydroponically grown calcium fortified lettuce. Acta Hortic. 2007, 744, 317–322. [Google Scholar] [CrossRef]
  45. Meagy, M.J.; Eaton, T.E.; Barker, A.V. Nutrient density in lettuce cultivars grown with organic or conventional fertilization with elevated calcium concentrations. Hortsci. A Publ. Am. Soc. Hortic. Sci. 2013, 48, 670–680. [Google Scholar] [CrossRef]
  46. Jezek, M.; Geilfus, C.M.; Bayer, A.; Muhling, K.H. Photosynthetic capacity, nutrient status, and growth of maize (Zea mays L.) upon MgSO4 leaf application. Front. Plant. Sci. 2015, 5, 781. [Google Scholar] [CrossRef]
Figure 1. Experimental method flowchart.
Agronomy 14 01160 g001
Figure 2. Effects of different treatments on total chlorophyll in lettuce plant. T1, T2, T3, T4, T5, T6, and T7 represent seven different formulations of nutrient solutions. The CK is the Hoagland solution. The different lowercase letters represent significant differences among the different treatments based on Duncan’s new multiple range test at p < 0.05 (n = 5).
Agronomy 14 01160 g002
Table 1. The four-factor, five-level experiment design of different treatments on lettuce.
TreatmentVariable Values
X1(P)X2(K)X3(Ca)X4(Mg)
CK
1

+1

+1

+1

+1
1+1+1+1+1
2+1+1−1+1
3+1−1+1−1
4+1−1−1−1
5−1+1+1−1
6−1+1−1−1
7−1−1+1+1
8−1−1−1+1
9−1.682000
10+1.682000
110−1.68200
120+1.68200
1300−1.6820
1400+1.6820
15000−1.682
16000+1.682
170000
180000
190000
200000
210000
—: The value was not designed. The default value was used.
Table 2. The contents of N, P, K, Ca, and Mg in lettuce leaves at different growth stages.
Growth StageNutrients
N
(mg·g−1 DW)
P
(mg·g−1 DW)
K
(mg·g−1 DW)
Ca
(mg·g−1 DW)
Mg
(mg·g−1 DW)
30 days21.05 ± 4.784.67 ± 0.3136.33 ± 1.1512.94 ± 0.818.76 ± 0.83
50 days22.56 ± 3.454.06 ± 0.0331.88 ± 0.7513.37 ± 1.109.81 ± 0.45
65 days22.37 ± 5.904.78 ± 0.1335.53 ± 0.2514.32 ± 1.029.69 ± 0.23
Average21.994.5034.5813.549.42
Table 3. Level of variables in the experimental design.
VariationUnitCoding Level
−1.628−10+1+1.628
Nmmol·L−122.0022.0022.0022.0022.00
P0.651.202.002.803.35
K5.316.408.009.6010.69
Ca3.654.405.506.607.35
Mg1.472.905.007.108.53
Table 4. The yield and quality indices of lettuce under different treatments.
TreatmentsNutrient Concentration
(mmol·L−1)
Shoot Fresh Weight (g·Plant−1)SPADSoluble Sugar (mg·g−1)Vc (mg·100 g−1)Nitrate (mg·g−1)
NPKCaMg
CK16.002.006.004.001.00181.2633.451.746.4210.41
122.002.809.606.607.10134.7532.421.385.326.36
222.002.809.604.407.10201.8533.212.366.624.32
322.002.806.406.602.90134.7535.652.898.315.98
422.002.806.404.402.90117.1527.072.565.2212.13
522.001.209.606.602.90132.5536.443.674.234.79
622.001.209.604.402.90183.1526.651.978.038.25
722.001.206.406.607.10145.7529.441.905.0214.51
822.001.206.404.407.10286.0036.553.356.125.96
922.000.658.005.505.0078.1030.672.105.624.89
1022.003.358.005.505.00149.6231.673.487.246.79
1122.002.005.315.505.00121.0029.882.365.598.25
1222.002.0010.695.505.00159.5034.522.164.844.63
1322.002.008.003.655.00116.0529.831.717.887.16
1422.002.008.007.355.0088.0029.811.844.425.63
1522.002.008.005.501.47211.7530.311.574.924.63
1622.002.008.005.508.53145.9728.731.776.016.74
1722.002.008.005.505.00225.5028.331.385.388.59
1822.002.008.005.505.00200.2028.541.445.228.56
1922.002.008.005.505.00215.6028.101.674.448.58
2022.002.008.005.505.00195.8028.331.516.238.77
2122.002.008.005.505.00191.4028.211.576.238.61
Table 5. The response surface quadratic model between the nutrients and yield, quality indices of lettuce.
Objective FunctionEquationR2F Valuep Value
Shoot fresh weightY1 = 227.48 + 19.23 × 1 − 15.27 × 2 + 32.10 × 3 + 28.03 × 4 − 10.00 × 1×2 − 48.42 × 1×3 + 12.61 × 1×4 − 32.83 × 2×3 − 33.47 × 2×4 − 33.47 × 12 − 15.17 × 22 − 10.10 × 32 + 4.85 × 420.913.920.039
SPADY2 = 28.11 + 0.04 × 1 + 1.38 × 2 + 0.50 × 3 − 0.03 × 4 + 0.6887 × 1×3 − 1.33 × 1×4 + 0.89 × 2×3 − 2.83 × 3×4 + 1.22 × 12 + 1.60 × 22 + 0.76 × 32 + 0.65 × 420.9513.870.0005
Soluble sugarY3 = 1.49 + 0.41 × 1 − 0.06 × 2 − 0.01 × 3 + 0.06 × 4 − 0.32 × 1×2 − 0.11 × 1×3 − 0.10 × 1×4 + 0.23 × 2×3 − 0.62 × 2×4 + 0.48 × 12 + 0.29 × 22 + 0.12 × 32 + 0.08 × 420.9833.990.0002
VcY4 = 5.85 + 0.48 × 1 − 0.22 × 2 − 0.65 × 3 + 0.32 × 4 − 0.66 × 1×2 + 0.84 × 1×3 + 0.16 × 1×4 − 0.88 × 2×3 − 0.22 × 2×4 − 0.21 X3×40.813.220.038
X1: P element content; X2: K element content; X3: Ca element content; X4: Mg element content.
Table 6. Multi-objective optimization results of nutrients on the fresh weight and quality indices of lettuce.
Factors-Independent VariablesGoalOptimized Value
N(mmol·L−1)-22.00
P(mmol·L−1)In range2.71
K(mmol·L−1)In range6.42
Ca(mmol·L−1)In range5.58
Mg(mmol·L−1)In range7.11
Responses—Dependent VariablesGoalOptimized Value
Shoot fresh weightmaximum246.15 g
SPADmaximum31.96
Soluble sugarmaximum3.42 mg·g−1
Vcmaximum6.84 mg·100 g−1
Desirability value0.851
Table 7. Nutrient solution formulas of validation experiment.
TreatmentsNH4H2PO4
(mmol L−1)
KNO3
(mmol L−1)
Ca (NO3)2
(mmol L−1)
MgSO4
(mmol L−1)
Desirability Value
CK1.006.004.002.00-
T12.706.405.607.100.851
T22.806.405.807.300.823
T33.358.005.505.000.769
T42.809.604.407.100.755
T52.008.005.505.000.712
T62.008.003.655.000.554
T71.206.404.407.100.501
Table 8. Effects of different nutrient solution formulas on growth parameters of lettuce plants.
TreatmentsShoot Fresh Weight
(g)
Root Fresh Weight
(g)
Shoot Dry Weight
(g)
Root Dry Weight
(g)
CK213.99 ± 7.65 b41.60 ± 3.32 b22.38 ± 1.67 b1.70 ± 0.08 c
T1301.02 ± 6.03 a51.21 ± 2.57 a32.12 ± 1.63 a3.40 ± 0.19 a
T2280.54 ± 4.32 a49.74 ± 3.22 ab30.52 ± 2.76 a2.98 ± 0.40 ab
T3209.88 ± 8.05 b42.36 ± 2.21 b23.40 ± 2.11 b2.28 ± 0.46 b
T4183.47 ± 7.34 bc43.78 ± 3.16 b21.04 ± 0.92 b1.94 ± 0.35 bc
T5204.39 ± 8.02 b40.20 ± 1.28 bc20.60 ± 1.64 bc2.30 ± 0.13 b
T6159.30 ± 6.64 d39.28 ± 2.39 bc13.86 ± 1.53 d1.70 ± 0.21 c
T7154.65 ± 7.91 c40.61 ± 2.11 bc13.88 ± 0.89 d2.36 ± 0.15 b
T1, T2, T3, T4, T5, T6, and T7 represent seven different formulations of nutrient solutions. The CK is the Hoagland solution. The different lowercase letters represent significant differences among the different treatments based on Duncan’s new multiple range test at p < 0.05 (n = 5).
Table 9. Effects of different nutrient solution formulas on the quality parameters of lettuce.
TreatmentsSoluble Sugar
(mg g−1)
Soluble Protein
(mg g−1)
Vc
(mg 100 g−1)
Nitrate Content
(mg g−1)
Amino Acid
(μg g−1)
CK2.89 ± 0.36 bc 5.07 ± 0.25 c5.53 ± 0.31 c10.45 ± 0.61 b1.71 ± 0.10 d
T13.23 ± 0.67 a 7.05 ± 0.12 a 6.67 ± 0.50 b 7.29 ± 0.52 e2.75 ± 0.10 a
T23.08 ± 0.45 ab5.86 ± 0.13 b5.54 ± 0.42 c4.72 ± 0.54 f2.34 ± 0.02 b
T32.21 ± 0.26 d4.92 ± 0.27 c5.56 ± 0.16 c8.70 ± 0.41 d1.12 ± 0.05 ef
T41.65 ± 0.12 e4.98 ± 0.17 c8.46 ± 0.23 a9.34 ± 0.32 c1.22 ± 0.13 e
T51.98 ± 0.03 d 4.48 ± 0.09 d4.60 ± 0.20 c16.95 ± 0.78 a1.74 ± 0.01 d
T62.04 ± 0.11 d4.91 ± 0.27 c4.73 ± 0.23 c9.89 ± 0.33 bc0.99 ± 0.03 f
T72.42 ± 0.22 c5.50 ± 0.02 b8.20 ± 0.40 ab11.00 ± 0.47 b1.93 ± 0.05 c
T1, T2, T3, T4, T5, T6, and T7 represent seven different formulations of nutrient solutions. The CK is the Hoagland solution. The different lowercase letters represent significant differences among the different treatments based on Duncan’s new multiple range test at p < 0.05 (n = 5).
Table 10. The effect of nutrient solution formulas on the amino acid contents of lettuce.
TreatmentsGlutamate
(ug g−1)
Glycine
(ug g−1)
Alanine
(ug g−1)
GABA
(ug g−1)
Total Amino Acid
(ug g−1)
CK6.07 ± 0.41 a4.19 ± 0.27 bc15.75 ± 0.68 d55.52 ± 3.85 c1.71 ± 0.10 d
T16.03 ± 0.20 a6.38 ± 0.26 a 21.71 ± 1.45 bc66.03 ± 3.29 ab2.75 ± 0.10 a
T24.87 ± 0.48 bc6.17 ± 0.32 a25.60 ± 1.45 ab66.02 ± 4.86 ab2.34 ± 0.02 b
T34.83 ± 0.22 bc5.06 ± 0.25 b17.48 ± 1.21 cd53.71 ± 4.46 c1.12 ± 0.05 ef
T45.18 ± 0.13 abc5.02 ± 0.30 b15.97 ± 1.26 d51.03 ± 2.16 c1.22 ± 0.13 e
T55.84 ± 0.26 ab5.11 ± 0.28 b17.82 ± 0.71 cd56.87 ± 3.21 c1.74 ± 0.01 d
T65.56 ± 0.55 ab4.81 ± 0.20 bc27.76 ± 2.38 a59.02 ± 6.22 c0.99 ± 0.03 f
T74.23 ± 0.28 c6.21 ± 0.72 a25.45 ± 2.35 ab75.91 ± 7.04 a1.93 ± 0.05 c
Disclaimer/Publisher’s Note: The statements, opinions and data contained in all publications are solely those of the individual author(s) and contributor(s) and not of MDPI and/or the editor(s). MDPI and/or the editor(s) disclaim responsibility for any injury to people or property resulting from any ideas, methods, instructions or products referred to in the content.

