Article

Brackish Water, Phosphate Fertilization and Trichoderma in the Agronomic Performance of Beet Crops

by
Andreza Silva Barbosa
1,*,
Alexsandro Oliveira da Silva
1,
Geocleber Gomes de Sousa
2,
Maria Vanessa Pires de Souza
1,
Márcio Henrique da Costa Freire
1,
Geovana Ferreira Goes
1,
Arthur Prudêncio de Araújo Pereira
1,
Thales Vinícius de Araújo Viana
1,
Raimundo Nonato Távora Costa
1,
Claudivan Feitosa de Lacerda
1,
Geronimo Ferreira da Silva
3 and
Mário Monteiro Rolim
3
1
Center of Agrarian Sciences, Federal University of Ceará (FUC), Av. Mr. Hull 2877, Fortaleza 60356-001, CE, Brazil
2
Institute of Rural Development, University of International Integration of Afro-Brazilian Lusofonia, Redenção 62790-000, CE, Brazil
3
Department of Agricultural Engineering, Federal Rural University of Pernambuco (FRUP), Dois Irmãos, Recife 52171-900, PE, Brazil
*
Author to whom correspondence should be addressed.
Agronomy 2024, 14(6), 1306; https://doi.org/10.3390/agronomy14061306
Submission received: 16 May 2024 / Revised: 5 June 2024 / Accepted: 6 June 2024 / Published: 17 June 2024
(This article belongs to the Special Issue Effect of Brackish and Marginal Water on Irrigated Agriculture)

Abstract

:
The study hypothesis proposes that the use of Trichoderma, associated with fertilization with 100% of the recommended phosphorus, may mitigate saline stress and maximize the productivity and quality of the tuberous root. This study aims to evaluate the mitigating effects of phosphate fertilization and Trichoderma harzianum in beet plants under salt stress, by measuring the initial growth, leaf gas exchange, productivity and quality of the beet. The experimental design used was entirely randomized, in a 3 × 2 × 2 factorial scheme, referring to three doses of phosphate fertilization (25%, 50% and 100%), with and without the use of Trichoderma-based inoculation, and two levels of electrical conductivity of the irrigation water (0.5 and 6.2 dS m−1). Salt stress negatively affected the leaf area of the beet. The shoots’ dry mass was reduced as the electrical conductivity of the irrigation water increased, especially in the treatment with the 25% P2O5 dose. Salt stress reduced photosynthesis to a greater extent at the 25% P2O5 dose and in the absence of Trichoderma harzianum. Increasing the electrical conductivity of the irrigation water reduced transpiration and increased leaf temperature at the 25% P2O5 dose and in the presence of Trichoderma harzianum. The 25% P2O5 dose increased the stomatal conductance of the beet. The higher electrical conductivity of the irrigation water negatively affected water use efficiency, most significantly at the 25% P2O5 dose. Our data showed that the doses of 50% and 100% P2O5 were more efficient at increasing the productivity and quality of the beet, with the tuberous root diameter being higher under the lower electrical conductivity of the water and the absence of Trichoderma harzianum. The pH was high under the lowest electrical conductivity of the water, with a dose of 25% P2O5 and the absence of Trichoderma harzianum.

1. Introduction

Beet (Beta vulgaris L.) is a vegetable that originated in North Africa and some European regions. It adapts well to temperate climate regions and has around three or four possible productive phases, given that the cycle is around 60 to 120 days [1]. Because it is commercially exploited, the study of beet is of great importance, especially with regard to its water and nutritional needs, as well as its responses to abiotic stresses [2,3].
The Brazilian semi-arid region has climatic characteristics in which rainfall is poorly distributed over time and space, and evapotranspiration rates exceed precipitation rates. As a result, the use of brackish water for irrigation turns out to be an alternative to ensure agricultural production during times of drought [4,5]. However, irrigation with water containing a high concentration of salts can cause saline stress, a condition that can restrict the absorption of water and mineral nutrients by plants, negatively affecting the metabolism, growth and productivity of agricultural crops [1,6,7].
Salt stress reduces the development and yields of vegetables, initially through osmotic effects, causing water deficits, and later through ionic effects, hindering the absorption of essential nutrients [8]. In studies with beet irrigated with saline water, Ref. [3] concluded that increasing the concentration of salts in the irrigation water negatively affected the number of leaves, tuberous root length and productivity [9], as well as the physiological responses of the beet.
Living with this problem in semi-arid regions highlights the need to employ management strategies that reduce the impact of salinity on plants and the environment [10]. In this regard, phosphate fertilization has been tested to reduce the effects of salt stress. Phosphorus acts in the transfer of energy in the cell in the form of adenosine triphosphate (ATP) and participates in various processes, such as respiration and photosynthesis [11,12,13]; the evaluation of salt stress and phosphate fertilization in cowpea cultivation showed the mitigating effect of this macronutrient on leaf gas exchange.
Another alternative to mitigate salt stress is the use of fungi of the genus Trichoderma, which are of great economic importance to agriculture and increase resistance to abiotic stresses and, consequently, crop productivity [14]. Microorganisms are central players in the process of releasing and recycling nutrients in plants [15]. Strains of the Trichoderma genus, in addition to providing biological control, also play a biostimulant role due to growth promotion, through the availability of nutrients and the production of phytohormones [16]. They are fungi that colonize quickly, are invasive, filamentous, opportunistic, avirulent and exhibit a symbiotic relationship with plants [14]. A study carried out by [17] found that the use of Trichoderma longibrachiatum attenuated the deleterious effect of salt stress on Fair Fax and Crimson Sweet watermelon cultivars.
The study hypothesis proposes that the use of Trichoderma, associated with fertilization with 100% of the recommended phosphorus, may mitigate saline stress and maximize the productivity and quality of the tuberous root. In this context, this study aimed to evaluate the mitigating effects of phosphate fertilization and Trichoderma harzianum in beet plants under salt stress, by measuring the initial growth, leaf gas exchange, productivity and quality of the beet.

2. Materials and Methods

2.1. Experimental Area and Weather Conditions

The experiment was conducted during the dry season (August to November 2022), in the experimental area belonging to the University of the International Integration of Afro-Brazilian Lusophony (UNILAB), in the municipality of Redenção-CE, Brazil, with coordinates of latitude 4°13′33″ S and longitude 38°43′39″ W and an altitude of 88 m. The air temperature (maximum and minimum) and relative humidity recorded during the experiment are shown in Figure 1.

2.2. Plant Material and Substrate for Cultivation

Beet seeds (Beta vulgaris L.) of the cultivar Katrina were used, which were sown in growing trays, and after 12 days, the seedlings were transplanted into 8 L plastic pots filled with a substrate made from a mixture of soil classified as Yellow Red Argissolo [18], sand and manure in the ratio 3:4:1, respectively. The chemical attributes of the substrate are shown in Table 1.

2.3. Experimental Design and Description of Treatments

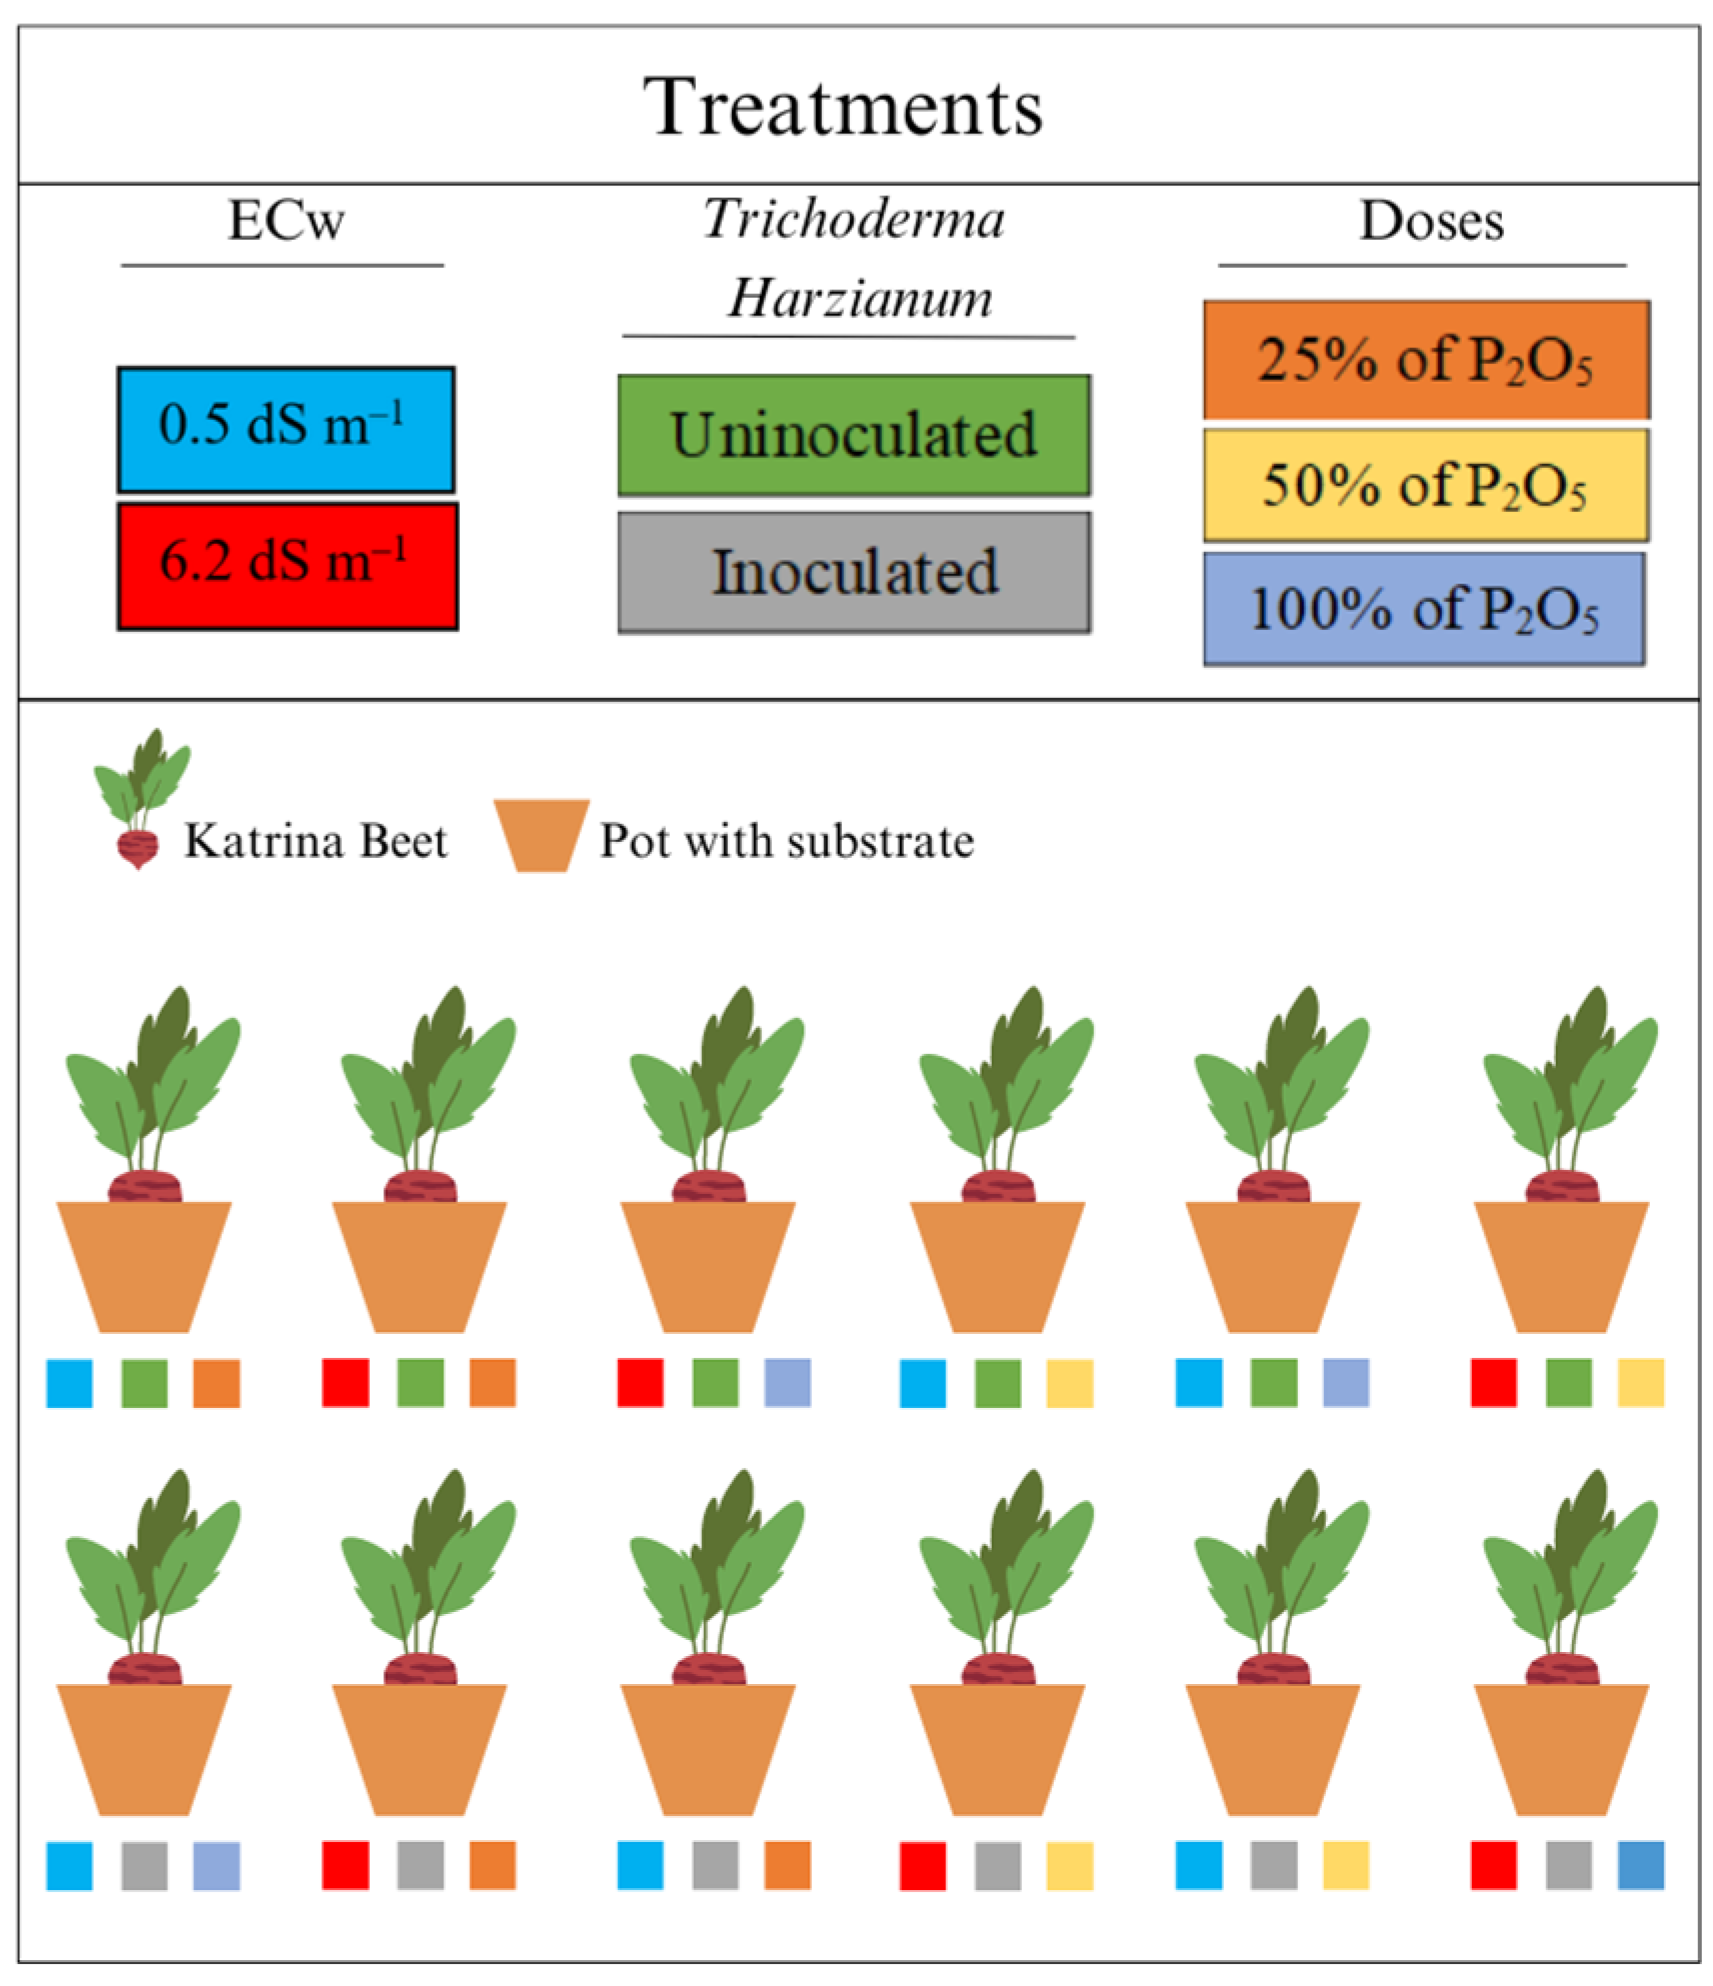
The experimental design used was entirely randomized, in a 3 × 2 × 2 factorial scheme, referring to 3 doses of phosphate fertilization (D1 = 25, D2 = 50 and D3 = 100% of the recommended dose of P2O5), with (CI) and without (SI) inoculation with Trichoderma harzianum and two levels of electrical conductivity of the irrigation water (ECw) (0.5 dS m−1 and 6.2 dS m−1), with six repetitions. The Experimental Design is presented in Figure 2.

2.4. Irrigation Management

Irrigation was carried out manually, with a 15% leaching rate according to Ayers and [19], using a daily frequency calculated according to the drainage lysimeter [20], in order to keep the soil at field capacity.
The volume of water to be applied to the pots was determined by (Equation (1)):
V I = ( V p V d ) ( 1 L F )
where:
VI = volume of water to be applied during irrigation (mL);
Vp = volume of water applied during previous irrigation (mL);
Vd = volume of water drained (mL);
LF = leaching fraction of 0.15.
After the seedlings were established, they were thinned out by hand, leaving one more vigorous plant per pot. The irrigation treatments with brackish water started 21 days after transplanting (DAT). The irrigation water was prepared by diluting the salts NaCl, CaCl2∙2H2O and MgCl2∙6H2O, in the equivalent ratio of 7:2:1 between Na, Ca and Mg, following the relationship between the ECw and its concentration (mmolc L−1 = CE × 10), according to [21].

2.5. Fertilization and Inoculation

Mineral fertilization followed that proposed for sugar beet (60 kg ha−1 of N; 210 kg ha−1 of P2O5; 120 kg ha−1 of K2O), as recommended by [22], using urea as the N source—45% of K2O, potassium chloride—60% and simple superphosphate, P2O5 —18%. It should be noted that phosphorus was fertilized with simple superphosphate fertilizer, using 88 g pot−1 for the 100% treatment, 44 g pot−1 for the 50% treatment and 22 g pot−1 for the 25% treatment, with 50% being applied at foundation, 25% at 21 and 40 DAT. As for N and K, 50% was applied at foundation and 50% at 21 DAT.
Trichoderma was applied at the manufacturer’s recommended dosage of 2 kg ha−1. However, an adaptation was made for pot conditions, the situation in this study. The area of the pot was found to be 0.045 m2, and then the amount that should be applied to the pot was calculated using a simple rule of three, giving a result of 0.027 g. In order to understand the interaction between the phosphorus and microorganism factors, the Trichoderma was applied on the same days as the phosphate fertilizer. The inoculation was performed by weighing the product on a precision scale and then diluting it in water, forming a mixture to be applied to the substrate in each pot.
As the phosphate fertilization was spread over three applications, the inoculation mixture was divided up in the same way, giving a result of 0.009 g to be applied per pot, following the fertilization schedule. The product used for inoculation was trichodermil, corresponding to the strain Trichoderma harzianum (CEPA ESALQ 1306) supplied by the company Koppert located in Piracicaba-SP Brazil, whose concentration is 2.0 × 10⁹ viable conidia/mL. It is worth noting that, in the literature, this strain appears to be used more for biocontrol purposes.

2.6. Plant Analysis

At 37 DAT and fifteen days of stress, the following growth assessments were carried out: plant height (PH, cm), using a graduated ruler to measure from the neck of the plant to the end of the main stem; number of leaves (NL, plant−1), by directly counting whole leaves by hand; and leaf area (LA, cm2 plant−1), estimated by the equation LA = LL × LW, indicated according to the methodology proposed by [23], where LL—leaf length (cm), LW—leaf width (cm).
The shoots’ dry mass (SDM) was obtained after the samples were dried in an oven at a constant temperature of 65 °C with forced air circulation for 72 h until they reached a constant weight, determined on a precision scale with the result expressed in grams (g plant−1).
Also at 37 DAT, gas exchange was assessed in fully expanded leaves: the net CO2 assimilation rate (A—μmol CO2 m−2 s−1), transpiration (E—mol H2O m2 s−1), stomatal conductance (gs—mol H2O m−2 s−1), internal CO2 concentration (Ci—μmol CO2 mol−1 air) and leaf temperature (LT—°C), using an infrared gas analyzer (LCpro, ADC, Hoddesdon, UK) equipped with an artificial radiation source with its intensity set at 2000 μmol m−1 s−1. Measurements were taken between 8 and 11 a.m.
At 80 DAT, the plants were harvested, and the following assessments were made: the tuberous root diameter (TRD, mm) and tuberous root length (TRL, mm), based on the transverse and longitudinal diameters, respectively, using a digital caliper. Tuber root mass (TRM, g plant−1) and productivity (PROD, g plant−1) measurements were carried out on an analytical balance with a precision of 0.0001 g. To assess the pH of the tuberous root (pH), the harvested beets were separated and macerated in a blender to extract the juice and determine the pH using a benchtop pH meter. For the soluble solids content, expressed in (°Brix), a manual refractometer was used.

2.7. Data Analysis

The data were subjected to the Kolmogorov–Smirnov test (p ≤ 0.05) to assess normality. After checking for normality, they were subjected to an analysis of variance using the F test and, when significant, were subjected to the Tukey test at p ≤ 0.01 and p ≤ 0.05 of significance, using the Assistat 7.7 Beta computer program [24].

3. Results

3.1. Growth and Biomass Variables

According to the summary of the analysis of variance (Table 2), there was a significant effect for the phosphorus dose factor alone on the variables plant height (PH), number of leaves (NL), leaf area (LA) subjected to doses of phosphorus and shoots’ dry mass (SDM) (p < 0.05). As for the water factor, there was a significant response for leaf area (LA) a (p < 0.05), and an interaction between the phosphorus dose and water factor for shoots’ dry mass (p < 0.05).

3.1.1. Growth

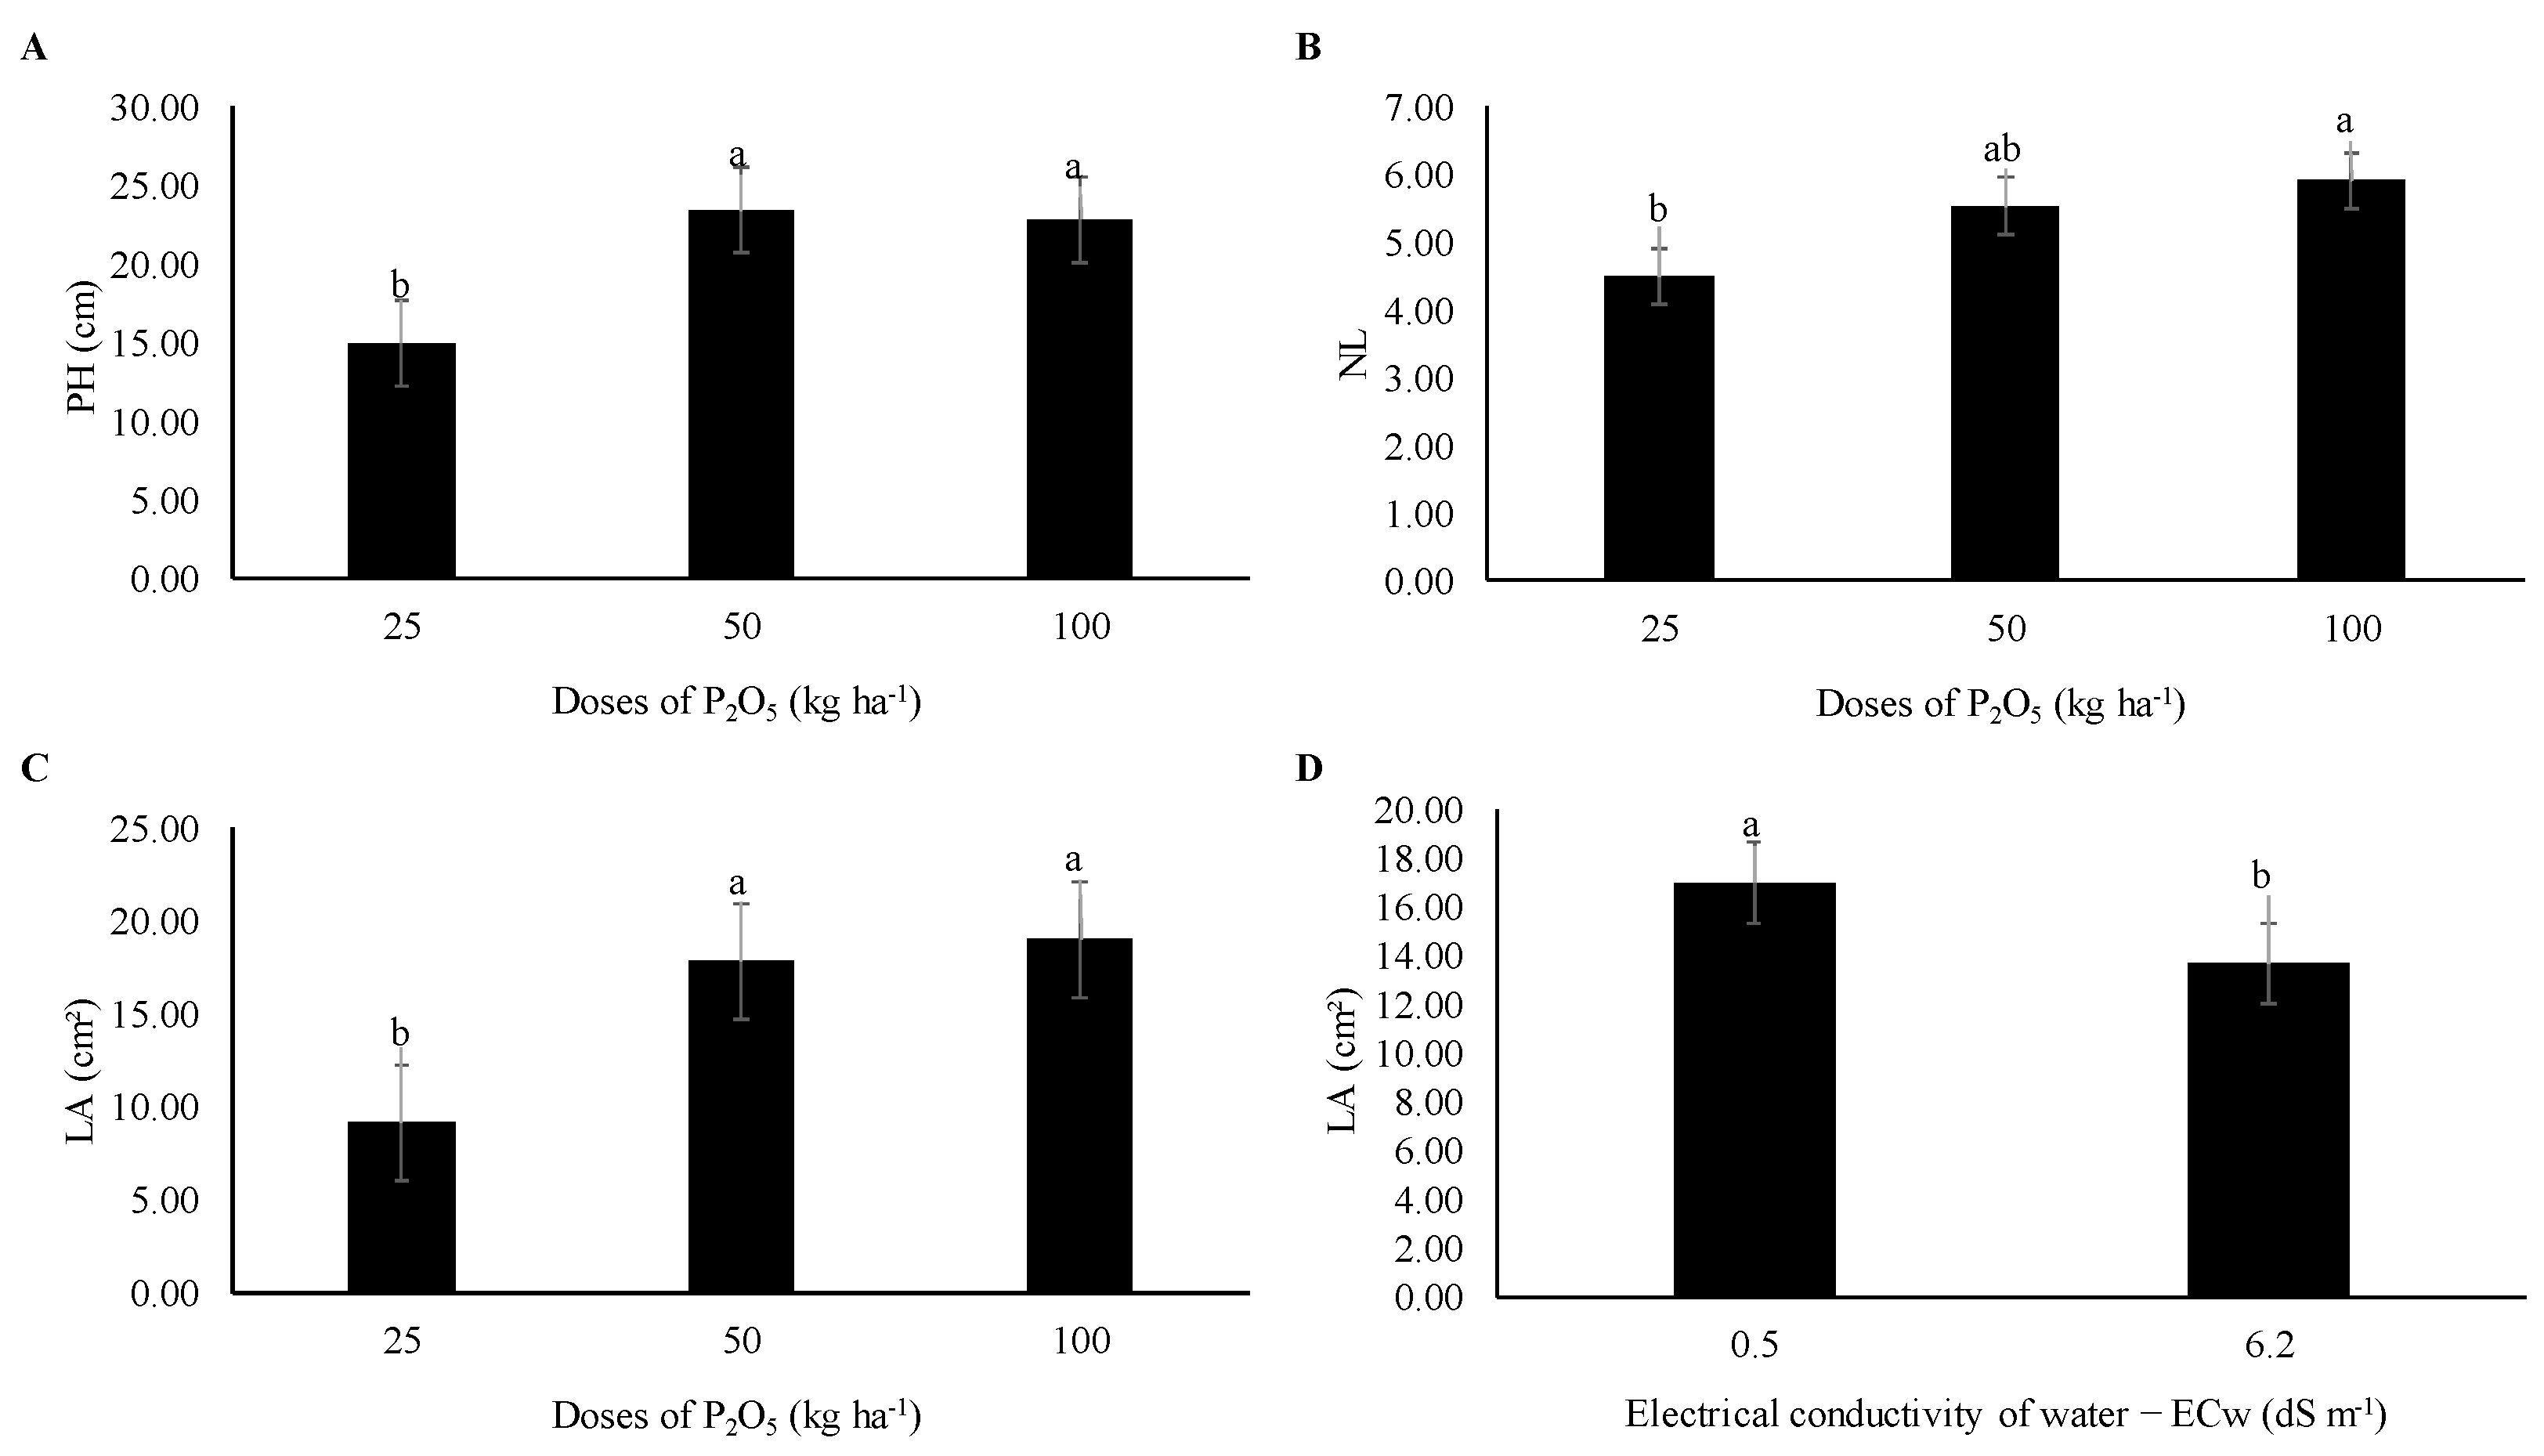
Figure 3A–C reveal that the treatment of 25% of the phosphorus recommendation differed statistically from the other doses in the variables PH, NL and LA, obtaining the lowest values. The use of the lowest-salinity water (0.5 dS m−1) resulted in higher leaf area values, differing statistically from the treatment with the highest-salinity water (6.2 dS m−1), as shown in Figure 3D.

3.1.2. Biomass

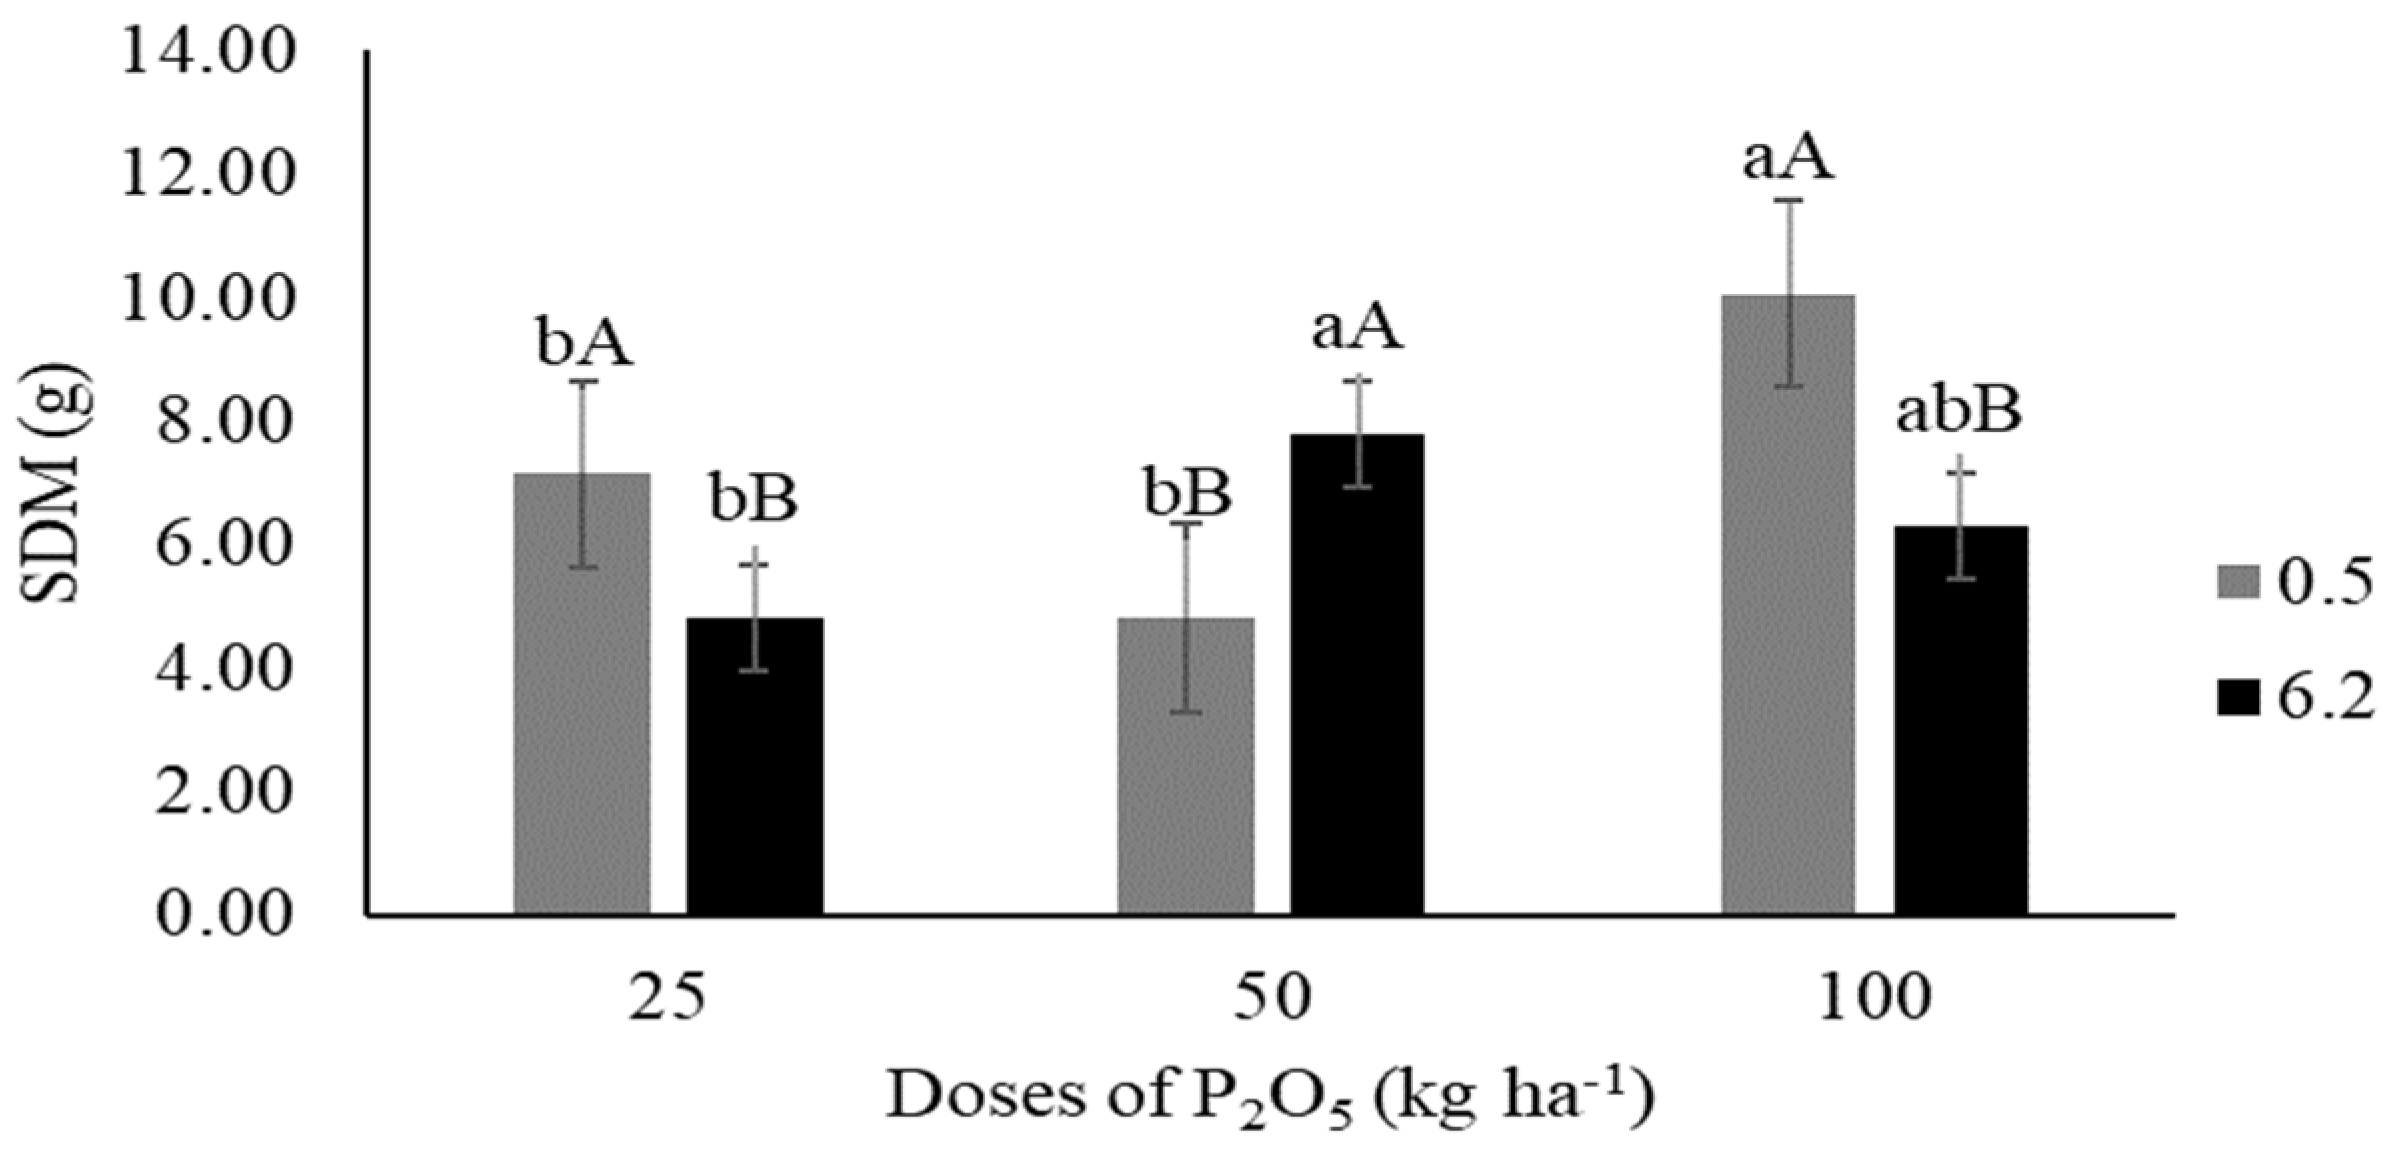
The recommended doses of 25 and 100% P2O5 associated with lower-salinity water promoted a greater shoots’ dry mass. The recommended dose of 50% phosphorus associated with the highest-salinity water showed the highest shoots’ dry mass (Figure 4).

3.2. Leaf Gas Exchange

According to the analysis of variance (Table 3), there was an isolated significant effect (p < 0.01) for the factors phosphorus doses and water on the variable stomatal conductance (gs). There were interactions for the phosphorus and water dose factors on the internal CO2 concentration (Ci) and leaf temperature (LT) variables at (p < 0.01 and <0.05) and for the phosphorus and inoculation, water and inoculation dose factors on the leaf temperature (LT) variable at p < 0.01. As for the interactions between all the factors studied, there was a significant effect on the variables photosynthesis (A) and transpiration (E) at (p < 0.01 and <0.05).
For the photosynthesis variable (A) (Figure 5A), the dose of 25% of the phosphorus recommendation in the absence of Trichoderma in the lowest-salinity water (0.5 dS m−1) differed statistically (p < 0.01), being higher than the doses of 50% and 100% of the P2O5 fertilization, while in the presence of Trichoderma, there was no statistical difference.
According to the transpiration data (E) (Figure 5B), when comparing the doses of phosphorus associated with the absence of Trichoderma and lower-salinity water (0.5 dS m−1), the recommendation of 25% phosphate fertilization differs from the 50% and 100% levels, with the highest value being obtained, while in the presence of this fungus, there was no significant difference.
For stomatal conductance (gs), shown in (Figure 5C), the data reveal that the treatment of 25% of the phosphorus recommendation differed statistically from 50% and 100%, obtaining higher values.
The highest stomatal conductance (gs) values as a function of irrigation ECw were obtained when using the lowest-salinity water (0.5 dS m−1), which differed statistically from the treatment with the highest-salinity water (6.2 dS m−1) (Figure 5D).
Figure 6A (LT) shows that the dose of 25% of the P2O5 recommendation provided the highest leaf temperatures, differing statistically from the other doses used.
Leaf temperature decreased with the increase in the doses of P2O5 applied, compared to the 25% dose, which had the highest temperatures, which were more significant when in the presence of Trichoderma (Figure 6B).
It can be seen in Figure 6C that the leaf temperature of plants that received Trichoderma was higher than plants that did not receive the microorganism, for both waters used, with this effect being more prominent in the lower-salinity water.
According to Figure 6D, the lowest-salinity water, associated with the dose of 100% of the phosphorus recommendation, increased the internal CO2 concentration (Ci), which was reduced by an ECw of 6.2 dS m−1, with no statistical difference for the doses of 25 and 50% of the recommended phosphorus dose at the highest and lowest ECw.

3.3. Post-Harvest and Yield

According to the analysis of variance (Table 4), there was a significant effect for the phosphorus dose factor alone on the variables tuberous root mass (TRM), productivity (PROD) at (p < 0.05) and tuberous root length (TRL) at (p < 0.01). As for the triple interaction between the factors studied, there was a significant effect (p < 0.05) on the tuberous root diameter (TRD) variable. There were double interactions for the factors phosphorus doses and water (p < 0.01), and phosphorus doses and inoculation (p < 0.05), on the tuberous root pH variable (pH). There was no significant effect for the soluble solids variable (°BRIX).
The 25% P2O5 dose provided the lowest TRM (23.27 g plant−1), statistically different from the 100% dose (Figure 7A), with values of (40.74 g plant−1). Similarly, for productivity (PROD) as a function of the doses of P2O5 (Figure 7B), the treatment of 25% of the recommendation differed statistically from that of 100%, obtaining beet productivity values of (528.24 g plant−1) and (905.54 g plant−1), respectively.
For TRD, there was no significant difference for the water with the lowest electrical conductivity, phosphate fertilization, or presence and absence of Trichoderma. However, for the water with the highest salinity, the 50 and 100% doses of P2O5 were statistically superior to the 25% dose, in the presence of Trichoderma (Figure 7C). For tuberous root length, the 25% P2O5 dose differed statistically from the 50 and 100% doses (Figure 7D).
The average pH values shown in Figure 8A reveal that there was a significant difference only at the 25% phosphorus dose, with the lower-salinity water being statistically superior to the higher-salinity water.
The pH was influenced by the interaction between the phosphate fertilization and inoculation factors (Figure 8B), decreasing as the doses of P2O5 applied increased, and this trend was observed both in the presence and absence of the microorganism in the soil.

4. Discussion

4.1. Growth and Biomass Variables

4.1.1. Growth

For plant height, number of leaves and leaf area, the results reflect the crop’s need for P, which affects its full development. This macronutrient acts in the transfer of energy in the cell in the form of adenosine triphosphate (ATP), and its deficiency in plants leads to reduced growth and thin stems [12], as shown in the results. In addition, phosphorus is a crucial element for the formation and development of a vigorous root system and, consequently, greater leaf emission, which is reflected in a larger leaf area [25]. Therefore, lower doses of P2O5 inducing a reduction in the root system results in less absorption of the nutrient by the plant and consequently a reduction in the other organs.
Similar results were found by [26], evaluating beet cultivars as a function of phosphate fertilization, where the control treatment (without P application) showed a reduction in plant height. Corroborating this study, Ref. [27] obtained a higher number of leaves in treatments with higher doses of phosphorus in radish cultivation. Similarly, Ref. [28] obtained a maximum leaf area with higher phosphorus applications in sugar beet.
The results of the leaf area as a function of the electrical conductivities of the irrigation water can be explained by the effects of salinity, which reduces the osmotic potential, causing plants to absorb less water, which tends to close the stomata, preventing the loss of water to the environment and reducing the dissipation of latent heat associated with the vaporization of water in the leaf tissues; Refs. [2,12,13], working under pot conditions with brackish water of 5.8 dS m−1 in the beet crop, also found a reduction in leaf area. Similarly, Ref. [26] concluded that salt stress reduced the leaf area of beet.

4.1.2. Biomass

This response is reflected in the statement by Cordeiro et al. (2022) [29], who point out that phosphorus is an essential nutrient needed for crop growth and production due to its role in ATP synthesis, root growth and plant biomass. The response in the reduction of the shoots’ dry mass may be due to the lower availability of phosphorus, which is intensified by salinity [30]. In line with the present study, [31], working with different salt levels in a sugar beet crop fertilized with 100% of the recommended dose of phosphorus, also observed a significant reduction in the dry mass of the shoots.
This result shows that part of the phosphorus present in the soil solution became available more quickly, possibly due to ion–root contact, given that this study was carried out in a pot, which means that the nutrients are more concentrated in the substrate and close to the root system. A divergent trend to that of this study was recorded by [32] in cowpea cultivation. These same authors did not observe an increase in the dry mass of the aerial part when they used 50% of the phosphate fertilization in soil irrigated with brackish water.

4.2. Leaf Gas Exchange

For photosynthesis, the result indicates that the participation of the microorganism did not influence the solubilization of phosphate fertilizer from the soil solution to the beet roots and consequently better distribution of photoassimilates in the leaf and greater photosynthesis. Saline stress causes the inhibition of electron transport proteins in chloroplasts, limiting gas and CO2 entry into the leaf mesophyll and reducing photosynthesis due to the decrease in the partial pressure of this gas in the intercellular spaces [33]. Consistent results were obtained by [34], studying the influence of Trichoderma on the increase in biomass of soybean, cowpea, corn and rice plants, in which the authors concluded that the use of Trichoderma showed superior results in terms of biomass accumulation, demonstrating its potential as a growth promoter in the crops evaluated.
When irrigated with water of higher salinity (6.2 dS m1) there was no significant difference between the doses of phosphorus in the presence and absence of the microorganism, but between the treatment with and without the microorganism, photosynthesis was higher at the dose of 25% of phosphorus fertilization in the treatment with the microorganism. This behavior reveals the beneficial effect of the interacting microorganism, alleviating the adverse effects of salt stress—even in a condition of lower nutritional supply of phosphorus at 45 days after sowing—through physiological acclimatization, partially relieving thermal stress and the effects of excess light [35,36].
A study that reflects results contrary to this study was reported by [13] when fertilizing a cowpea crop with 50% of the phosphate fertilization with brackish water. These same authors found no mitigating effect on photosynthesis at 45 days after sowing. However, a similar trend for sugar beet was reported by [9], when using 100% phosphate fertilization in a saline environment.
The higher transpiration at the 25% dose can be related to the leaf area results, which showed a smaller area at the lower dose applied. As P is an essential macronutrient for the growth and development of plant organs, a lower application leads to less absorption and consequently stunted leaves and reduced growth. This means that the plant needs to transpire more to compensate for the smaller leaf area.
Comparing phosphate fertilization in the presence of Trichoderma and water with a higher salinity (6.2 dS m1), there was a statistical difference between the doses of 25% of the phosphorus recommendation and those of 50% and 100%, with the highest values of transpiration in the presence of the microorganism. When the concentration of salts in the soil rises, the osmotic potential decreases, causing the plants to strategically reduce the loss of water to the environment by reducing the leaf area, as the rate of transpiration is greater than absorption [9].
Therefore, a smaller leaf area pushes the plant to transpire less, in order to compensate for the lower leaf area caused by both the salt stress and the lower dose of P2O5 applied. This strategy of reducing water loss to the environment reduces transpiration in saline environments, as well as salt absorption and, consequently, translocation to the aerial part [37], thus contributing to reducing the deleterious effects of salts [38].
For stomatal conductance, the result may be related to a possible adaptation of the plant to pot conditions, where it may have absorbed phosphorus in labile form via mass flow through unidirectional transport, i.e., facilitating the absorption of K+ more quickly, consequently achieving greater stomatal regulation. It should also be noted that this result shows that phosphorus acts in the transfer of energy in the cell in the form of adenosine triphosphate (ATP), helping in various gas exchange processes [12]. This study differs from the results obtained by the authors of [32], who concluded that high doses of phosphorus resulted in greater stomatal conductance in a cowpea crop.
The results show that saline stress caused lower stomatal conductance, indicating the occurrence of a greater accumulation of salts in the soil and greater stomatal limitation to the carbon assimilation process [12]. Salt stress favors a reduction in leaf area due to its deleterious effects. Therefore, with a reduced leaf area, there is a reduction in the photosynthesizing area and consequently in stomatal conductance; [9,39], evaluating the effect of salt stress on sugar beet crops, concluded that increasing the electrical conductivity of the water also reduced stomatal conductance.
In relation to leaf temperature, in addition to its energy functions, phosphorus is directly related to the synthesis of molecules and enzyme activation, which directly affects leaf gas exchange and the dissipation of latent heat from the leaf surface through the opening of stomata and cellular respiration [12,40,41]. Contrary to the present study, [13], evaluating irrigation strategies with brackish water and phosphate fertilization in cowpea cultivation, found that the 100% dose of phosphorus increased the crop’s leaf temperature. On the other hand, studies reporting the non-significance of phosphate fertilization on the leaf temperature of jatropha plants were described by [42].
The low supply of phosphorus at a dose of 25% may have led to low enzymatic activities in the soil, causing nutritional stress in the plant due to the proportion of phosphorus available, which is not observed in the higher doses of phosphorus applied [43], and consequently less absorption of regulatory nutrients in the cellular vacuole, thus increasing leaf temperature. Corroborating this result where the microorganism did not act efficiently, studies by [44] concluded that there was no influence of biostimulants such as Trichoderma on the leaf temperature of bean plants.
Trichoderma helps the plant as a biostimulant, which can lead to various metabolic processes being activated together, raising leaf temperature, and, under conditions of abiotic stress, such as salinity, the microorganism acts by attenuating the effect of the stress caused [45]. In contrast to this study, research conducted in peanut crop [46] found that leaf temperature of salt-stressed peanut plants increased as ECw increased. These same authors found that inoculated peanut plants had a lower leaf temperature than non-inoculated plants.
For the internal CO2 concentration, the result shows greater stomatal control during the stress period, thus increasing CO2 accumulation in the leaf mesophyll [12], unlike what was observed in this study, revealing that there was stomatal resistance under conditions of salt stress at the 25% dose. Studies demonstrating that fertilization with a dose of 100% of the recommended phosphorus in beet crops under saline stress found a reduction in internal CO2 concentration [9]. Research developed by [32] obtained results opposite to those of this study in cowpea crops irrigated with brackish water fertilized with phosphate, where they did not find a mitigating effect of phosphate fertilization in water with higher salinity.

4.3. Post-Harvest and Yield

For tuberous root mass and productivity, the results shows that P deficiency can lead to lower development of the plants’ morphological characteristics. The phosphorus is important for tuber development, enhancing the metabolic processes of plants, such as the translocation of photoassimilates, providing an increase in the total production of the tuberous roots of the plant [47]. Similar results were found by the authors of [48], where, studying the effects of fertilization with different levels of phosphorus on the botanical characteristics of table beet, they concluded that an increase in phosphorus doses significantly increased the mass of the tuberous root of the beet. Working with beetroot culture, researchers [26] also observed an increase in the total productivity of beet roots as a result of increased phosphorus fertilization, where the doses that maximized the cultivars studied were between 170 and 270 kg ha1 of phosphorus.
It should also be noted that excess soluble salts in the soil solution cause a nutritional imbalance due to the effect of reducing the osmotic potential, decreasing the absorption of nutrients and water [49]. A similar trend to the data in this study was reported by [3], when they investigated the use of brackish water in the cultivation of beet in soil fertilized with 100% of the phosphate fertilizer without microorganisms. These same authors concluded that an irrigation water salinity of 5.8 dS m1 reduced the diameter of the tuberous roots grown in pot conditions.
The results regarding root length may be linked to the functions of P, which is effective in energy generation, nucleic acid synthesis, photosynthesis, glycolysis, respiration, carbohydrate metabolism and consequently the greater initial development of beet roots [50]. Similarly, Silva et al. (2019) observed that in treatments without P application, beet plants showed visual symptoms of deficiency, such as a reduction in the size and number of roots per plant. Research that demonstrates an effect contrary to that of this study was found in the study by [51], when they reported that root length decreased with increased phosphate fertilization.
The saline stress caused by phosphate fertilizer, which has a salinity index of 34%, can contribute to reducing the osmotic potential, making it difficult for plants to absorb water and nutrients, affecting the post-harvest quality of fruit or roots; Ref. [52], when assessing the quality of watermelon fruit irrigated with brackish water, found a similar trend to this study, with a pH ranging from 5.5 to 6.1. Contrary to this study, Ref. [53] found no changes in the pH of tomato fruit grown in a protected environment using water of different electrical conductivities.
Despite the variation in pH with the application of treatments, the values found in this study are within the range considered excellent (pH 4 and 5 in the absence of oxygen, and between pH 5 and 6 in the presence of oxygen) for the stability of beta-lains, the substance responsible for color and antioxidant function [54]. This means that the salinity of the irrigation water did not negatively influence the pulp quality in terms of pH; Ref. [55], when evaluating the post-harvest quality of yellow passion fruit irrigated with brackish water in soil with bovine biofertilizer as a biostimulant, also found a mitigating effect of the organic input on the fruit’s pH.

5. Conclusions

Salt stress negatively affected the leaf area of the beet. Phosphate fertilization at doses of 50% and 100% P2O5 showed a greater performance in terms of the number of leaves, plant height and leaf area in beetroot crops grown in pot conditions The shoots’ dry mass was reduced as the electrical conductivity of the irrigation water increased, especially in the treatment with the 25% P2O5 dose.
Salt stress reduced photosynthesis to a greater extent at the 25% P2O5 dose and in the absence of Trichoderma harzianum. Increasing the electrical conductivity of the irrigation water reduced transpiration and increased leaf temperature at the 25% P2O5 dose and in the presence of Trichoderma harzianum. The 25% P2O5 dose increased the stomatal conductance of the beet. The higher electrical conductivity of the irrigation water negatively affected water use efficiency, most significantly at the 25% P2O5 dose.
Our data showed that the doses of 50% and 100% P2O5 were more efficient at increasing the productivity and quality of the beet, with the tuberous root diameter being higher under the lower electrical conductivity of the water and the absence of Trichoderma harzianum. The pH was high under the lowest electrical conductivity of the water, with a dose of 25% P2O5 and the absence of Trichoderma harzianum.

Author Contributions

Conceptualization: A.S.B., A.O.d.S. and G.G.d.S.; methodology, A.S.B., A.P.d.A.P., C.F.d.L., M.V.P.d.S., G.G.d.S., M.H.d.C.F. and M.M.R.; software, G.G.d.S. and R.N.T.C.; formal analysis, G.F.d.S. and A.O.d.S.; investigation, A.S.B., G.G.d.S., M.V.P.d.S. and G.F.G.; resources, A.S.B., A.O.d.S., T.V.d.A.V., G.G.d.S., A.S.B., R.N.T.C. and A.O.d.S.; data curation, A.S.B., G.G.d.S., G.F.G. and M.M.R.; writing—original draft preparation, A.S.B., G.G.d.S., A.O.d.S. and M.H.d.C.F.; writing—review and editing, A.S.B., G.G.d.S., T.V.d.A.V. and C.F.d.L.; visualization, A.O.d.S. and A.S.B.; supervision, A.S.B., A.O.d.S. and G.G.d.S.; project administration, A.O.d.S., A.P.d.A.P. and G.G.d.S.; funding acquisition, A.O.d.S., G.G.d.S., C.F.d.L., T.V.d.A.V., M.M.R. and G.F.d.S. All authors have read and agreed to the published version of the manuscript.

Funding

This research was funded by Conselho Nacional de Desenvolvimento Científico e Tecnológico (CNPq); process number: 306747/2023-5.

Data Availability Statement

The data that supported the conclusions reported in this article will be made available by the authors upon request.

Acknowledgments

Acknowledgments are also due to National Institute of Science and Technology in Sustainable Agriculture in the Tropical Semiarid-INCTAgriS (CNPq/FUNCAP/CAPES), process number 406570/2022-1.

Conflicts of Interest

The authors declare no conflicts of interest.

References

  1. Pacheco, B.R.O.; Makoski, J.R.; Lima, C.S.M.; Rosa, G.G. Classificação comercial e caracterização físico-química de beterrabas oriundas de sistema de plantio direto de hortaliças sob diferentes densidades de palhada de milho. Rev. Iberoam. De Tecnol. Postcosecha 2021, 22, 212–225. [Google Scholar]
  2. Lacerda, Z.C.; Turco, J.E.P. Métodos de estimação de referência evapotranspiração (ETo) para Uberlândia—MG. Eng. Agríc. 2015, 35, 27–38. [Google Scholar] [CrossRef]
  3. Gadelha, B.B.; Freire, M.H.D.C.; Sousa, H.C.; Costa, F.H.; Lessa, C.I.; Sousa, G.G.D. Crescimento e produção de beterraba irrigada com água salina em diferentes tipos de cobertura vegetal. Rev. Bras. De Eng. Agrícola E Ambient. 2021, 25, 847–852. [Google Scholar] [CrossRef]
  4. Holanda, J.D.; Amorim, J.D.; Ferreira Neto, M.; Holanda, A.D.; Sá, F.D.S. Qualidade da água para irrigação. In Manejo da Salinidade na Agricultura: Estudos Básicos e Aplicados; Gheyi, H.R., Dias, N.D.A.S., Lacerda, C.F., Gomes Filho, E., Eds.; Systems–Digital Solutions: Fortaleza, Brazil, 2016; Volume 2, pp. 35–46. [Google Scholar]
  5. Silva, E.B.; Viana, T.V.A.; Sousa, G.G.; Sousa, J.T.M.; Santos, M.F.; Azevedo, B.M. Growth and nutrition of peanut crop subjected to saline stress and organomineral fertilization. Rev. Bras. De Eng. Agrícola E Ambient. 2022, 26, 495–501. [Google Scholar] [CrossRef]
  6. Dias, A.S.; Lima, G.S.; Gheyi, H.R.; Soares, L.A.A.; Souza, L.P.; Bezerra, I.L. Crescimento do algodoeiro ‘BRS rubi’ em função da irrigação com águas salinas e adubação nitrogenada. Rev. Bras. De Agric. Irrig. 2017, 11, 1945–1955. [Google Scholar] [CrossRef]
  7. Sousa, M.S.; Echer, M.M. Growth promoting microorganisms: A sustainable alternative in beet agronomic performance: Microrganismos promotores de crescimento: Uma alternativa sustentável no desempenho agronômico da beterraba. Concilium 2023, 23, 529–541. [Google Scholar] [CrossRef]
  8. Sá, F.D.S.; Gheyi, H.R.; Lima, G.S.; Ferreira Neto, M.; Paiva, E.P.; Silva, L.D.A.; Moreira, R.C.L. Cultivation of West Indian cherry irrigated with saline water under phosphorus and nitrogen proportions. Semin. Ciênc. Agrár. 2020, 41, 395–406. [Google Scholar] [CrossRef]
  9. Oliveira, F.R.D.; Sousa, G.G.D.; Sousa, J.T.M.D.; Leite, K.N.; Guilherme, J.M.D.S.; Nogueira, R.D.S. Physiological responses of the beet crop under agricultural environment and saline stress. Rev. Ambiente Água 2022, 17, 2868. [Google Scholar] [CrossRef]
  10. Lessa, C.I.N.; Sousa, G.G.; Sousa, H.C.; Silva, F.D.B.; Gomes, S.P.; Araújo Viana, T.V. Agricultural ambience and salt stress in production of yellow passion fruit seedlings. Comun. Sci. 2022, 13, e3703. [Google Scholar] [CrossRef]
  11. Bouras, H.; Bouaziz, A.; Bouazzama, B.; Hirich, A.; Choukr-Allah, R. How phosphorus fertilization alleviates the effect of salinity on sugar beet (Beta vulgaris L.) productivity and quality. Agronomy 2021, 11, 1491. [Google Scholar] [CrossRef]
  12. Taiz, L.; Zeiger, E.; Moller, I.M.; Murphy, A. Fisiologia e Desenvolvimento Vegetal, 6th ed.; Artmed: Porto Alegre, Brazil, 2017; p. 888. [Google Scholar]
  13. Ribeiro, R.M.R.; Sousa, G.G.; Barbosa, A.S.; Lacerda, C.F.; Freire, M.H.C.; Moraes, J.G.L. Irrigation strategies with saline waterand phosphate fertilization in cowpea culture. Rev. Bras. De Ciências 2022, 17, e2572. [Google Scholar] [CrossRef]
  14. Sood, M.; Kapoor, D.; Kumar, V.; Sheteiwy, M.S.; Ramakrishnan, M.; Landi, M.; Sharma, A. TRICHODERMA: The “secrets” of a multitalented biocontrol agent. Plants 2020, 9, 762. [Google Scholar] [CrossRef]
  15. Jing, Z.; Chen, R.; Wei, S.; Feng, Y.; Zhang, J.; Lin, X. Response and feedback of C mineralization to P availability driven by soil microorganisms. Soil Biol. Biochem. 2017, 105, 111–120. [Google Scholar] [CrossRef]
  16. Ji, S.; Liu, Z.; Liu, B.; Wang, Y.; Wang, J. The effect of Trichoderma biofertilizer on Chinese cabbage flowering quality and soil environment. Sci. Hortic. 2020, 262, 109069. [Google Scholar] [CrossRef]
  17. Diniz, G.L.; Costa, C.C.; Sousa, V.F.O.; Lopes, K.P.; Bomfim, M.P.; Santos, J.B. Uso de Trichoderma spp e estresse salino na produção de mudas de melancia. Rev. Em Agronegócio E Meio Ambiente 2022, 15, 1–16. [Google Scholar] [CrossRef]
  18. Santos, H.G.; Jacomine, P.K.T.; Anjos, L.H.C.; Oliveira, V.Á.; Lumbreras, J.F.; Coelho, M.R.; Almeida, J.A.; Araújo Filho, J.C.; Oliveira, J.B.; Cunha, T.J.F. Sistema Brasileiro De Classificação do Solo, 6th ed.; Sistema Brasileiro de Classificação de Solos: Brasília, Brazil, 2018. [Google Scholar]
  19. Ayers, R.S.; Westcot, D.W.A. Qualidade Da Água Na Agricultura; UFPB: Campina Grande, Brazil, 1999; p. 153. [Google Scholar]
  20. Bernardo, S.; Mantovani, E.C.; Silva, D.D.; Soares, A.A. Manual De Irrigação, 9th ed.; Editora UFV: Viçosa, Brazil, 2019; p. 545. [Google Scholar]
  21. Rhoades, J.D.; Kandiah, A.; Mashali, A.M. Uso De Águas Salinas Para Produção Agrícola; UFPB: Campina Grande, Brazil, 2000; p. 117. [Google Scholar]
  22. Marrocos, S.T.P.; Dantas, M.S.M.; Dombroski, J.L.D.; Lucena, R.R.M.; Batista, T.M.V. Análise comparativa de métodos de estimativa de área foliar em beterraba. Rev. Verde De Agroecol. E Desenvolv. Sustentável 2010, 5, 140–146. [Google Scholar]
  23. Resende, G.M.; Cordeiro, G.G. Uso De Água Salina e Condicionador do Solo na Produtividade de Beterraba e Cenoura No Semi-Árido Do Submédio São Francisco; Embrapa Semi-Árido: Petrolina, Brazil, 2007; p. 4. [Google Scholar]
  24. Silva, F.A.S.; Azevedo, C.A.V. The Assistat Software Version 7.7 and its use in theanalysis of experimental data. Afr. J. Agric. Res. 2016, 39, 3733–3740. [Google Scholar]
  25. Bechtaoui, N.; Rabiu, M.K.; Raklami, A.; Oufdou, K.; Hafidi, M.; Jemo, M. Phosphate-Dependent Regulation of Growth and Stresses Management in Plants. Front. Em Plant Sci. 2021, 12, 679916. [Google Scholar] [CrossRef] [PubMed]
  26. Silva, G.A.; Grangeiro, L.C.; Sousa, V.D.F.; Silva, L.R.; Jesus, P.M.; Silva, J.L. Desempenho agronômico de cultivares de beterraba em função da adubação fosfatada. Rev. Bras. De Eng. Agríc. E Ambient. 2019, 23, 518–523. [Google Scholar] [CrossRef]
  27. Bonfim-Silva, E.M.; Silva, I.D.F.; Ribeiro, J.M.; Souza Fernandes, W.; Nonato, J.J. Calagem e adubação fosfatada no cultivo rabanete em Latossolo Vermelho Liming and phosphate fertilization for rabanette cultivated in Red Oxisol. Braz. J. Dev. 2021, 7, 78970–78986. [Google Scholar] [CrossRef]
  28. Avalhaes, C.C.; Mello Prado, R.; Oliveira Gondim, A.R.; Alves, A.U.; Correia, M.A.R. Rendimento e crescimento da beterraba em função da adubação com fósforo. Sci. Agrár. 2009, 10, 75–80. [Google Scholar] [CrossRef]
  29. Cordeiro, C.F.D.S.; Echer, F.R.; Batista, G.D.; Fernandes, A.M. Sweet potato yield and quality as a function of phosphorus fertilization in different soils. Rev. Bras. De Eng. Agrícola E Ambient. 2023, 27, 487–495. [Google Scholar] [CrossRef]
  30. Dey, G.; Banerjee, P.; Sharma, R.K.; Maity, J.P.; Etesami, H.; Shaw, A.K.; Huang, Y.H.; Huang, H.B.; Chen, C.Y. Management of phosphorus in salinity-stressed agriculture for sustainable crop production by salt-tolerant phosphate-solubilizing bacteria—A review. Agronomy 2021, 11, 1552. [Google Scholar] [CrossRef]
  31. Santos, D.P.D.; Santos, C.S.D.; Silva, P.F.D.; Pinheiro, M.P.M.A.; Santos, J.C. Crescimento e fitomassa da beterraba sob irrigação suplementar com água de diferentes concentrações salinas. Rev. Ceres 2016, 63, 509–516. [Google Scholar] [CrossRef]
  32. Sá, F.V.S.; Ferreira Neto, M.; Lima, Y.M.; Paiva, E.P.; Prata, R.C.; Lacerda, C.F.; Brito, M.E.B. Growth, gas exchange and photochemical efficiency of the cowpea bean under salt stress and phosphorus fertilization. Comun. Sci. 2018, 9, 668–679. [Google Scholar] [CrossRef]
  33. Dourado, P.R.M.; Souza, E.R.; Santos, M.A.D.; Lins, C.M.T.; Monteiro, D.R.; Paulino, M.K.S.S.; Schaffer, B. Stomatal regulation and osmotic adjustment in sorghum in response to salinity. Agriculture 2022, 12, 658. [Google Scholar] [CrossRef]
  34. Chagas, L.F.B.; Martins, A.L.L.; Carvalho Filho, M.R.; Oliveira Miller, L.; Oliveira, J.C.; Junior, A.F.C. Bacillus subtilis e Trichoderma sp. no incremento da biomassa em plantas de soja, feijão-caupi, milho e arroz. Agri-Environ. Sci. 2017, 3, 10–18. [Google Scholar] [CrossRef]
  35. Mupambi, G.; Anthony, B.M.; Layne, D.R.; Musacchi, S.; Serra, S.; Schmidt, T.; Kalcsits, L.A. The influence of the protection network on the physiology of the tree and the quality of the apple fruit: A review. Sci. Hortic. 2018, 236, 60–72. [Google Scholar] [CrossRef]
  36. Silva, L.V.D.; Oliveira, S.B.R.D.; Azevedo, L.A.D.; Rodrigues, A.C.; Bonifácio, A. Coinoculação com bradyrhizobium e trichoderma altera os efeitos do estresse salino em feijão-caupi. Rev. Caatinga 2019, 32, 336–344. [Google Scholar] [CrossRef]
  37. Pinho, L.L.; Lacerda, C.F.D.; Sousa, J.A.D.; Santos, A.M.; Bezerra, A.M.E.; Cavalcante, E.S. Effects of artificial shading and irrigation with brackish water on the initial development of Anadenanthera colubrina (vell.) brenan plants. Rev. Árvore 2022, 46, 1–12. [Google Scholar] [CrossRef]
  38. Ahmad, P.; Hashem, A.; Abd-Allah, E.F.; Alqarawi, A.A.; John, R.; Egamberdieva, D.; Gucel, S. Papel de Trichoderma harzianum na mitigação do estresse por NaCl em mostarda-da-índia (Brassica juncea L.) por meio do sistema de defesa antioxidante. Front. Na Ciência Veg. 2015, 6, 868. [Google Scholar]
  39. Rodrigues, V.D.S.; Sousa, G.G.D.; Soares, S.D.C.; Leite, K.N.; Ceita, E.D.A.R.D.; Sousa, J.T.M.D. Gas exchanges and mineral content of corn crops irrigated with saline water. Rev. Ceres 2021, 68, 453–459. [Google Scholar] [CrossRef]
  40. Razaq, M.; Zhang, P.; Shen, H.; Salahuddin. Influence of nitrogen and phosphorus on the growth and root morphology of Acer mono. PLoS ONE 2017, 12, e0171321. [Google Scholar] [CrossRef] [PubMed]
  41. Lima, G.S.; Félix, C.M.; Silva, S.S.; Soares, L.A.A.; Gheyi, H.R.; Soares, M.D.M.; Sousa, P.F.N.; Fernandes, P.D. Gas exchange, growth, and production of mini-watermelon under saline water irrigation and phosphate fertilization. Semina 2020, 41, 3039–3052. [Google Scholar] [CrossRef]
  42. Sousa, A.E.C.; Lacerda, C.F.; Gheyi, H.R.; Soares, F.A.L.; Uyeda, C.A. Teores de nutrientes foliares e respostas fisiológicas em pinhão manso submetido a estresse salino e adubação fosfatada. Rev. Caatinga 2012, 25, 144–152. [Google Scholar]
  43. Masrahi, A.S.; Alasmari, A.; Shahin, M.G.; Qumsani, A.T.; ORABY, H.F.; Awad-Allah, M.M. Role of Arbuscular Mycorrhizal Fungi and Phosphate Solubilizing Bacteria in Improving Yield, Yield Components, and Nutrients Uptake of Barley under Salinity Soil. Agriculture 2023, 13, 537. [Google Scholar] [CrossRef]
  44. Frasca, L.L.D.M.; Nascente, A.S.; Lanna, A.C.; Carvalho, M.C.S.; Costa, G.G. Biostimulants in plant growth and agronomic performance of common bean super-cycle cycle. Agrarian 2020, 13, 27–41. [Google Scholar] [CrossRef]
  45. Mendoza, A.; Zaid, R.; Lawry, R.; Hermosa, R.; Monte, E.; Horwitz, B.; Mukherjee, P.K. Molecular dialogues between Trichoderma and roots: Role of the fungal secretome. Fungal Biol. Rev. 2018, 32, 62–85. [Google Scholar] [CrossRef]
  46. Lima, A.F.S.; Santos, M.F.; Oliveira, M.L.; Sousa, G.G.; Mendes Filho, P.F.; Luz, L.N. Physiological responses of inoculated and uninoculated peanuts under saline stress. Rev. Ambiente Água 2021, 16, e2643. [Google Scholar] [CrossRef]
  47. Luz, J.M.Q.; Queiroz, A.A.; Borges, M.; Oliveira, C.R.; Leite, S.S.; Cardoso, R.R. Influence of phosphate fertilization on phosphorus levels in the production of foliage and tubers of the potato cv. Agate. Semin. Agric. Sci. 2013, 2, 649–656. [Google Scholar] [CrossRef]
  48. Gashash, E.A.; Ashmawi, A.E.; El-Taher, A.M.; Osman, N.A.; Elkelish, A. Effect of fertilizing with different levels of phosphorous and zinc on the botanical characteristics of table beet (Beta vulgaris L.). Not. Bot. Horti Agrobot. Cluj-Napoca 2022, 50, 12579. [Google Scholar] [CrossRef]
  49. Freire, J.L.O.; Nascimento, G.S.; Medeiros, A.K.A. Teores e acúmulos de nutrientes em mudas de maracujazeiros sob salinidade hídrica e uso de urina de vaca. Nativa 2020, 8, 464–475. [Google Scholar] [CrossRef]
  50. Ghaly, F.; Abd-Hady, M.; Abd-Elhamied, A. Effect of varieties, phosphorus and boron fertilization on sugar beet yield and its quality. J. Soil Sci. Agric. Eng. 2019, 10, 115–122. [Google Scholar] [CrossRef]
  51. Nascimento, M.V.; Fernandes, L.R.S.G.; Xavier, R.C.; Benett, K.S.S.; Silva, L.M. Adubação fosfatada no cultivo de hortaliças produtoras de raízes. Rev. De Agric. Neotrop. 2017, 4, 8–16. [Google Scholar] [CrossRef]
  52. Silva, S.S.; Lima, G.S.; Lima, V.L.A.; Gheyi, H.R.; Soares, L.A.A.; Melo, J.P. Production and quality of watermelon fruits under salinity management strategies and nitrogen fertilization. Semin Ciências Agrárias Londrina 2020, 41, 2923–2936. [Google Scholar] [CrossRef]
  53. Paiva, F.I.G.; Oliveira, F.A.; Medeiros, J.F.; Tarjino, A.J.O.; Santos, S.T.; Silva, R.C.P. Qualidade de tomate em função da salinidade da água de irrigação e relações K/Ca via fertirrigação. Irriga 2018, 23, 168–193. [Google Scholar] [CrossRef]
  54. Santos, F.L.; Costa, E.S.; Lima, C.S.M. Diferentes substratos no desenvolvimento e na pós-colheita de microverdes de beterraba (Beta vulgaris L.). Rev. Iberoam. De Tecnol. Postcosecha 2020, 21, 2. [Google Scholar]
  55. Nascimento, J.A.M.; Cavalcante, L.F.; Dantas, S.A.G.; Silva, S.A.; Dias, T.J. Biofertilizante e adubação mineral na qualidade de frutos de maracujazeiro irrigado com água salina. Irriga 2015, 20, 220–232. [Google Scholar] [CrossRef]
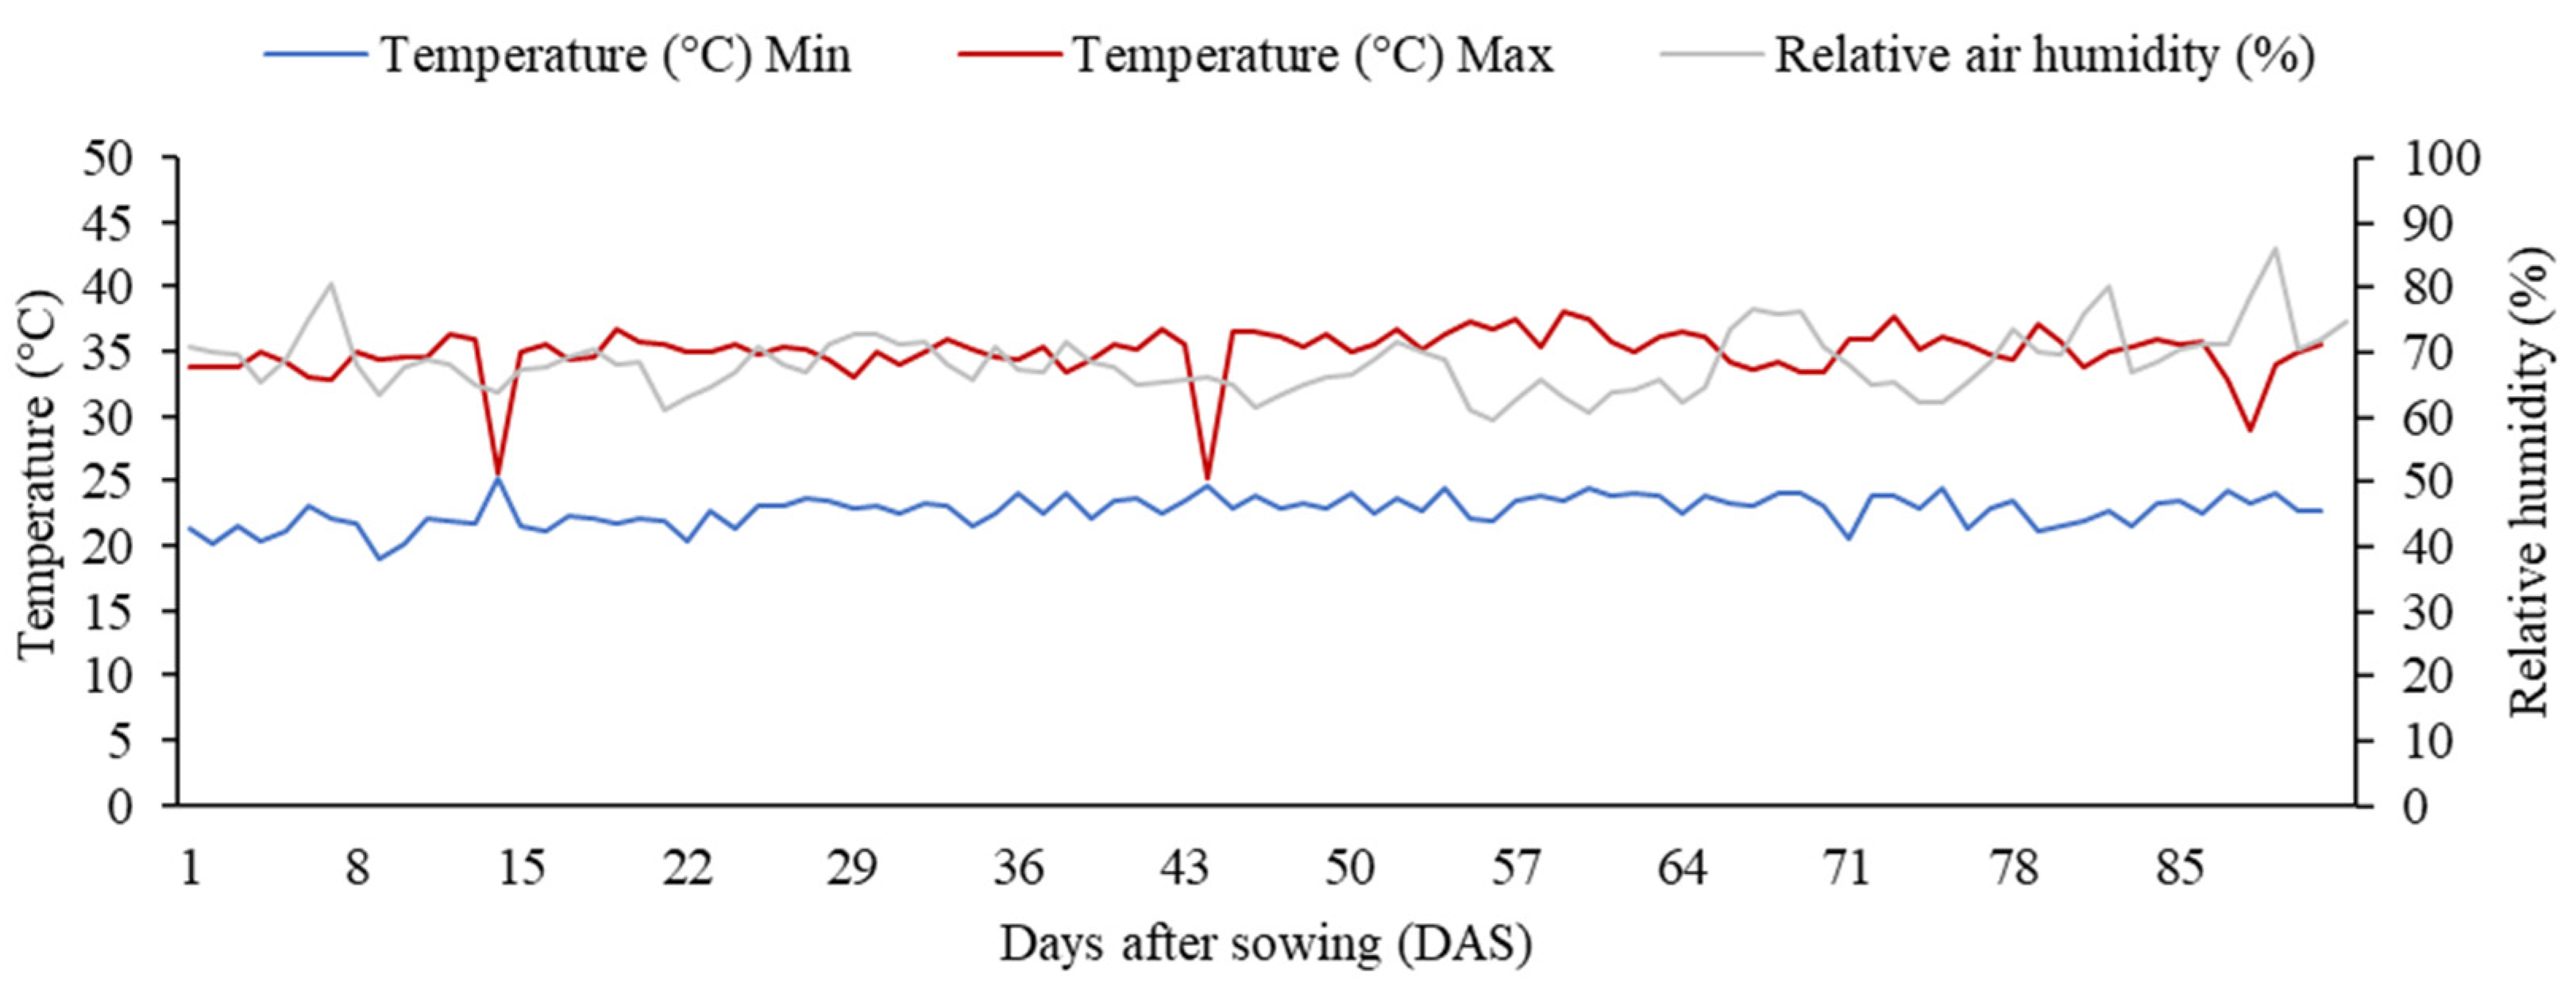
Figure 1. Maximum and minimum temperature and relative humidity during experimental period.
Agronomy 14 01306 g001
Figure 2. A schematic of the experimental design involving the factors studied: electrical conductivity of the water, inoculation and phosphorus doses.
Agronomy 14 01306 g002
Figure 3. Plant height (A), number of leaves (B) and leaf area (C) of beet subjected to doses of phosphate fertilization, and leaf area (D) as a function of the electrical conductivity of the irrigation water. Averages followed by the same letter do not differ according to Tukey’s test at a 5% significance level. Vertical bars represent standard error (n = 6).
Agronomy 14 01306 g003
Figure 4. Shoots’ dry mass in beet plants subjected to doses of phosphate fertilization and use of low- and high-salinity water. The lowercase letters compare the average values of the doses of P2O5 within the electrical conductivities of the water, while the uppercase letters compare the same electrical conductivity within the doses of P2O5. Vertical bars represent standard error (n = 6).
Agronomy 14 01306 g004
Figure 5. Photosynthesis (A) and transpiration (B) subjected to phosphate fertilization, electrical conductivities of the irrigation water and in the presence and absence of the inoculant (CI and SI). Stomatal conductance as a function of phosphate fertilization (C) and electrical conductivity of the irrigation water (D). The lowercase letters compare the average values between fertilizer doses in the absence and presence of Trichoderma at each electrical conductivity of the water, and the uppercase letters compare the average values within the same fertilizer dose in the absence and presence of Trichoderma at each electrical conductivity of the water. Averages followed by the same letter do not differ according to Tukey’s test at a 5% significance level. Vertical bars represent standard error (n = 6).
Agronomy 14 01306 g005
Figure 6. Leaf temperature (A) subjected to doses of phosphate fertilization and electrical conductivities of the irrigation water, and leaf temperature as a function of phosphate fertilization and in the presence and absence of the inoculant (CI and SI) (B). Leaf temperature (C) as function of electrical conductivity of irrigation water and inoculation, and internal CO2 concentration as function of phosphate fertilization and electrical conductivity of irrigation water (D). The lowercase letters compare the average values of the electrical conductivities of the water within the same P2O5 recommendation, while the uppercase letters compare the same electrical conductivity within the doses of phosphate fertilization. Lowercase letters compare the average values with and without Thichoderma for the same P2O5 recommendation, while uppercase letters compare the absence and presence of Thichoderma within the phosphate fertilizer doses. Lowercase letters compare the average values of the absence and presence of Thichoderma within the same electrical conductivity of the water, while uppercase letters compare the same electrical conductivity within the doses of phosphate fertilization. Vertical bars represent standard error (n = 6).
Agronomy 14 01306 g006
Figure 7. Tuberous root mass (A) and productivity (B) subjected to doses of phosphate fertilization. Tuberous root diameter (C) as a function of phosphate fertilization, electrical conductivity of irrigation water and in presence and absence of inoculant (CI and SI). Tuberous root length (D) subjected to doses of phosphate fertilization. Averages followed by the same letter do not differ by Tukey’s test at a 5% significance level. The lowercase letters compare the average values between fertilizer doses in the absence and presence of Trichoderma at each electrical conductivity of the water, and the uppercase letters compare the average values within the same fertilizer dose in the absence and presence of Trichoderma at each electrical conductivity of the water. Vertical bars represent standard error (n = 6).
Agronomy 14 01306 g007
Figure 8. pH of the tuberous root (A) subjected to doses of phosphate fertilization and electrical conductivities of the irrigation water, and as a function of doses of phosphate fertilization and in the presence and absence of the inoculant (CI and SI) (B). The lowercase letters compare the average values of the electrical conductivities of the water within the same P2O5 recommendation, while the uppercase letters compare the same electrical conductivity within the doses of phosphate fertilization. Lowercase letters compare the absence and presence of Trichoderma within the same phosphorus recommendation, while uppercase letters compare the presence or absence of Trichoderma within the three doses of P2O5. Vertical bars represent standard error (n = 6).
Agronomy 14 01306 g008
Table 1. Chemical characteristics of substrate.
O.MNCa²+K+Mg2+Na+PpHESPECw
(g kg−1)(cmolc dm−3)(mg kg−1)(H2O) (dS m−1)
4.860.2910.241.10.11.005.820.29
O.M—Organic Matter; ESP—Exchangeable Sodium Percentage; ECw—Electrical Conductivity of Water.
Table 2. A summary of the analysis of variance for plant height (PH), number of leaves (NL), leaf area (LA) and shoots’ dry mass (SDM) as a function of phosphate fertilization, the electrical conductivities of the water and inoculant at 37 DAT.
Mean Squares
SVDFPHNLLASDM
Doses—D219.1556 **4.6411 *14.5094 **4.7904 ns
Water Salinity—WS13.0910 ns1.1216 ns4.0535 *2.6982 ns
Inoculant—I10.2804 ns0.6032 ns1.0641 ns0.0012 ns
D × W21.5163 ns1.9890 ns2.8658 ns10.8139 *
D × I20.7334 ns2.6072 ns0.9479 ns1.3841 ns
WS × I10.5673 ns0.4038 ns0.0143 ns0.4317 ns
D × WS × I21.0031 ns0.5533 ns0.5239 ns1.1728 ns
Treatments11
Residue60
Total71
CV (%) 25.831.3825.3131.78
OM 20.425165.3194415.338596.83042
SV—source of variation; DF—degree of freedom; CV—coefficient of variation; OM—overall mean; ** (p < 0.01); * (0.01 ≤ p < 0.05); ns—not significant (p ≥ 0.05).
Table 3. Summary of analysis of variance for photosynthesis (A), transpiration (E), stomatal conductance (gs), internal CO2 concentration (Ci) and leaf temperature (LT) as function of phosphate fertilization, electrical conductivities of water and inoculant at 37 DAT.
Mean Squares
SVDFAEgsCiLT
Doses—D27.3539 **11.9426 **9.0021 **0.4968 ns111.8156 **
Water Salinity—WS125.4585 **22.4801 **17.2475 **0.0856 ns1.7193 ns
Inoculant—I10.9285 ns8.1310 **1.8596 ns0.9240 ns31.5789 **
D × WS24.8148 *0.1094 ns0.3288 ns5.1102 *32.6405 **
D × I22.2854 ns0.4389 ns1.3958 ns1.1812 ns36.6581 **
WS × I16.6086 *6.4680 *1.6944 ns0.2698 ns4.2456 *
D × WS × I25.5218 **3.8545 *2.1010 ns0.6703 ns0.9561 ns
Treatments11
Residue36
Total47
CV (%) 27.6520.1239.0815.575.60
OM 1.235.056285.4720.15889206.972223.413.333
SV—source of variation; DF—degree of freedom; CV—coefficient of variation; OM—overall mean; ** (p < 0.01); * (0.01 ≤ p < 0.05); ns—not significant (p ≥ 0.05).
Table 4. Summary of analysis of variance for tuberous root mass (TRM), productivity (PROD), tuberous root diameter (TRD), tuberous root length (TRL), soluble solids (°BRIX) and tuber root pH (pH) at 80 DAT.
Mean Square
SVDFTRMPRODTRDTRL°BRIXpH
Doses—D25.2064 *5.2064 *4.3043 *5.2746 **1.9528 ns178.6896 **
Water Salinity—WS11.8959 ns1.8959 ns2.1453 ns0.7942 ns0.0196 ns34.4705 **
Inoculant—I 10.2946 ns0.2946 ns0.5125 ns0.5805 ns0.5818 ns12.7840 **
D × WS20.3422 ns0.3422 ns1.8221 ns0.3966 ns0.1577 ns22.0982 **
D × I23.1136 ns3.1136 ns1.7582 ns1.2701 ns2.5779 ns5.1356 *
WS × I10.2685 ns0.2685 ns0.2407 ns0.8729 ns0.0700 ns0.0720 ns
D × WS × I21.0202 ns1.0202 ns5.7425 **1.1188 ns0.8914 ns2.4745 ns
Treatments11
Residue36
Total47
CV (%) 26.2926.2923.3122.1527.6211.97
OM 33.89549753.2330239.417333.27292.464585.55632
SV—source of variation; DF—degree of freedom; CV—coefficient of variation; OM—overall mean; ** (p < 0.01); * (0.01 ≤ p < 0.05); ns—not significant (p ≥ 0.05).
Disclaimer/Publisher’s Note: The statements, opinions and data contained in all publications are solely those of the individual author(s) and contributor(s) and not of MDPI and/or the editor(s). MDPI and/or the editor(s) disclaim responsibility for any injury to people or property resulting from any ideas, methods, instructions or products referred to in the content.