Article

Assessment of Soil Enzyme Activities in Plant Root Zone of Saline Soil Reclaimed by Drip Irrigation with Saline Groundwater

College of Hydraulic Science and Engineering, Yangzhou University, Yangzhou 225009, China
*
Author to whom correspondence should be addressed.
Agronomy 2024, 14(7), 1416; https://doi.org/10.3390/agronomy14071416
Submission received: 28 April 2024 / Revised: 27 June 2024 / Accepted: 27 June 2024 / Published: 29 June 2024
(This article belongs to the Special Issue Influence of Irrigation and Water Use on Agronomic Traits of Crop)

Abstract

:
Drip irrigation with saline water is frequently adopted to realize the sustainable utilization of saline–sodic soil with high water tables, and soil enzyme activities can be used to indicate changes in soil quality. In the current study, spatiotemporal changes in soil urease enzyme (URE), alkaline phosphatase (ALP) and invertase (INV) activities were investigated during consecutive growing seasons. Soil in beds was sampled before planting (0 y) and one, two, three and four years after the growing season (1 y, 2 y, 3 y, 4 y), and these samples were distributed at four horizontal distances from the drip line (0, 10, 20 and 30 cm) and four vertical soil depths (0–10, 10–20, 20–30 and 30–40 cm). The results showed that a distribution pattern of URE and ALP activities formed during the first growing season, while the distribution of INV activity formed until the third growing season. All three soil enzyme activities in the upper soil layers and positions close to the drip line were more greatly affected by planting year. The average URE activity of the soil profile decreased slightly during the first year and increased by about 220% and decreased by 20% after reclamation for two and three years, and finally, it increased to 4.9 μg NH4+·g−1·h−1 at the end of the fourth growing season. ALP activity remained stable during the first two years and rapidly increased in the following years; in particular, in the fourth year, it reached 32.7 μg ph(OH)·g−1·h−1. INV activity increased continually with the number of years after planting and reached 1009.0 μg glu·g−1·h−1 at the fourth season’s end. An analysis of variance indicated that URE, ALP and INV activities varied insignificantly among the time points of 0 y, 1 y, 2 y and 3 y (p < 0.05), while they were significantly higher for 4 y than for 0 y and 1 y. In addition, all three enzyme activities of the soil profile had an exponentially increasing trend with the number of years after planting. These results indicated the soil quality in saline–sodic soils could be improved with time under drip irrigation with local saline groundwater, especially around the drip line.

1. Introduction

In the Yinchuan Plain of the Ningxia Region, northeast China, approximately 67.3% of the farmland is composed of saline–sodic soil. Of this farmland, 31.4% contains salt contents ranging from 0.2% to 0.4%, 21.7% contains salt contents ranging from 0.4% to 0.6%, and 14.2% contains salt contents exceeding 0.6%. Saline–sodic soil covers 15.28%, 25.6 and 42.37% of the farmland in the upper, middle and lower parts of the plain, respectively [1]. The high soil salt content adversely affects plant growth due to issues such as ion toxicity and physiological drought [2,3]. Consequently, saline–sodic soil has become a major restricting factor for agricultural development, resulting in food insecurity and economic stagnation [4]. Local farmers have tried to reclaim and utilize the saline–sodic soil using traditional methods such as furrow drainage, rice cultivation or paddy–upland rotation, and leaching [5,6,7]. While many saline–sodic soils have successfully reclaimed over time, challenges persist on the western side of the Yellow River in the northern part of the plain. Here, factors including a high water table, lack of drainage, frequent seasonal salinization and desalinization cycles, and high groundwater salinity hinder sustainable reclamation efforts [8,9,10]. Adequate soil drainage is essential for successful soil amelioration by these traditional methods [11,12]. In areas lacking adequate drainage, soil salinity has exacerbated post-reclamation. Addressing drainage deficiencies is essential for sustainable agricultural development and soil amelioration in regions with saline–sodic soils.
Drip irrigation offers several advantages such as regular and frequent water application, the maintenance of high water potential in the root-zone soil, a decrease in soil surface evaporation, and the movement of soil salts towards the wetting front, thereby decreasing soil salt concentrations in the root zone [13,14,15]. Furthermore, drip irrigation enhances crop salt tolerance thresholds by altering salt distribution patterns, sustaining higher matric potentials [16] and compensating for osmotic potential caused by saline water [17]. In recent years, drip irrigation with fresh water has been successfully utilized to manage saline–sodic soils, achieving high crop yields and effective control of soil salinity [18,19,20,21,22,23]. Building upon the previous research and considering the hydrogeological conditions along the western side of the Yellow River in the northern part of the Yinchuan Plain, drip irrigation was employed to reclaim saline–sodic soils. Given the absence of fresh or mildly salty water, a drip irrigation system with highly salty groundwater (ECw value at 7.8 dS m−1 or higher) can be used to enhance salt leaching from soils. After several years of implementation, the saline–sodic soils were successfully and sustainably reclaimed: L. barbarum exhibited vigorous growth in the first year, with subsequent years yielding high-quality fruit and significant crop productivity compared to that grown on fertile soil and irrigated with fresh water. These outcomes indicate effective soil amelioration during the utilization process.
The feasibility of drip irrigation was the first step in our research, but evaluating soil quality solely based on crop survival is difficult for optimizing irrigation parameters. The core of saline–sodic land amelioration lies in the evolution of soil quality. Multiple indicators, encompassing physical, chemical, biological and biochemical aspects, are utilized to estimate soil quality. When selecting these indicators, it is important to consider their sensitivity to soil management, sampling error, measurement cost and required time. Soil enzyme activities provide an early indication of soil quality, as they are involved in the mineralization of nutrients such as N, P and C [24,25]. Soil enzymes, products of biological activities, reflect the circumstances of biological metabolism and substance transformation, thereby characterizing the direction and magnitude of biochemical processes [26,27,28]. Their activities are intricately linked to soil physics properties, chemical composition and agricultural practices, making them highly sensitive to changes in soil–crop management. Indeed, soil enzyme activities have been shown to exhibit 1–2 times the sensitivity of other indicators [29,30]. Consequently, soil enzyme activity is a valuable indicator for monitoring soil development and the degree of soil alteration during soil utilization [31].
Soil enzymes are very important for executing fundamental catalytic activities and facilitating abundant biological processes across various soil types, directly influencing soil health. For example, the urease enzyme (URE) catalyzes the hydrolysis of urea fertilizer applied to the soil, resulting in NH3 and CO2. Given its integral role in the nitrogen cycle, the urease enzyme is often used as an important index of short-term nitrogen levels in soil. In addition, the urease enzyme, as a catalyst, accelerates the decomposition of organic substances and the release of nutrients. Thus, it can be used as a gauge for soil fertility and productivity. Alkaline phosphatase (ALP), which can convert phosphorus components into bioavailable active phosphorus, plays an important role in the mineralization process of phosphorus-containing organic matter [32]. ALP is also an important factor in measuring the conversion potential and replenishment mechanism of organic phosphorus in the environment [25]. Its activity in soil has ecological significance in understanding phosphorus migration and transformation in soil. Invertase (INV), being a common and predominant enzyme in soils, is vital for catalyzing the hydrolysis and biodegradation of various monosaccharides present in plant debris decomposing in the ecosystem. INV is characteristically useful as a soil quality indicator, may give a reflection of past biological activity and the capacity of soil to stabilize the soil organic matter, and can be used to detect management effects on soils. These three enzyme activities mentioned above are correlated to the mineralization of N, P and C, respectively, so they can be used as indicators of soil quality.
Since Lycium barbarum L. survives and grows over successive planting seasons, in this study, we hypothesized that in the experiment field, after irrigation with saline water, the three enzyme activities as important indicators of soil quality might be improved with an increase in the number of years after planting. And the potential for soil utilization could be given from the viewpoint of enzyme activities. Therefore, the objectives of this study were to (1) investigate whether the three enzyme activities increased as the soil was irrigated by drip irrigation with saline water and (2) analyze the spatial distribution of enzyme activities in the root zone, and thus estimate the changes in soil environment conditions. To achieve this goal, URE, ALP and INV activities were monitored and analyzed.

2. Materials and Methods

2.1. Experiment Site

The field experiment was conducted at Lingsha, in Pingluo County, Ningxia Hui Autonomous Region, China (38°59′ N, 106°45′ E and 1095 m above sea level). The area consists mainly of an alluvial–proluvial plain and is characterized by an arid climate with a mean annual temperature of 9 °C. Most of the mean annual precipitation of about 185 mm is received during June–September. The mean annual evaporation is 1825 mm, almost ten times the mean annual precipitation.
The experimental field had a saline–sodic soil which had not previously been cultivated, and the water table was about 30–40 cm in depth. The dominant soil was an aridisol of silt texture (7.6% sand, 92% silt and 0.4% clay). The average soil bulk density was 1.32 g·cm−3, and the gravimetric saturated soil water content was 38.3%. Average organic matter content in the 0–40 cm layer was 0.51%. Soil salts mainly accumulated in the surface soil, and electrical conductivity of saturated paste extract (ECe) decreased sharply from 62.3 (at 0–10 cm) to <13.5 dS·m−1 (>10 cm), while pH increased from 7.5 to about 7.8 with depth (at 0–40 cm). Sodium (Na+) was the major cation, and chloride (Cl) was the major anion, representing 87.7% of the total cations and 89.5% of total anions in the topsoil (0–10 cm), respectively (as molar ratios) (Table 1).
The groundwater was saline, with a total dissolved solids content of about 7.3 g L−1. The major cation of the groundwater was Na+, representing 89.6% of total cations, and the major anions were Cl and sulfate (SO42−), representing 77.7 and 15.0% of total anions, respectively (Table 2).
Drainage in the experiment field was poor as no feasible drainage system had been built, due to the shallow slope of the area and the high cost of an artificial drainage system. Fresh water was scarce here. Before the experiment, the field was wasteland with sparsely distributed Artemisia anethifolia growing. Therefore, experience gained on this site could be a guide for the utilization of soils in the region.

2.2. Agronomic Practice

During the utilization process, raised beds were built, salt-tolerant plants (Lycium barbarum L.) were planted, plastic film was mulched, saline groundwater was utilized, and fertilizers were fertigated. The high beds, which were built with the dimensions of 0.8 m high, 3 m between bed centers, 75 m long, 0.6 m wide ridge surface, and 58° slope, relatively lowered the groundwater, and the plastic film further decreased soil water evaporation. Lycium barbarum. L, a salt-tolerant perennial plant, was grown as an index of utilization and also biologically ameliorated the saline–sodic soil.
Drip lines with emitters at 0.2 m intervals were placed on the center of each bed, and L. barbarum seedlings were planted adjacent to the emitter at 1 m intervals. Polyethylene mulch, with the same width as the ridge surface, was applied over the beds along the drip lines.
The utilization of local groundwater avoided the risk of raising the water table by applying external fresh water; it lowered the water table as the irrigation water evaporated and was consumed by plants, and it also alleviated the drainage pressure. Fertigation enables soluble fertilizers to be applied with irrigation water more uniformly and more effectively in soil profiles [33,34] and also can supply crop nutrient requirements accurately [16]. Drip irrigation prevented some of the problems of traditional methods, such as waterlogging and raising the water table (as often happens with surface irrigation or leaching), and also the leaf burning caused by sprinkler irrigation using saline water.
Irrigation started immediately after planting, and 36 mm of water was applied during the first 3 d. In the following days, 4 mm of water was irrigated twice daily (8:00–10:00 and 18:00–20:00), with a discharge of 0.6 L·h−1. During the last 3 d of the growing season, about 36 mm of water was applied. Nutrients such as urea, phosphorus acid and potassium nitrate were fertigated daily with irrigation water from 8:00 to 10:00 from 1 May, supplying an average of 270, 67.5 and 135 kg·ha−1, respectively, of each fertilizer during the growing season. The same irrigation and fertigation scheduling was applied in the following years. In 2009, irrigation was initiated on 10 April, immediately after seeding and according to the irrigation schedule. During the growing season, irrigation practice was adjusted and suspended when it rained or when the water table was too high after heavy rainfall. Irrigation ceased on 24 October, and the total water applied was 684 mm.
Nitrogen fertilizer (urea), phosphate fertilizer (phosphoric acid) and potassium fertilizer (potassium nitrate) were all applied by fertigation, and the annual application rate was 270, 67.5 and 135 kg·hm−2, respectively. Other parameters of fertilizer scheduling were the same as local practice.

2.3. Experiment Design

To investigate changes in soil enzyme activities with the number of years after planting, in 2009, an experiment was carried out on beds of four adjacent plots that had been planted in 2006, 2007, 2008 and 2009, respectively. Each plot (each 36 m × 75 m) contained 12 beds, giving a total area of the experiment field of 1.08 ha. Soil samples were extracted on the newly built beds with an auger (2.5 cm in diameter and 10 cm high) before irrigation (0 y) and, at the end of the growing season, soil samples were extracted on beds that had been planted for one (1 y), two (2 y), three (3 y) and four years (4 y). These samplings in the bed profile were made at four locations spaced horizontally 0, 10, 20 and 30 cm from the drip line, respectively, and were taken every 10 cm within 0–40 cm vertically. Three replicates of soil samplings were taken on three soils of each planting year.

2.4. Measurements

Three kinds of soil enzyme activities, urease enzyme (URE, μg NH4+·g−1·h−1), alkaline phosphatase (ALP, μg ph(OH)·g−1·h−1) and invertase (INV, μg glu·g−1·h−1), were measured [35]. The ultimate products of these enzyme-catalyzed reactions were nitrogen sources available to plants, organic groups or inorganic phosphorus, and reducing sugar. After the soil samples were air-dried, divided and passed through a 2 mm mesh, they were kept for later use.
For URE activity, 5 g of air-dried soil sample was mixed with 20 mL of citrate buffer (pH 6.7), 0.1 mL of toluene and 10 mL of 10% urease substrate solution. The mixture was then incubated for 24 h at 37 °C; 50 mL of 1 mol/L KCl solution was added at the end of the incubation, and then the soil suspension was shaken for 30 min. Ammonium was measured at 690 nm with a spectrophotometer (UV 330, Mapada, Shanghai, China).
For ALP activity, 5 g of air-dried soil was first mixed with 20 mL of disodium phenyl phosphate and 0.5 mL of toluene and then incubated for 4 h at 37 °C. Then, 5 mL of the mixture was filtrated. The phenol released by ALP could be measured at 510 nm after reacting with 4-aminophenazone (0.5 mL) and potassium ferricyanide (0.5 mL) using 0.25 mL of ammonium chloride–ammonium hydroxide as a buffer (pH 9.8).
For INV activity, 5 g of air-dried soil was incubated for 24 h at 37 °C with 15 mL 0.5% sucrose, 5 mL phosphate buffer at pH 5.5 and 0.1 mL toluene. The glucose released by INV was then reacted with 3,5-dinitrosalicylic acid and 3-aminonitrosalicylic acid and was measured at 578 nm (UV 330).

2.5. Data Analysis

URE, ALP and INV activities of each horizontal position in soils of each planting year were their average content of all vertical layers under the position, while URE, ALP and INV activities of each layer were their average content of all horizontal positions of the layer.
All data gathered in the study were recorded and classified using Microsoft Office Excel 2023. Analyses of variance (ANOVAs) were conducted using SPSS 26.0 statistical software (SPSS Inc., Chicago, IL, USA). The significance of the effect of all variables was examined by one-way ANOVA. Spatial distributions in a surface made by distance from the emitters (30 cm) and depth of 40 cm were created using Surfer 8.0 (Golden Software Inc., Golden, CO, USA).

3. Results

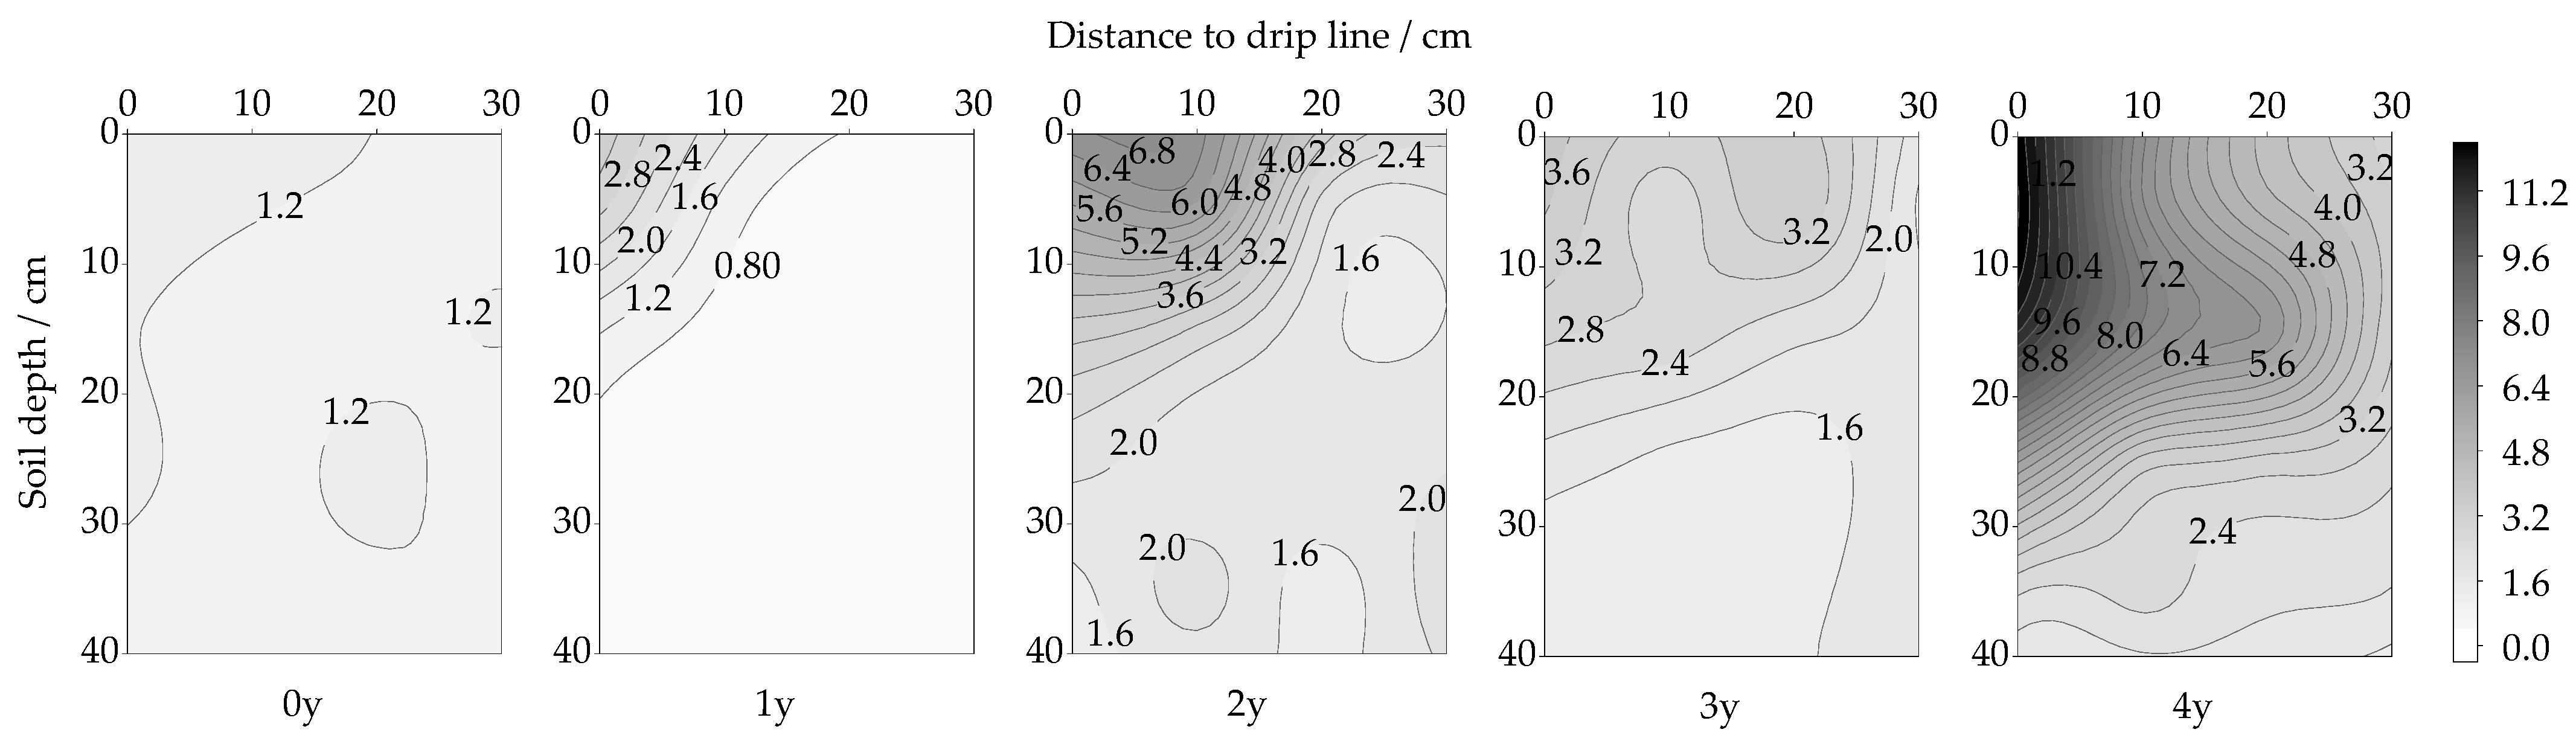
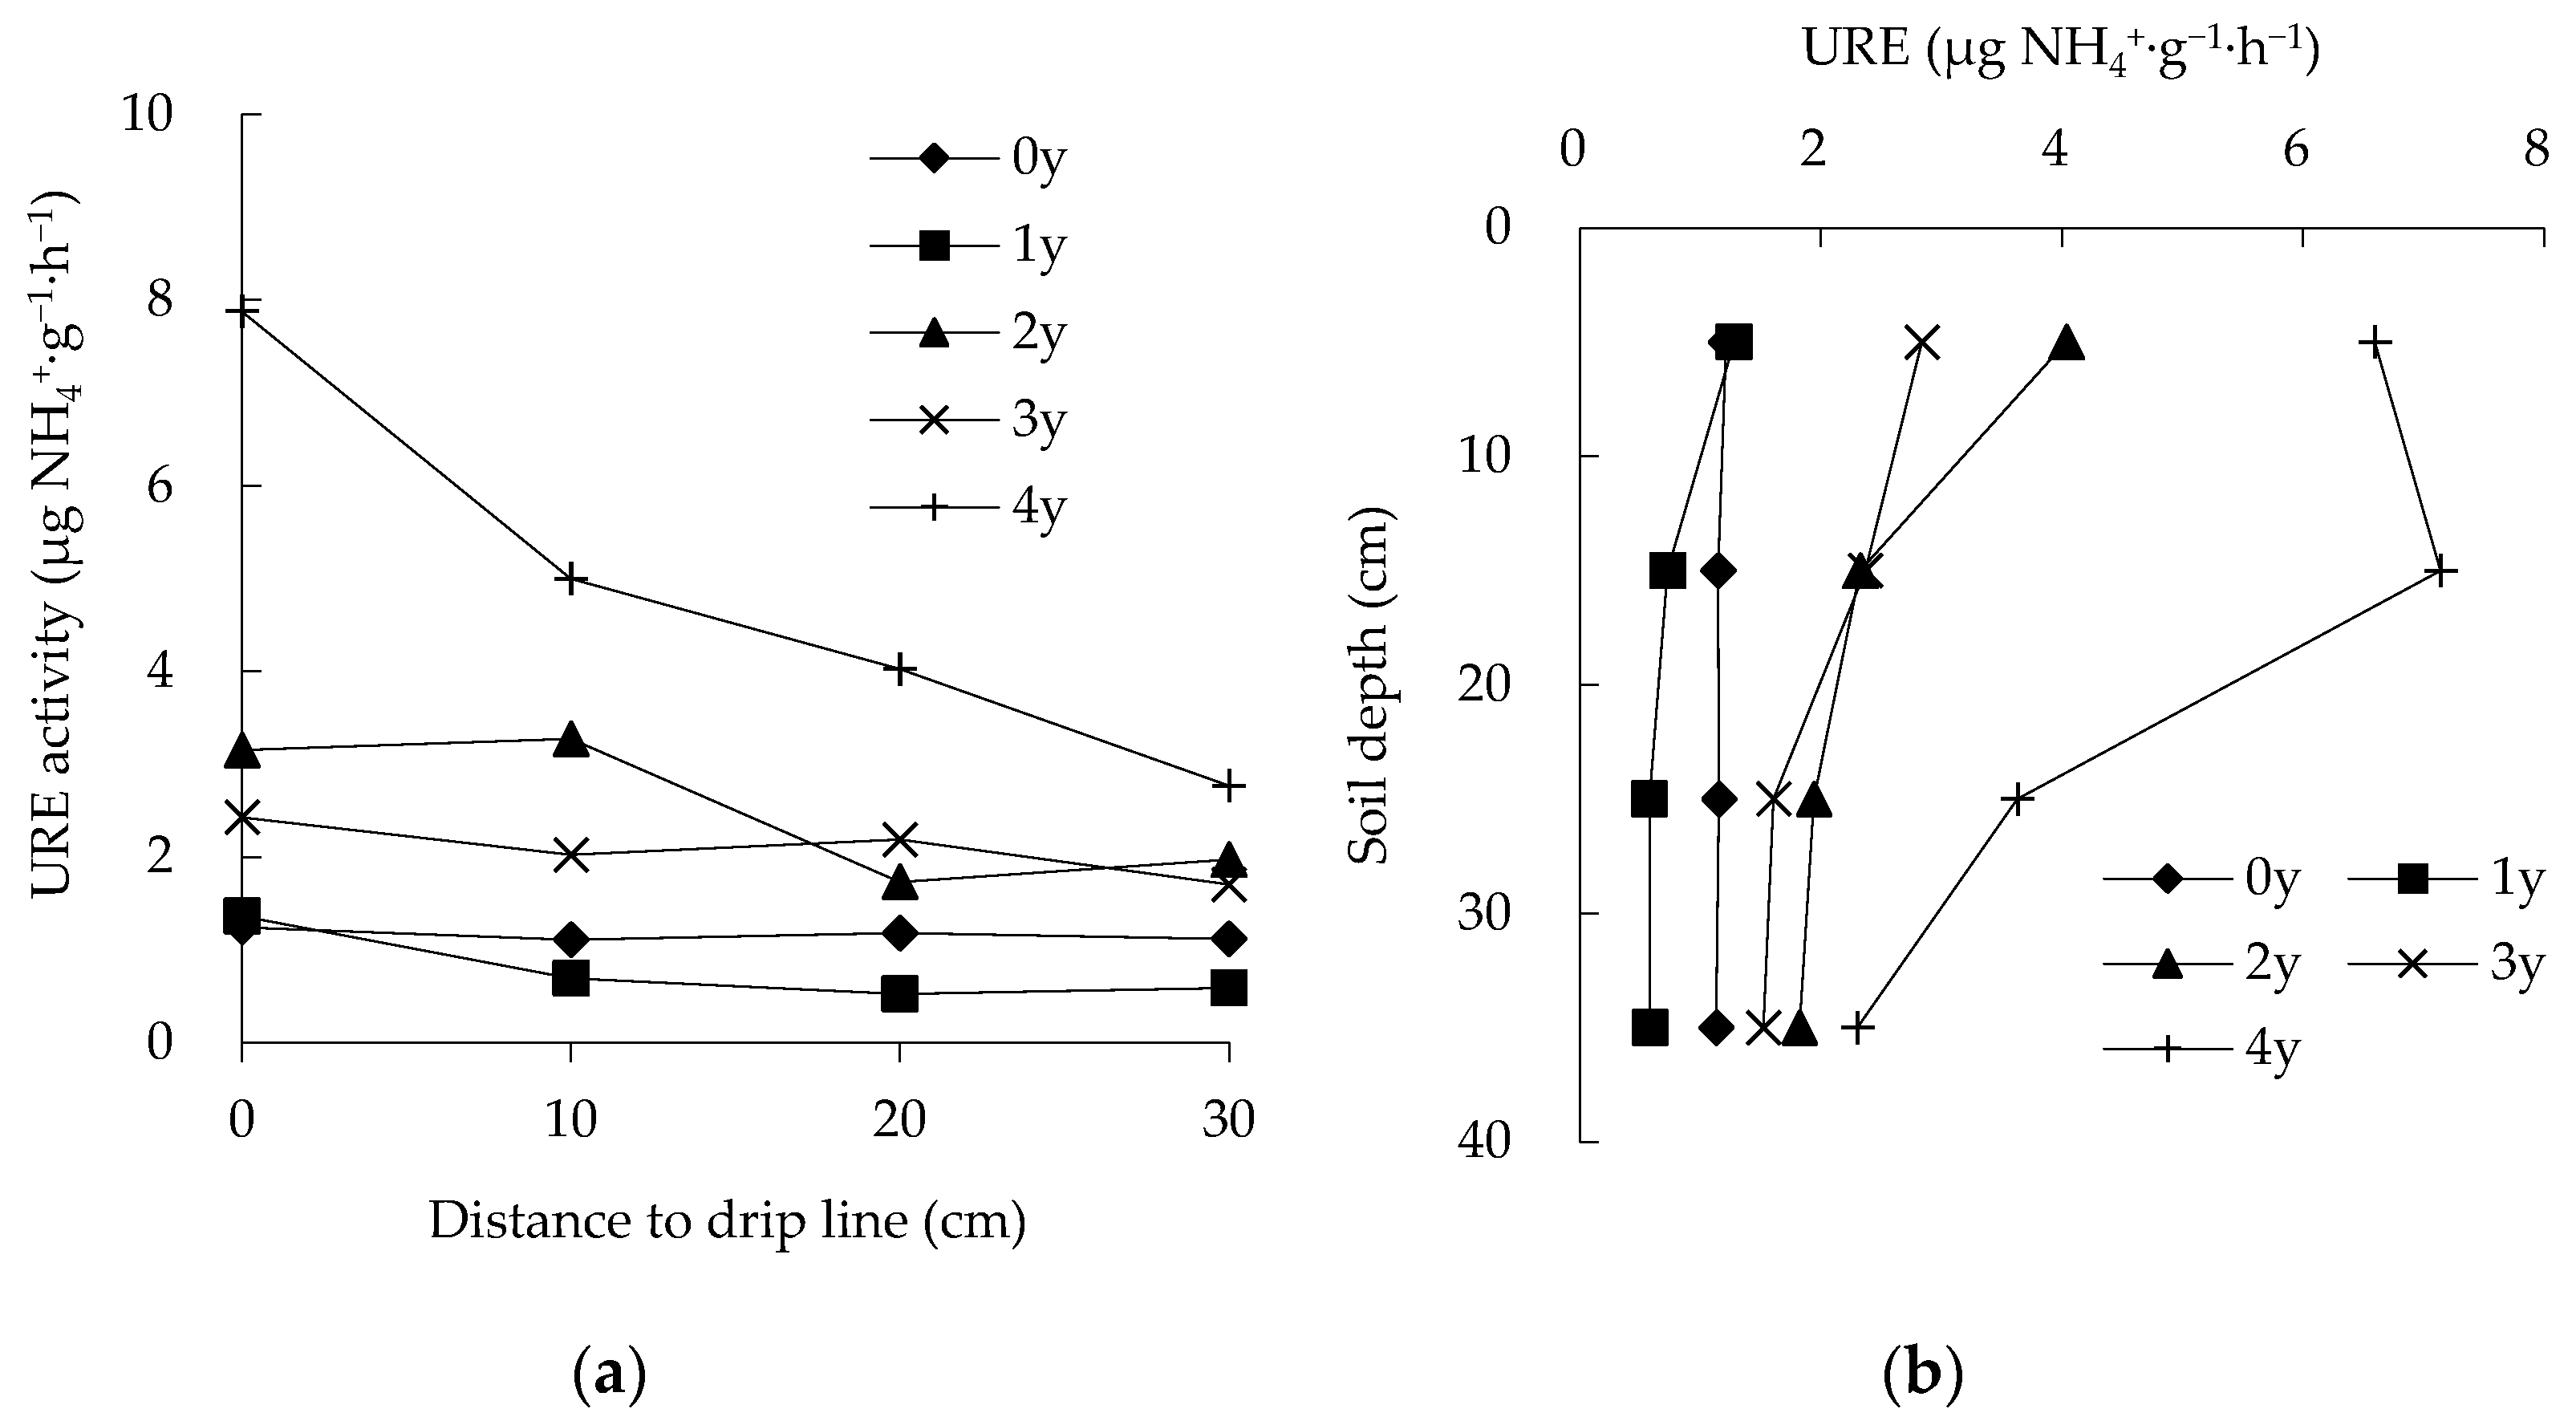
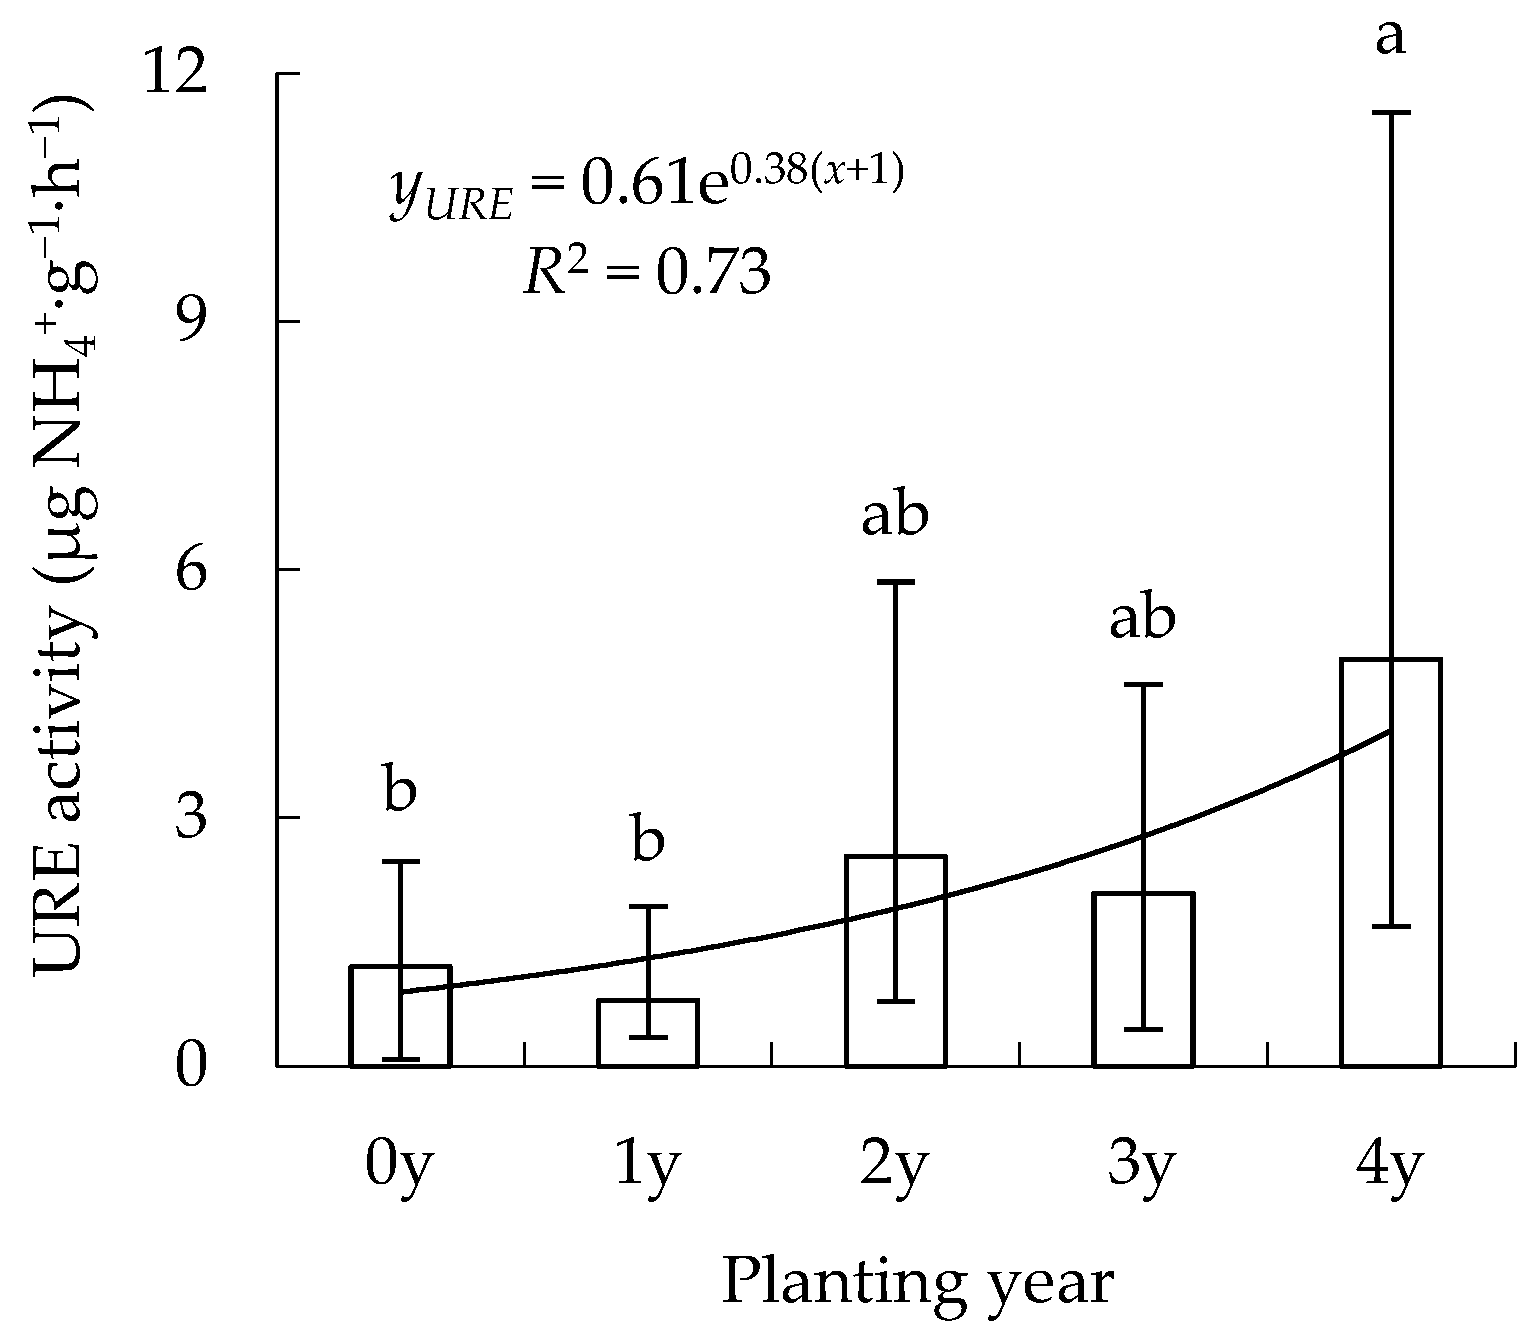
3.1. Spatiotemporal Changes in URE Activity

In soil profiles of 1, 2, 3 and 4 y, URE activity decreased with increased distance from the drip tape; however, in the soil profile of 0 y, activity was about 1.2 μg NH4+·g−1·h−1 with a uniform distribution (Figure 1). In the first year after planting, the effect of drip irrigation on URE activity distribution in the soil profile seemed clear. The URE activity distribution in the soil profile did not vary greatly in the following growing seasons, but the URE activity gradients in the soil profile increased with the number of years after planting (Figure 1), which indicates that URE was distributed more unevenly as the number of years after planting increased.
In the horizontal direction, within 30 cm of the drip line, URE activity changed little with distance for 0 y. However, in the following years, it decreased with increased distance to the drip line, especially for 4 y, decreasing from 7.9 μg NH4+·g−1·h−1 immediately under the drip line to 2.8 μg NH4+·g−1·h−1 30 cm from the drip line (a 64.8% reduction; Figure 2a).
URE activity at each position in the horizontal direction slightly decreased during the first growing season, increased obviously during the second growing season, changed little during the third growing season and finally sharply increased during the fourth year after planting (Figure 2a). Compared to 0 y, URE activity increased by 6.6, 3.9, 2.8 and 1.7 μg NH4+·g−1·h−1, with an increment rate of 5.3, 3.5, 2.4 and 1.5, at the position of 0, 10, 20 and 30 cm from the drip line in soils of 4 y, respectively. In the fourth year after planting, the URE activity of the four positions increased by 5.5, 3.0, 1.8 and 1.1 μg NH4+·g−1·h−1, respectively. Thus URE activity had an increasing trend with the number of years after planting at each position in a horizontal direction, with clear variation after three years; in addition, the effect of planting year was greater as the distance to the drip line decreased.
In the vertical direction, URE activity decreased with soil depth except in soils of 0 y in which URE activity changed little with depth (Figure 2b). In the upper 0–30 cm layer of 0, 1, 2, 3 and 4 y, URE activity decreased by 0.1, 0.7, 2.1, 1.2 and 3.0 μg NH4+·g−1·h−1, respectively, and in the 30–40 cm layer, it decreased by 0.0, 0.0, 0.1, 0.1 and 1.3 μg NH4+·g−1·h−1. This indicated that URE activity was more readily decreased in soil surface layers. The differences in URE activity within depths of 0–40 cm increased with the number of years after planting (Figure 2b). In soils of 0 y, URE activity had a range of 1.1–1.2 μg NH4+·g−1·h−1, while for 4 y, the range was 7.1–2.3 μg NH4+·g−1·h−1.
Changes in URE activity with the number of years after planting in each vertical layer showed a similarity with those for horizontal positions. As the number of years after planting increased, URE activity slightly decreased first, increased sequentially and then changed little; finally, it clearly increased (Figure 2b). Four years after planting, URE activity in layers of 0–10, 10–20, 20–30 and 30–40 cm changed from 1.2, 1.1, 1.2 and 1.1 μg NH4+·g−1·h−1 in soils of 0 y, respectively, to 6.6, 7.1, 3.6 and 2.3 μg NH4+·g−1·h−1 in soils of 4 y, with an increment rate of 5.4, 6.2, 3.1 and 2.0. During the fourth year after planting, the URE activity of the four layers increased by 3.8, 4.8, 2.0 and 0.8 μg NH4+·g−1·h−1. This implied that URE activity had an increasing trend with the number of years after planting in each layer and that a large increase appeared after a long period of cultivation, with greater effects of planting year in the upper layers.
The average URE activity in the soil profile rose exponentially with the number of years after planting (Figure 3). During the first growing season, URE activity decreased slightly; during 2 y, activity was clearly larger than that for 1 y, increased by about 220%; however, during the third year, the activity decreased slightly by 20% (about 0.4 μg NH4+·g−1·h−1), and the activity again increased and reached 4.9 μg NH4+·g−1·h−1 at the end of the fourth growing season. Analysis of variance indicated that differences among the treatments of 0 y, 1 y, 2 y and 3 y were not significant (p < 0.05), while the URE activity of 4y was significantly higher than that of 0 y and 1 y.
Regression analysis showed that the relationship between the URE activity of the soil profile and the number of years after planting could be expressed as follows:
y U R E = 0.61 e 0.38 ( x + 1 )   R 2 = 0.73   P < 0.05
yURE is the average URE activity of the soil profile, and x is the number of years after planting, x ∈ {0, 1, 2, 3, 4}.
It was estimated that the URE activity of typical farmland planted with L. barbarum in the Yinchuan Plain was about 6.0 μg NH4+·g−1·h−1 [36]; therefore, according to the variation trend, the URE activity of the saline–sodic soil would reach the level of typical farmland after one more year.

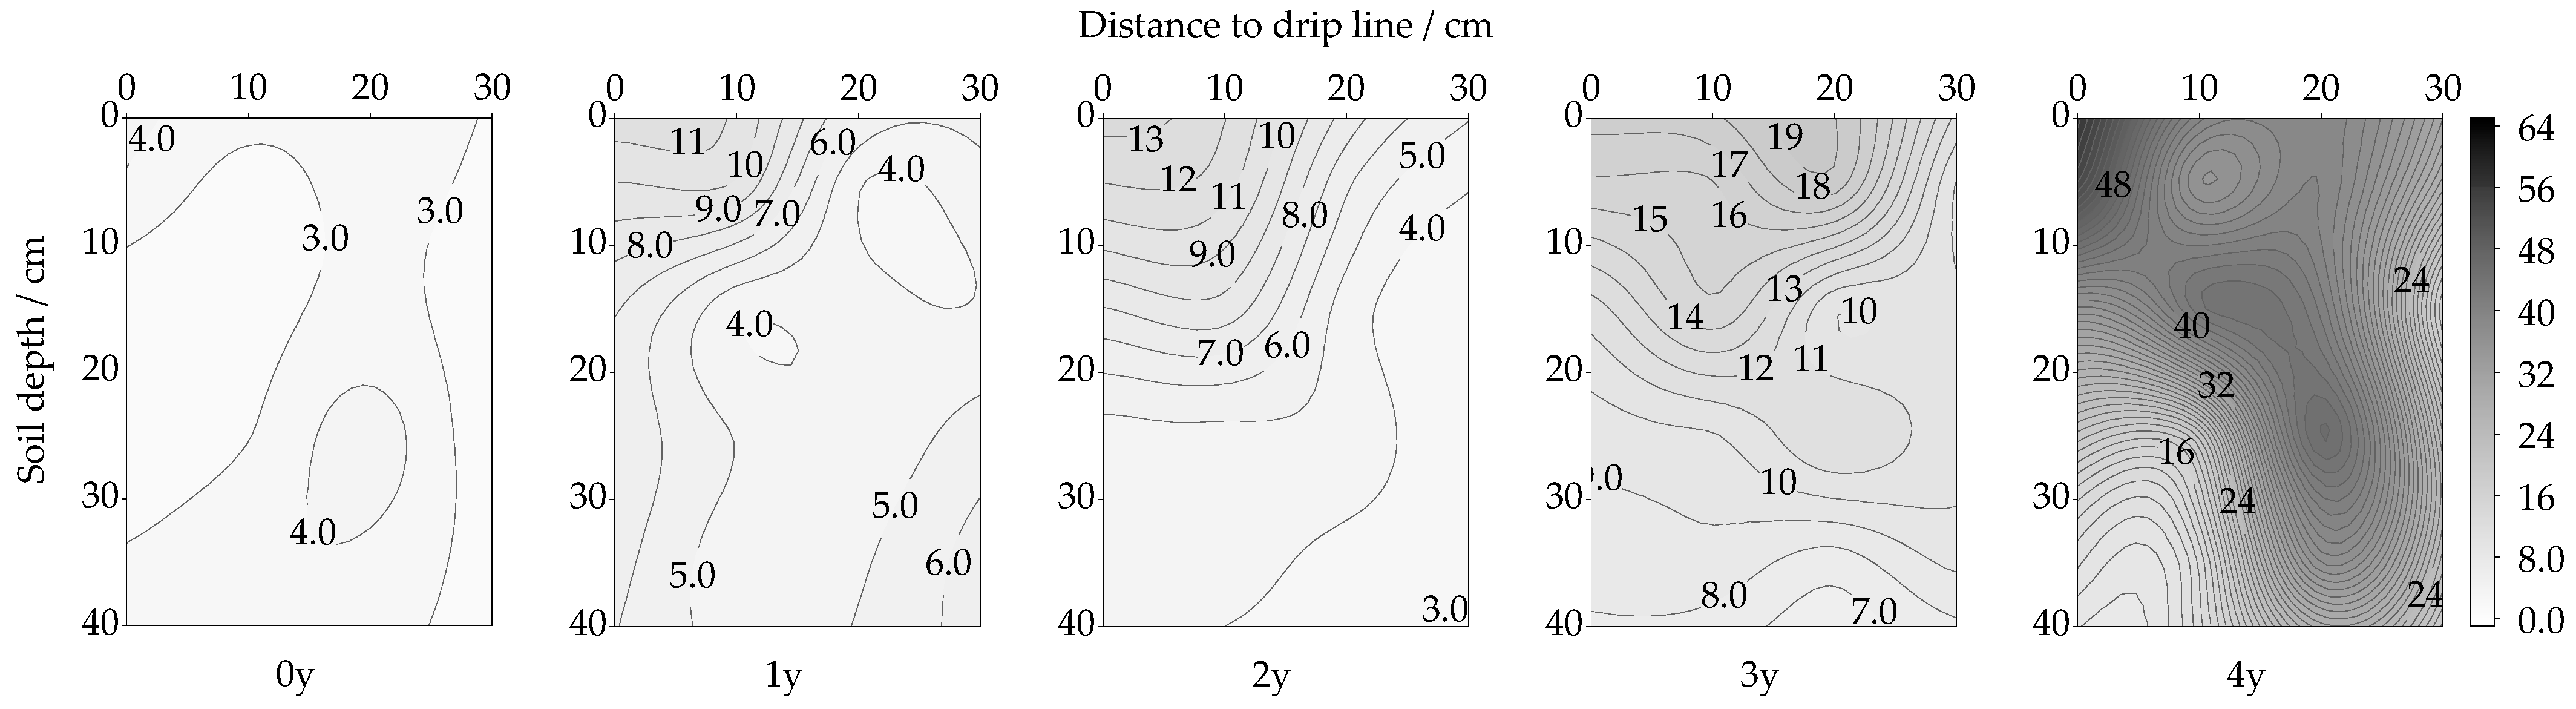
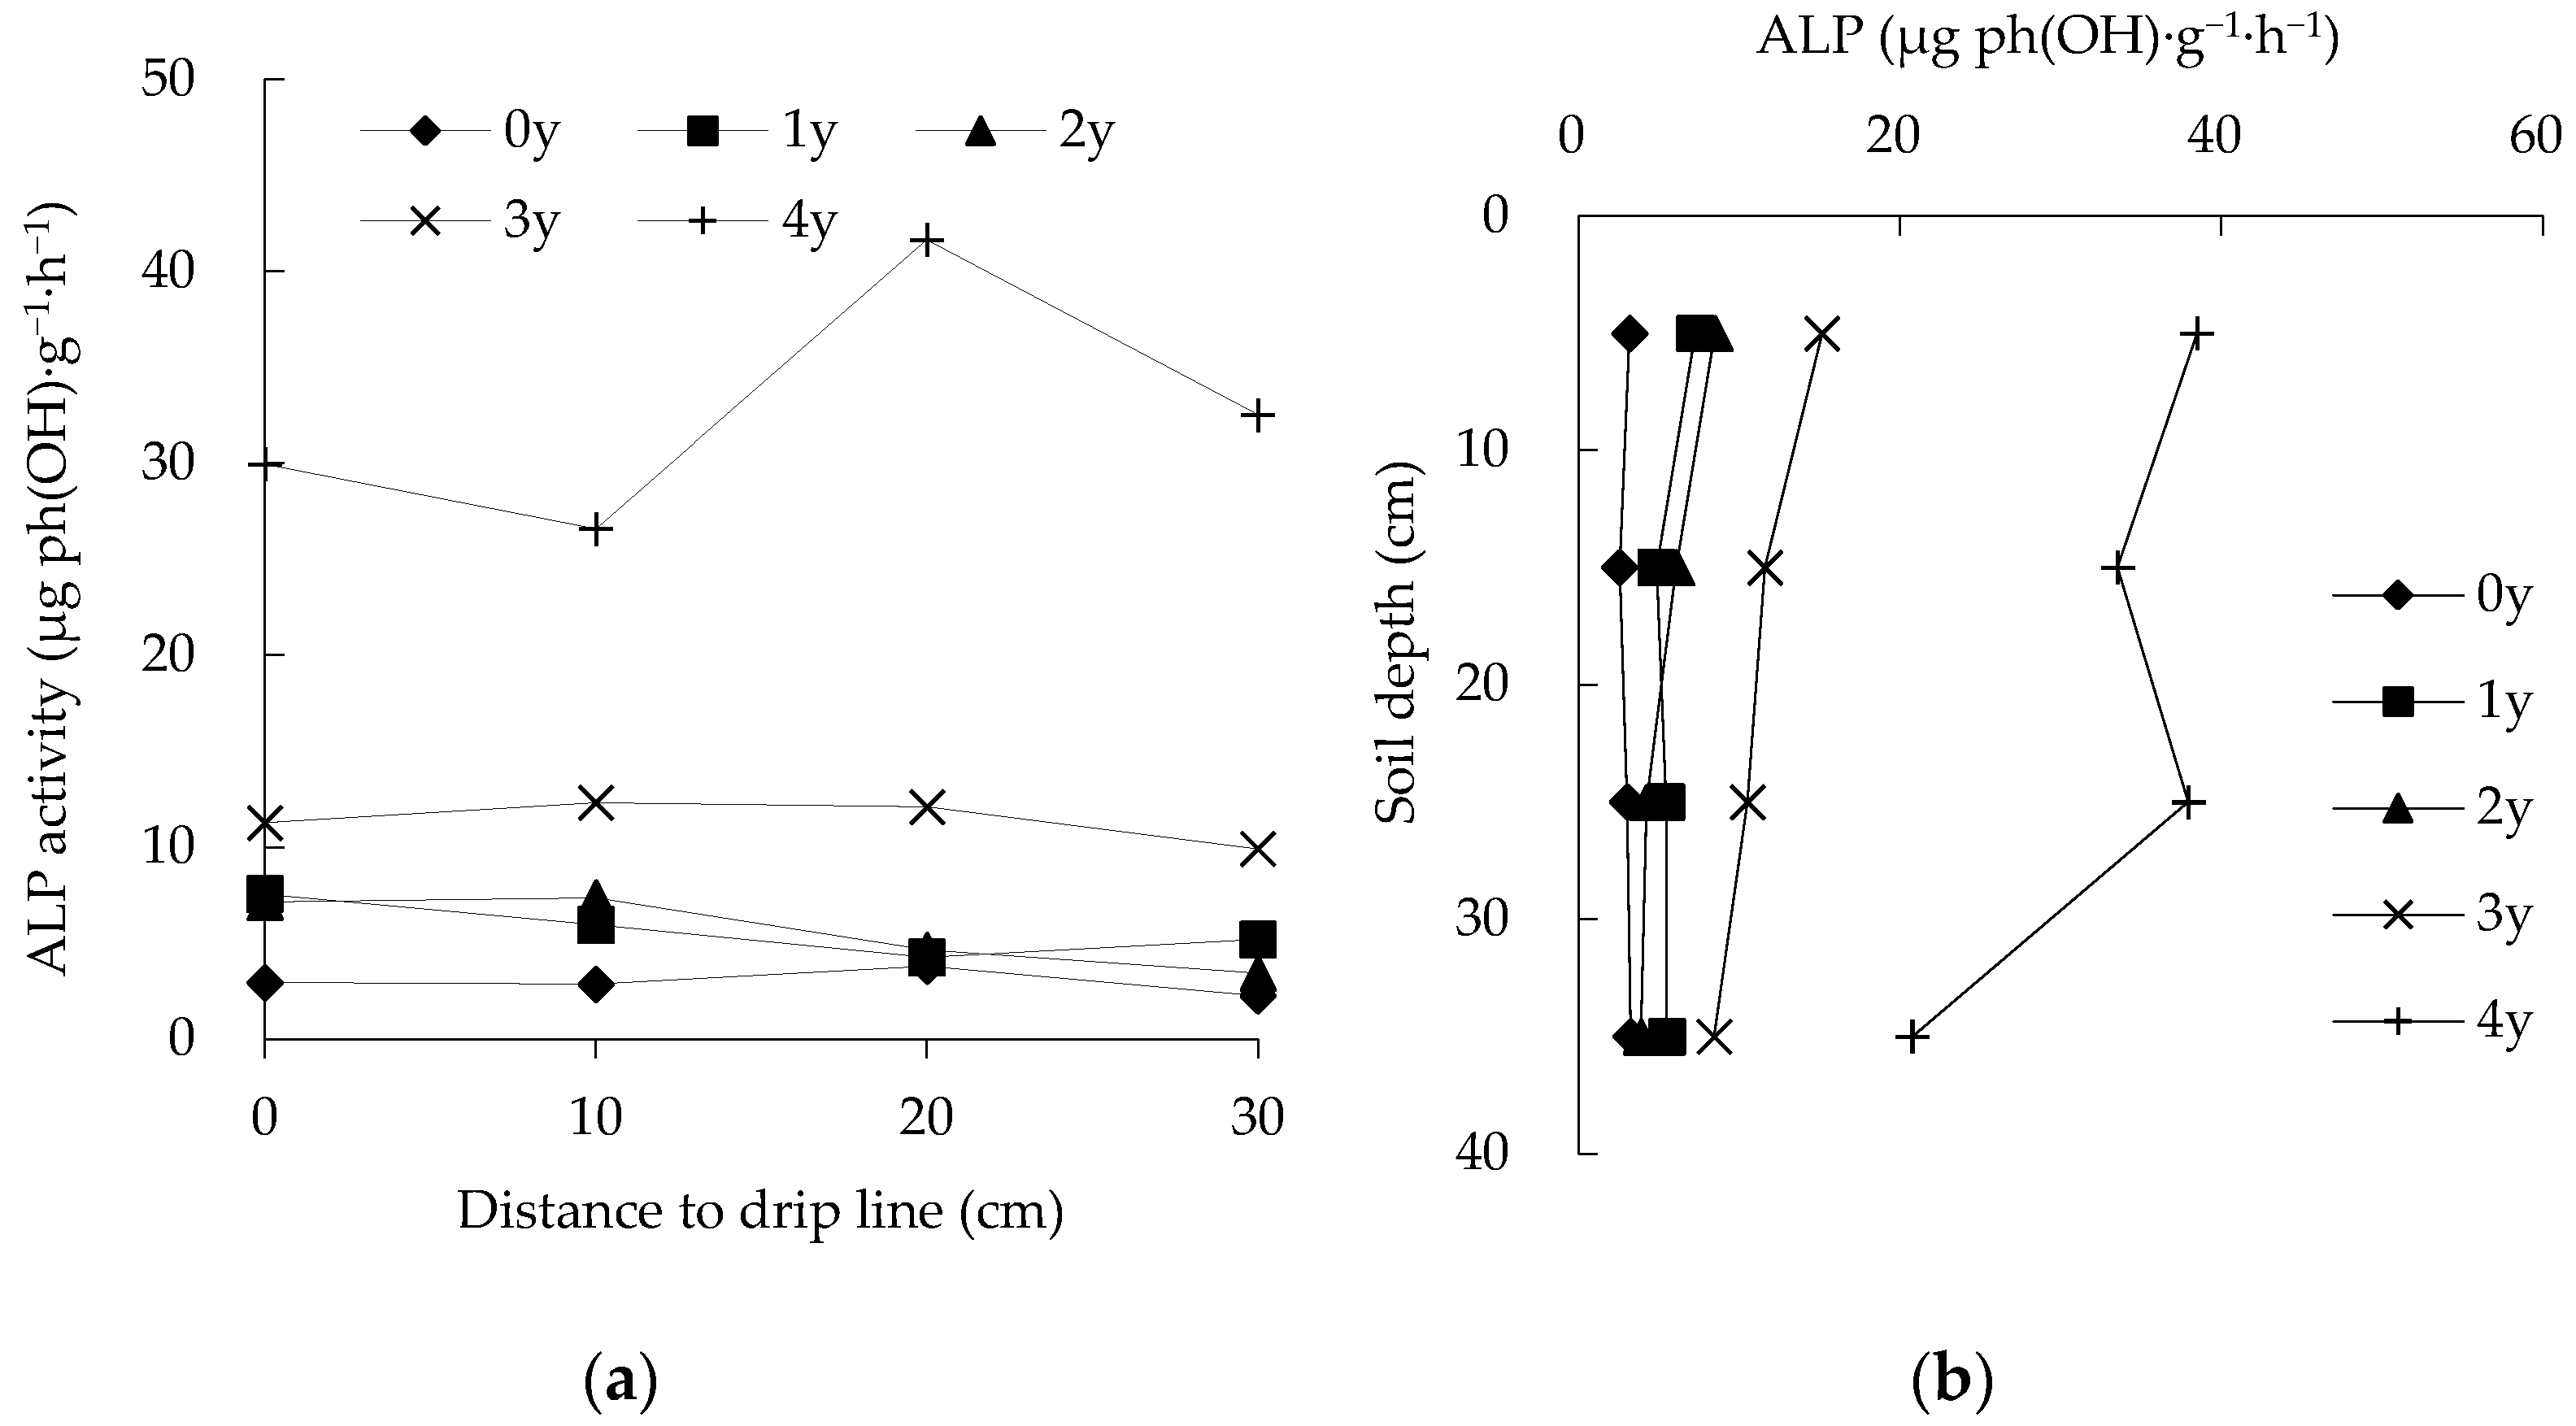
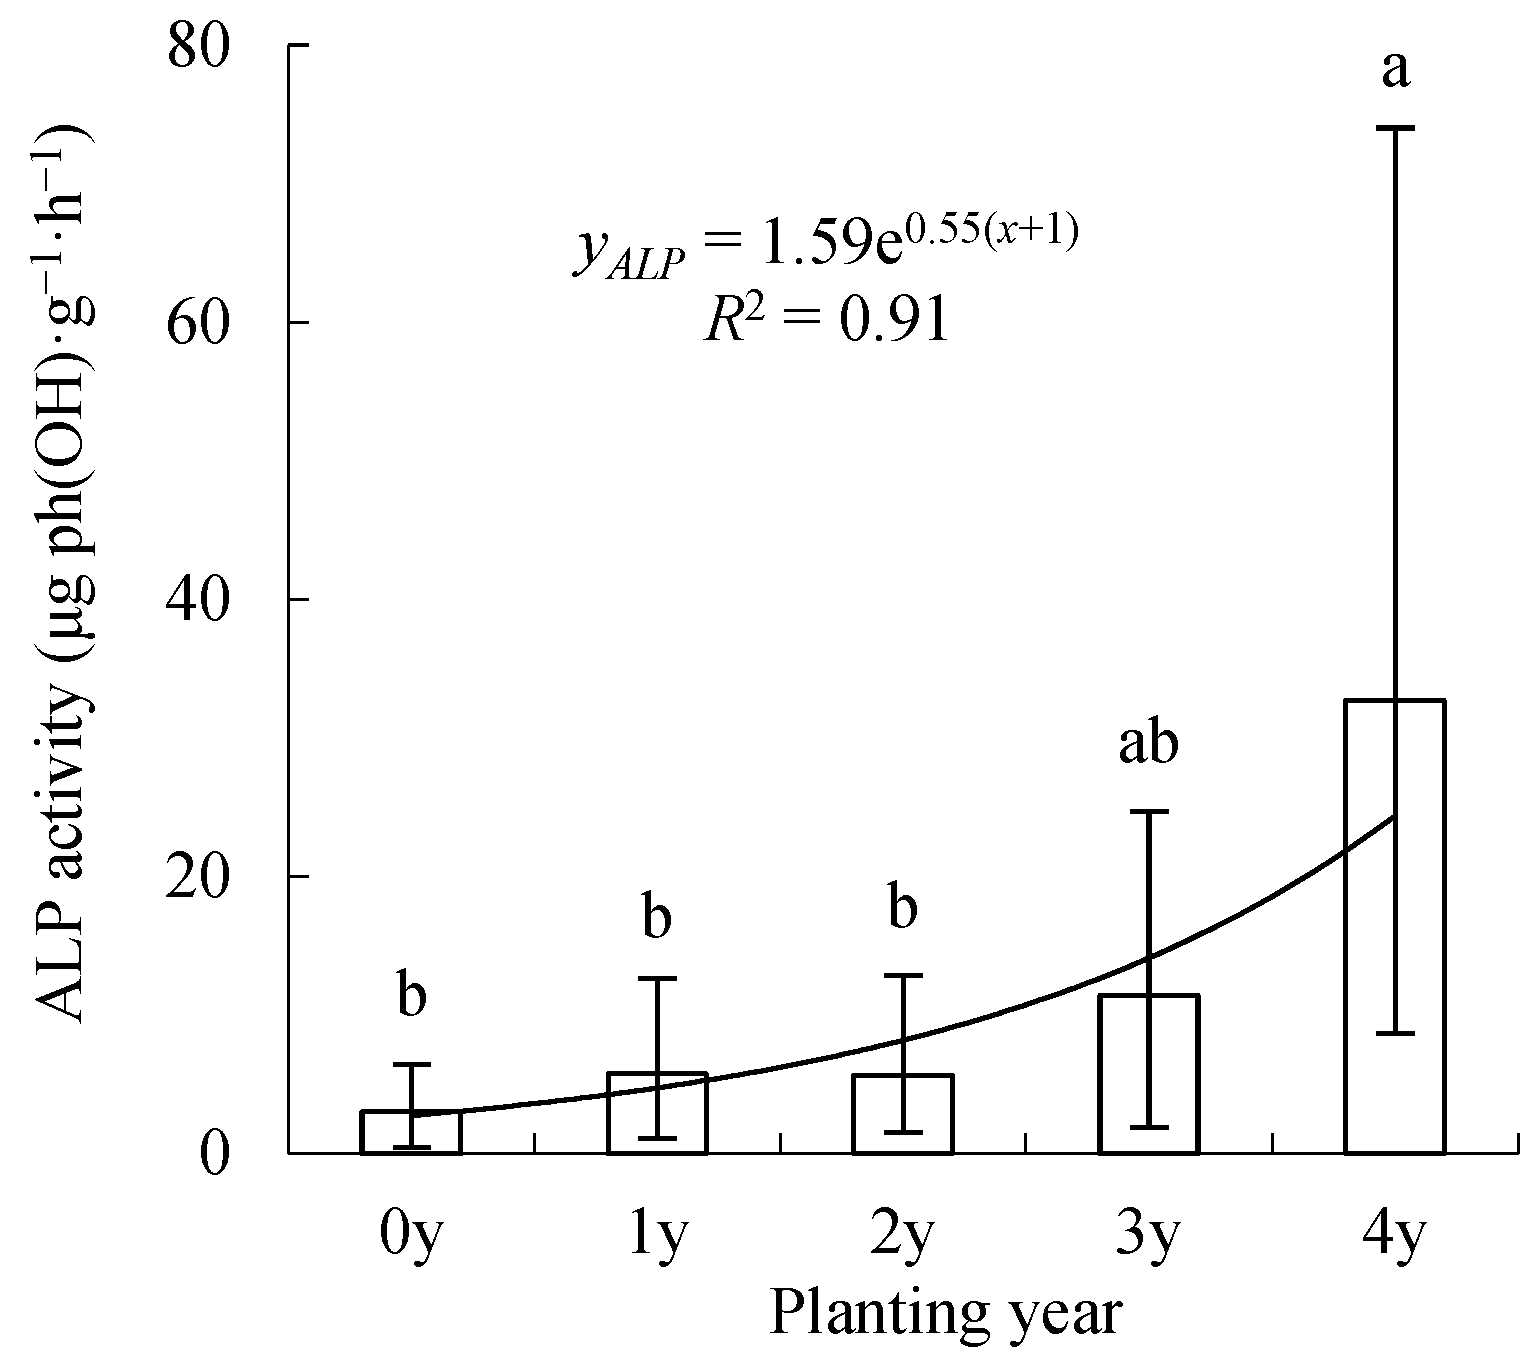
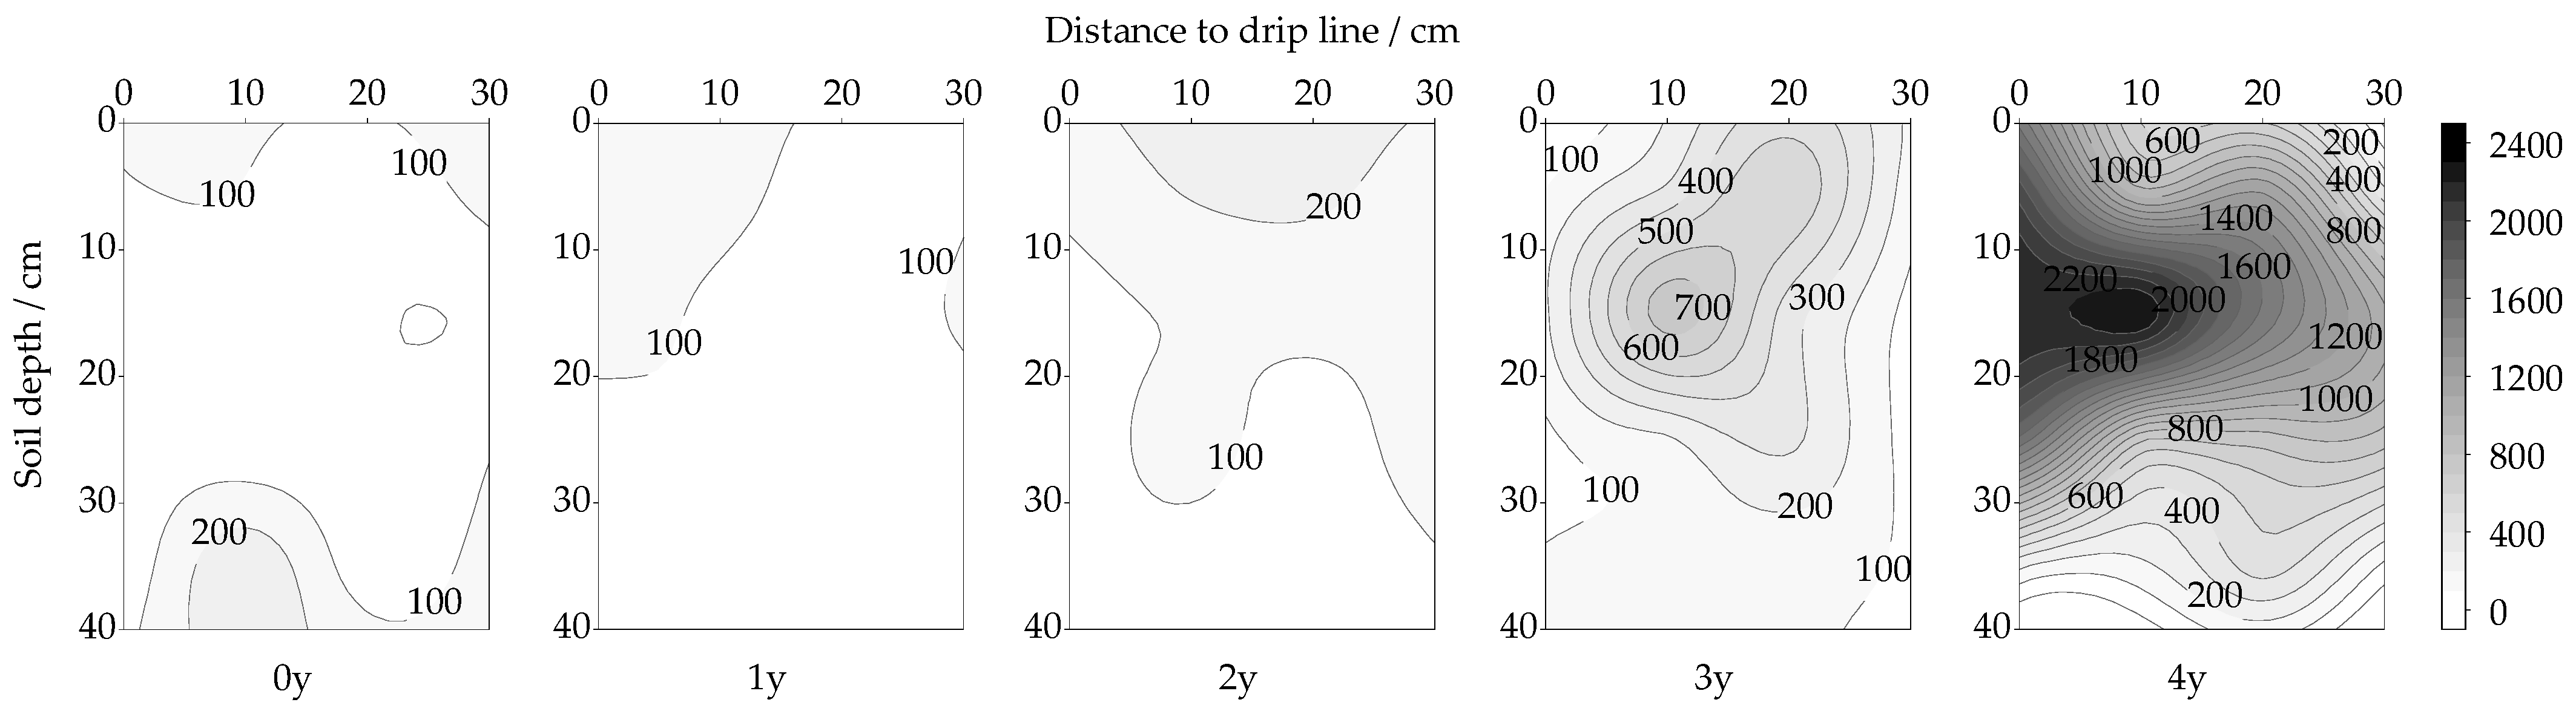
3.2. Spatiotemporal Changes in ALP Activity

In soil profiles of 1, 2, 3 and 4 y, the ALP activity decreased with increased distance from the drip tape; however, in soil of 0 y, ALP activity was mostly in the range of 3–4 μg ph(OH)·g−1·h−1 with a relatively uniform distribution (Figure 4). The effect of the first year of continuous drip irrigation on ALP activity distribution in the soil profile was clear. After the soil had been planted, the ALP activity distribution in the soil profile did not vary greatly in the following years after planting; however, during the fourth year, the distribution changed. The gradients of ALP activity in the soil profile increased with the number of years after planting (Figure 4), indicating more uneven distribution as the number of years after planting increased.
ALP activity changed without any clear trend as the distance to the drip line increased (Figure 5a). In soils of 0 y, ALP activity changed little with distance; for 1 y, it decreased with distance to the drip line but increased within 20–30 cm; for 2 and 3 y, it increased within 0–10 cm of the drip line and then continuously decreased; and for 4 y, it first slightly decreased and then increased, and within 20–30 cm, it again decreased. However, the variation range within 30 cm of the drip line was 1.6, 3.3, 3.9, 2.4 and 15.1 μg ph(OH)·g−1·h−1 in soils of 0, 1, 2, 3 and 4 y, respectively, indicating that variation in a horizontal direction had an increasing trend with the number of years after planting.
In the horizontal direction, ALP activity increased with the number of years after planting, and the range differed between years (Figure 5a). ALP activity increased slightly during the first two years with increments of 4.2, 1.5, 0.8 and 1.2 μg ph(OH)·g−1·h−1 at distances of 0, 10, 20 and 30 cm from drip line, respectively, but increased more as the number of years after planting increased, especially during the fourth season, when ALP activity increased by 18.7, 14.3, 29.5 and 22.6 μg ph(OH)·g−1·h−1, respectively.
In the vertical direction, ALP activity had a decreasing trend with soil depth, except in soils of 0 and 1 y in which ALP activity changed little with depth (Figure 5b). Within the depth of 0–40 cm, in soils of 0, 1, 2, 3 and 4 y, ALP activity changed from 3.2, 7.2, 8.5, 15.1 and 38.5 μg ph(OH)·g−1·h−1 in the 0–10 cm layer, respectively, to 3.2, 5.5, 3.9, 8.4 and 20.8 μg ph(OH)·g−1·h−1 in the 30–40 cm layer (reductions of 0.0, 1.7, 4,6, 6,7 and 17.7 μg ph(OH)·g−1·h−1). This indicated that in the vertical direction, variation in ALP activity also had an increasing trend with the number of years after planting.
In each soil layer, within 40 cm of the soil surface, ALP activity had an increasing trend with the number of years after planting (Figure 5b). In the first two years, ALP activity increased slightly with increments of only 5.3, 3.5, 1.2 and 0.6 μg ph(OH)·g−1·h−1 in layers of 0–10, 10–20, 20–30 and 30–40 cm, respectively, while it increased by 6.7, 5.5, 6.3 and 4.6 μg ph(OH)·g−1·h−1 during the third and 23.3, 22.0, 27.4 and 12.3 μg ph(OH)·g−1·h−1 during the fourth year. Therefore, similar to the changes in URE activity, the results implied that the increment in ALP activity in each layer increased with the number of years after planting, and in the upper layers, ALP activity was more affected by planting year.
The average ALP activity of the soil profile had an exponentially increasing trend with the number of years after planting (Figure 6). ALP activity obviously increased during the first growing season, remained relatively stable during the second year and rapidly increased in the following years, especially in the fourth year, when it changed from 11.4 to 32.7 μg ph(OH)·g−1·h−1 (a 186.3% increase). Analysis of variance indicated that differences among the treatments of 0 y, 1 y, 2 y and 3 y were not significant (p < 0.05), while the differences between 4y and 0y, 1y, 2y were significant (p < 0.05).
Regression analysis showed that the relationship between ALP activity of the soil profile and the number of years after planting could be expressed as follows:
y A L P = 1.59 e 0.55 ( x + 1 )   R 2 = 0.91   P < 0.05
yALP is the average ALP activity of the soil profile, and x is the number of years after planting, x ∈ {0, 1, 2, 3, 4}.
The ALP activity of typical farmland in the neighborhood was about 94.2 μg ph(OH)·g−1·h−1 [37]; according to the variation trend, the ALP activity of the saline–sodic soil would reach the level of typical farmland after another three years.

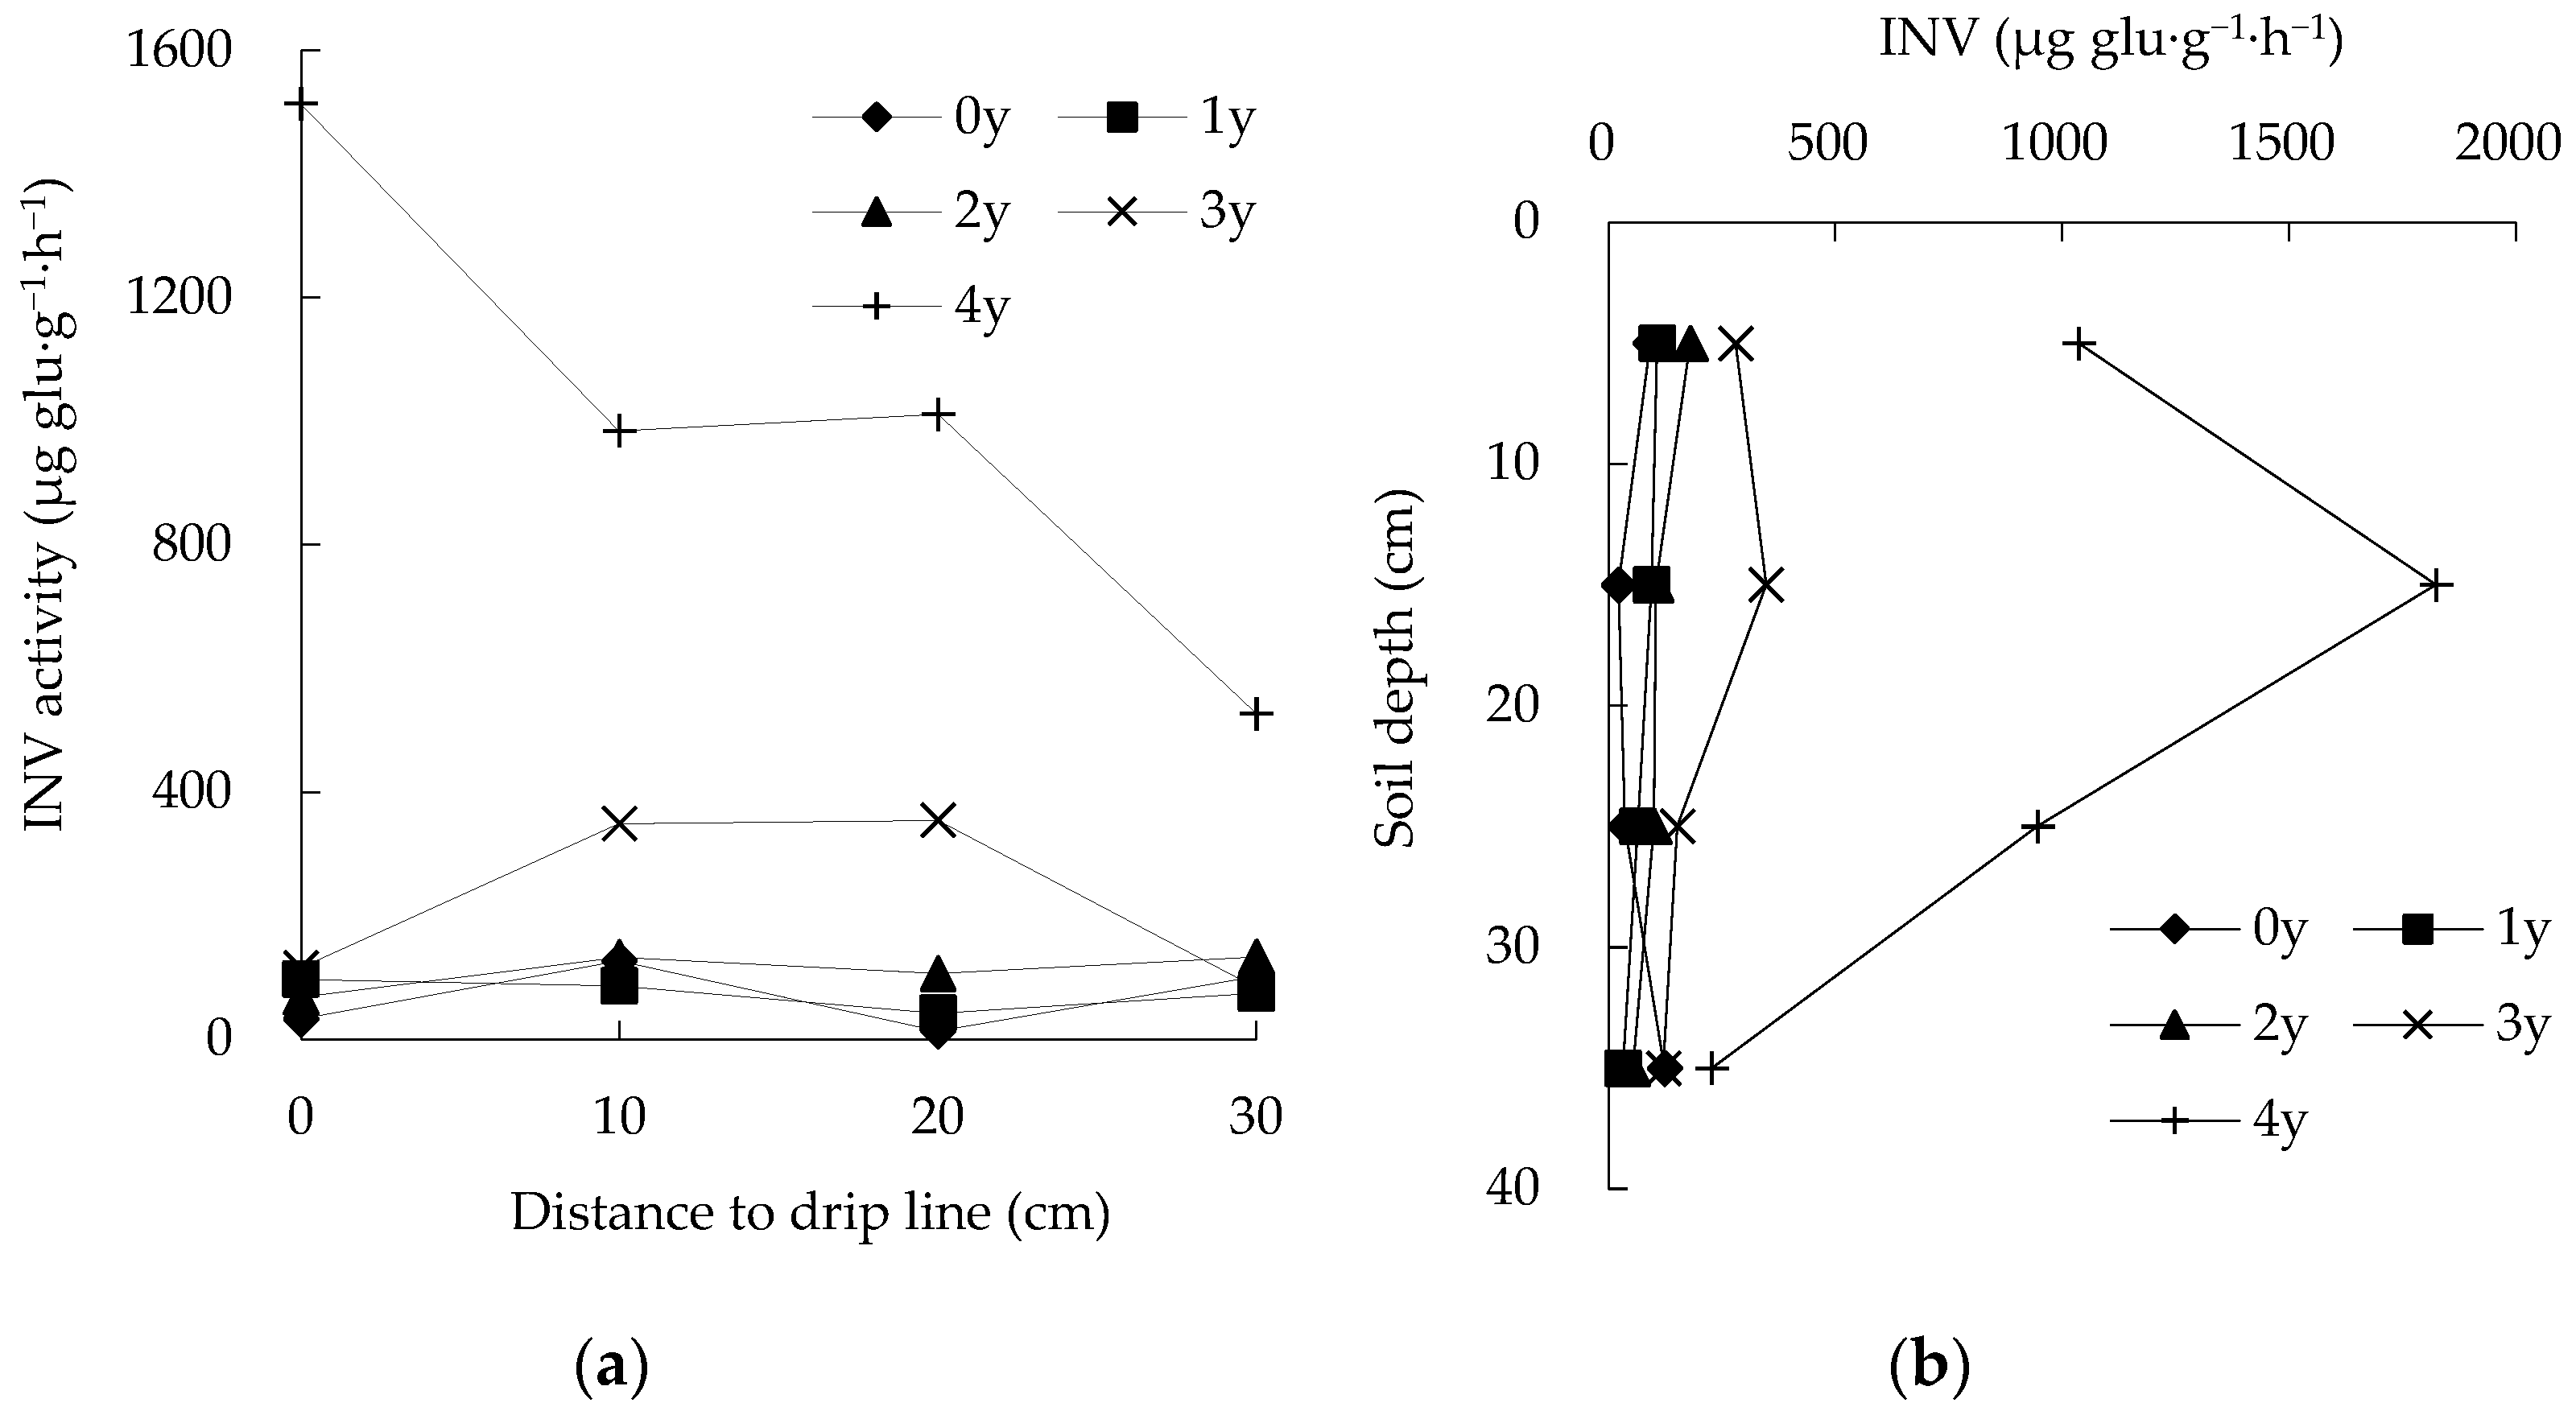
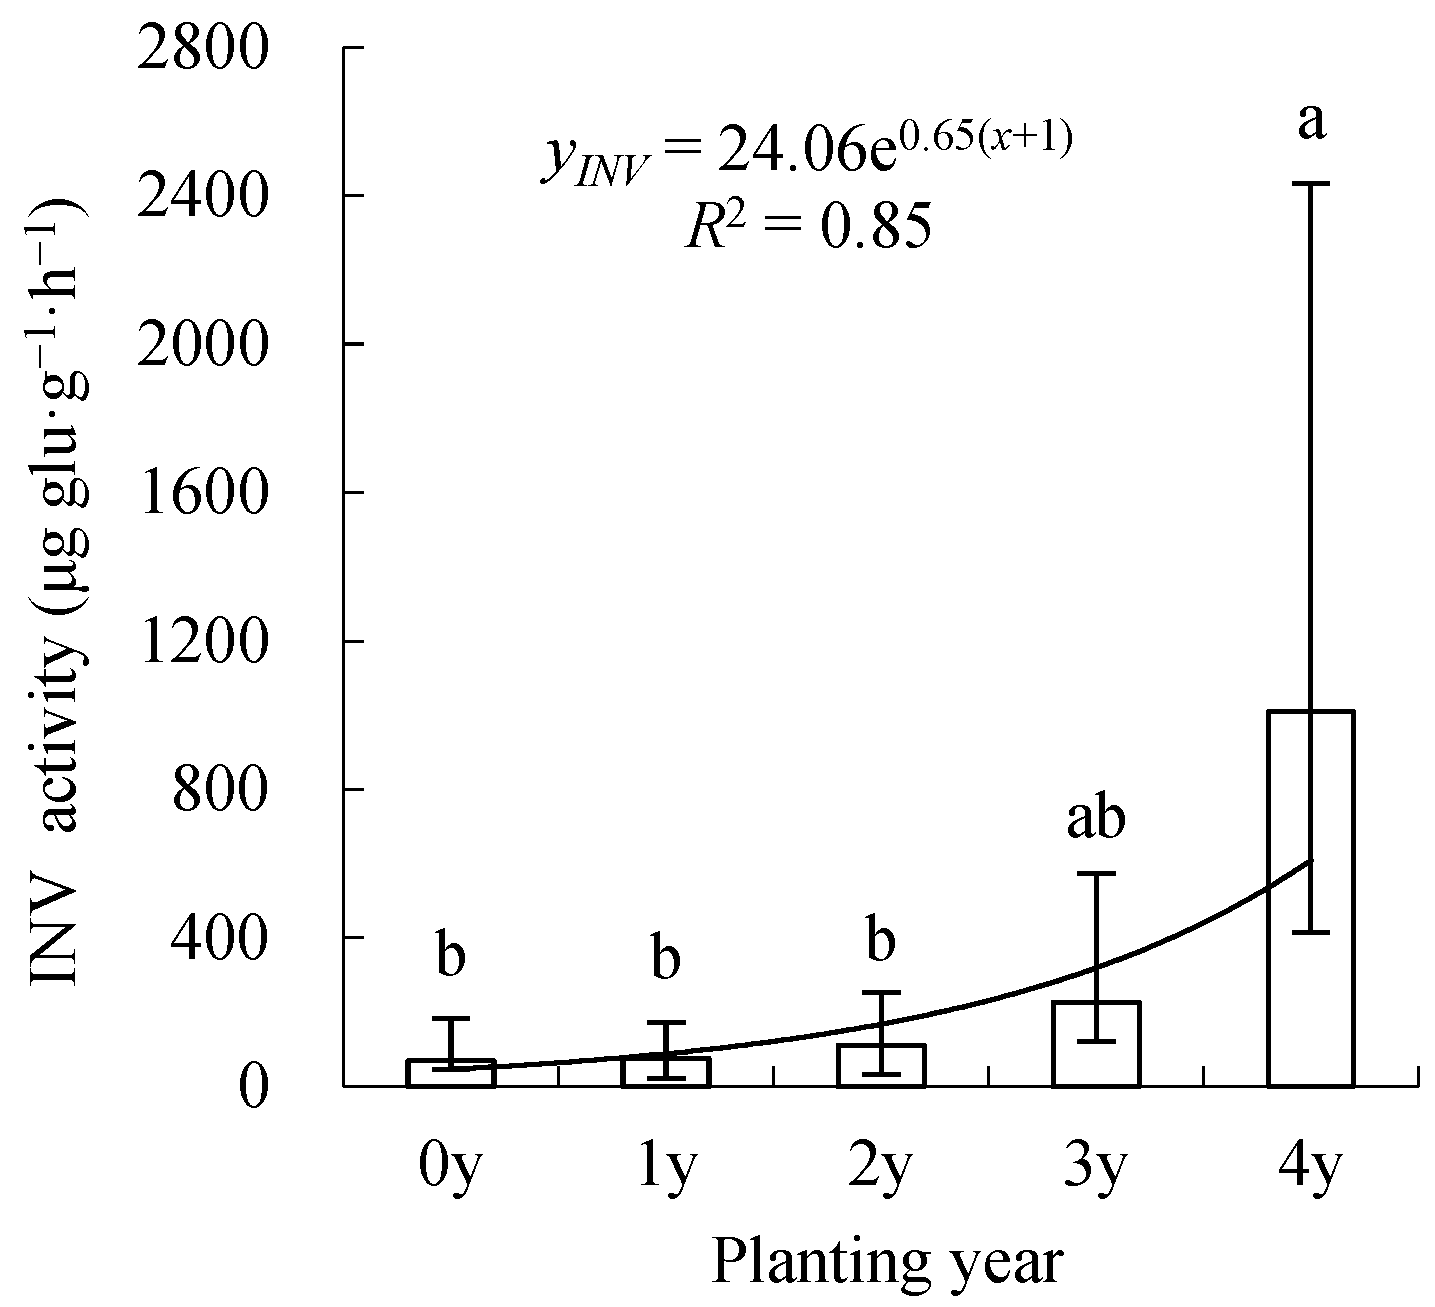
3.3. Spatiotemporal Changes in INV Activity

INV activity had a relatively uniform distribution in soils of 0, 1 and 2 y, but for 3 and 4 y, it radially decreased away from the point nearest to the drip line (Figure 7). In addition, in soils of 0 and 1 y, INV activity was mostly <100 μg glu·g−1·h−1, and in soils of 2 y, activity mostly varied within 200 μg glu·g−1·h−1; however, for 3 and 4 y, activity varied within 900 and 2600 μg glu·g−1·h−1, respectively. As a result, gradients of INV activity in the soil profile increased with the number of years after planting, indicating a more uneven distribution with increased time. This implied that the effect of the number of years after planting on the INV activity distribution in the soil profile was weak during the first two years but increased thereafter.
INV activity varied little in the horizontal direction in soils of 0, 1 and 2 y, but its variation was strong for 3 and 4 y (Figure 8a). For 3 y, INV activity changed from 83.5 to 354.7 μg glu·g−1·h−1. In soils of 4 y, INV activity changed from 526.7 to 1513.8 μg glu·g−1·h−1 and had a decreasing trend with increased distance to the drip line. In soils of both 3 and 4 y, INV activity changed little within 10–20 cm. This indicated that INV activity was more affected near the drip line and at the edges of beds.
As the number of years after planting increased, INV activity at each position in a horizontal direction had an increasing trend. During the first two years after planting, INV activity changed little, and the increments in INV activity at 0 and 30 cm from the drip line were mainly during the fourth year (Figure 8a). After four years of utilization, INV activity at positions 0, 10, 20 and 30 cm from the drip line increased from 33.3, 126.9, 13.8 and 102.4, respectively, to 1513.8, 984.5, 1010.9 and 526.7 μg glu·g−1·h−1. The effect of the number of years after planting on INV activity decreased with increased distance from the drip line.
In soils of 0 y, INV activity decreased with increased depth in the upper 0–20 cm and then increased with depth; for 1 and 2 y, it continuously decreased with soil depth; and for 3 and 4 y, it increased with depth in the upper 0–20 cm and then decreased with soil depth (Figure 8b). Within the depth of 0–40 cm, INV activity varied 100.8, 75.7, 126.8, 226.6 and 1596.6 μg glu·g−1·h−1 in soils of 0, 1, 2, 3 and 4 y, respectively, indicating that variation in INV activity in the vertical direction increased with time.
The INV activity of each layer had an increasing trend during the utilization process (Figure 8b). In layers of 0–10, 10–20, 20–30 and 30–40 cm, INV activity varied from 93.1, 22.8, 36.8 and 123.6 μg glu·g−1·h−1 in soils of 0 y, respectively, to 1037.2, 1824.6, 946.2 and 227.9 μg glu·g−1·h−1 for 4 y. During the first three years, INV activity changed 188.3, 325.1, 115.2 and 89.1 μg glu·g−1·h−1, while for the fourth year, it changed 755.8, 1476.6, 794.1 and 106.6 μg glu·g−1·h−1. This indicated that changes in INV activity were greater as the number of years after planting increased and that in the upper layers, INV activity was more affected by the number of years after planting.
Similar to URE and ALP, the average INV activity of the soil profile also had an exponentially increasing trend with the number of years after planting (Figure 9). During the first growing season, INV activity increased slightly; in soils of 2 y, activity was obviously greater than that in soils of 1 y, increased by 35.2 μg glu·g−1·h−1; during the third year, INV activity increased by 115.3 μg glu·g−1·h−1; and during the fourth year, activity increased greatly to 1009.0 μg glu·g−1·h−1 at the season’s end. Analysis of variance indicated that differences among the treatments of 0 y, 1 y, 2 y and 3 y were not significant (p < 0.05), while the differences between 4y and 0y, 1y, 3y were significant (p < 0.05).
Regression analysis showed that the relationship between INV activity of the soil profile and the number of years after planting could be expressed as follows:
y I N V = 24.06 e 0.65 ( x + 1 )   R 2 = 0.85   P < 0.05
yINV is the average INV activity of the soil profile, and x is the number of years after planting, x ∈ {0, 1, 2, 3, 4}.
Surveys showed that the INV activity of typical farmland was 1035.9 μg glu·g−1·h−1 [37]; thus, according to the variation trend, the INV activity of the saline–sodic soil should reach the level of typical farmland after one more year.

4. Discussion

4.1. Soil Enzyme Activities

Soil enzymes serve as valuable indicators of soil quality, influenced by various factors such as soil physicochemical properties, microbial community structure, vegetative cover, management, succession, land use, climate and soil profile depth [38,39]. Studies have shown that growing plants can promote soil microbial diversity, thereby increasing the stability and long-term storage of SOC [40]. Plants can also influence soil physical properties such as soil structure, aeration and water retention, which can affect the distribution and stability of SOC. The improved community structure and abundance of microorganisms in the soil affect the production of microbial metabolites and related proteins, which in turn increase soil enzymes [41]. In our study, the URE, ALP and INV activities in the soil before the experiment were only 1.2 μg NH4+·g−1·h−1, 3 μg ph(OH)·g−1·h−1 and 69.1 μg glu·g−1·h−1, respectively. This could be attributed to our study region being a wasteland with sparsely distributed Artemisia anethifolia growing. The lack of plant diversity and heavy soil salinity resulted in soil impoverishment. However, after the soil was cultivated with drip irrigation, significant improvements were observed.
Drip irrigation is a localized irrigation method in which soil water is mainly concentrated near the crop root zone, which can improve the utilization efficiency of water and fertilizer. In our experiment, the high frequency of drip irrigation kept relatively high soil water potential, facilitating continuous water infiltration to the deeper layers. A zone of relatively low soil salinity was formed around the drip line as the soil salts were dissolved and transported away by soil water [42]. Moreover, the adjustment of soil moisture and nutrient levels through drip irrigation led to a change in the structure of the soil microbial community. The research showed that drip irrigation enhanced nutrient bioavailability to plant roots and increased harvestable yield [43,44]. Because soil enzymes have a relationship with soil physicochemical–microbial properties, these changes in the soil may be the main reasons for the improvement in soil enzyme activities. At the end of the fourth year, the URE, ALP and INV activities of the soil reached only 4.9 μg NH4+·g−1·h−1, 32.7 μg ph(OH)·g−1·h−1 and 1009.0 μg glu·g−1·h−1. The indicators of soil quality could also indicate that in severely saline soils, drip irrigation with saline water could help establish and maintain good soil health.
In addition, since most soil enzymes come from root exudates and microorganisms and decompose soil litter and other forms of SOM [45], the enzyme activities would increase with time. All three enzyme activities increased exponentially with the number of years after planting. This trend might be determined by the growth characteristics of the plant. Lycium barbarum L. is a kind of perennial plant; in the first two years, the bare-rooting transplanted seedlings were short and grew slowly. However, the plants grew rapidly from the third year, resulting in a larger root system, more root exudates and plant residues being produced.

4.2. Urease Enzyme (URE)

The increasing trend of URE activity with the number of years after planting might be attributed to sufficient urea and nitrogen nitrate substrates dissolved and diffused into the soil profile [46]. Ameliorated soil aeration and temperature conditions might also play important roles [47]. However, self-adaptation of the microbial population is a major source of soil enzymes and would change as the soil environment conditions varied, which may be the reason for the slight decrease during the first growing season [48]. During the third year after planting, increased nitrogen fertilizer demand by plants may cause the scarcity of URE substrates and thus inhibit URE activity again [31,47]. During the fourth year after planting, the vigorous plant roots and deciduous remnants might be additional reasons for the sharp increase in URE activity [49]. Since the distribution of soil water, soil nutrients and other soil solutes under drip irrigation differed from normal agriculture practice, the characteristic radial reduction in URE activity in the soil profile would be consistent with soil nutrient distribution [49]. In addition, changes in soil physics in the upper layers, such as higher temperature, better aeration and more aggregates, might be another reason for higher URE activity in 0–10 cm soil layers and in a horizontal direction. The distribution of roots that exude substrates for enzyme synthesis might result in higher URE activity immediately under the drip line [50].

4.3. Alkaline Phosphatase (ALP)

ALP mainly originates from the activity of soil microorganisms, the release of plant root exudates and the decomposition of animal and plant residues [51]. Under the irrigation and planting system, the slow increase in ALP activity after utilization started can be attributed to several factors. Firstly, there may have been low inorganic phosphorus (P) fertigation, leading to an increasing demand for P fertilizer due to plant growth. Additionally, the uneven distribution of P in the soil profile, as P is immobile and easily adsorbed by soil particles, could have contributed to this slow increase [52]. As years after planting progressed, more P accumulated, more plant roots grew and more deciduous remnants returned to soils, which resulted in larger increases in ALP activity with the number of years after planting [53,54]. The distribution of ALP activity in the soil profile might also be in accordance with the distribution of soil nutrients. In the vertical direction, the higher soil organic matter, aeration, soil nutrients and other better soil physical and chemical properties in the upper layer led to higher ALP activity in the 0–10 cm layer than in other layers [55,56]. However, in a horizontal direction, soil conditions probably changed less than in a vertical direction, and so ALP activity varied little.

4.4. Invertase (INV)

Sucrose, the substrate for INV, is one of the most abundant soluble sugars consumed by plants [57]. Invertase is partially responsible for the breakdown of plant litter in soils [58]. Therefore, in impoverished waste soil with vigorous plant growth, INV activity increased slightly in the early stages of utilization. Years after planting, the soil condition probably improved, leading to an increase in the return of exudates and remnants of roots to the soil, consequently boosting INV activity [59]. In the soil profile, the presence of enzymes is also dependent on nutrient availability and on the physiological status of microbes [60]. Fertigation in this irrigation system is a type of point-source diffusion with high frequency. Consequently, in both directions, INV activity also decreased with increased distance from the drip line due to the distribution of roots and better soil physical–chemical conditions.

5. Conclusions

This study examined the changes in URE, ALP and INV activities in the root zone with the number of years after planting during the process of utilizing saline–sodic soils with drip irrigation using saline groundwater. URE, ALP and INV activities, which were low and distributed uniformly in soil profile before planting, had exponentially increasing trends with the number of years after planting. All three soil enzyme activities changed slightly during the first three years after planting and increased rapidly during the fourth year. The distribution patterns of URE and ALP activities were basically formed during the first growing season, while the distribution style of INV activity was found in soils that had been planted for three years. All three soil enzyme activities (and also their gradients) decreased radially away from the drip line. In addition, their ranges in the soil profile increased with the number of years after planting, indicating that the spatial variation of the three enzyme activities increased with time. URE, ALP and INV activities, in both horizontal and vertical directions, changed little during the first two years after planting; in the following years, the activities had decreasing tendencies in both directions, except for ALP activity which changed little horizontally. Changes in the three enzyme activities in both directions with the number of years after planting implied that in the upper soil layers and in positions closer to the drip line, the enzyme activities were more affected by an increase in the number of years after planting.
These variations of soil enzyme activities indicated that soil quality was promoted yearly, especially around the drip line, where roots mostly spread. Soil enzyme activity, as a valuable indicator, indicated that the waste saline–sodic soil was effectively utilized under such an irrigation and planting system with increased time. According to the variation trends of the three soil enzyme activities, soil quality slowly changed during the early stage of reclamation, began to be rapidly ameliorated in the third year and would reach levels of typical farmland after about six years.

Author Contributions

Methodology, C.D.; investigation, C.D. and Y.S.; writing—original draft, C.D. and X.C.; writing—review and editing, C.D., Y.L. (Yuping Lv), Y.S., X.C. and Y.L. (Yan Li); project administration, C.D. All authors have read and agreed to the published version of the manuscript.

Funding

This research was funded by the National Natural Science Fund of China, grant number 51609208, and by the Priority Academic Program Development of Jiangsu Higher Education Institutions (PAPD).

Data Availability Statement

The original contributions presented in the study are included in the article, and further inquiries can be directed to the corresponding author.

Conflicts of Interest

The authors declare no conflicts of interest.

References

  1. Fan, Z.L.; Ma, Y.J.; Ma, Y.J. Salinized soils and their improvement and utilization in west China. Arid. Zone Res. 2001, 18, 1–6, (In Chinese, with English Abstract). [Google Scholar]
  2. Fu, H.Q.; Yang, Y.Q. How Plants Tolerate Salt Stress. Curr. Issues Mol. Biol. 2023, 45, 5914–5934. [Google Scholar] [CrossRef] [PubMed]
  3. Zhou, H.P.; Shi, H.F.; Yang, Y.Q.; Feng, X.X.; Chen, X.; Xiao, F.; Lin, H.H.; Guo, Y. Insights into plant salt stress signaling and tolerance. J. Genet. Genom. 2024, 51, 16–34. [Google Scholar] [CrossRef] [PubMed]
  4. Sidike, A.; Zhao, S.H.; Wen, Y.M. Estimating soil salinity in Pingluo County of China using QuickBird data and soil reflectance spectra. Int. J. Appl. Earth Obs. 2014, 26, 156–175. [Google Scholar] [CrossRef]
  5. Abhilash, J.E. Rice cultivation in saline tracts of Kerala: An overview. Int. J. Fish. Aquat. Stud. 2016, 4, 355–358. [Google Scholar]
  6. Wang, J.; Lin, C.Y.; Han, Z.M.; Fu, C.B.; Huang, D.; Cheng, H.G. Dissolved nitrogen in salt-affected soils reclaimed by planting rice: How is it influenced by soil physicochemical properties? Sci. Total Environ. 2022, 824, 153863. [Google Scholar] [CrossRef] [PubMed]
  7. Xu, Z.K.; Shao, T.Y.; Lv, Z.X.; Yue, Y.; Liu, A.H.; Long, X.H.; Zhou, Z.S.; Gao, X.M.; Rengel, Z. The mechanisms of improving coastal saline soils by planting rice. Sci. Total Environ. 2020, 703, 135529. [Google Scholar] [CrossRef] [PubMed]
  8. Singh, A. Soil salinization management for sustainable development: A review. J. Environ. Manag. 2021, 277, 111383. [Google Scholar] [CrossRef] [PubMed]
  9. Shokri-Kuehni, S.M.S.; Bernadette, R.; Theresa, K.; Dani, O.; Rainer, H.; Nima, S. Water table depth and soil salinization: From pore-scale processes to field-scale responses. Water Resour. Res. 2020, 56, e2019WR026707. [Google Scholar] [CrossRef]
  10. Greene, R.; Timms, W.; Rengasamy, P.; Arshad, M.; Cresswell, R. Soil and aquifer salinization: Toward an integrated approach for salinity management of groundwater. In Integrated Groundwater Management: Concepts, Approaches and Challenges; Springer: Cham, Switzerland, 2016; pp. 377–412. [Google Scholar] [CrossRef]
  11. Chhabra, R. Management and Reclamation of Saline Soils. In Salt-Affected Soils and Marginal Waters; Springer: Cham, Switzerland, 2021. [Google Scholar] [CrossRef]
  12. Shankar, V.; Evelin, H. Strategies for Reclamation of Saline Soils. In Microorganisms in Saline Environments: Strategies and Functions; Soil Biology; Giri, B., Varma, A., Eds.; Springer: Cham, Switzerland, 2019; Volume 56. [Google Scholar] [CrossRef]
  13. Rajput, T.B.S.; Patel, N. Water and nitrate movement in drip-irrigated onion under fertigation and irrigation treatments. Agr. Water Manag. 2006, 79, 293–311. [Google Scholar] [CrossRef]
  14. Li, J.S.; Zhang, J.J.; Ren, L. Water and nitrogen distribution as affected by fertigation of ammonium nitrate from a point source. Irrig. Sci. 2003, 22, 19–30. [Google Scholar] [CrossRef]
  15. Kahlon, M.S.; Josan, A.S.; Khera, K.L. A comparative study on soil and plant parameters under furrow and drip irrigated tomatoes with poor quality water. Res. Crops. 2008, 9, 61–72. [Google Scholar]
  16. Li, X.B.; Kang, Y.H.; Wan, S.Q.; Chen, X.L.; Chu, L.L.; Xu, J.C. First and second-year assessments of the rapid reconstruction and re-vegetation method for reclaiming two saline–sodic, coastal soils with drip-irrigation. Ecol. Eng. 2015, 84, 496–505. [Google Scholar] [CrossRef]
  17. Hussain, M.I.; Farooq, M.; Muscolo, A.; Rehman, A. Crop diversification and saline water irrigation as potential strategies to save freshwater resources and reclamation of marginal soils—A review. Environ. Sci. Pollut. Res. 2020, 27, 28695–28729. [Google Scholar] [CrossRef] [PubMed]
  18. Kang, Y.H.; Chen, M.; Wan, S.Q. Effects of drip irrigation with saline water on waxy maize (Zea mays L. var. ceratina Kulesh) in North China Plain. Agric. Water Manag. 2010, 97, 1303–1309. [Google Scholar] [CrossRef]
  19. Dou, C.Y.; Kang, Y.H.; Wan, S.Q.; Hu, W. Soil salinity changes under cropping with Lycium barbarum L. and irrigation with saline-sodic water. Pedosphere 2011, 21, 539–548. [Google Scholar] [CrossRef]
  20. Dong, S.D.; Wan, S.Q.; Kang, Y.H.; Sun, J.X. Effect of different soil matric potentials on distribution of soil salt and growth of Poplar (Populus) by drip irrigation in low-lying saline area. J. Soil Water Conserv. 2017, 31, 236–247. [Google Scholar] [CrossRef]
  21. Dong, S.D.; Wan, S.; Kang, Y.; Li, X.B. Prospects of using drip irrigation for ecological conservation and reclaiming highly saline soils at the edge of Yinchuan Plain. Agric. Water Manag. 2020, 239, 106255. [Google Scholar] [CrossRef]
  22. Li, D.; Wan, S.; Li, X.; Kang, Y.; Han, X. Effect of water-salt regulation drip irrigation with saline water on tomato quality in an arid region. Agric. Water Manag. 2022, 261, 107347. [Google Scholar] [CrossRef]
  23. Dong, S.D.; Wang, G.M.; Kang, Y.H.; Ma, Q.; Wan, S.Q. Soil water and salinity dynamics under the improved drip-irrigation scheduling for ecological restoration in the saline area of Yellow River basin. Agric. Water Manag. 2022, 264, 107255. [Google Scholar] [CrossRef]
  24. Ghosh, A.; Singh, A.B.; Kumar, R.V.; Manna, M.C.; Bhattacharyya, R.; Rahman, M.M.; Sharma, P.; Rajput, P.S.; Misra, S. Soil enzymes and microbial elemental stoichiometry as bio-indicators of soil quality in diverse cropping systems and nutrient management practices of Indian Vertisols. Appl. Soil Ecol. 2020, 145, 103304. [Google Scholar] [CrossRef]
  25. Karaca, A.; Cetin, S.C.; Turgay, O.C.; Kizilkaya, R. Soil Enzymes as Indication of Soil Quality. In Soil Enzymology; Soil Biology; Shukla, G., Varma, A., Eds.; Springer: Berlin/Heidelberg, Germany, 2010; Volume 22. [Google Scholar] [CrossRef]
  26. Nannipieri, P.; Trasar-Cepeda, C.; Dick, R.P. Soil enzyme activity: A brief history and biochemistry as a basis for appropriate interpretations and meta-analysis. Biol. Fertil. Soils. 2018, 54, 11–19. [Google Scholar] [CrossRef]
  27. Bowles, T.M.; Acosta-Martínez, V.; Calderón, F.; Jackson, L.E. Soil enzyme activities, microbial communities, and carbon and nitrogen availability in organic agroecosystems across an intensively-managed agricultural landscape. Soil Boil. Biochem. 2014, 68, 252–262. [Google Scholar] [CrossRef]
  28. Zagal, E.; Munoz, C.; Quiroz, M.; Cordova, C. Sensitivity of early indicators for evaluating quality changes in soil organic matter. Geoderma. 2009, 151, 191–198. [Google Scholar] [CrossRef]
  29. Burke, D.J.; Weintraub, M.N.; Hewins, C.R.; Kalisz, S. Relationship between soil enzyme activities, nutrient cycling and soil fungal communities in a northern hardwood forest. Soil Boil. Biochem. 2011, 43, 795–803. [Google Scholar] [CrossRef]
  30. Neemisha; Sharma, S. Soil Enzymes and Their Role in Nutrient Cycling. In Structure and Functions of Pedosphere; Giri, B., Kapoor, R., Wu, Q.S., Varma, A., Eds.; Springer: Singapore, 2022. [Google Scholar] [CrossRef]
  31. Rahul, R.; Sharma, P.; Singh, A.; Singh, J.; Kumar, M. Soil Enzymes and Their Role in Soil Health Improvement. In Advances in Agricultural and Industrial Microbiology; Nayak, S.K., Baliyarsingh, B., Mannazzu, I., Singh, A., Mishra, B.B., Eds.; Springer: Singapore, 2022. [Google Scholar] [CrossRef]
  32. Chrost, R.J.; Siuda, W.; Halemejko, G.Z. Long term studies on alkaline phosphatase activity(APA) in a lake with fish-aquaculture in relation to lake eutrophication and phosphorus cycle. Arch. Hydrobiol. Suppl. 1984, 70, 1–32. [Google Scholar]
  33. Sun, X.L.; Li, Y.Z.; Heinen, M.; Ritzema, H.; Hellegers, P.; Dam, J.V. Fertigation strategies to improve water and nitrogen use efficiency in surface irrigation system in the North China Plain. Agriculture 2023, 13, 17. [Google Scholar] [CrossRef]
  34. Kumar, C.; Verma, S.B.; Singh, A.K. Sustainable management of soil salinity with special reference to smart fertigation systems. Proc. Natl. Acad. Sci. India Sect. B Biol. Sci. 2023. [Google Scholar] [CrossRef]
  35. Li, Z.G. Soil and Environmental Microbiology; Science Press: Beijing, China, 2008. [Google Scholar]
  36. Ji, L.D.; Sun, Q.; Ma, X.Q.; Chu, Y.N.; Shen, R.Q. Soil enzyme activities and spatial variances in Yellow River irrigated area of Ningxia. Ecol. Environ. 2007, 16, 1737–1741, (In Chinese, with English Abstract). [Google Scholar]
  37. Qiu, L.P.; Liu, J.; Wang, Y.Q.; Sun, H.M.; He, W.X. Research on relationship between soil enzyme activities and soil fertility. Plant Nutr. Fert. Sci. 2004, 10, 277–280, (In Chinese, with English Abstract). [Google Scholar]
  38. Paz-Ferreiro, J.; Fu, S. Biological indices for soil quality evaluation: Perspectives and limitations. Land Degrad. Dev. 2016, 27, 14–25. [Google Scholar] [CrossRef]
  39. Waring, B.G.; Weintraub, S.R.; Sinsabaugh, R.L. Ecoenzymatic stoichiometry of microbial nutrient acquisition in tropical soils. Biogeochemistry 2014, 117, 101–113. [Google Scholar] [CrossRef]
  40. Lange, M.; Eisenhauer, N.; Sierra, C.A.; Bessler, H.; Engels, C.; Griffiths, R.I.; Mellado-Vázquez, P.G.; Malik, A.A.; Roy, J.; Scheu, S.; et al. Plant diversity increases soil microbial activity and soil carbon storage. Nat. Commun. 2015, 6, 6707. [Google Scholar] [CrossRef] [PubMed]
  41. Spohn, M.; Bagchi, S.; Biederman, L.A.; Borer, E.T.; Bråthen, K.A.; Bugalho, M.N.; Caldeira, M.C.; Catford, J.A.; Collins, S.L.; Eisenhauer, N.; et al. The positive effect of plant diversity on soil carbon depends on climate. Nat. Commun. 2023, 14, 6624. [Google Scholar] [CrossRef] [PubMed]
  42. Smith, A.P.; Marín-Spiotta, E.; Graaff, M.A.D.; Balser, T.C. Microbial community structure varies across soil organic matter aggregate pools during tropical land cover change. Soil Biol. Biochem. 2014, 77, 292–303. [Google Scholar] [CrossRef]
  43. Shedeed, S.I.; Zaghloul, S.M.; Yassen, A.A. Effect of method and rate of fertilizer application under drip irrigation on yield and nutrient uptake by tomato. Ozean. J. Appl. Sci. 2009, 2, 139–147. [Google Scholar]
  44. Tiwari, K.N.; Kumar, M.; Santosh, D.T.; Singh, V.K.; Maji, M.K.; Karan, A.K. Influence of drip irrigation and plastic mulch on yield of sapota (achraszapota) and soil nutrients. Irrig. Drain. Syst. Eng. 2014, 3, 116. [Google Scholar] [CrossRef]
  45. Wang, L.; Hamel, C.; Lu, P.; Wang, J.; Sun, D.; Wang, Y.; Lee, S.J.; Gan, G.Y. Using enzyme activities as an indicator of soil fertility in grassland -an academic dilemma. Front. Plant Sci. 2023, 14, 1175946. [Google Scholar] [CrossRef]
  46. Davies, B.; Coulter, J.A.; Pagliari, P.H. Soil enzyme activity behavior after urea nitrogen application. Plants 2022, 11, 2247. [Google Scholar] [CrossRef]
  47. Wallenstein, M.D.; Mcmahon, S.K.; Schimel, J.P. Seasonal variation in enzyme activities and temperature sensitivities in Arctic tundra soils. Glob. Chang. Biol. 2009, 15, 1631–1639. [Google Scholar] [CrossRef]
  48. Krajewska, B.; Ureases, I. Functional, catalytic and kinetic properties: A review. J Mol Catal B-Enzym. 2009, 59, 9–21. [Google Scholar] [CrossRef]
  49. Chen, Y.X.; Wei, T.X.; Sha, G.L.; Zhu, Q.K.; Liu, Z.; Ren, K.; Yang, C. Soil enzyme activities of typical plant communities after vegetation restoration on the Loess Plateau, China. Appl. Soil Ecol. 2022, 170, 104292. [Google Scholar] [CrossRef]
  50. Mungai, N.W.; Motavalli, P.P.; Kremer, R.J.; Nelson, K.A. Spatial variation of soil enzyme activities and microbial functional diversity in temperate alley cropping systems. Biol. Fert. Soils 2005, 42, 129–136. [Google Scholar] [CrossRef]
  51. Aon, M.; Colaneri, A., II. Temporal and spatial evolution of enzymatic activities and physico-chemical properties in an agricultural soil. Appl. Soil Ecol. 2001, 18, 255–270. [Google Scholar] [CrossRef]
  52. Azam, H.M.; Alam, S.T.; Hasan, M.; Yameogo, D.D.S.; Kannan, A.D.; Rahman, A.; Kwon, M.J. Phosphorous in the environment: Characteristics with distribution and effects, removal mechanisms, treatment technologies, and factors affecting recovery as minerals in natural and engineered systems. Environ. Sci. Pollut. Res. 2019, 26, 20183–20207. [Google Scholar] [CrossRef]
  53. Chen, X.D.; Jiang, N.; Condronc, L.M.; Dunfieldd, K.E.; Chen, Z.H.; Wang, J.K.; Chen, L.J. Soil alkaline phosphatase activity and bacterial phoD gene abundance and diversity under long-term nitrogen and manure inputs. Geoderma 2019, 349, 36–44. [Google Scholar] [CrossRef]
  54. Zheng, M.M.; Wang, C.; Li, W.X.; Guo, L.; Cai, Z.J.; Wang, B.R.; Chen, J.; Shen, R.F. Changes of acid and alkaline phosphatase activities in long-term chemical fertilization are driven by the similar soil properties and associated microbial community composition in acidic soil. Eur. J. Soil Biol. 2021, 104, 103312. [Google Scholar] [CrossRef]
  55. Chhabra, S.; Brazil, D.; Morrissey, J.; Burke, J.; O’Gara, F.; Dowling, D.N. Fertilization management affects the alkaline phosphatase bacterial community in barley rhizosphere soil. Biol. Fertil. Soils. 2013, 49, 31–39. [Google Scholar] [CrossRef]
  56. Lemanowicz, J.; Krzyżaniak, M. Vertical distribution of phosphorus concentrations, phosphatase activity and further soil chemical properties in salt-affected Mollic Gleysols in Poland. Environ. Earth Sci. 2015, 74, 2719–2728. [Google Scholar] [CrossRef]
  57. Frankenberger, W.T.; Johanson, J.B. Factors affecting invertase activity in soils. Plant Soil 1983, 74, 313–323. [Google Scholar] [CrossRef]
  58. Pancholy, S.K.; Rice, E.L. Carbohydrases in soil as affected by successional stages of revegetation. Soil Sci. Soc. Am. Proc. 1973, 37, 227–229. [Google Scholar] [CrossRef]
  59. Sun, H.; Jiang, S.; Jiang, C.; Wu, C.F.; Gao, M.; Wang, Q.H. A review of root exudates and rhizosphere microbiome for crop production. Environ. Sci. Pollut. Res. 2021, 28, 54497–54510. [Google Scholar] [CrossRef] [PubMed]
  60. Kulshrestha, S.; Tyagi, P.; Sindhi, V.; Yadavilli, K.S. Invertase and its applications—A brief review. J. Pharm. Res. 2013, 7, 792–797. [Google Scholar] [CrossRef]
Figure 1. URE activity (μg NH4+·g−1·h−1) distribution in soil profile for different years after planting.
Agronomy 14 01416 g001
Figure 2. Changes in URE activities with horizontal distance (0, 10, 20 and 30 cm) and soil depth (0–10, 10–20, 20–30 and 30–40 cm) for different years after planting. (a) Horizontal direction; (b) vertical direction.
Agronomy 14 01416 g002
Figure 3. Changes in average URE activity of soil profile with number of years after planting (in the fitted function, dependent variable y is the value of corresponding enzyme activity, and independent variable x stands for the number of years after planting; x = 0, 1, 2, 3, 4). Different letters on the error line mean significant correlation at the 0.05 level of probability (bilateral). Error bars indicate standard deviation and specify sample size n = 9. F-test was applied to check for significance of differences.
Agronomy 14 01416 g003
Figure 4. ALP activity (μg ph(OH)·g−1·h−1) distribution in soil profile for different years after planting.
Agronomy 14 01416 g004
Figure 5. Changes in ALP activities with horizontal distance (0, 10, 20 and 30 cm) and soil depth (0–10, 10–20, 20–30 and 30–40 cm) for different years after planting. (a) Horizontal direction; (b) vertical direction.
Agronomy 14 01416 g005
Figure 6. Changes in average ALP activity of soil profile with number of years after planting (in the fitted function, dependent variable y is the value of corresponding enzyme activity, and independent variable x stands for the number of years after planting; x = 0, 1, 2, 3, 4). Different letters on the error line mean significant correlation at the 0.05 level of probability (bilateral). Error bars indicate standard deviation and specify sample size n = 9. F-test was applied to check for significance of differences.
Agronomy 14 01416 g006
Figure 7. INV activity (μg glu·g−1·h−1) distribution in soil profile for different years after planting.
Agronomy 14 01416 g007
Figure 8. Changes in INV activities with horizontal distance (0, 10, 20 and 30 cm) and soil depth (0–10, 10–20, 20–30 and 30–40 cm) for different years after planting. (a) Horizontal direction; (b) vertical direction.
Agronomy 14 01416 g008
Figure 9. Changes in average INV activity of soil profile with the number of years after planting (in the fitted function, dependent variable y is the value of corresponding enzyme activity, and independent variable x stands for the number of years after planting; x = 0, 1, 2, 3, 4). Different letters on the error line mean significant correlation at the 0.05 level of probability (bilateral). Error bars indicate standard deviation and specify sample size n = 9. F-test was applied to check for significance of differences.
Agronomy 14 01416 g009
Table 1. pH, electrical conductivity of saturated paste extract (ECe), and concentrations of major ions (soil/water = 1:5) in the experimental field.
Soil Layer
cm
pHECe
dS·m−1
Major Anions, mmol·L−1Major Cations, mmol·L−1
HCO3SO42−ClK+Na+Ca2+Mg2+
0–107.562.36.024.5260.60.5219.010.020.3
10–207.813.58.01.022.50.121.81.55.1
20–307.89.08.00.513.50.18.21.54.1
30–407.810.27.52.013.50.08.22.04.1
Table 2. pH, total dissolved solids (TDS), and ionic concentrations in the irrigation water.
pHTDS
g·L−1
Major Anions, mmol·L−1Major Cations/mmol·L−1
HCO3SO42−ClK+Na+Ca2+Mg2+
7.67.277.415.379.40.396.13.37.5
Disclaimer/Publisher’s Note: The statements, opinions and data contained in all publications are solely those of the individual author(s) and contributor(s) and not of MDPI and/or the editor(s). MDPI and/or the editor(s) disclaim responsibility for any injury to people or property resulting from any ideas, methods, instructions or products referred to in the content.

