

Optimizing Cover Crop Management in Eastern Nebraska: Insights from Crop Simulation Modeling

 , ,
, ,  , , ,
, , , 
 , , , , , ,
Abstract
1. Introduction
2. Data and Methods
2.1. Crop Models (and Cultivars)
2.2. Crop Model Input Data
2.3. Agronomic Management Scenarios
2.3.1. Cover Crop Planting Date
2.3.2. Cover Crop Termination-Corn Planting Interval
2.3.3. Cover Crop Termination Date
2.4. Statistical Analysis
3. Result and Discussion
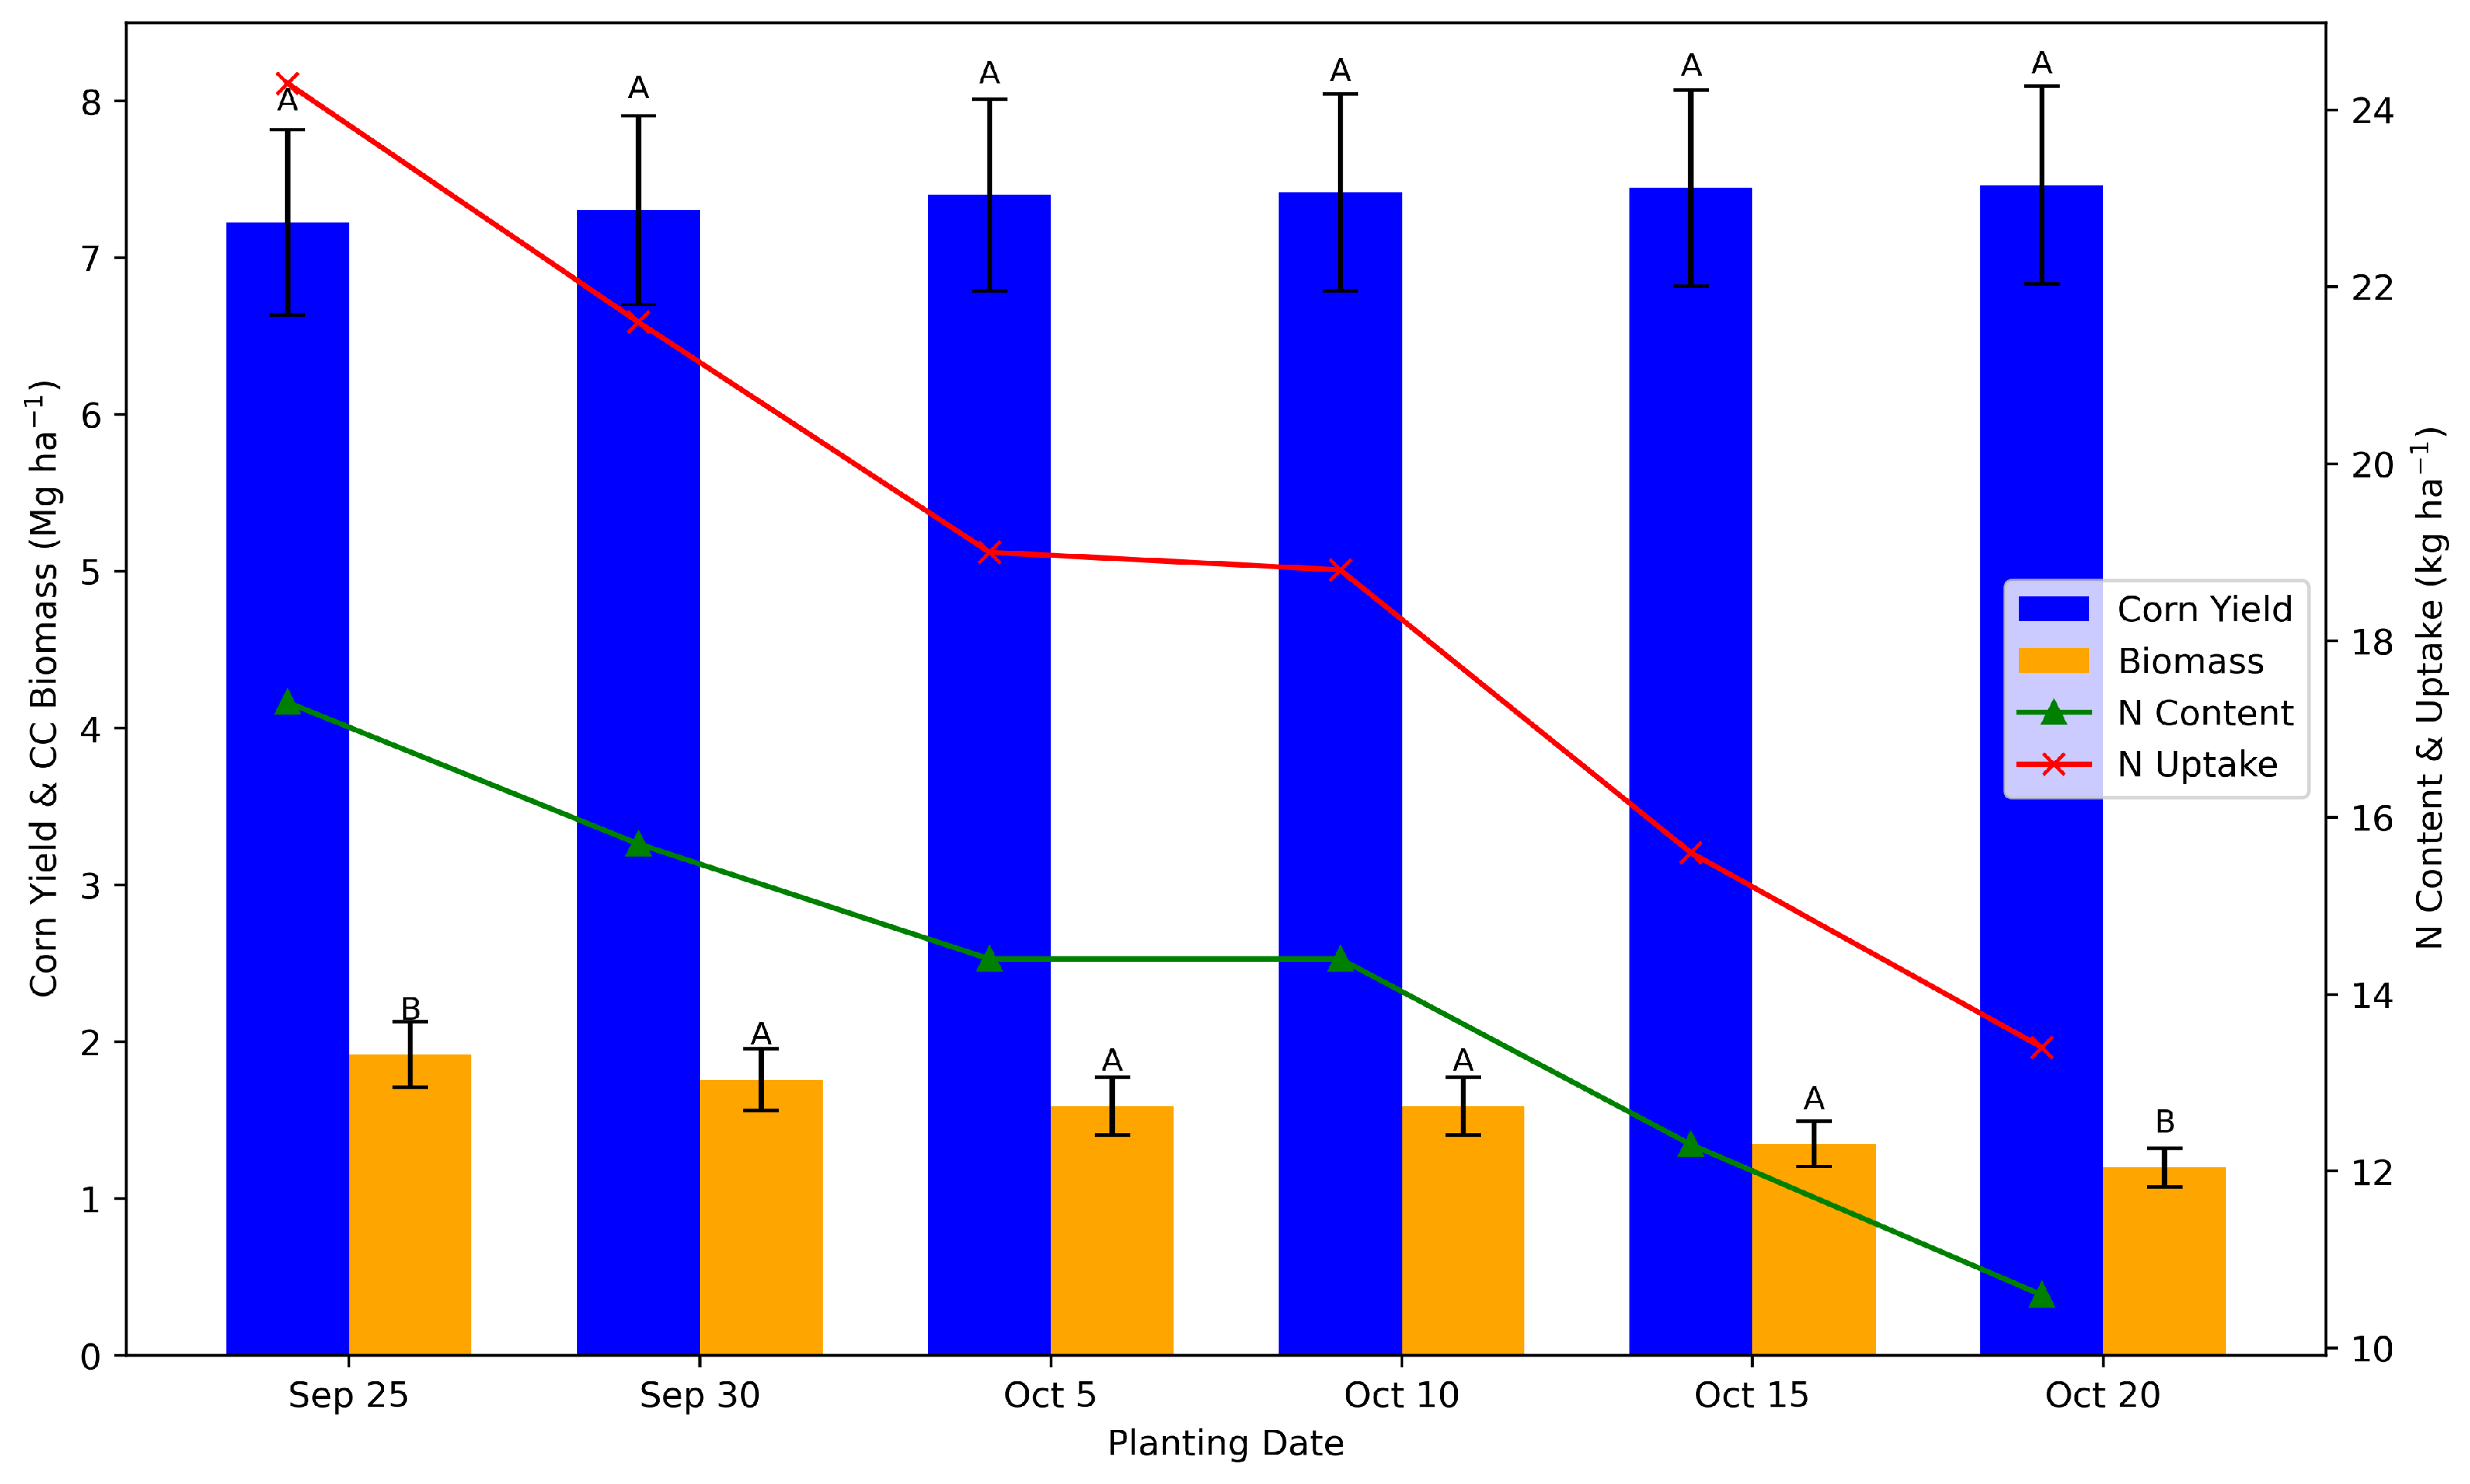
3.1. Cover Crop Planting Date
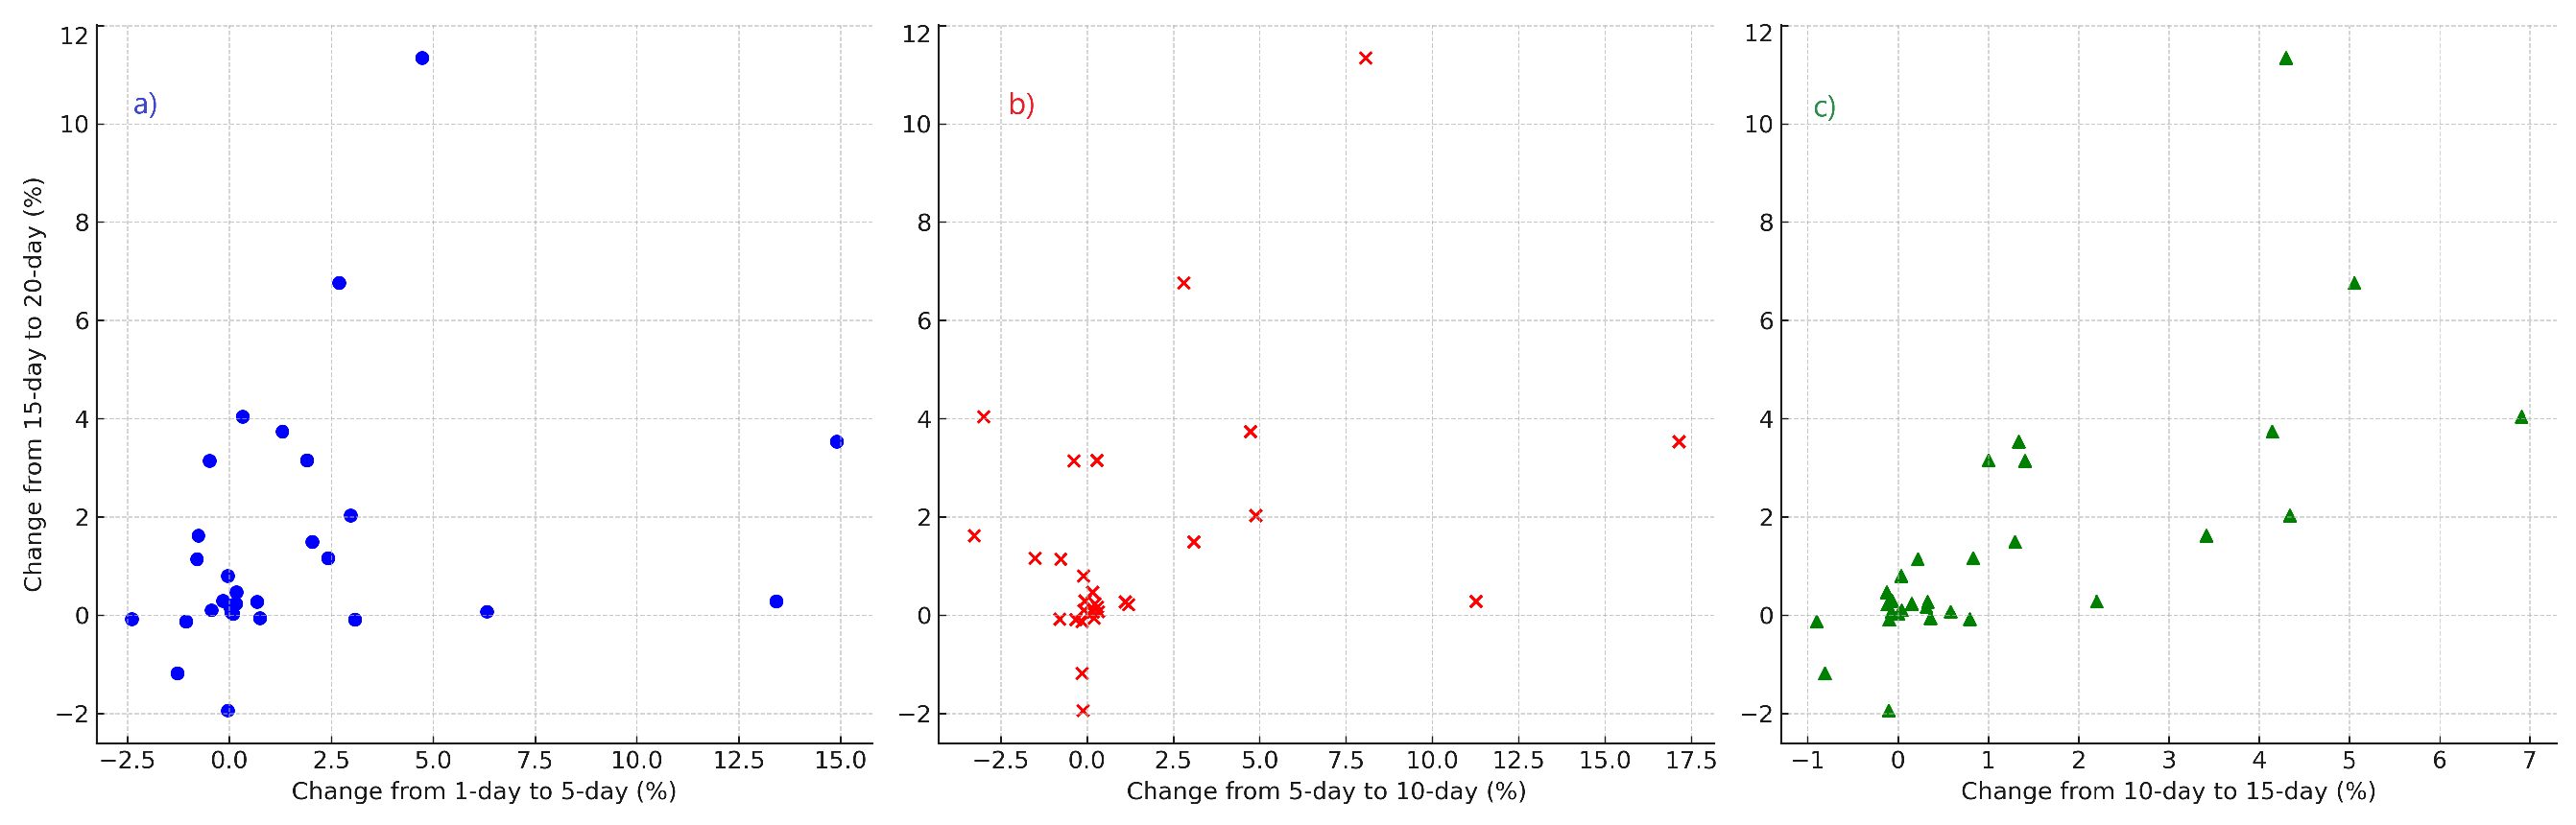
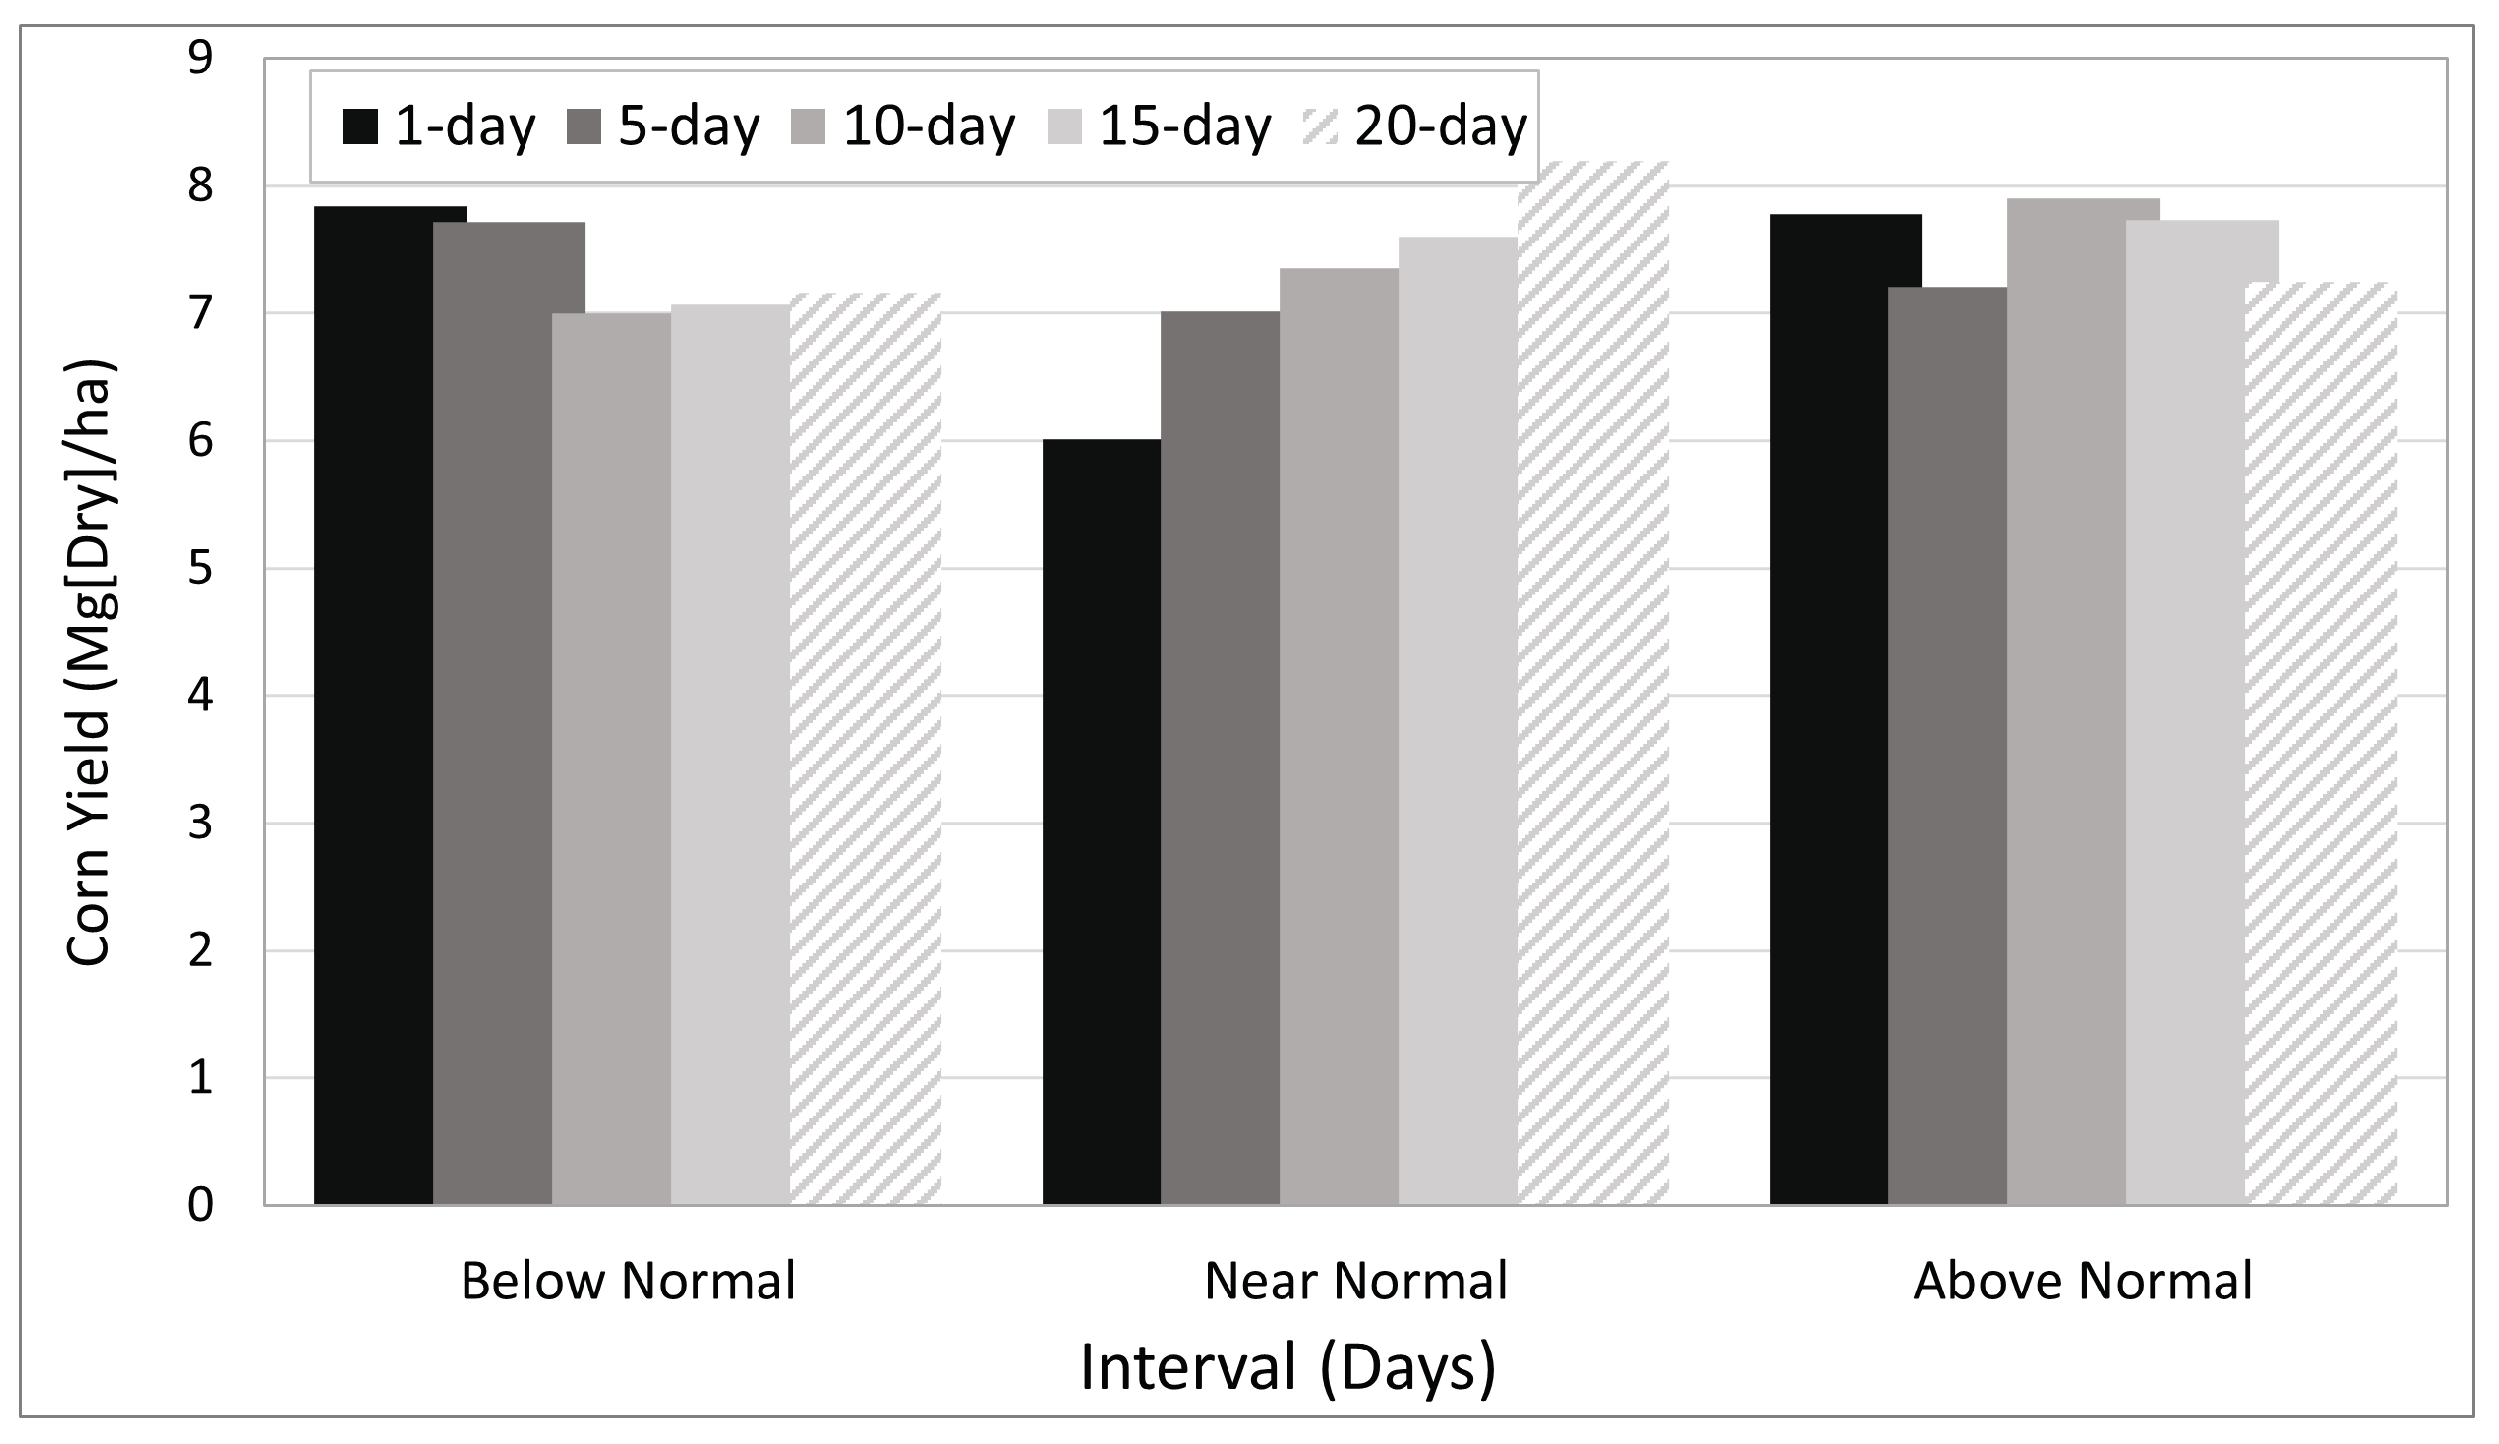
3.2. Termination-Planting Interval
Corn Yield
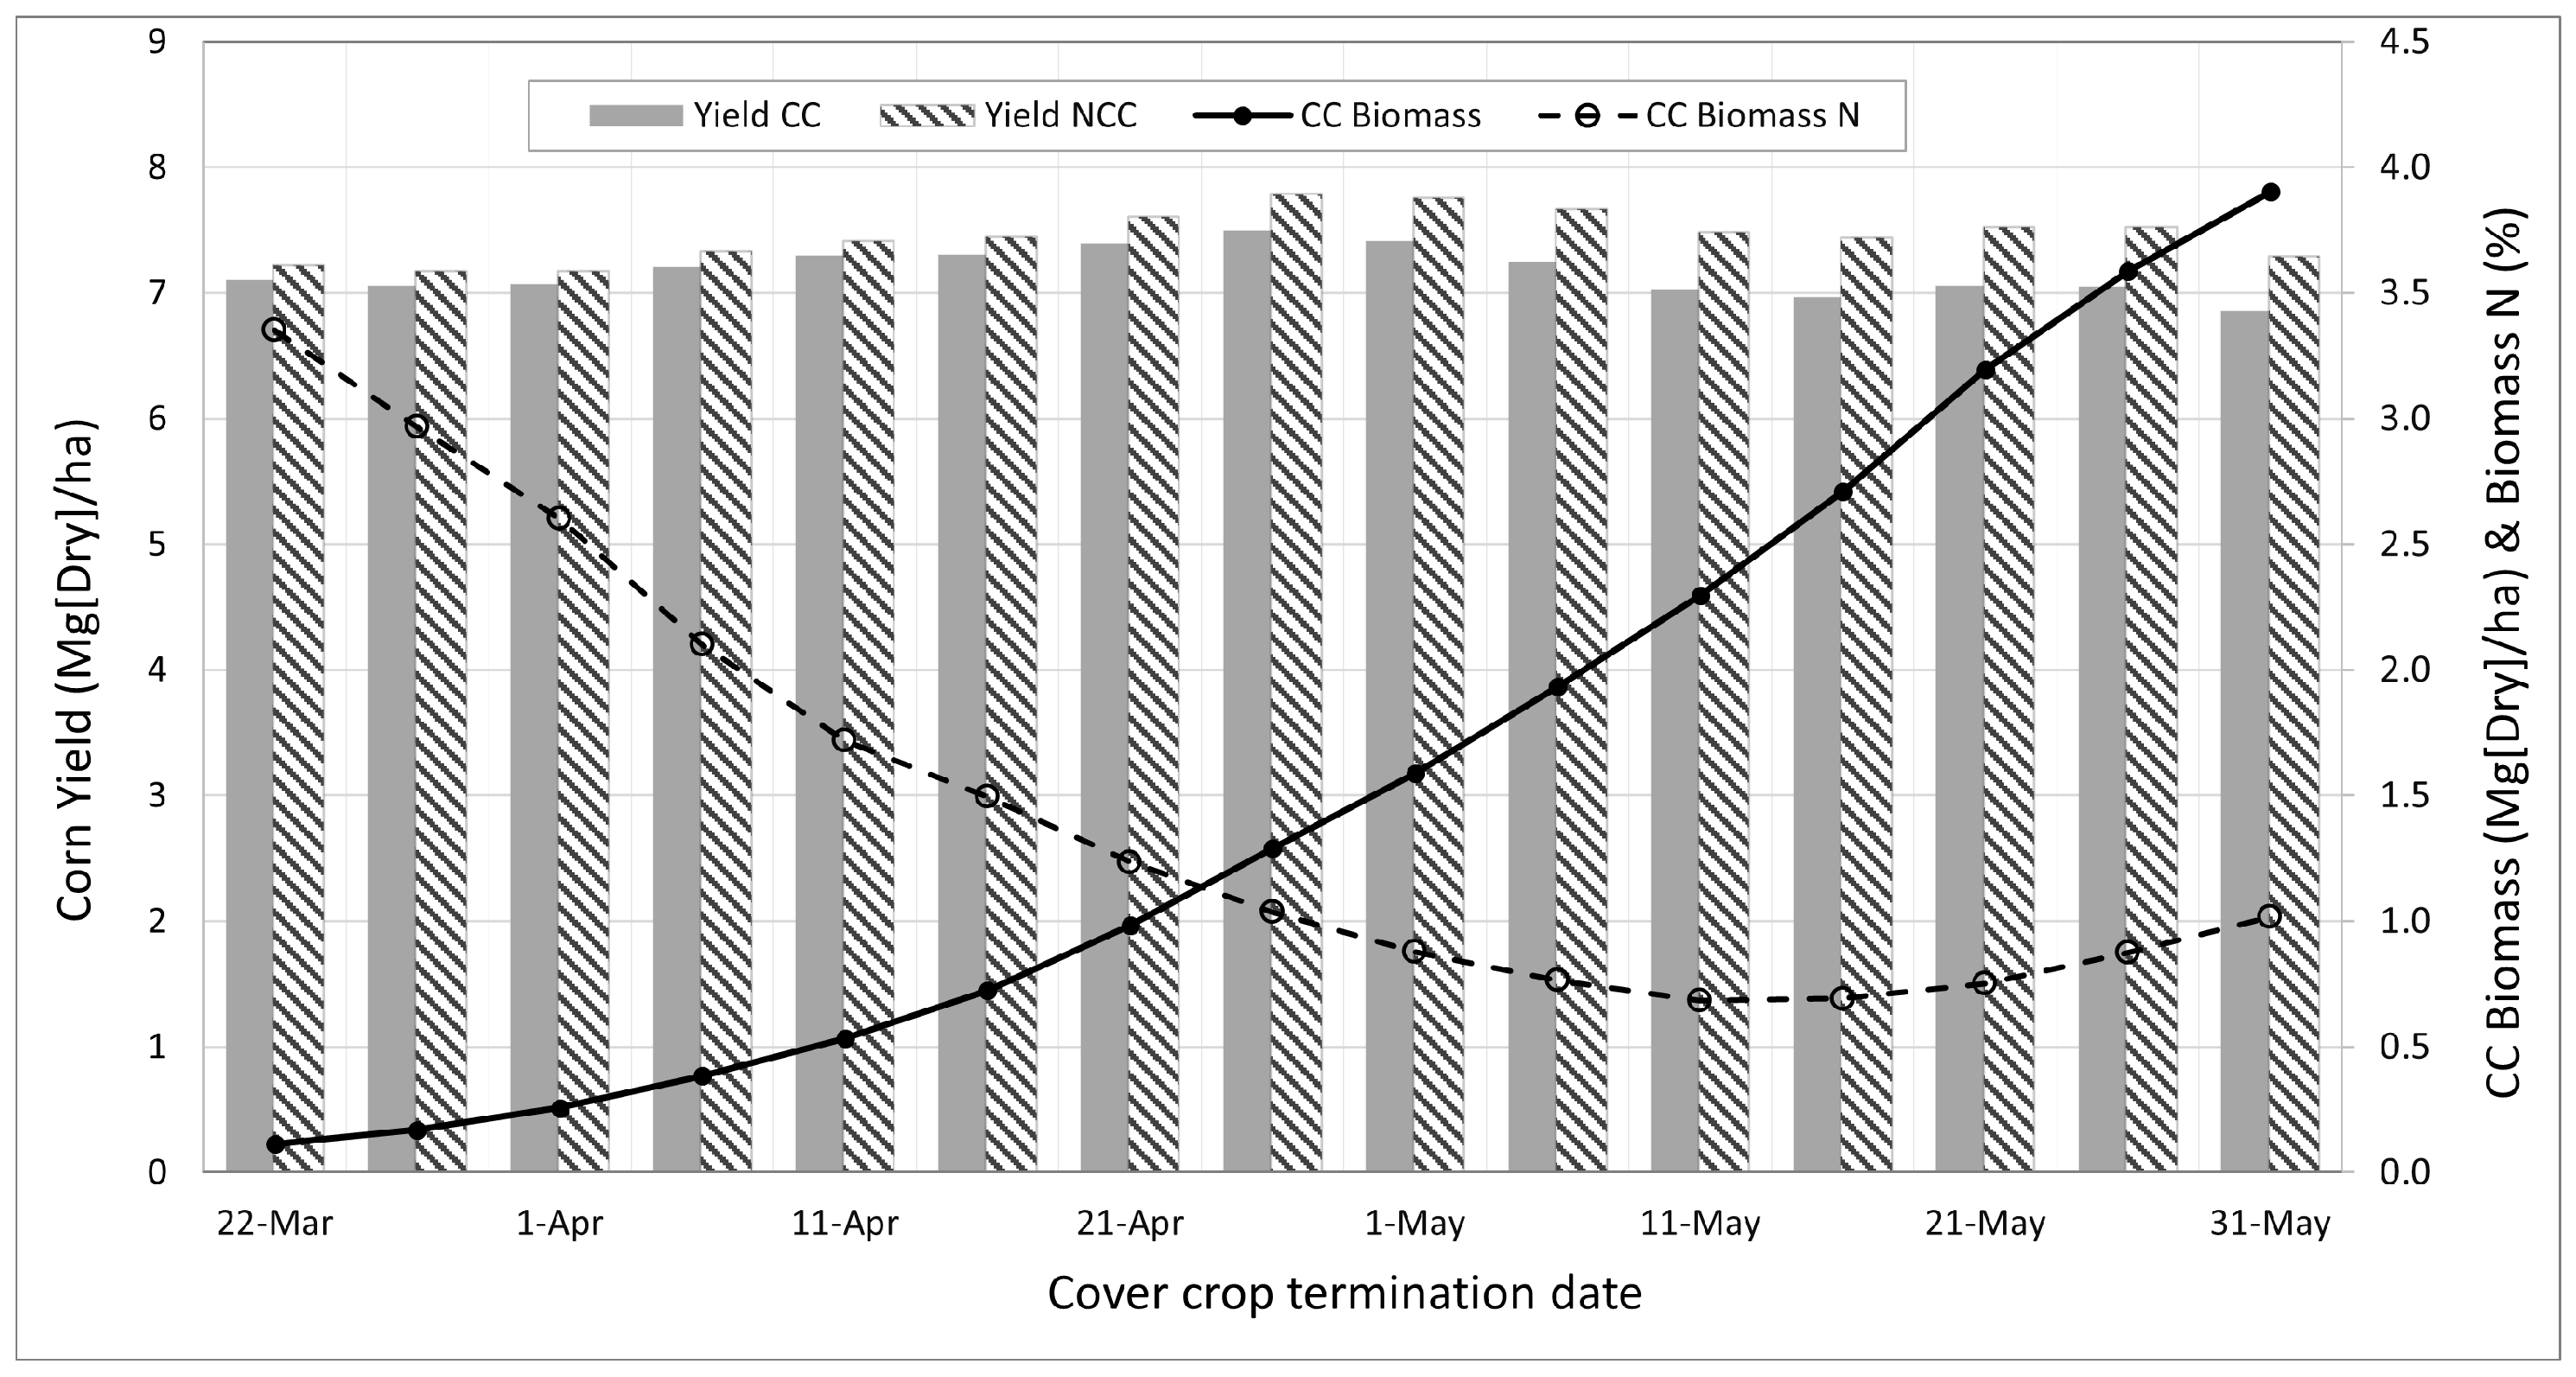
3.3. Cover Crop Termination Date
3.3.1. Corn Yield
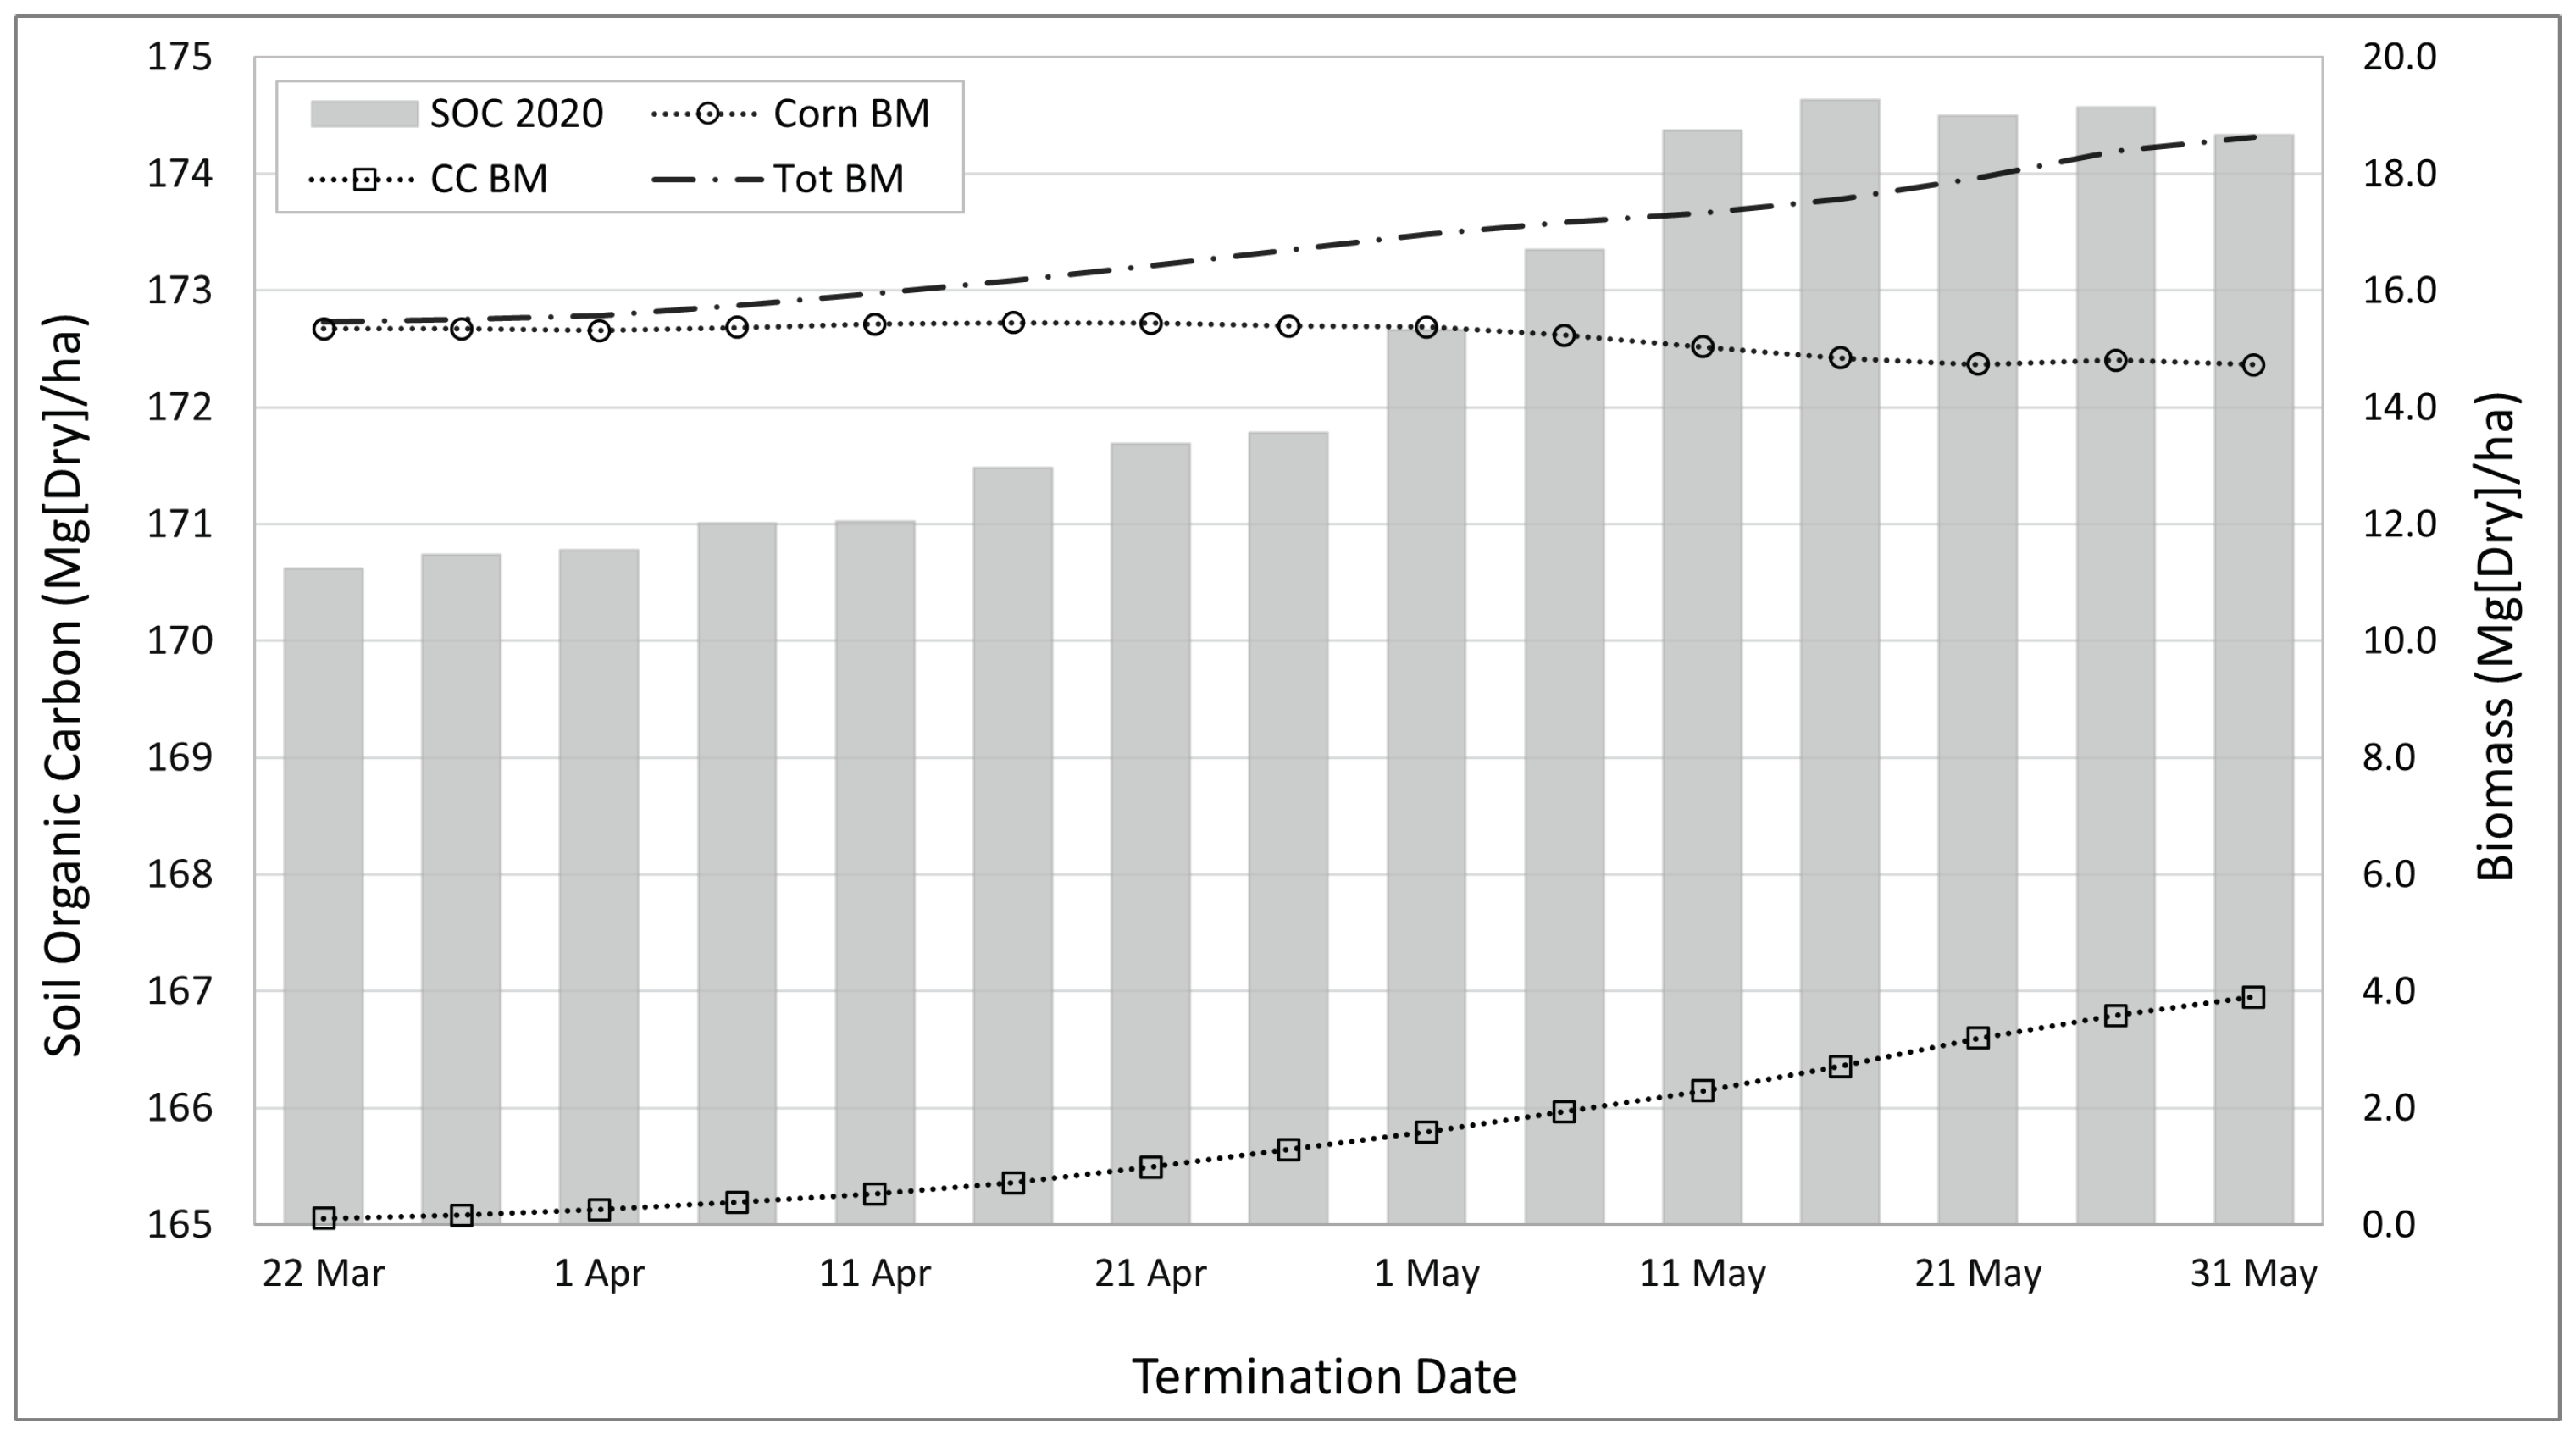
3.3.2. Cover Crop Biomass
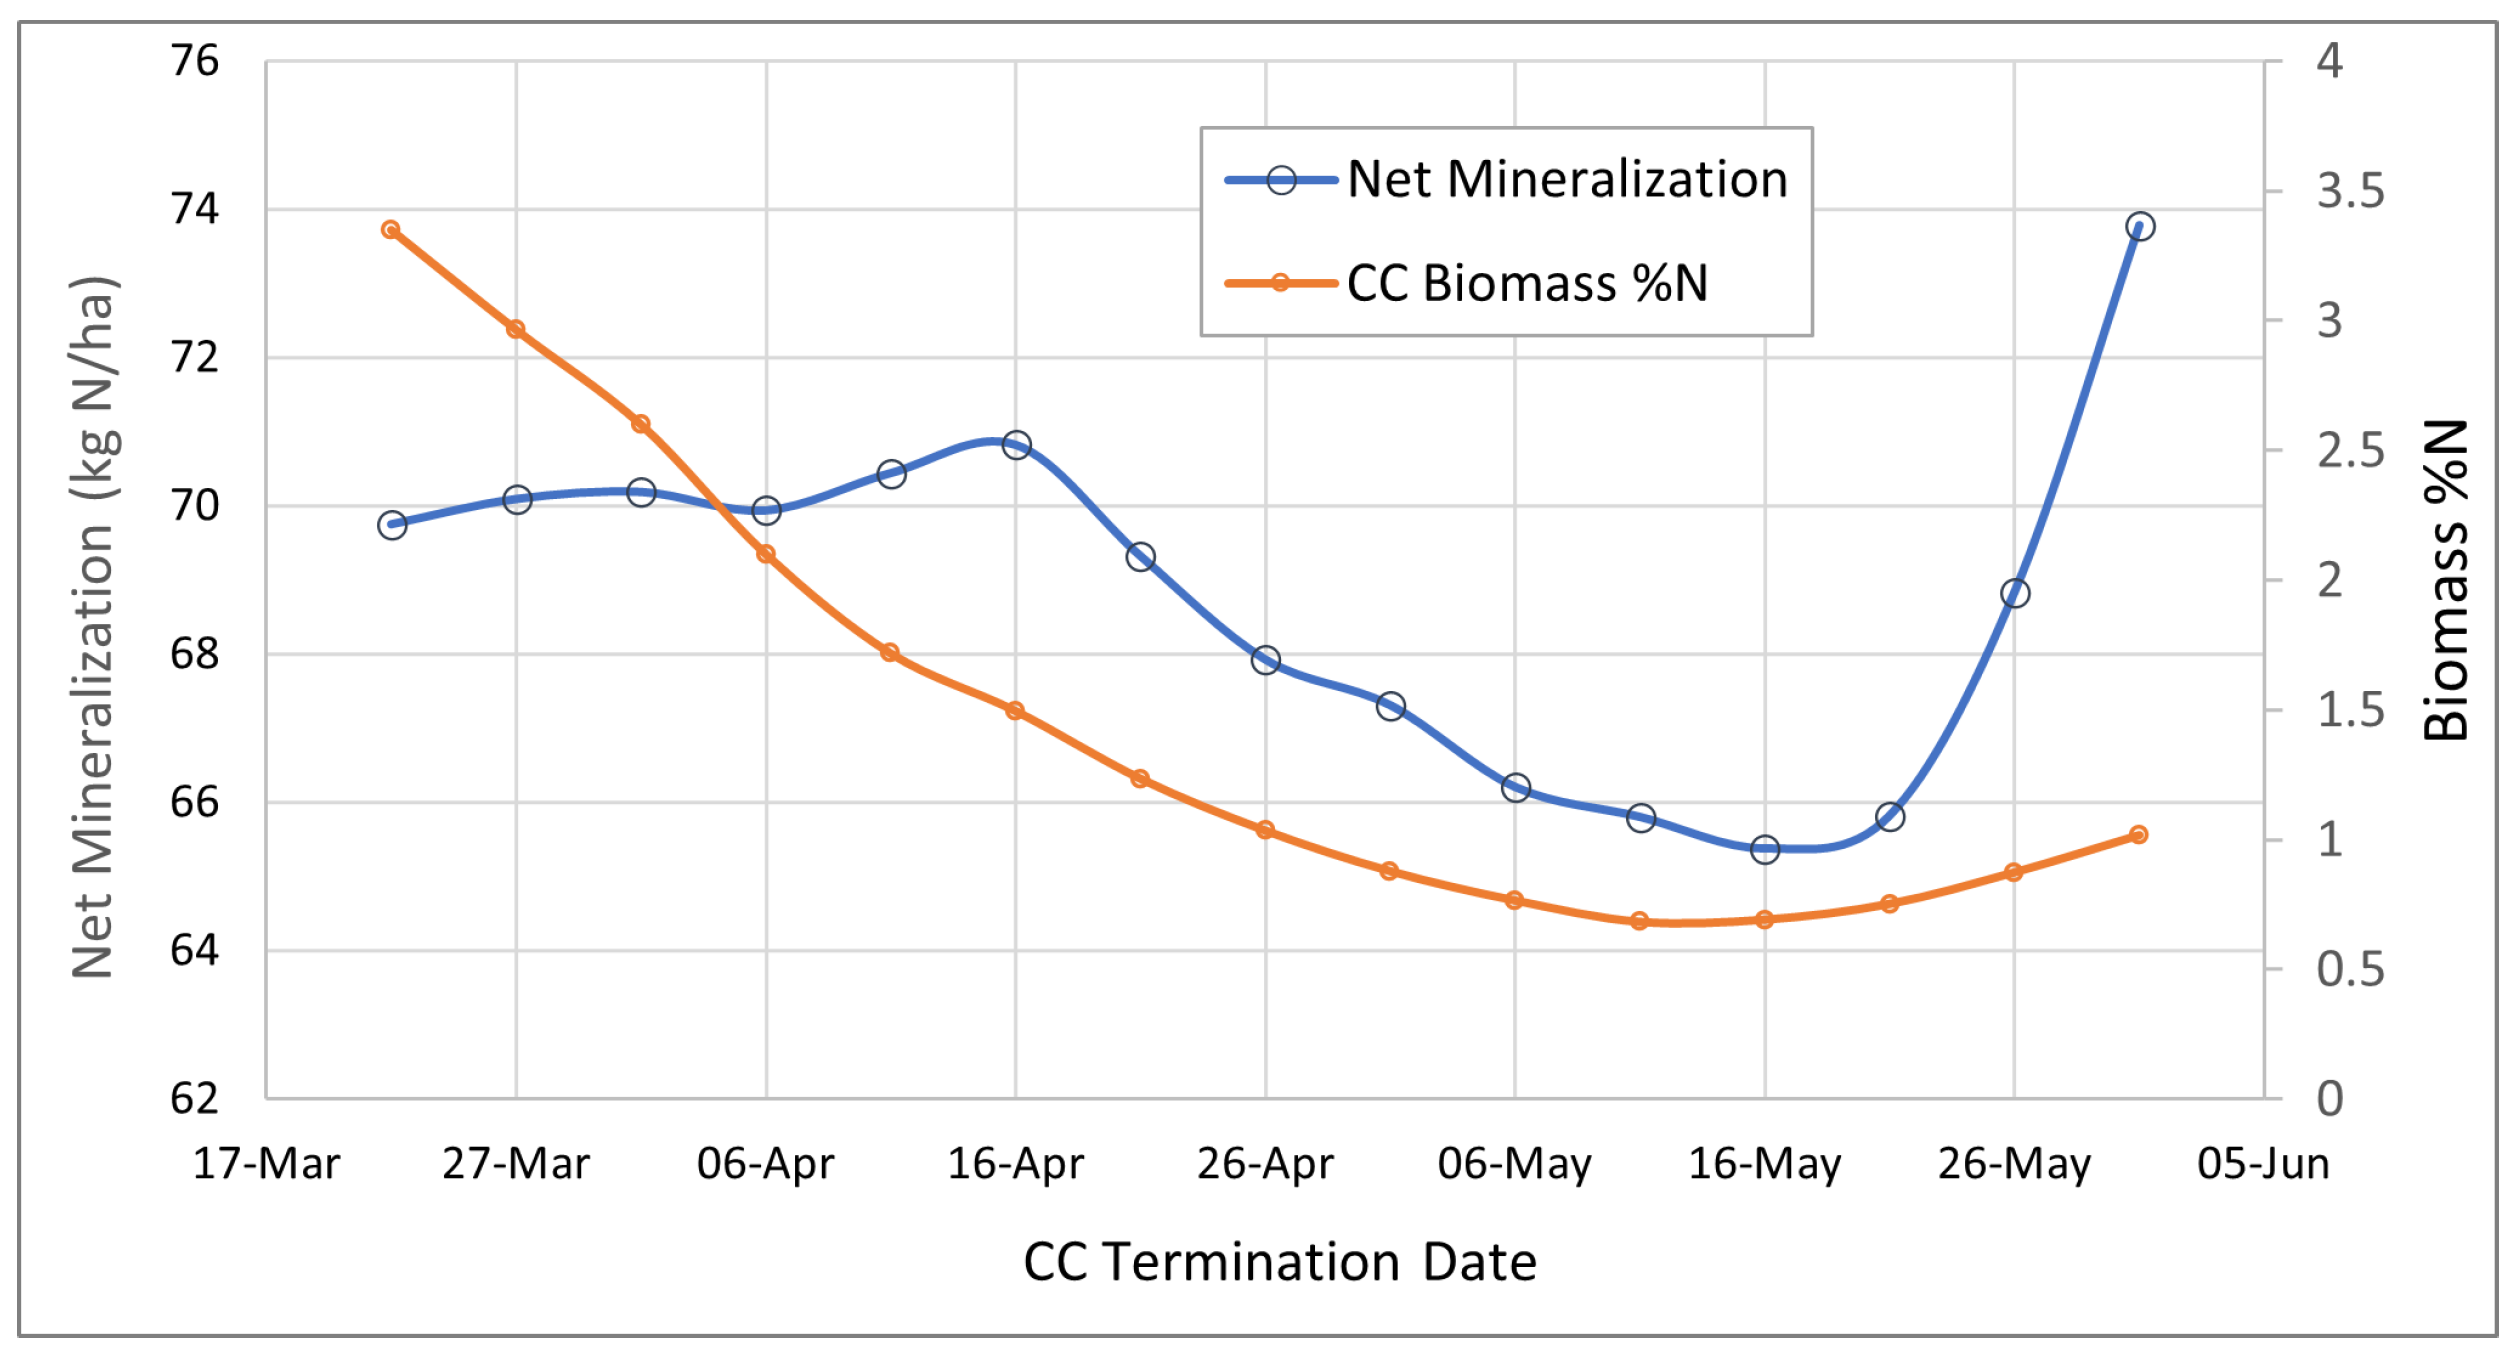
3.3.3. Cover Crop Biomass Quality
3.4. Termination Efficiency
3.5. Practical Considerations in the Use of Simulation Outputs
3.5.1. Model Calibration and Validation
3.5.2. Addressing Uncertainties in Simulation Inputs
3.5.3. Integration with Other Data Sources
4. Conclusions
Author Contributions
Funding
Data Availability Statement
Conflicts of Interest
References
- Blanco-Canqui, H.; Lal, R. Mechanisms of carbon sequestration in soil aggregates. Crit. Rev. Plant Sci. 2004, 23, 481–504. [Google Scholar] [CrossRef]
- Blanco-Canqui, H. Cover Crops and Ecosystem Services: Insights from Studies in Temperate Soils. Agron. J. 2015, 107, 2449–2474. [Google Scholar] [CrossRef]
- Kaspar, T.C.; Bakker, M.G. Biomass production of 12 winter cereal cover crop cultivars and their effect on subsequent no-till corn yield. J. Soil Water Conserv. 2015, 70, 353–364. [Google Scholar] [CrossRef]
- Baligar, V.C.; Fageria, N.K.; Bailey, B.A. Role of Cover Crops in Improving Soil and Row Crop Productivity. Commun. Soil Sci. Plant Anal. 2005, 36, 2733–2757. [Google Scholar] [CrossRef]
- Phatak, S.; Sumner, D.; Chalfant, R.; Gay, J.; Chandler, L.; Bugg, R.; Brunson, K. Managing Cover Crops Profitably. HortScience 1995, 30, 429f–429. [Google Scholar] [CrossRef]
- Malone, R.; Kersebaum, K.; Kaspar, T.; Ma, L.; Jaynes, D.; Gillette, K. Winter rye as a cover crop reduces nitrate loss to subsurface drainage as simulated by HERMES. Agric. Water Manag. 2017, 184, 156–169. [Google Scholar] [CrossRef]
- Oliveira, M.C.; Butts, L.; Werle, R. Assessment of Cover Crop Management Strategies in Nebraska, US. Agriculture 2019, 9, 124. [Google Scholar] [CrossRef]
- Wallander, S.; Smith, D.; Bowman, M.; Claassen, R. Cover crop trends, programs, and practices in the United States. In Economic Information Bulletin; US Department of Agriculture: Washington, DC, USA, 2021. [Google Scholar]
- Eash, L.; Berrada, A.F.; Russell, K.; Fonte, S.J. Cover Crop Impacts on Water Dynamics and Yields in Dryland Wheat Systems on the Colorado Plateau. Agronomy 2021, 11, 1102. [Google Scholar] [CrossRef]
- Hashemi, M.; Farsad, A.; Sadeghpour, A.; Weis, S.A.; Herbert, S.J. Cover-crop seeding-date influence on fall nitrogen recovery. J. Plant Nutr. Soil Sci. 2013, 176, 69–75. [Google Scholar] [CrossRef]
- Krueger, E.S.; Ochsner, T.E.; Porter, P.M.; Baker, J.M. Winter Rye Cover Crop Management Influences on Soil Water, Soil Nitrate, and Corn Development. Agron. J. 2011, 103, 316–323. [Google Scholar] [CrossRef]
- Ruis, S.J.; Blanco-Canqui, H.; Elmore, R.W.; Proctor, C.; Koehler-Cole, K.; Ferguson, R.B.; Francis, C.A.; Shapiro, C.A. Impacts of cover crop planting dates on soils after four years. Agron. J. 2020, 112, 1649–1665. [Google Scholar] [CrossRef]
- Wells, M.S.; Reberg-Horton, S.C.; Mirsky, S.B. Planting Date Impacts on Soil Water Management, Plant Growth, and Weeds in Cover-Crop-Based No-Till Corn Production. Agron. J. 2016, 108, 162–170. [Google Scholar] [CrossRef]
- Almeida, T.F.; Robinson, E.; Matthiesen-Anderson, R.; Robertson, A.E.; Basche, A. Effect of cover crop species and termination timing on corn growth and seedling disease. Agron. J. 2024, 116, 1792–1803. [Google Scholar] [CrossRef]
- Qin, Z.; Guan, K.; Zhou, W.; Peng, B.; Villamil, M.B.; Jin, Z.; Tang, J.; Grant, R.; Gentry, L.; Margenot, A.J.; et al. Assessing the impacts of cover crops on maize and soybean yield in the U.S. Midwestern agroecosystems. Field Crops Res. 2021, 273, 108264. [Google Scholar] [CrossRef]
- Rosa, A.T.; Creech, C.F.; Elmore, R.W.; Rudnick, D.R.; Lindquist, J.L.; Fudolig, M.; Butts, L.; Werle, R. Implications of cover crop planting and termination timing on rainfed maize production in semi-arid cropping systems. Field Crops Res. 2021, 271, 108251. [Google Scholar] [CrossRef]
- Martinez-Feria, R.A.; Dietzel, R.; Liebman, M.; Helmers, M.J.; Archontoulis, S.V. Rye cover crop effects on maize: A system-level analysis. Field Crops Res. 2016, 196, 145–159. [Google Scholar] [CrossRef]
- Birru, G.; Shiferaw, A.; Tadesse, T.; Schmer, M.R.; Jin, V.L.; Wardlow, B.; Koehler-Cole, K.; Awada, T.; Beebout, S.; Tsegaye, T.; et al. Simulated impacts of winter rye cover crop on continuous corn yield and soil parameters. Agron. J. 2023, 115, 1114–1130. [Google Scholar] [CrossRef]
- Birru, G.; Shiferaw, A.; Tadesse, T.; Wardlow, B.; Jin, V.L.; Schmer, M.; Awada, T.; Kharel, T.; Iqbal, J. Cover crop performance under a changing climate in continuous corn system over Nebraska. J. Environ. Qual. 2024, 53, 66–77. [Google Scholar] [CrossRef] [PubMed]
- Chatterjee, N.; Archontoulis, S.V.; Bastidas, A.; Proctor, C.A.; Elmore, R.W.; Basche, A. Simulating winter rye cover crop production under alternative management in a corn-soybean rotation. Agron. J. 2020, 112, 4648–4665. [Google Scholar] [CrossRef]
- Jones, C. Predicting the Impacts of Cover Crop Management Practices on Corn Yield: A Simulation Modeling Approach. J. Agric. Sci. Technol. 2021, 23, 837–851. [Google Scholar]
- Li, Y. Modeling the Long-Term Effects of Cover Crops on Crop Production and Soil Health. Agric. Syst. 2019, 172, 42–52. [Google Scholar]
- Jones, J.; Hoogenboom, G.; Porter, C.; Boote, K.; Batchelor, W.; Hunt, L.; Wilkens, P.; Singh, U.; Gijsman, A.; Ritchie, J. The DSSAT cropping system model. Eur. J. Agron. 2003, 18, 235–265. [Google Scholar] [CrossRef]
- Duiker, S.W. Establishment and Termination Dates Affect Fall-Established Cover Crops. Agron. J. 2014, 106, 670–678. [Google Scholar] [CrossRef]
- Baron, V.S.; Dick, A.C.; Salmon, D.F.; Mcleod, J.G. Fall Seeding Date and Species Effects on Spring Forage Yield of Winter Cereals. J. Prod. Agric. 1999, 12, 110–115. [Google Scholar] [CrossRef]
- Hayden, Z.D.; Ngouajio, M.; Brainard, D.C. Planting Date and Staggered Seeding of Rye–Vetch Mixtures: Biomass, Nitrogen, and Legume Winter Survival. Agron. J. 2015, 107, 33–40. [Google Scholar] [CrossRef]
- Lawson, A.; Cogger, C.; Bary, A.; Fortuna, A.M. Influence of Seeding Ratio, Planting Date, and Termination Date on Rye-Hairy Vetch Cover Crop Mixture Performance under Organic Management. PLoS ONE 2015, 10, e0129597. [Google Scholar] [CrossRef]
- Farsad, A.; Randhir, T.O.; Herbert, S.J.; Hashemi, M. Spatial Modeling of Critical Planting Date for Winter Rye Cover Crop to Enhance Nutrient Recovery. Agron. J. 2011, 103, 1252–1257. [Google Scholar] [CrossRef]
- NRCS. Cover Crop Termination Guidelines Version 4; USDA Natural Resources Conservation Service: Washington, DC, USA, 2019.
- Acharya, J.; Bakker, M.G.; Moorman, T.B.; Kaspar, T.C.; Lenssen, A.W.; Robertson, E.A. Time Interval Between Cover Crop Termination and Planting Influences Corn Seedling Disease, Plant Growth, and Yield. Plant Dis. 2017, 101, 591–600. [Google Scholar] [CrossRef] [PubMed]
- Dittlinger, D.; Green, V.; Brown, E.; Massey, J. Effect of Cover Crop Termination Timing on Corn Population and Yield. In University of Arkansas Research Series; Division of Agriculture, University of Arkansas System: Fayetteville, AK, USA, 2021; p. 43. [Google Scholar]
- Ball Coelho, B.R.; Roy, R.C.; Bruin, A.J. Long-term effects of late-summer overseeding of winter rye on corn grain yield and nitrogen balance. Can. J. Plant Sci. 2005, 85, 543–554. [Google Scholar] [CrossRef]
- Blanco-Canqui, H.; Shapiro, C.A.; Wortmann, C.S.; Drijber, R.A.; Mamo, M.; Shaver, T.M.; Ferguson, R.B. Soil organic carbon: The value to soil properties. J. Soil Water Conserv. 2013, 68, 129A–134A. [Google Scholar] [CrossRef]
- Irmak, S.; Sharma, V.; Mohammed, A.; Djaman, K. Impacts of cover crops on soil physical properties: Field capacity, permanent wilting point, soil-water holding capacity, bulk density, hydraulic conductivity, and infiltration. Trans. ASABE 2018, 61, 1307–1321. [Google Scholar] [CrossRef]
- Rankoth, L.M.; Udawatta, R.P.; Anderson, S.H.; Gantzer, C.J.; Alagele, S. Cover crop influence on soil water dynamics for a corn–soybean rotation. Agrosyst. Geosci. Environ. 2021, 4, e20175. [Google Scholar] [CrossRef]
- Finney, D.M.; White, C.M.; Kaye, J.P. Biomass Production and Carbon/Nitrogen Ratio Influence Ecosystem Services from Cover Crop Mixtures. Agron. J. 2016, 108, 39–52. [Google Scholar] [CrossRef]
- Zhang, Z.; Kaye, J.P.; Bradley, B.A.; Amsili, J.P.; Suseela, V. Cover crop functional types differentially alter the content and composition of soil organic carbon in particulate and mineral-associated fractions. Glob. Chang. Biol. 2022, 28, 5831–5848. [Google Scholar] [CrossRef]
- Muldoon, D.K. Dry matter accumulation and changes in forage quality during primary growth and three regrowths of irrigated winter cereals. Aust. J. Exp. Agric. 1986, 26, 87–98. [Google Scholar] [CrossRef]
- Russelle, M.P. Nitrogen cycling in pasture and range. J. Prod. Agric. 1992, 5, 13–23. [Google Scholar] [CrossRef]
- Kumar, V.; Singh, V.; Flessner, M.L.; Haymaker, J.; Reiter, M.S.; Mirsky, S.B. Cover crop termination options and application of remote sensing for evaluating termination efficiency. PLoS ONE 2023, 18, e0284529. [Google Scholar] [CrossRef]
- Heggenstaller, A. Managing Winter Cover Crops in Corn and Soybean Cropping Systems. Crop Insights Pioneer Agron. Sci. 2023, 23, 4–5. [Google Scholar]
- Pittman, K.B.; Cahoon, C.W.; Bamber, K.W.; Rector, L.S.; Flessner, M.L. Herbicide selection to terminate grass, legume, and brassica cover crop species. Weed Technol. 2020, 34, 48–54. [Google Scholar] [CrossRef]


Disclaimer/Publisher’s Note: The statements, opinions and data contained in all publications are solely those of the individual author(s) and contributor(s) and not of MDPI and/or the editor(s). MDPI and/or the editor(s) disclaim responsibility for any injury to people or property resulting from any ideas, methods, instructions or products referred to in the content. |
© 2024 by the authors. Licensee MDPI, Basel, Switzerland. This article is an open access article distributed under the terms and conditions of the Creative Commons Attribution (CC BY) license (https://creativecommons.org/licenses/by/4.0/).
Share and Cite
Shiferaw, A.; Birru, G.; Tadesse, T.; Schmer, M.R.; Awada, T.; Jin, V.L.; Wardlow, B.; Iqbal, J.; Freidenreich, A.; Kharel, T.; et al. Optimizing Cover Crop Management in Eastern Nebraska: Insights from Crop Simulation Modeling. Agronomy 2024, 14, 1561. https://doi.org/10.3390/agronomy14071561
Shiferaw A, Birru G, Tadesse T, Schmer MR, Awada T, Jin VL, Wardlow B, Iqbal J, Freidenreich A, Kharel T, et al. Optimizing Cover Crop Management in Eastern Nebraska: Insights from Crop Simulation Modeling. Agronomy. 2024; 14(7):1561. https://doi.org/10.3390/agronomy14071561
Chicago/Turabian StyleShiferaw, Andualem, Girma Birru, Tsegaye Tadesse, Marty R. Schmer, Tala Awada, Virginia L. Jin, Brian Wardlow, Javed Iqbal, Ariel Freidenreich, Tulsi Kharel, and et al. 2024. "Optimizing Cover Crop Management in Eastern Nebraska: Insights from Crop Simulation Modeling" Agronomy 14, no. 7: 1561. https://doi.org/10.3390/agronomy14071561
APA StyleShiferaw, A., Birru, G., Tadesse, T., Schmer, M. R., Awada, T., Jin, V. L., Wardlow, B., Iqbal, J., Freidenreich, A., Kharel, T., Khorchani, M., Mersha, Z., Begna, S., & Sohoulande, C. (2024). Optimizing Cover Crop Management in Eastern Nebraska: Insights from Crop Simulation Modeling. Agronomy, 14(7), 1561. https://doi.org/10.3390/agronomy14071561