Article

Comparative Transcriptomic Insights into the Mechanisms Underlying Maize (Zea mays L.) Embryogenic Callus Differentiation

1
College of Agronomy, Jilin Agricultural Science and Technology University, Jilin 132101, China
2
College of Biological and Pharmaceutical Engineering, Jilin Agricultural Science and Technology University, Jilin 132101, China
*
Author to whom correspondence should be addressed.
Agronomy 2024, 14(8), 1689; https://doi.org/10.3390/agronomy14081689
Submission received: 1 July 2024 / Revised: 26 July 2024 / Accepted: 29 July 2024 / Published: 31 July 2024
(This article belongs to the Special Issue Plant Tissue Culture and Plant Somatic Embryogenesis–2nd Edition)

Abstract

:
The regeneration of plant somatic cells is a prerequisite for their biological breeding. Identification of key genes controlling embryogenic callus (EC) differentiation and investigation of the genetic mechanism of cell fate determination are important for improving plant variety. In this study, we used the maize inbred line KN5585 and its gene-edited mutants Zmprx19-1, Zmprx19-2 and Zmprx19-3 as plant materials. Three somatic regeneration-related traits, the embryogenic callus induction rate (EIR), green callus rate (GCR) and plantlet regeneration rate (PRR), were identified by tissue culture of immature embryos. Additionally, the ECs at different differentiation stages (0 d, 5 d, 10 d and 15 d) were subjected to RNA-seq, and comparative transcriptome analyses were performed. The results showed that the somatic regeneration traits of the mutants were all highly significantly lower than those of the wild type (p < 0.01). The PRR value of KN5585 was 75.25%, while the highest PRR of the mutants was only 15.08%, indicating that knockdown of ZmPRX19 inhibited EC regeneration. Transcriptome sequencing yielded a total of 200.30 Gb of clean data from 24 libraries, with an average of 6.53 Gb of clean data per library. Mutant and wild-type gene expression data were compared separately at four differentiation stages, and 689 common differentially expressed genes (DEGs) were screened. WGCNA was used to classify these genes into nine modules, which were subsequently subjected to GO and KEGG enrichment analyses. In total, 40, 23, 17 and 5 genes were significantly (q < 0.05) enriched in plant hormone signal transduction, the MAPK signaling pathway-plant, phenylpropanoid biosynthesis and photosynthesis, respectively. Moreover, protein–protein interaction (PPI) network analysis revealed five MAPKKK17_18 hub nodes involved in the MAPK pathway-plant, which may be the key genes controlling plantlet differentiation from ECs. The above results provide a basis for the final elucidation of the molecular mechanism of plant somatic regeneration.

1. Introduction

Regeneration is the self-repair or replacement of an organism’s tissues or organs after damage. In animals, regeneration often refers to the healing of damaged organs. However, in plants, this process involves the process by which isolated cells or tissues differentiate into independent plants after induction culture [1]. As early as 1902, Haberlandt [2] was the first to propose the concept of “cell totipotency”. He postulated that the somatic cells of plants have the capacity to dedifferentiate and develop into complete plants in vitro, thereby initiating in vitro tissue culture of plant cells. The theory has since been developed and implemented for more than a century. Hormone-induced ex vivo regeneration systems based on cell totipotency have also been extensively utilized in plant transgenesis and gene editing [3,4]. Nevertheless, a large number of studies have demonstrated that the frequency of somatic differentiation varies considerably between different plant species or between different varieties in one species [5,6]. The majority of materials lack the ability to regenerate, which restricts the number of varieties that can be used as direct recipients for genetic manipulation, thereby limiting the applications of biotechnological tools in variety improvement. Consequently, it is of great practical importance to investigate the genetic mechanisms underlying the recovery of plant cell totipotency and to overcome the genotype dependence of somatic regeneration to accelerate the development of modern agriculture.
To date, scientists have identified several candidate genes that control somatic regeneration via genome sequencing and other methods [7]. Ma et al. [8] used 144 maize inbred lines as experimental materials and used multi-locus genome-wide association analysis (GWAS) methods to identify 40 embryogenic callus (EC) regeneration genes, including WOX2. Some of these genes were found to be related to cell fate decisions, auxin transport, and embryo development. Sinha et al. [9] analyzed the expression of key miRNAs during the differentiation of rice callus. Their findings revealed that miR167d-5p expression was 30-fold greater in green regenerating callus than in non-green callus. Islam et al. [10] analyzed publicly available Arabidopsis thaliana transcriptome data to summarize three subnetworks associated with plantlet differentiation. They also identified and functionally analyzed core transcription factors, including WOX9A, LEC2, PGA37, WIP5, PEI1, and AIL1. Wang et al. [11] used both quantitative trait locus (QTL) localization and GWAS to identify a gene encoding a carbohydrate-binding protein that plays a role in enlarging the meristem. Its overexpression has been shown to promote in vitro regeneration of cucumber cotyledons. However, the functions of most of the mined candidate genes have not yet been effectively verified, resulting in limited research focused on the mechanism of somatic regeneration.
In Arabidopsis, ICK/KRP cyclin-dependent kinase (CDK) inhibitors play a pivotal role in regulating the plant cell cycle. Simultaneous mutation of five genes, ICK1/2/5/6/7, has been shown to enhance the ability of explants to enter the cell cycle, thereby promoting cell proliferation and plant regeneration [12]. A methyltransferase 1 (MET1)-dependent increase in CG methylation reduces the expression of the blue light receptor genes cryptochrome 1 (CRY1) and CRY2, resulting in a blockade of light signaling that directly affects somatic differentiation in plants [13]. WUSCHEL (WUS) has been reported to form a negative feedback loop with the signal peptide gene CLAVATA3 (CLV3), which is hormonally fine-tuned to adapt meristematic tissue function to various environmental signals [14]. Additionally, in cotton, somatic embryogenesis-associated lipid transfer protein (SELTP) and the corresponding amylases were found to play important roles in the establishment of cell polarity. SELTP-assembled amyloplasts mediate the asymmetric division of somatic cells. The amyloplasts are then cleaved by a surge of amylase, a process that is accompanied by a sharp discharge and drives the cells to initiate totipotency [15]. In maize, monocot-specific miR528 regulates callus regeneration by promoting the degradation and translational repression of the MATE, bHLH, and SOD1a transcripts [16]. Moreover, Wójcik et al. [17] summarized the genes related to auxin-mediated embryogenesis and constructed a basic framework of the molecular regulatory network. Only a few of these genes and their interactions have been confirmed, indicating that the molecular mechanisms of plant somatic regeneration remain to be fully elucidated.
Here, we examined the somatic regeneration extreme maize inbred line KN5585 and its peroxidase gene mutants Zmprx19-1, Zmprx19-2 and Zmprx19-3. RNA-seq technology was used to sequence and conduct a comparative transcriptome analysis of the ECs at each of the four differentiation stages. The results of this study provide a foundation for the identification of key genes involved in somatic regeneration and for further analysis of the molecular mechanisms underlying the restoration of totipotency in plant cells.

2. Materials and Methods

2.1. Plant Materials and Trait Evaluation

In our previous study, we used GWAS, QTL mapping and gene expression pattern analysis to identify the peroxidase gene ZmPRX19, which is closely related to the differentiation of the EC in maize. Subsequently, the maize inbred line KN5585 was selected as the recipient. KN5585 is a widely used recipient genotype for gene editing or gene overexpression. It has a growth period between 110 and 120 days, a plant height of approximately 190 cm, a semicompact plant type and good yield related traits. ZmPRX19 in KN5585 was subjected to dual-target editing via CRISPR-Cas9 technology. Target 1 was GCAGCAGGCGGTCGGCCGGAGCGG, and target 2 was GAAGTCCCTGTACTGGGCGGCGGG. A total of three mutants, Zmprx19-1, Zmprx19-2 and Zmprx19-3, were obtained. Specific primers were used to amplify the target regions of these genotypes, and sequencing was performed via Sanger technology. The primer sequences are listed in Table S1. Compared with the wild-type KN5585, the mutant Zmprx19-1 had 80 bases deleted between target 1 and target 2, the mutant Zmprx19-2 had a base T inserted at target 2, and the mutant Zmprx19-3 had 79 bases deleted between target 1 and target 2. Further details are provided in Figure S1.
On this basis, the wild-type inbred line KN5585 and its three gene-edited mutants Zmprx19-1, Zmprx19-2 and Zmprx19-3 were used as plant materials in this study. The germplasms were planted in October 2022 in the greenhouse of Jilin Agricultural Science and Technology University. A randomized complete block design was applied with four replications. Three rows of each material were planted in each replicate, with a row length of 4.5 m, row spacing of 0.65 m, and plant spacing of 0.25 m. Self-pollination was carried out when the maize plants reached the silking stage. Ten to twelve days after pollination, eight ears were randomly selected from each replicate of the genotypes. One hundred immature embryos approximately 1.5 mm in length were removed from each ear. In total, 800 immature embryos were collected from each replicate of each material, and ultimately, 3200 explants from the four replicates for each genotype were used for tissue culture. Regeneration of the plant explants was carried out through the organogenesis pathway. First, immature maize embryos were induced in the dark for 4 weeks. The ECs obtained from the induction culture were subsequently incubated in the light for another 4 weeks to regenerate green plantlets. Phenotypic data for three traits, embryogenic callus induction rate (EIR), green callus rate (GCR) and plantlet regeneration rate (PRR), were collected, and the mean values of each trait were calculated for each plot. Finally, descriptive statistical analysis and analysis of variance were performed on the four replicate datasets using SPSS 24.0 (IBM Corp., Armonk, NY, USA). The procedures, conditions for maize tissue culture and methods for trait identification were described in our previous study [18].

2.2. Transcriptome Sequencing

Twenty ECs of the inbred line KN5585 and its mutant Zmprx19-1 were mixed-pooled at 0 d, 5 d, 10 d, and 15 d of EC differentiation for a total of three biological replicates. The samples were designated WT0-1, WT0-2, WT0-3, WT5-1, WT5-2, WT5-3, WT10-1, WT10-2, WT10-3, WT15-1, WT15-2, WT15-3, prx0-1, prx0-2, prx0-3, prx5-1, prx5-2, prx5-3, prx10-1, prx10-2, prx10-3, prx15-1, prx15-2, and prx15-3. Total RNA was extracted from the samples using an RNA Easy Fast Plant Tissue Kit (TianGen, Beijing, China). The purity, concentration, and integrity of the RNA were evaluated using a NanoDrop 2000 spectrophotometer (Thermo Scientific, Waltham, MA, USA) and an Agilent 2100/LabChip GX (New York, NY, USA). Qualified samples were sequenced using the Illumina MiSeqTM sequencing platform to a depth of 6G. The raw data were subjected to filtration to remove reads containing adapters and to remove reads containing a proportion of unknown bases (N) greater than 10% or a proportion of the number of bases with a mass value Q ≤ 10 greater than 50%. The obtained clean reads were aligned to the maize inbred line B73 reference genome RefGen_v4 (www.ncbi.nlm.nih.gov/datasets/genome/GCF_000005005.2/, accessed on 20 December 2023) using HISAT2 software [19]. The reads for comparison were then assembled using StringTie [20] to reconstruct the transcriptome for subsequent analysis.

2.3. Transcriptome Data Analysis

Gene expression levels for all the samples were calculated using the fragments per kilobase of transcript per million mapped reads (FPKM) method [21] in StringTie [20]. The obtained gene expression matrices were subjected to sample correlation and principal component analysis (PCA), which were performed using the cor and prcomp functions in R 4.2.1 (www.r-project.org, accessed on 5 January 2024), respectively. Differentially expressed genes (DEGs) were identified between the sample pairs (WT0 vs. prx0, WT5 vs. prx5, WT10 vs. prx10, and WT15 vs. prx15) using DESeq2 [22] with the screening parameters set as a fold change (FC) ≥ 2 and a false discovery rate (FDR) ≤ 0.01.
Using the common DEGs between the four sample pairs, the R package WGCNA version 1.42 [23] was used to construct gene coexpression networks and identify modules. The software parameters were set as follows: FPKM ≥ 1, module similarity threshold ≥ 0.25 (MEDissThres = 0.25), and number of genes in a module ≥ 30 (minModuleSize = 30). Pearson’s correlation coefficient analysis was used to determine the correlation between the modules and the samples at different stages of EC differentiation. The coexpression trends of genes in each module were plotted using the R package cluster [24]. Gene Ontology (GO) enrichment analysis of the module gene clusters was conducted using the R package clusterProfiler [25]. The top 10 GO terms with the most significant enrichment were filtered using a q value < 0.05. Kyoto Encyclopedia of Genes and Genomes (KEGG) enrichment analysis was conducted using KOBAS software [26]. For each module, pathways that were significantly (q value < 0.05) enriched were identified for statistical analysis. The GO and KEGG drawings were obtained from the BMKCloud website (www.biocloud.net, accessed on 7 January 2024). The expression pattern heatmap of the DEGs in the KEGG pathways was plotted using the R package heatmap [27].
The amino acid sequences of all 689 common DEGs were utilized to construct a protein–protein interaction (PPI) network using the BMKCloud website (www.biocloud.net, accessed on 12 January 2024). The score of the genes represents how many neighbors a node directly connects to. In this study, the five genes with the highest scores were considered hub genes.

2.4. Quantitative Real-Time PCR Validation

To validate the DEGs identified through transcriptome sequencing, 10 genes (ZmPRX19, BAK1, IAA32, ARF11, MYC2, LHCB3, MAPKKK17_18, CLE16, BAM3_3 and EREB147) were randomly selected for quantitative real-time PCR (qPCR) analysis using a Roche LightCycler 96 instrument (Roche Diagnostics, Mannheim, Germany). Amplification primers were designed using Oligo 7 [28], and detailed sequence information is listed in Table S2. One microgram of sample total RNA was reverse transcribed into cDNA as a template using the FastKing RT Kit (with gDNase) (TianGen, Beijing, China). The gene Zm00001d049641 (GAPDH) was used as the endogenous control. The amplification reaction was conducted using a two-step method. The program commenced with predenaturation at 95 °C for 30 s, followed by denaturation at 95 °C for 5 s and annealing and extension at 60 °C for 30 s, for a total of 40 cycles. All reactions were performed in triplicate, including negative controls. Once the reactions completed, a melting curve analysis was performed, and the relative expression of each gene was calculated using the 2−ΔΔCT method [29].

3. Results

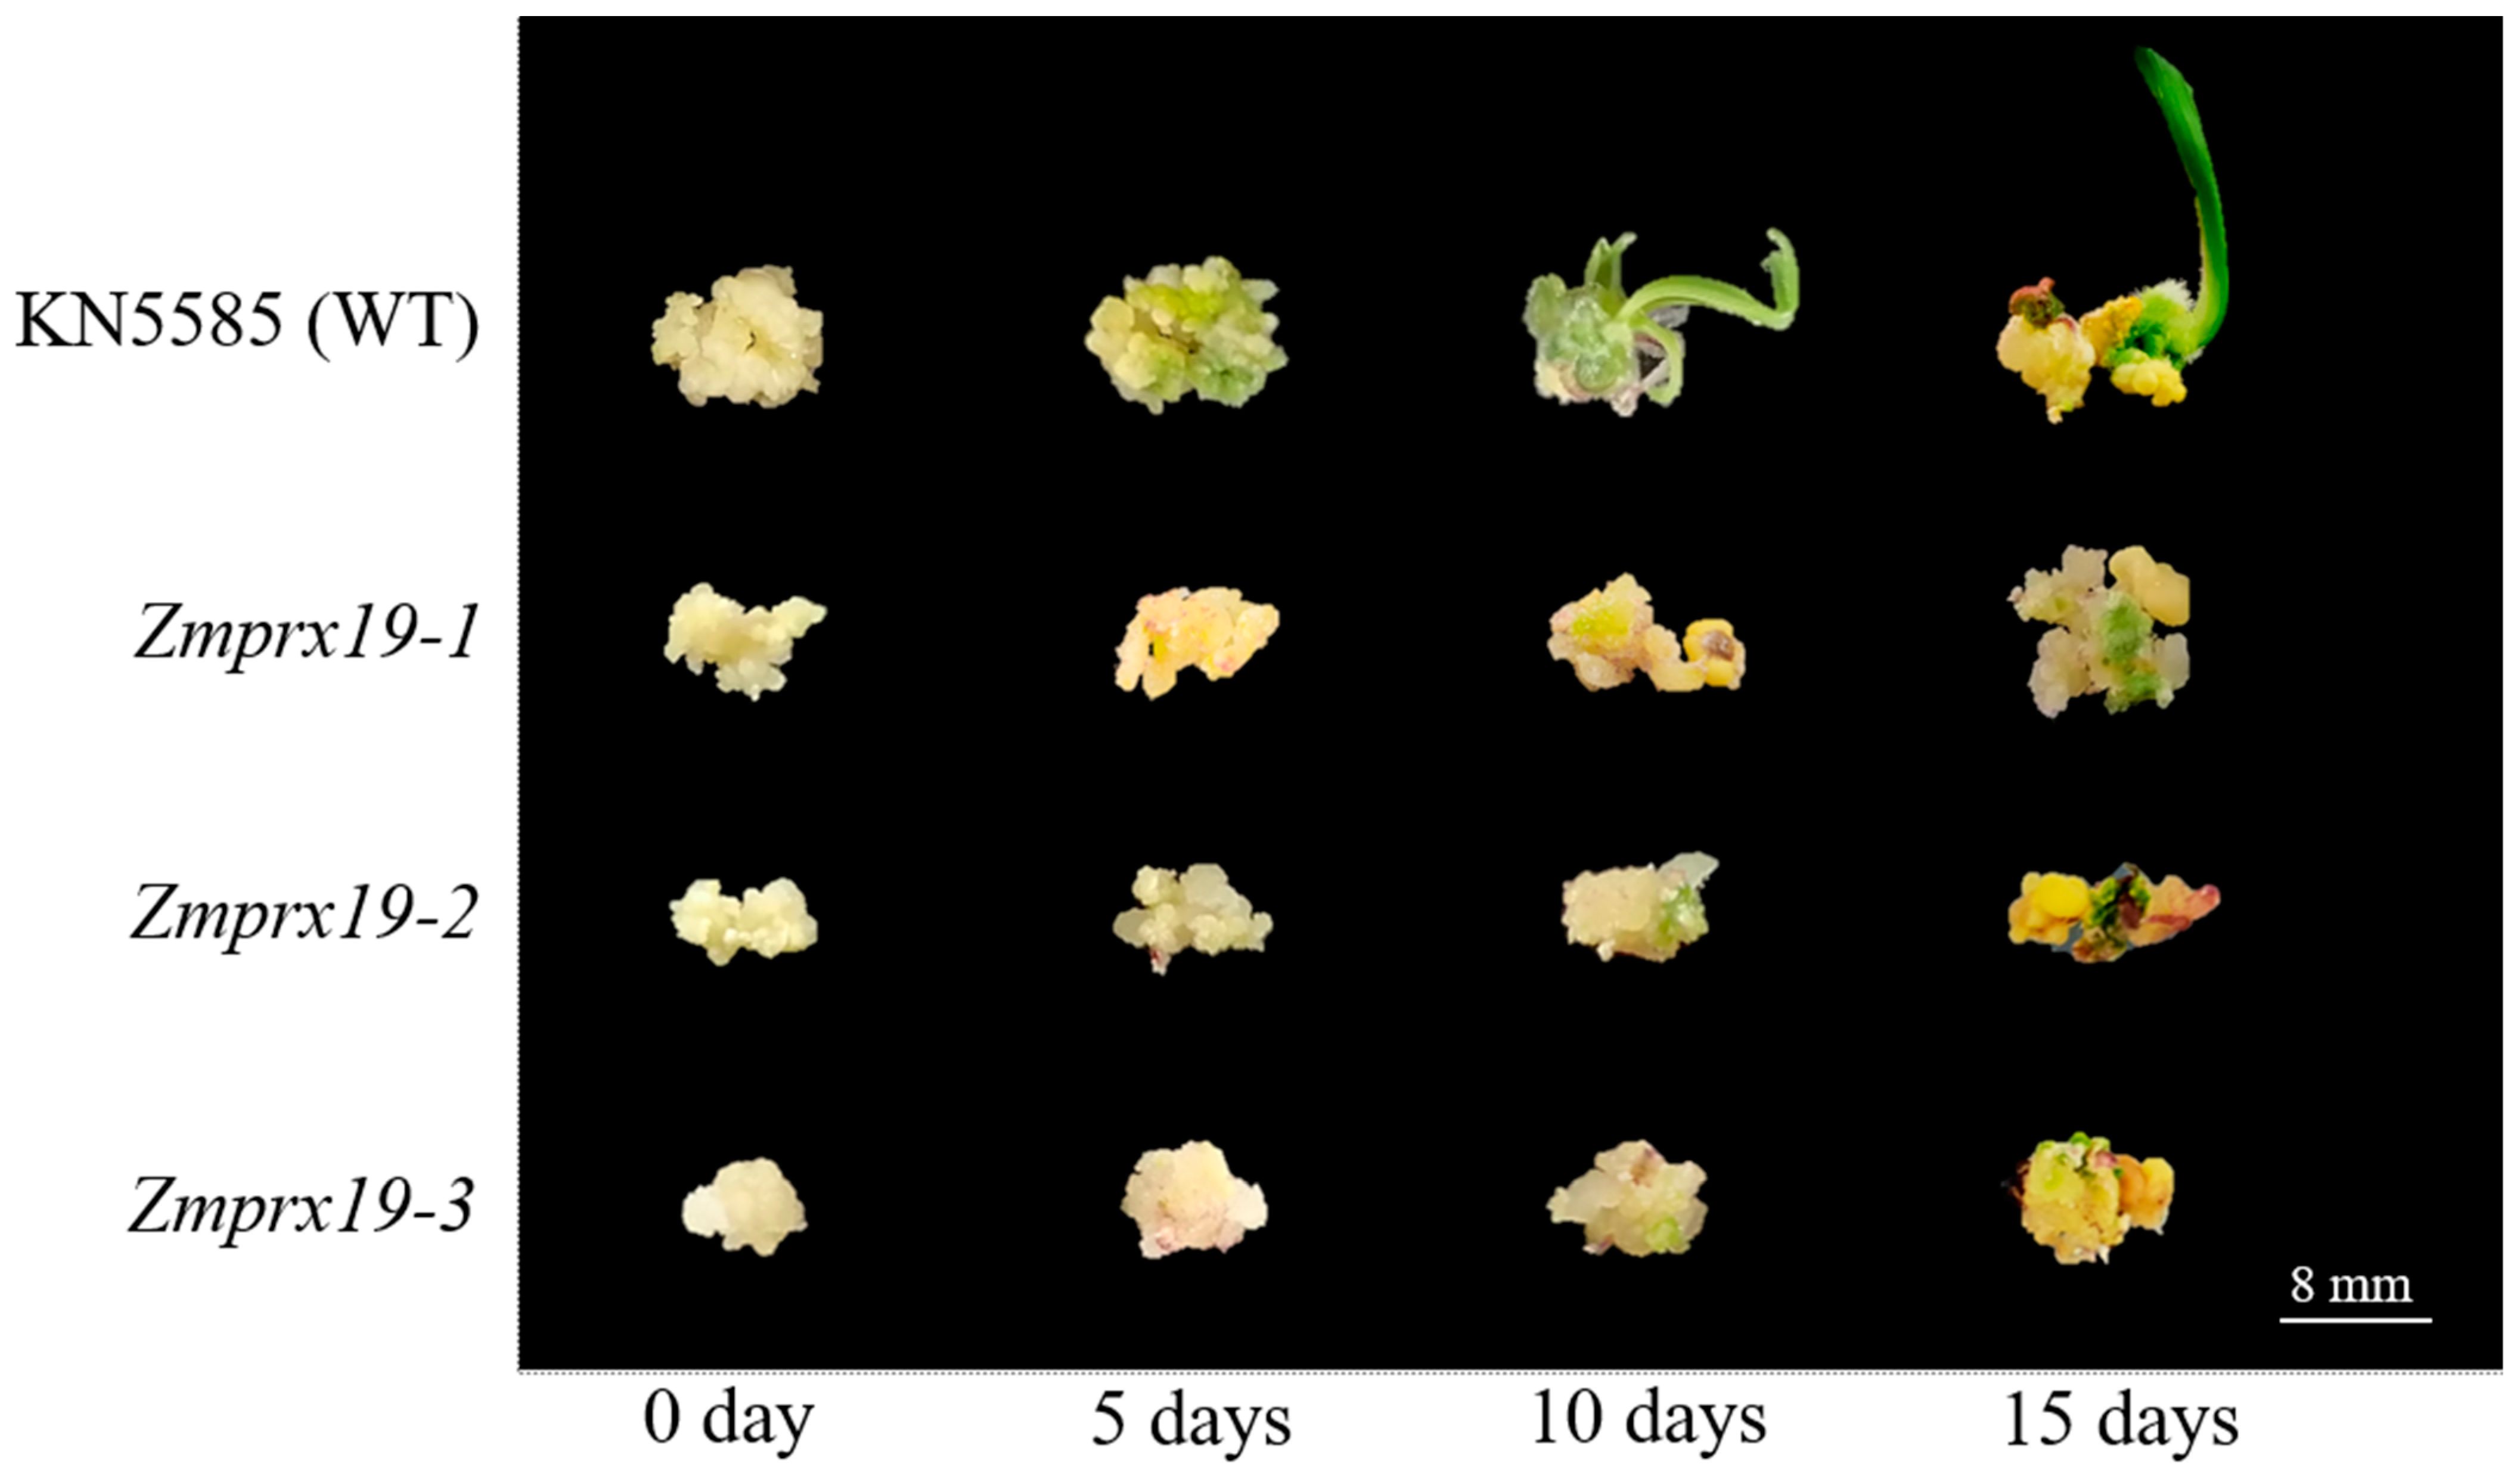
3.1. Phenotypic Variation

To verify the function of the peroxidase gene ZmPRX19 in plant somatic fate determination, we performed tissue culture for immature embryos from the maize inbred line KN5585 and its gene editing mutants Zmprx19-1, Zmprx19-2 and Zmprx19-3. Here, regeneration of the plant explants was carried out through organogenesis. The experimental results showed that all these materials were induced to EC. The mean EIR of the wild type was 96.58%, while the mean EIR of the three mutants ranged from 80.65% to 85.92% (Table 1). Comparison of the data using Tukey’s HSD test revealed that the EIRs of the mutants were all highly significantly lower than those of the wild type (p < 0.01). Subsequently, the obtained ECs were cultured in the light for 4 weeks, and we found that KN5585 appeared to be further differentiated from the mutants in terms of both GCR and PRR traits (Figure 1 and Table 1). In particular, for the PRR trait, the wild type showed a high level of somatic regeneration, with a mean PRR value of 75.25%. In contrast, the mean PRR values of the three mutants were only 8.78–15.08%, indicating that regeneration was more difficult in these materials. The above results support that ZmPRX19 may function in the process of maize cell totipotency reacquisition.
In this study, somatic regeneration in maize was divided into two stages: callus induction and plantlet redifferentiation. At the end of the dedifferentiation culture, the EIRs of the mutants were highly significantly (p < 0.01) different from those of the wild type. However, the overall phenotypic differences were only slightly greater than 10% (Table 1), suggesting that the mutants Zmprx19-1, Zmprx19-2 and Zmprx19-3 did not exhibit a strong defect in EC induction. In contrast, at the redifferentiation stage, the difference in the PRR trait between the mutants and the wild type was as high as approximately 60%, and the EC of the mutants could barely grow green seedlings (Figure 1 and Table 1), suggesting that ZmPRX19 may function mainly at the second stage mentioned above. Therefore, the present study was conducted to analyze the transcriptome at the early stage of EC differentiation with the aim of investigating the genetic mechanism by which ZmPRX19 regulates somatic regeneration in maize inbred lines.

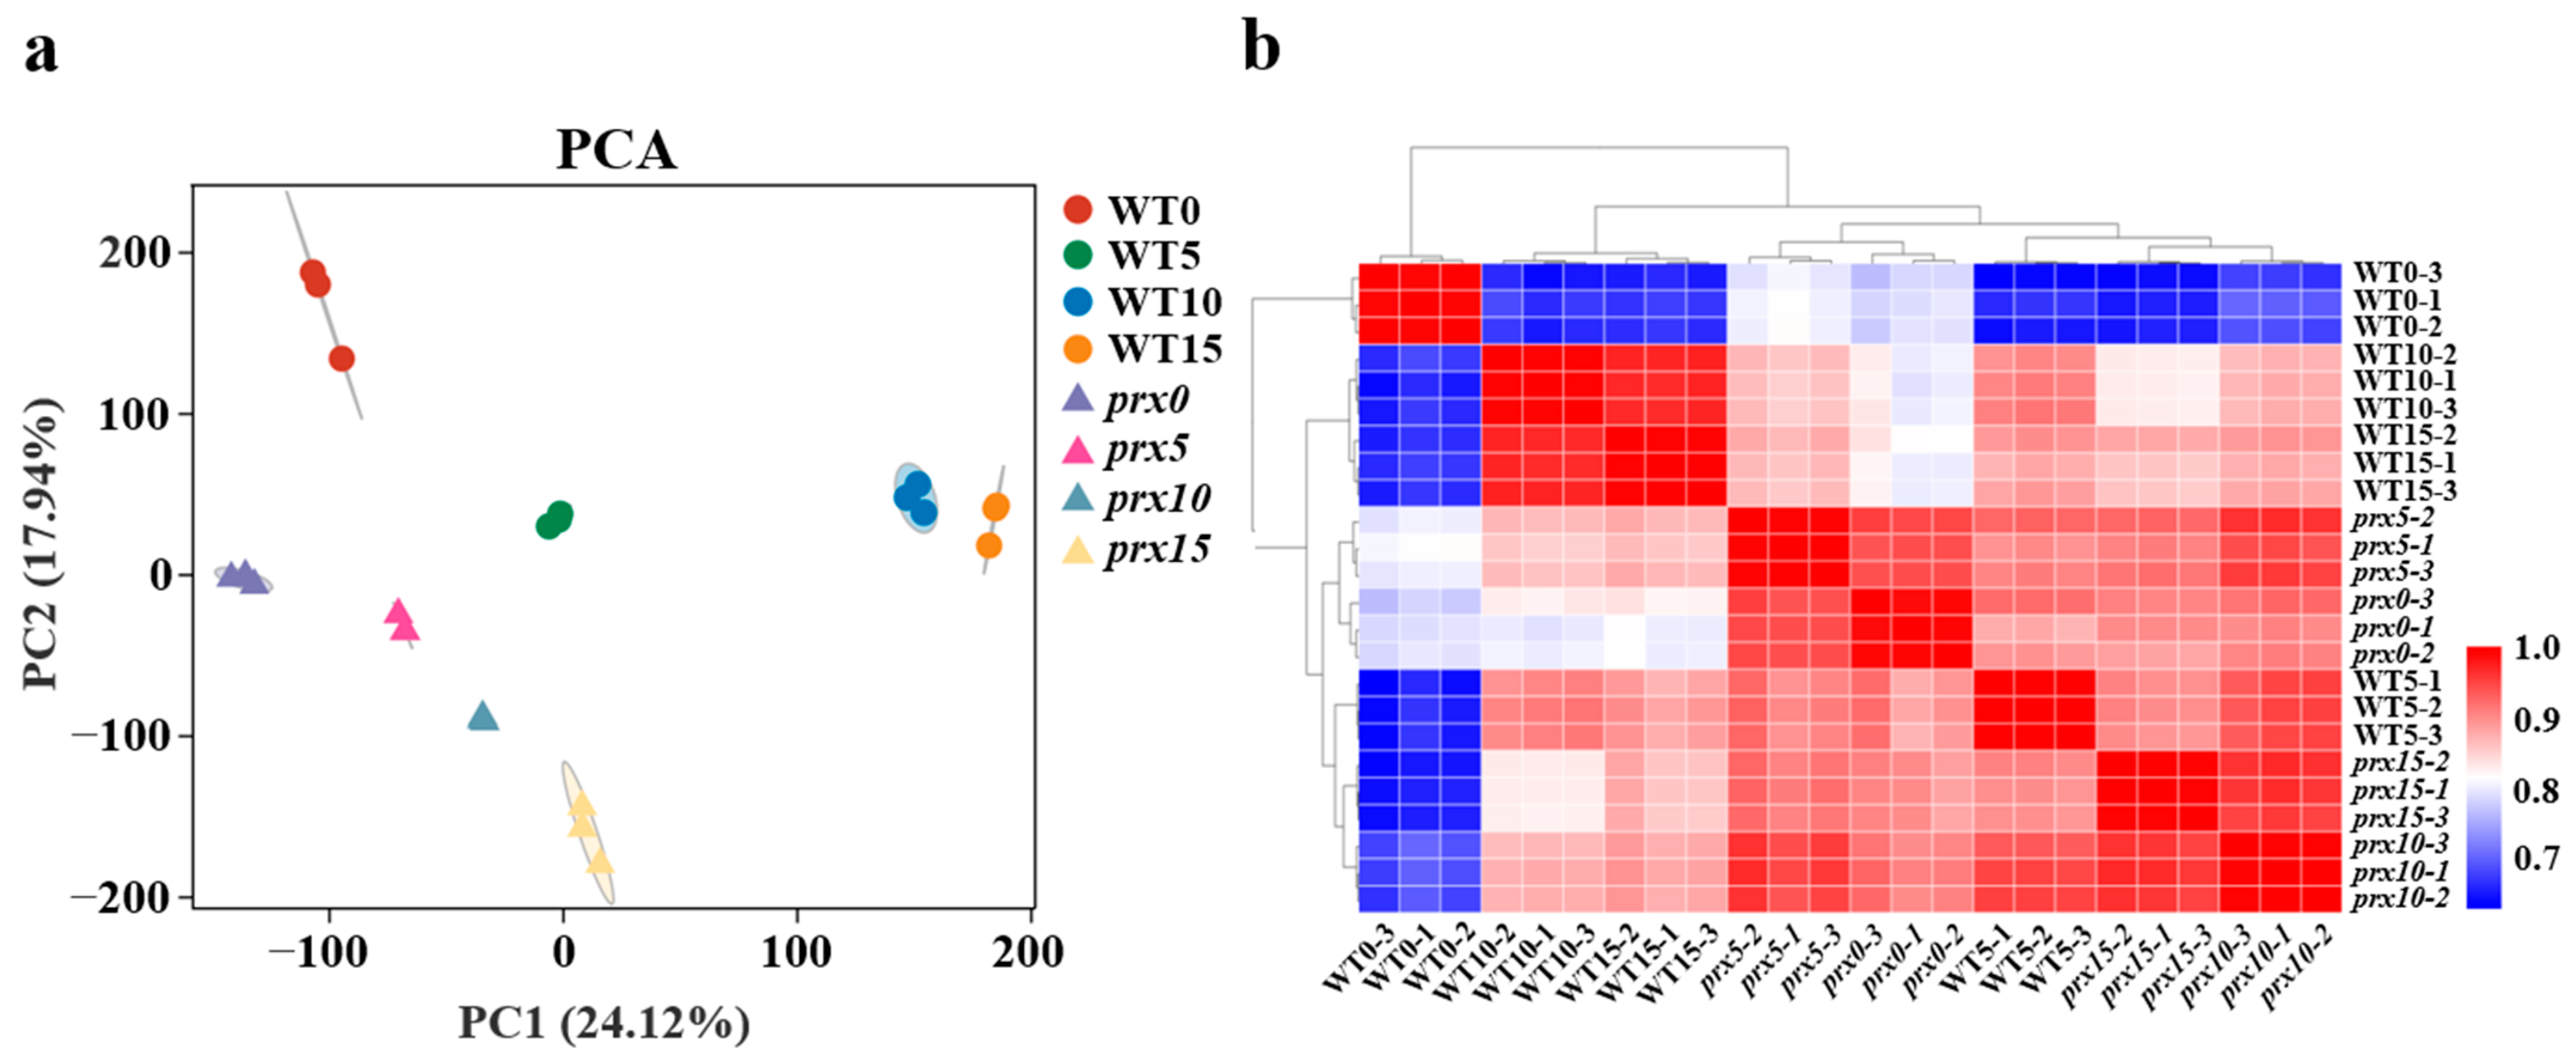
3.2. Transcriptome Sequencing of the Cultures

ECs of KN5585 and the Zmprx19-1 mutant at four time points (0 d, 5 d, 10 d and 15 d) of differentiation culture were collected for transcriptome sequencing, with three biological replicates each. As a result, a total of 200.30 Gb of clean data were obtained from 24 libraries. The average amount of clean data per library was 6.53 Gb, and the percentage of Q30 bases ranged from 90.01% to 95.34% (Table S3). The obtained clean reads were compared with the reference genome RefGen_v4 of the maize inbred line B73, and the results showed that the comparison efficiency ranged from 77.53% to 84.66% for each sample (Table S3). Gene expression analysis revealed that most of the genes had FPKM values between 0.1 and 10, with a total of 29,411 genes having FPKM values greater than 1. In the following analyses, we used WT0-1 and prx0-1 to represent biological replicate 1 of wild-type KN5585 and its mutant, respectively, at 0 d of plantlet differentiation. Similar abbreviations were used for samples from other time points and biological replicates.
PCA and clustering heatmap analysis were performed on the gene expression matrices of all the samples. The results showed high similarity among the three biological replicates within each treatment (Figure 2). Overall, the levels of transcriptome divergence of the mutant at different differentiation times were more homogeneous (Figure 2a). In contrast, the wild type showed a large divergence in gene expression patterns within 10 d of regeneration culture, followed by a convergence of the transcriptomes of WT10 and WT15 (Figure 2a). Further comparison of the samples from the two genotypes revealed that the expression patterns of WT0 and prx0 differed greatly at 0 d of EC differentiation culture. With the extension of culture time, the distaQTLnce between WT5 and prx5 not only did not increase but also gradually decreased. Interestingly, the transcriptomes of WT10 and prx10 rediverged substantially after 10 d of light culture, after which the distance between WT15 and prx15 further increased (Figure 2a). The above results suggest that at the early stage of differentiation, the wild type and the mutant respond to light induction via similar mechanisms, while subsequent transcriptome differentiation programs result in different somatic fates. Sample clustering heatmap analysis also revealed a similar trend in sample clustering (Figure 2b). The mutant samples from each stage and the WT5 samples clustered together, while the WT10 and WT15 samples clustered together. In addition, the correlation coefficients of WT0 with prx0 and prx5 were approximately 0.8, while those with the rest of the samples were less than 0.7 (Figure 2b), further confirming the results of the PCA.

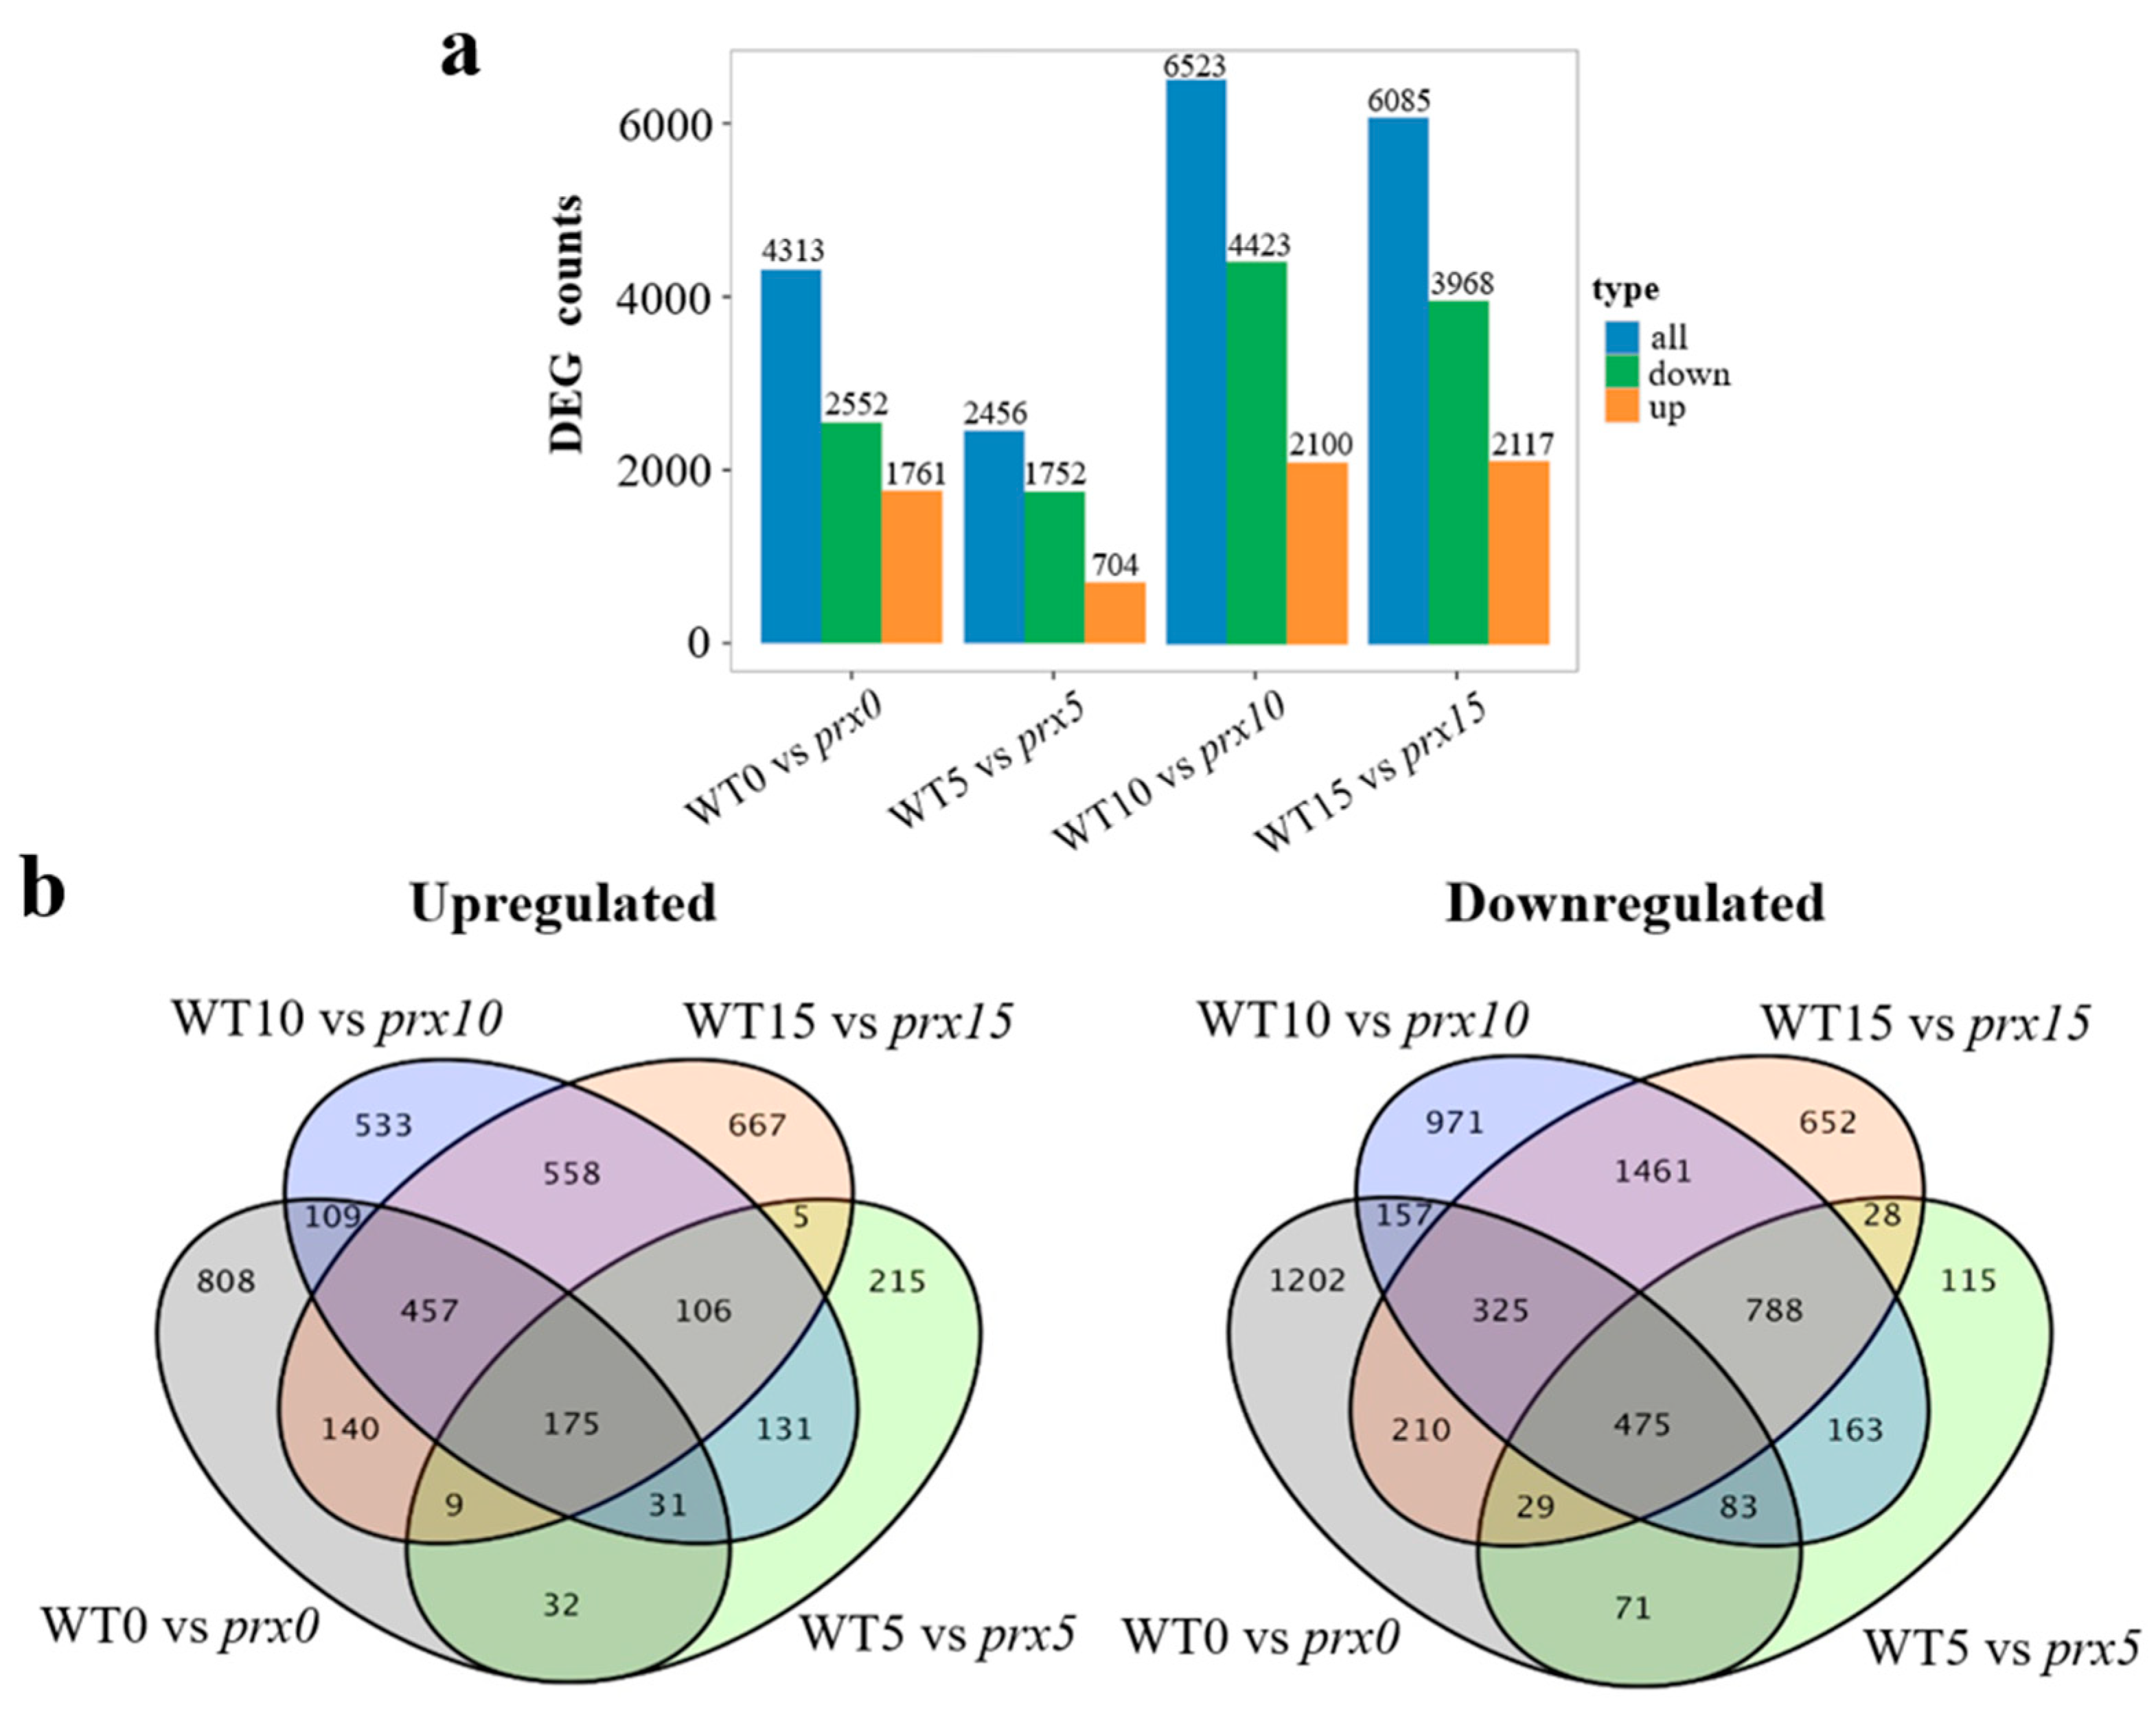
3.3. DEGs in Genotypes with Different Regenerative Capacities

To explore the regulatory mechanisms of EC differentiation, we identified DEGs between KN5585 and its mutant cultured in light for 0 d, 5 d, 10 d and 15 d. The results showed that the number of DEGs for both genotypes at each time point ranged from 2456–6523 (Figure 3a). Among them, the lowest number of DEGs was found at the early stage of plantlet redifferentiation (WT5 vs. prx5), while the greatest number was found at 10 d of differentiation. In all of these gene sets, the number of downregulated genes was significantly greater than the number of upregulated genes (Figure 3a), indicating that the overall transcript levels of the mutant were suppressed. There were 475 common downregulated genes among the four sample pairs, including the peroxidase gene ZmPRX19, the expression of which was downregulated more than 4.7-fold in all four sampling periods (Figure 3b and Table S4). Additionally, only 175 genes were commonly upregulated. The activation or inhibition of these common DEGs played a continuous and stable role throughout all periods of callus redifferentiation. Moreover, there were 39 common DEGs with both up- and downregulated expression at the four plantlet differentiation time points (Table S4). In particular, genes such as Zm00001d043299 (PsbW) showed diametrically opposite expression patterns at 0 d of culture in the light compared to other periods, suggesting that they are most likely key factors in maize somatic regeneration. Taken together, all 689 common DEGs identified in this study were used for subsequent coexpression module and enrichment analyses.

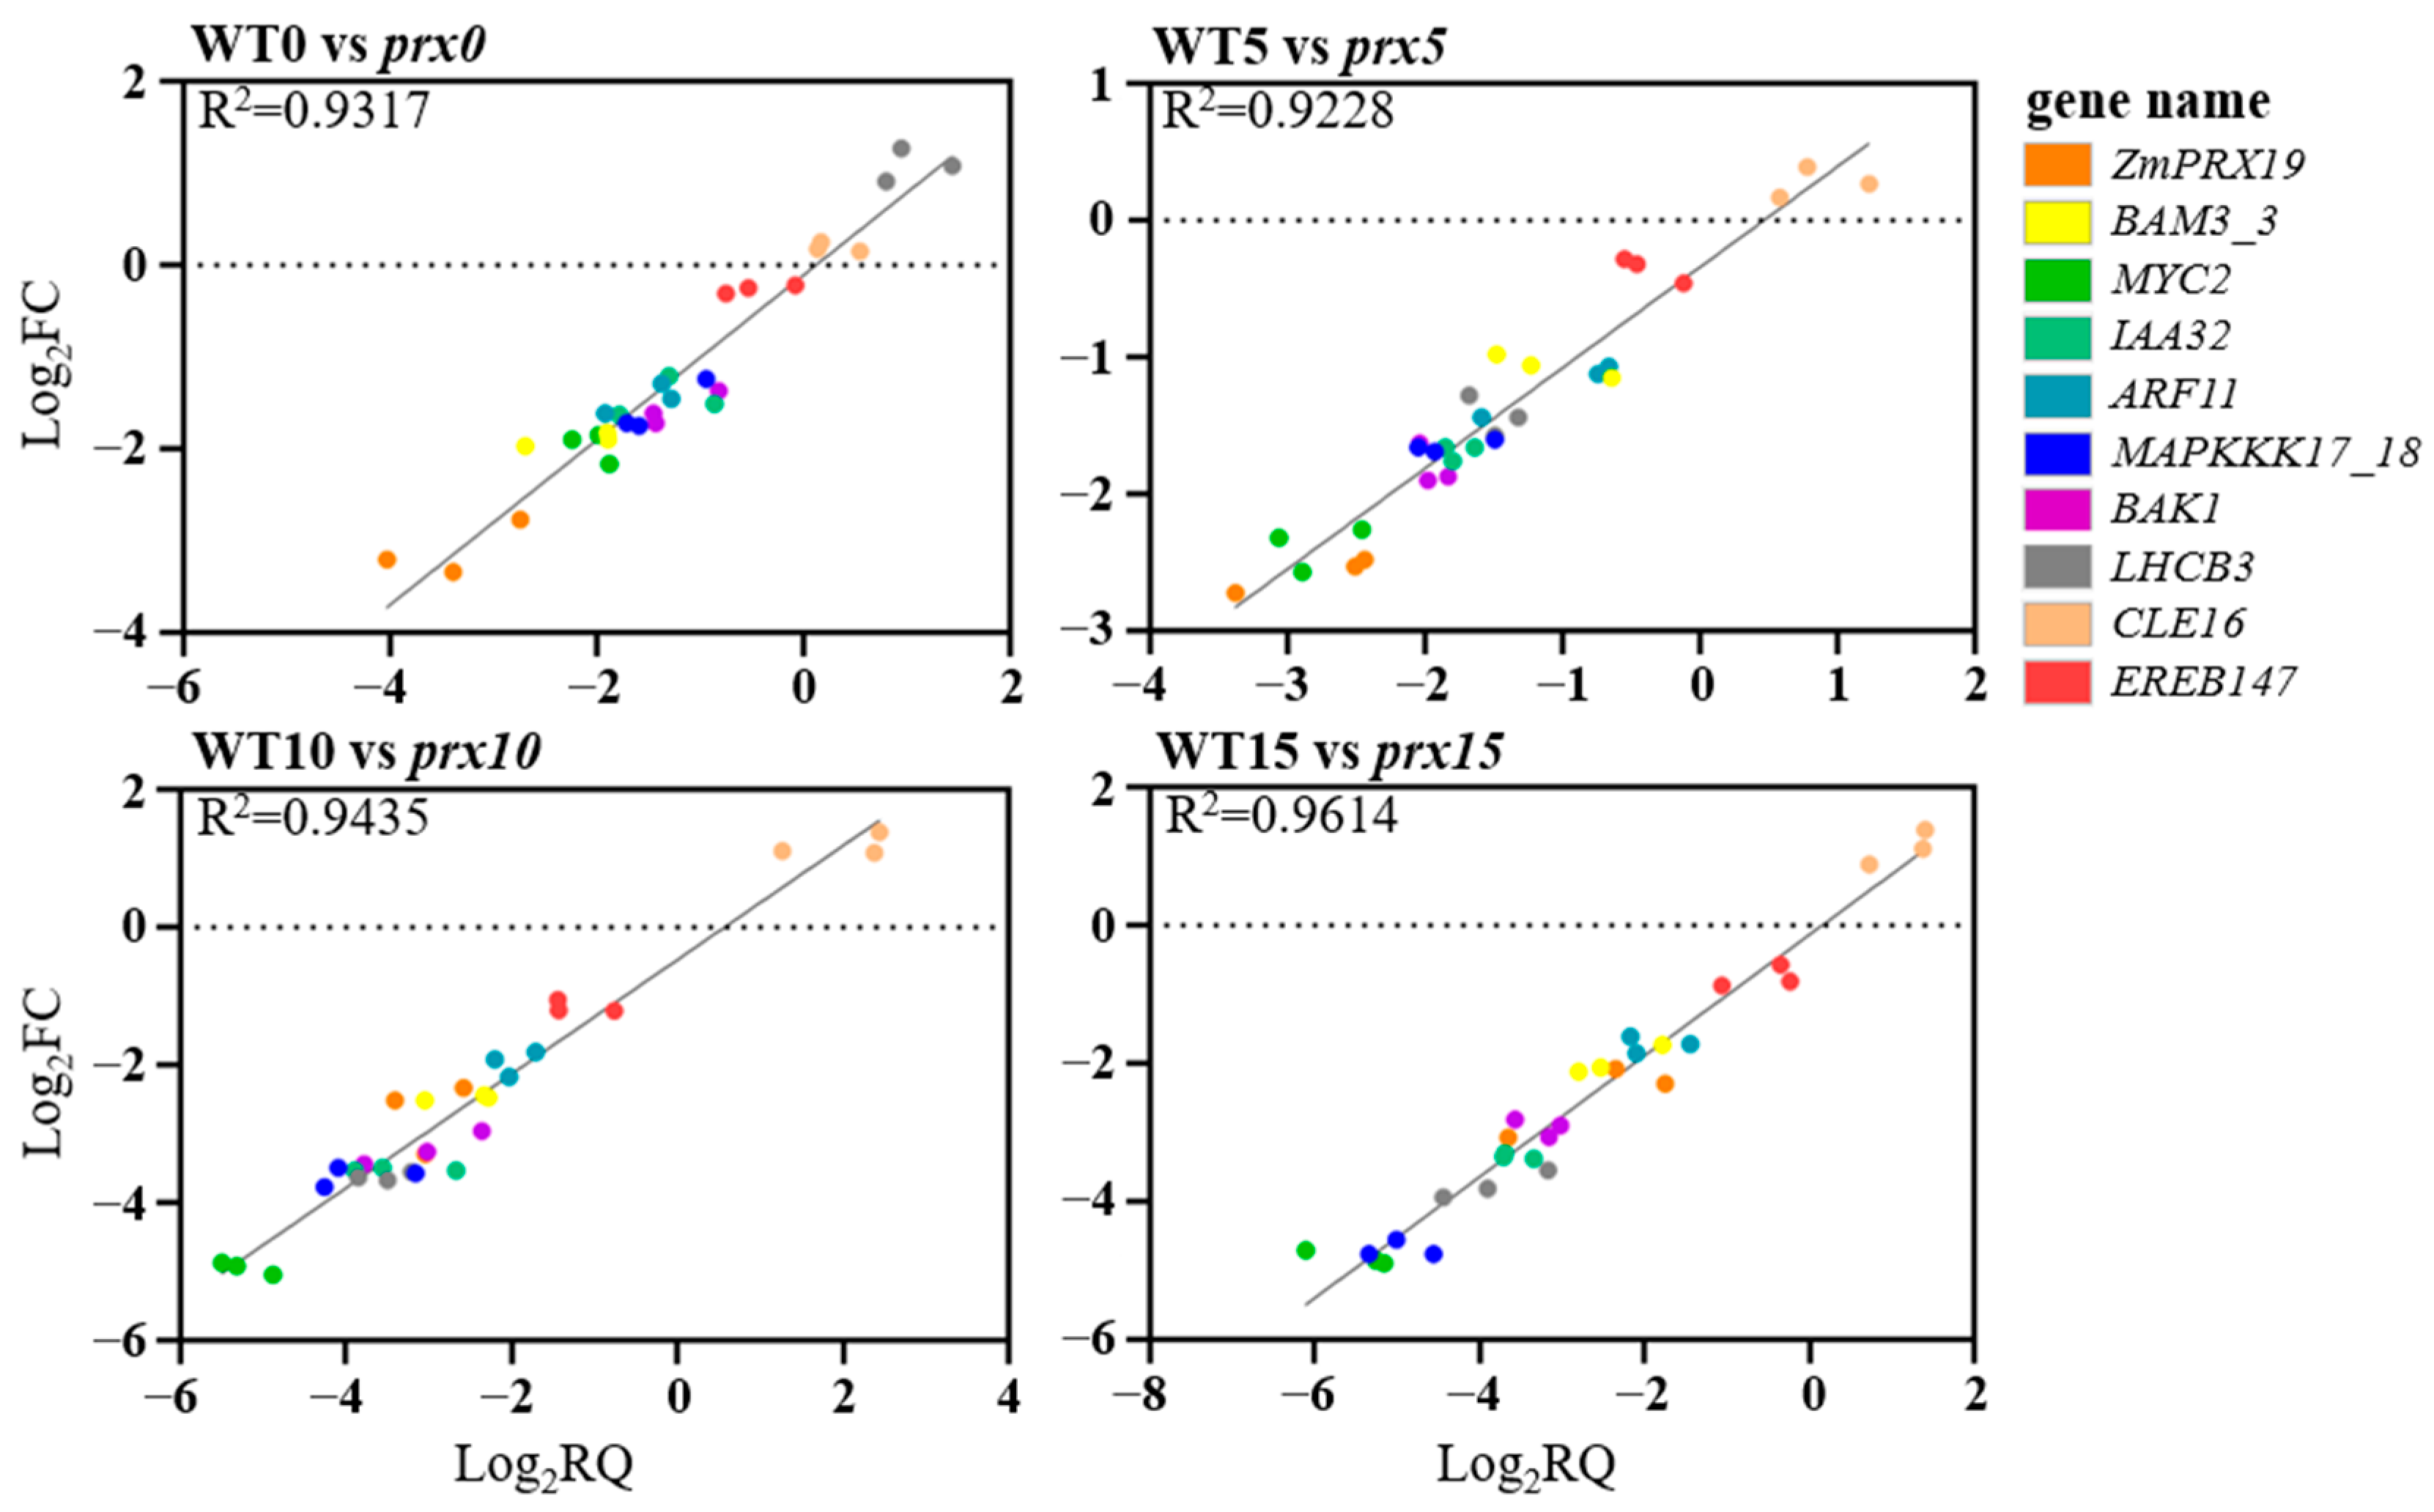
3.4. Reliability Validation of DEG Expression via qPCR

Before further data mining, we randomly selected 10 DEGs for qPCR (Table S4), which were subsequently used to verify the reliability of the transcriptome sequencing data. The analysis showed that the Pearson’s correlation coefficients between the data obtained by the two techniques were greater than 0.9 (R2 > 0.9) at each of the four somatic regeneration stages (Figure 4). This indicates that the qPCR results are generally in agreement with the RNA-seq results and the RNA-seq data are therefore reliable.

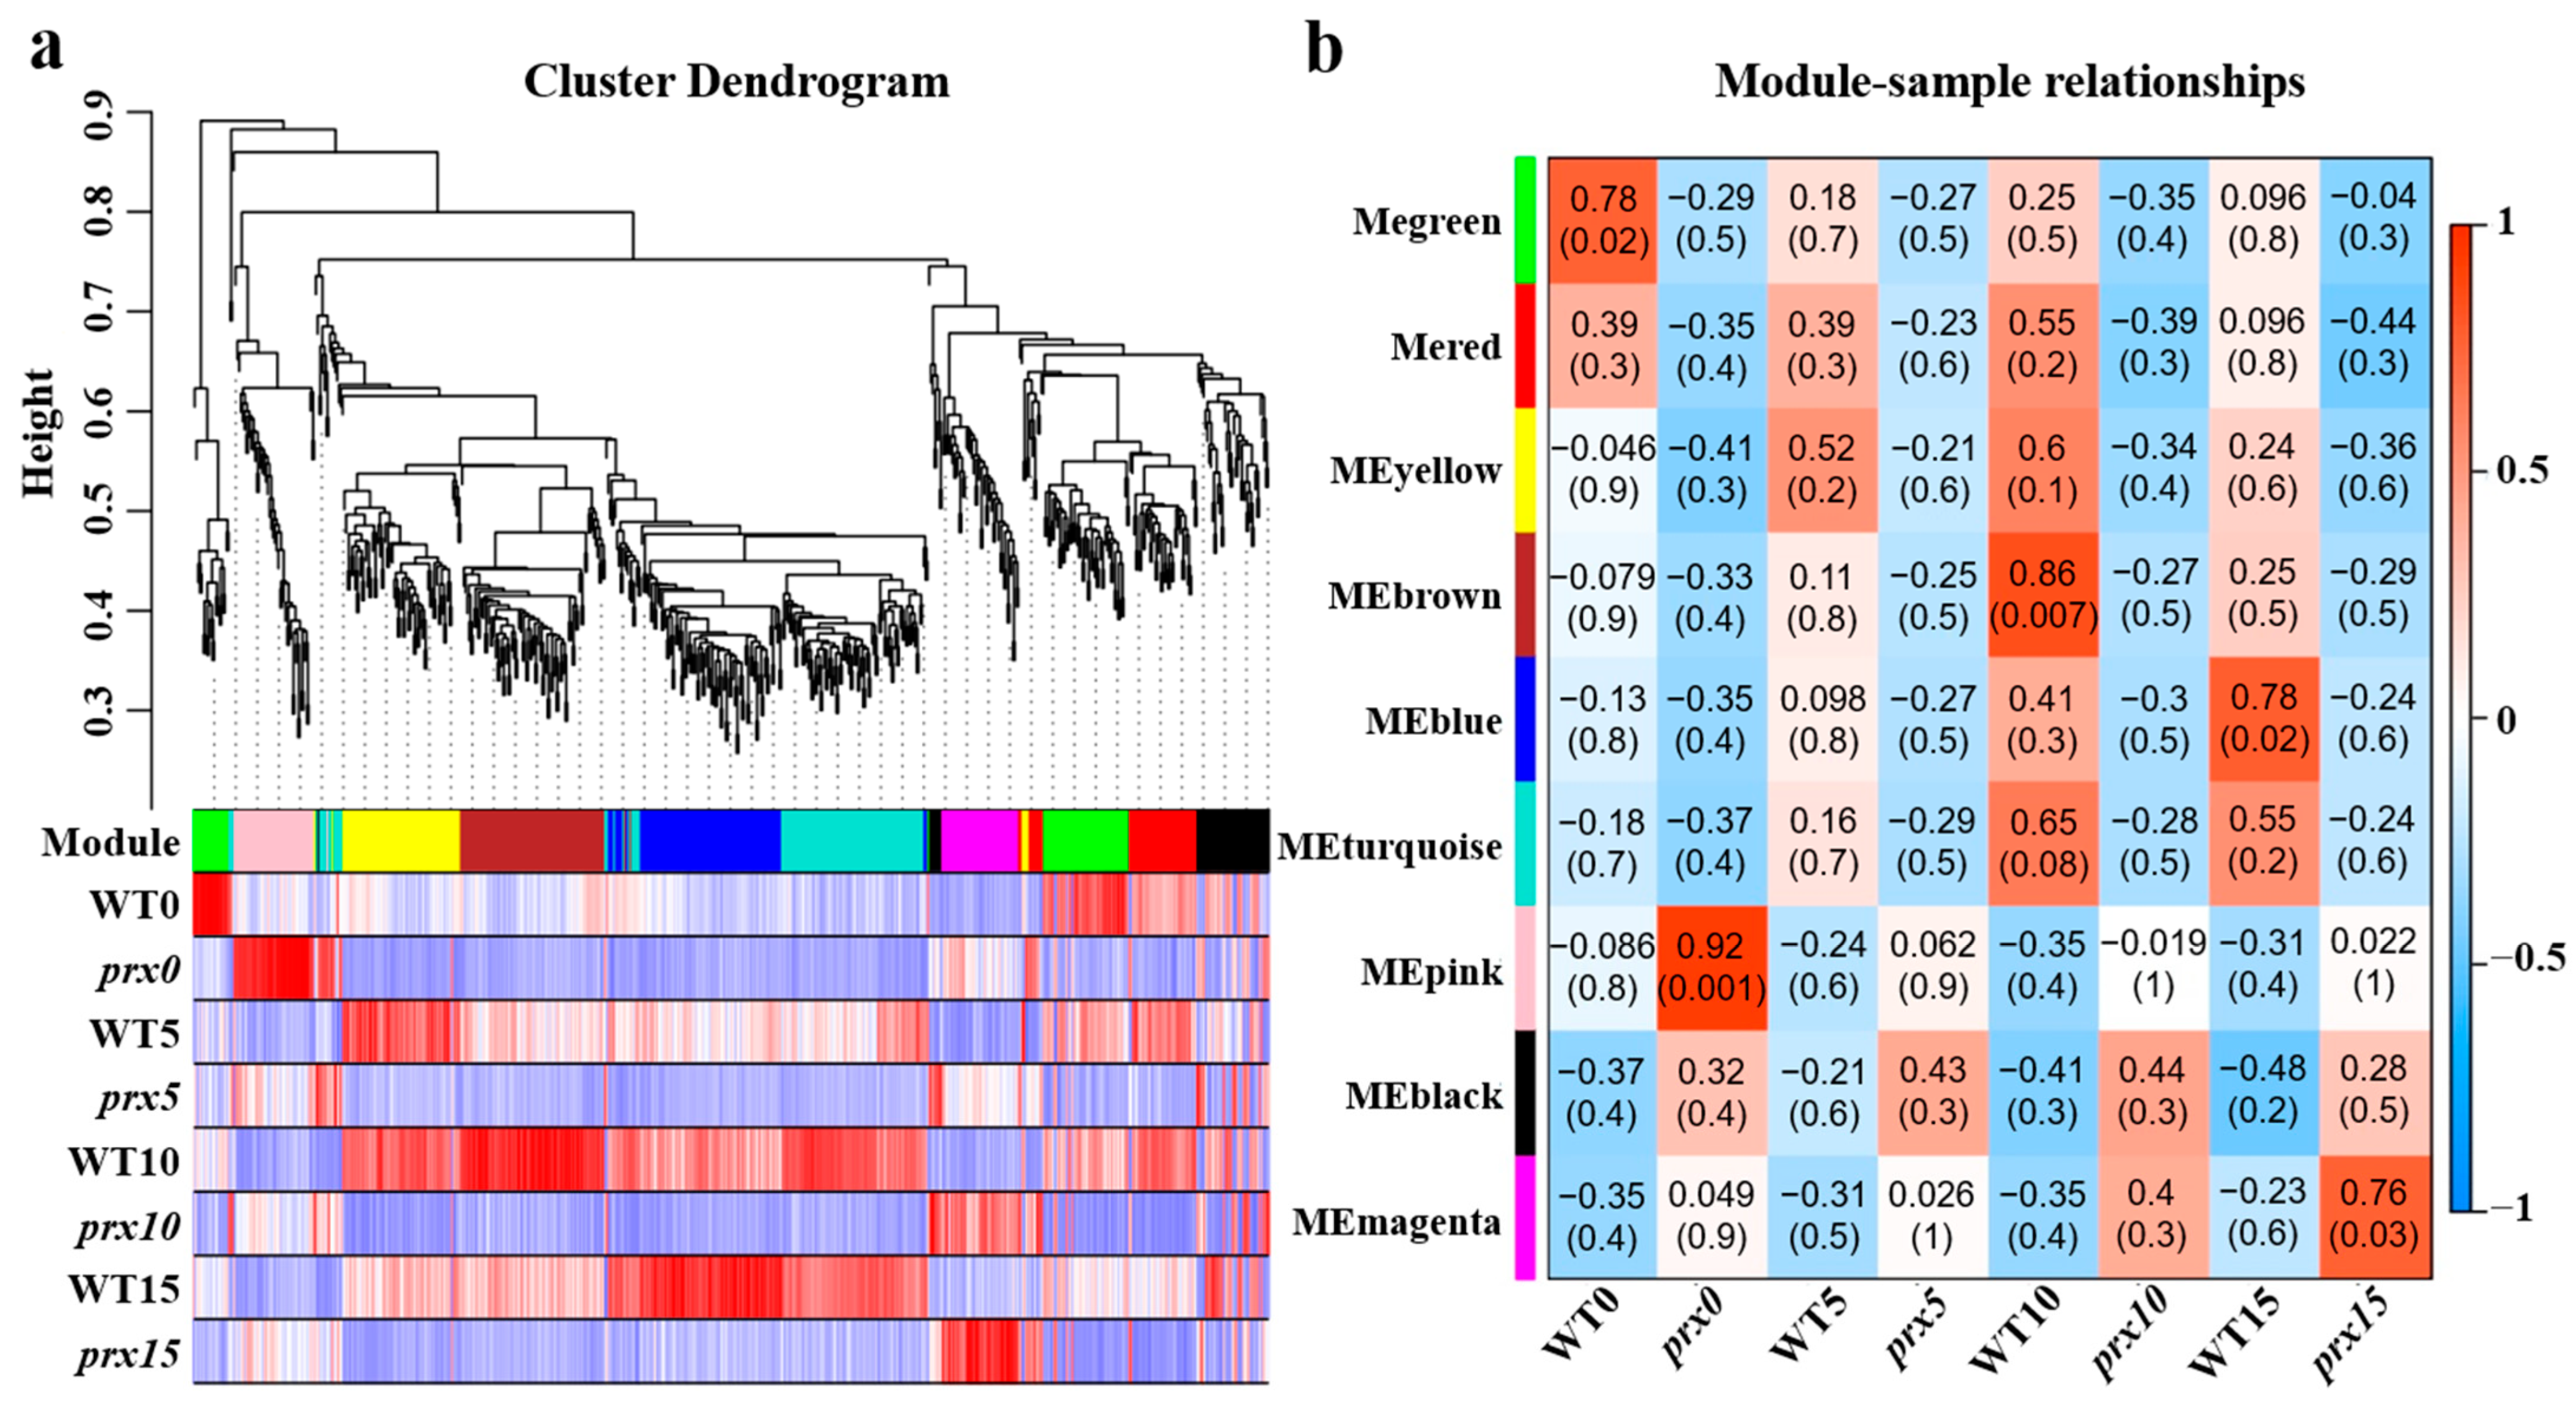
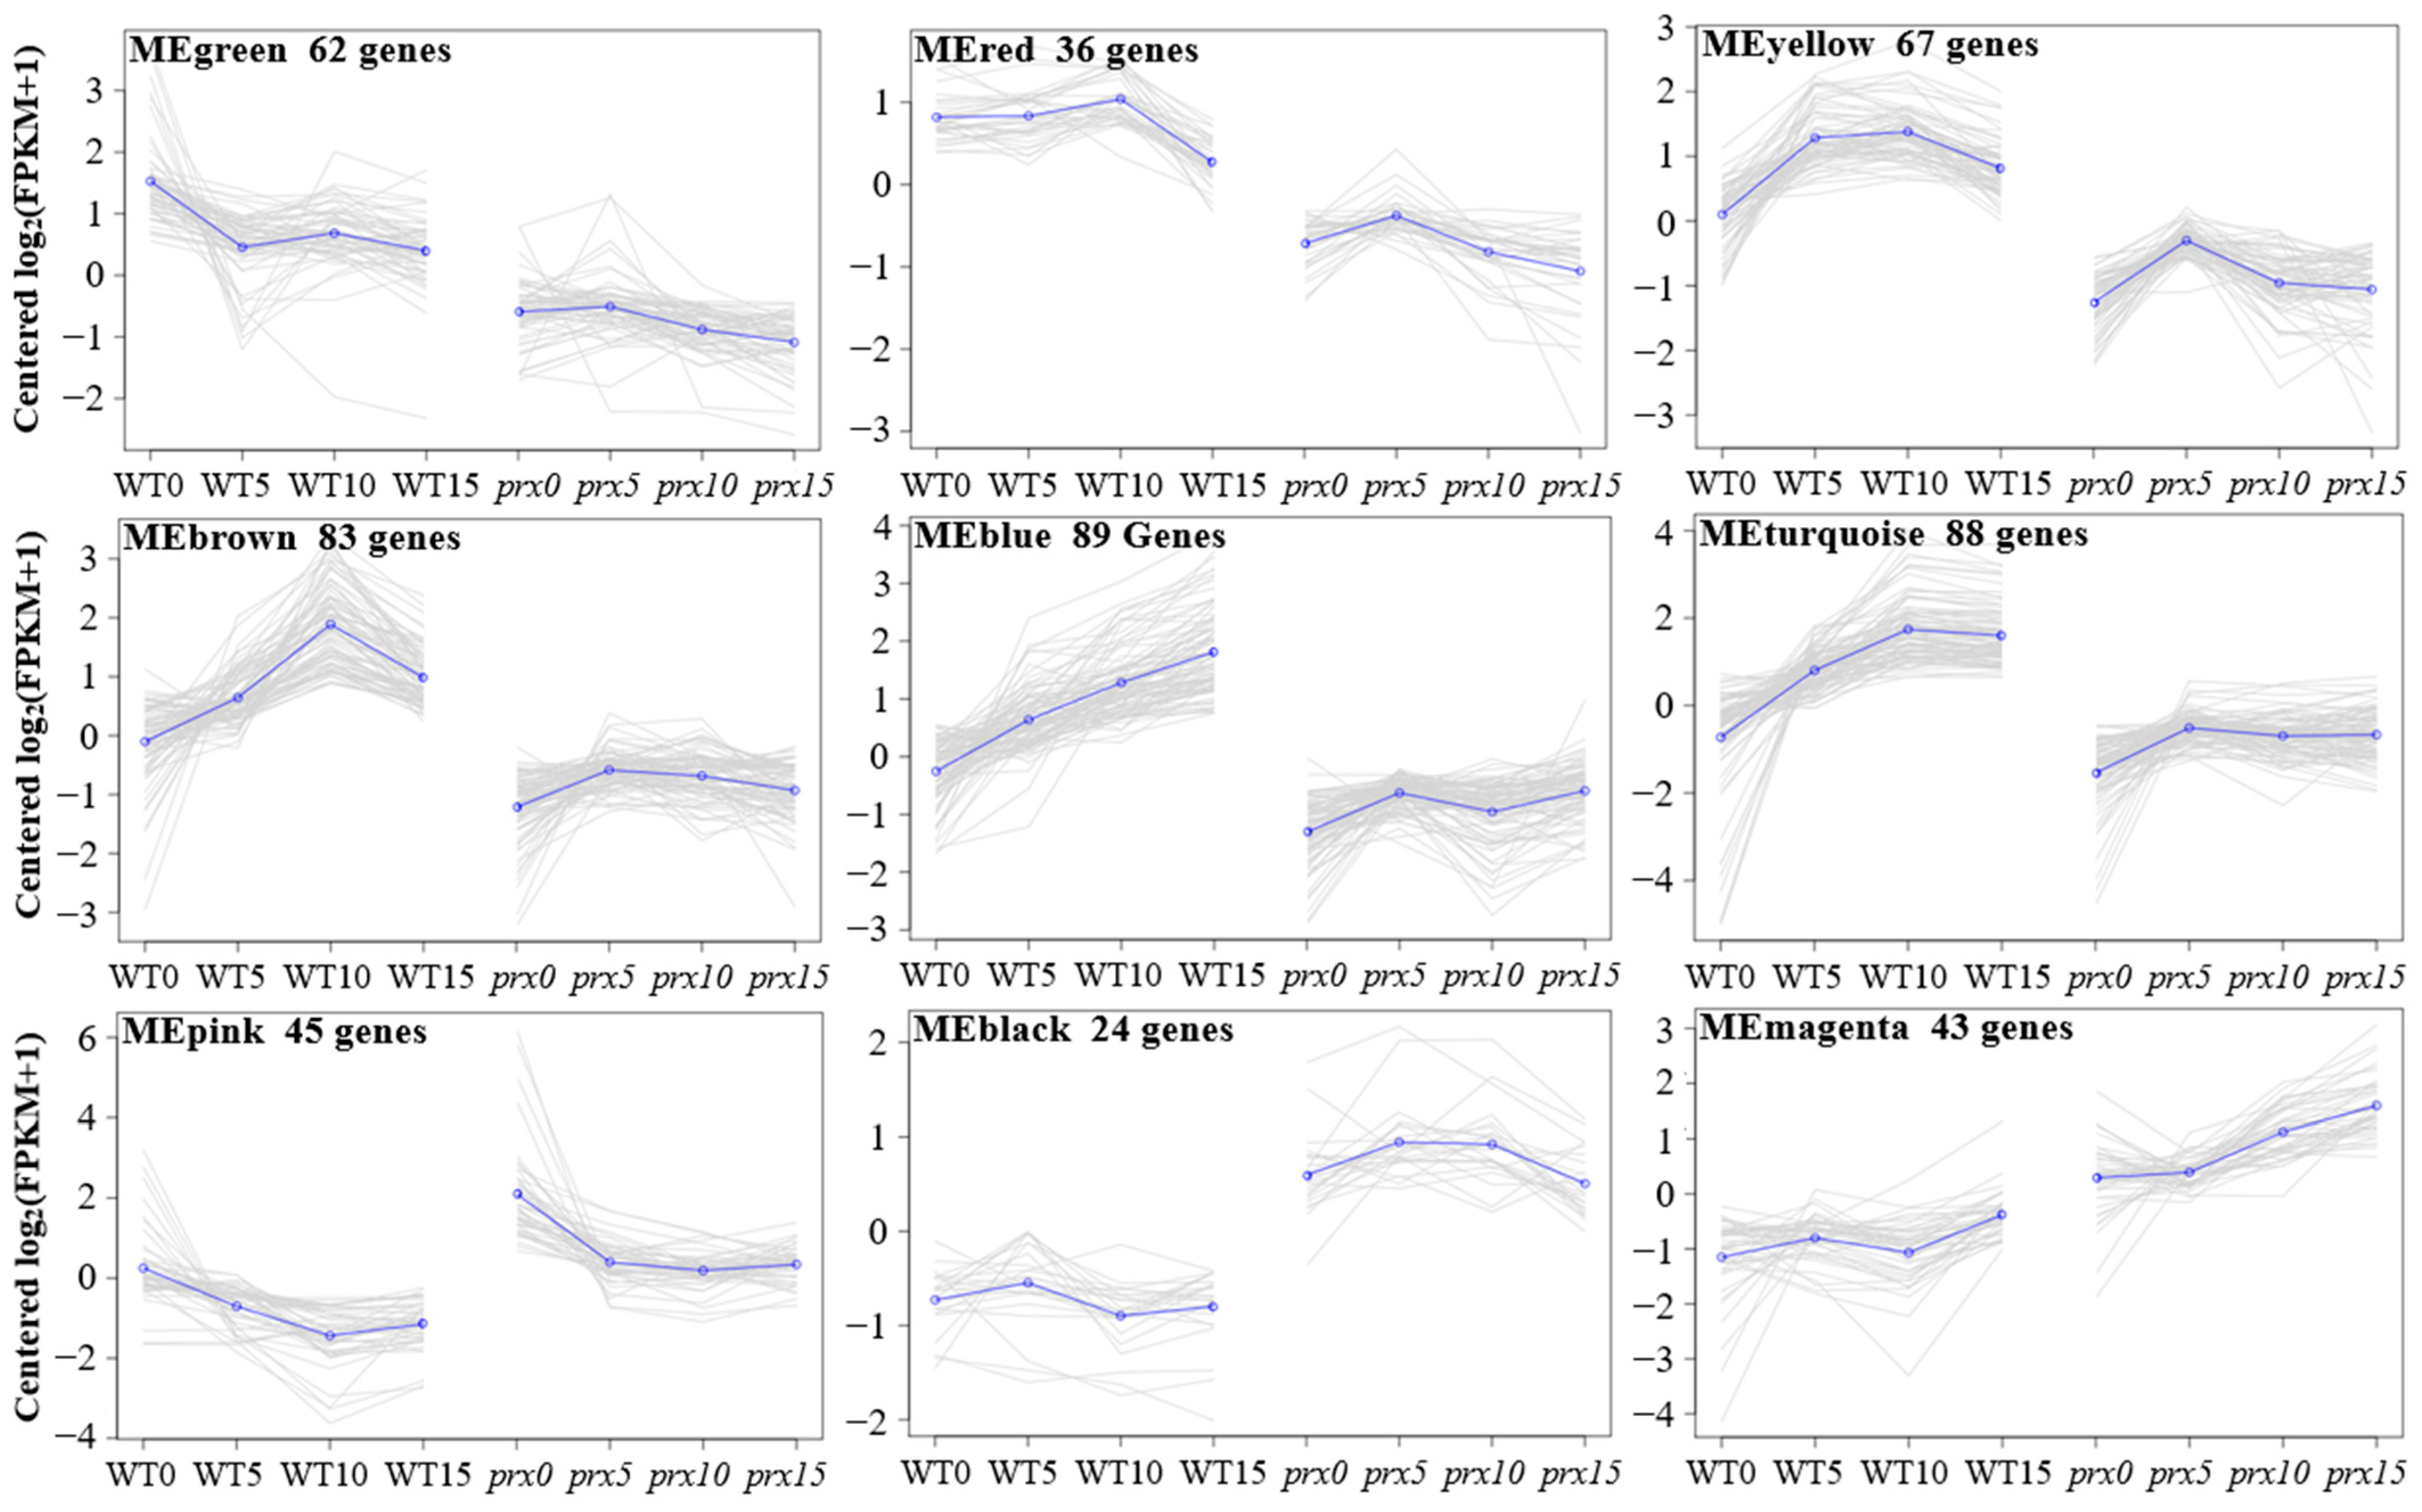
3.5. Weighted Gene Coexpression Network Analysis

Using weighted gene coexpression network analysis (WGCNA), we identified nine DEG modules associated with somatic regeneration in maize inbred lines (Figure 5). Among these modules, MEblue (89 genes, including ZmPRX19), MEturquoise (88 genes), and MEbrown (83 genes) were the most enriched, and their genes were predominantly expressed at 10 d and 15 d of wild-type differentiation, while the mRNA levels were lower in the other samples (Figure 5). Correspondingly, the MEred module was highly expressed within 10 d of KN5585 differentiation culture, and MEyellow was highly expressed in WT5 and WT10, while the transcriptional activity was suppressed in the other samples. In the Zmprx19-1 mutant, the module MEpink module was densely expressed specifically in the prx0 samples, while MEmagenta was highly expressed in prx15 and prx10 (Figure 5). Further analysis of the transcriptional trends of the above gene sets in the two inbred lines revealed that the average expression of the three modules, MEpink, MEblack and MEmagenta, was greater in the mutant than in the wild type (Figure 6). The remaining six modules had more abundant mRNA products in KN5585. The apparent differences in the expression patterns of the gene modules confirms that they may play different roles in plantlet differentiation.

3.6. GO Analysis of the Module Genes

To identify the specific functions of the nine modules, we performed GO enrichment analysis on each of the modules. The results showed that all the gene sets were significantly enriched (q < 0.05) in both biological process and molecular function first-level classifications. However, only some modules (MEbrown, MEblue, MEturquoise and MEpink) were enriched in cellular components (Table S5). According to the biological process classification, MEturquoise was significantly enriched in GO terms such as regulation of plant organ formation, adventitious root development and photosynthesis, and light harvesting in photosystem I (Figure 7 and Table S5), suggesting that the genes in this module may be directly involved in key steps of plant organogenesis. In addition, the hormone signaling terms enriched in this module, such as regulation of the jasmonic-acid-mediated signaling pathway and response to gibberellin, have also been shown to be closely related to somatic regeneration [30]. MEpink was significantly enriched in terms such as meristem initiation and hormone-mediated signaling pathways (Figure 7 and Table S5), suggesting that the genes in this module may function upstream of MEturquoise. Moreover, cell-fate-related terms such as regulation of the mitotic cell cycle, regulation of shoot apical meristem development, and leaf formation were also identified in the MEblue, MEyellow, and MEred modules (Figure 7 and Table S5). Finally, in the molecular function and cellular component classifications, GO terms such as protein serine/threonine kinase activity, calmodulin binding and photosystem II were significantly enriched (Table S5), suggesting that these modules may play a role in pathways such as photosynthesis and signal transduction.

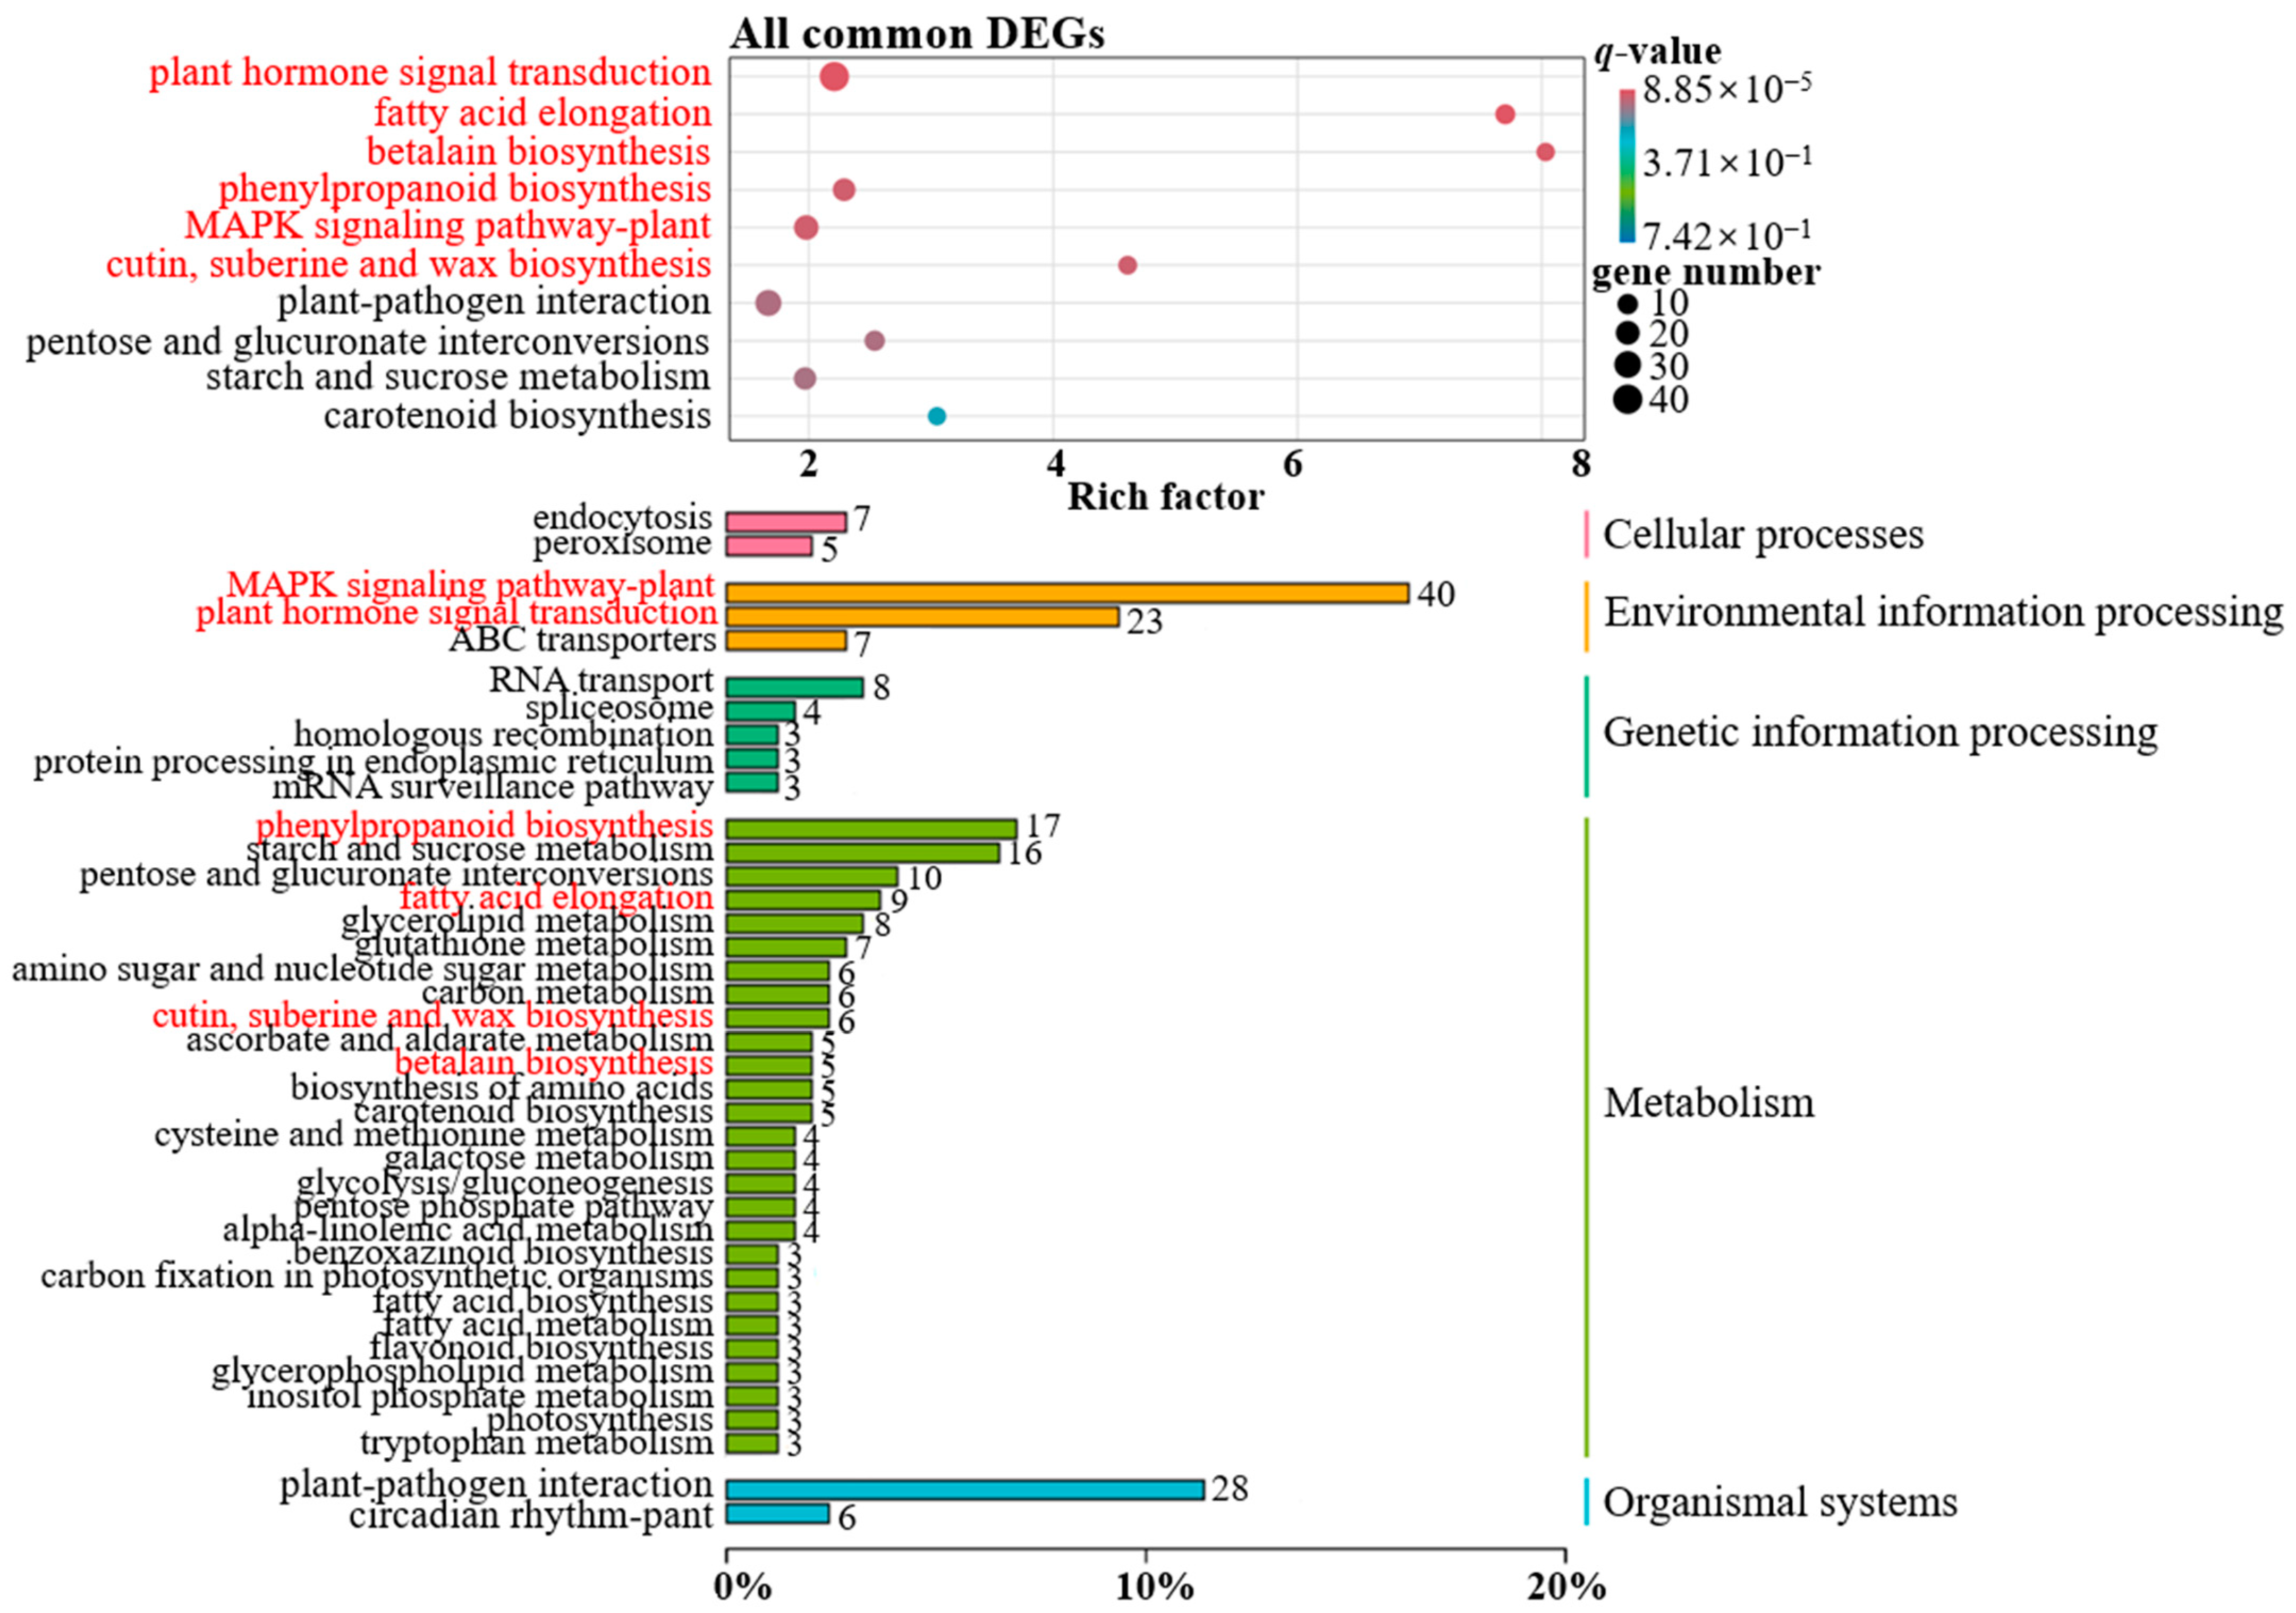
3.7. KEGG Pathway Enrichment Analysis

We further analyzed the metabolic pathways involved in each module or all the common DEGs separately using the KEGG method. The results showed that a total of 14 KEGG terms were significantly enriched (q < 0.05) (Table S6). Among them, the greatest number of terms was significantly enriched in 689 common DEGs, including six pathways such as plant hormone signal transduction (ko04075), MAPK signaling pathway-plant (ko04016) and phenylpropanoid biosynthesis (ko00940) (Figure 8 and Table S6), the functional classification results of which were basically consistent with the GO analysis. The peroxidase gene ZmPRX19 was significantly enriched in the phenylpropanoid biosynthesis (ko00940) pathway, which may affect EC regeneration by regulating the synthesis of related lignin (Table S4). The MEturquoise module was significantly enriched in the plant hormone signal transduction (ko04075) pathway, and photosynthsis (ko00195) and photosynthesis-antenna proteins (ko00196) were also detected (Table S6), suggesting that this module may be related to the utilization of light energy in somatic differentiation. In addition, the MEblack module was enriched in the pathways flavonoid biosynthesis (ko00941) and pentose and glucuronate interconversions (ko00040), and the former had some indirect relationship with phenylpropanoid biosynthesis (ko00940). Finally, four terms were identified in the MEyellow module, including fatty acid elongation (ko00062). The above results suggest that these pathways may be critical for regulating somatic regeneration in inbred lines.

3.8. KEGG Pathway Enrichment Analysis

In this study, plant hormone signal transduction was the pathway with the greatest number of enriched DEGs and the most significantly enriched pathway (q = 8.85 × 10⁻⁵) (Figure 8). A total of 40 DEGs were involved in this pathway, of which 37 genes were downregulated and 3 genes were upregulated in the mutant compared to the wild type (Figure 9a and Table S4). The upregulated genes were annotated as SAUR family protein, DELLA protein and brassinosteroid resistant 1_2 (BZR1_2), respectively. These genes are closely related to signal transduction pathways, such as gibberellin (Figure 9a and Figure S2). Among the 37 downregulated genes, 8 were annotated as two-component response regulator ARR-B family proteins, and 1 was annotated as a two-component response regulator ARR-A family protein. These genes are involved in the cytokinin signaling pathway, which positively regulates cytokinesis and shoot initiation (Figure 9a and Figure S2). Auxin and brassinosteroids have been reported to be associated with plant growth and development [31]. In the present study, eight genes, including three auxin response factor (ARF) genes and two protein brassinosteroid insensitive 1 (BRI1) genes, functioned in the above pathway (Figure 9a) and synergistically regulated EC regeneration. Additionally, two mitogen-activated protein kinase kinase 4_5 (MKK4_5) genes and one ethylene-insensitive protein 3 (EIN3) gene were significantly enriched in the ethylene pathway (Figure 9a and Figure S2). Five jasmonate ZIM domain-containing (JAZ) genes and three transcription factor MYC2 genes were significantly enriched in the jasmonic acid pathway (Figure 9a and Figure S2). These genes are involved in the regulation of the stress response and senescence in plant cells.
Phenylpropanoid biosynthesis was another metabolic pathway that was significantly enriched (q = 1.32 × 10⁻³) (Figure 8). A total of 17 DEGs were involved in this process (Figure 9b and Table S4). Ten of these genes, including ZmPRX19, were annotated as peroxidases (PODs). These genes were either up- or downregulated in the mutant and catalyzed the production of lignin from alcohols such as p-coumaryl alcohol (Figure 9b and Figure S3). Upstream of the peroxidase-catalyzed reactions, two genes were annotated as cinnamyl-alcohol dehydrogenase (CAD), two as cinnamoyl-CoA reductase (CCR), and one as shikimate O-hydroxycinnamoyl transferase (HCT). These genes were upregulated up to 7.5-fold and downregulated down to 5.1-fold in the mutant, functioning together in a number of reactions, such as the generation of alcohols from p-coumaryl-CoA (Figure S3 and Table S4). Among the other DEGs, the phenylalanine ammonia-lyase (PAL) gene was downregulated more than 4.8-fold, catalyzing the generation of cinnamic acid from phenylalanine (Figure S3 and Table S4). The last gene encodes a β-glucosidase, which is upregulated in expression and contributes to the glycosidic bond hydrolysis of β-D-glucosyl-2-coumarinate (Figure S3), thus playing a role in a variety of cellular functions.
Photosynthesis is an important means by which green plants absorb light energy and promote their own growth and development. In this study, three DEGs were enriched in the photosynthesis pathway (Figure 9c and Figure S4). These genes were involved in the photosynthetic reactions in photosystem I and photosystem II, respectively. In addition, two DEGs were found to participate in the photosynthesis-antenna proteins pathway (Figure 9c and Figure S5). Their encoded products are components of the light-harvesting chlorophyll (LHC) protein complex, which functions in the harvesting of light energy and its transfer to photosynthetic reaction centers (Figure S5). Further analysis of the expression of the above five genes revealed that all of them tended to be downregulated in the mutant compared to the wild type after the initiation of differentiation culture (Figure 9c and Table S4). This corresponded to a significant reduction (p < 0.01) in the GCR and PRR of the mutants (Table 1). Finally, a total of 23 common DEGs were enriched in the MAPK signaling pathway-plant (Figure 9d and Figure S6). Among them, only one gene, Zm00001d041574 (FRK1), was upregulated in the mutant, while the remaining genes were downregulated (Figure S6 and Table S4). These genes are involved in processes such as cell death, root growth, and defense responses in plants. By gene matching, we found that six genes, including MYC2, were also significantly enriched in the plant hormone signal transduction pathway (Figure 9 and Table S4). This observation suggests that the regulatory network of plant somatic regeneration is the result of interactions among various pathways.

3.9. PPI Network Analysis

To predict the hub genes that regulate maize somatic regeneration, all 689 common DEGs were used to construct the PPI network. A total of 86 nodes and 135 protein pairs were identified (Figure 10). Five of the nodes had a score of 100, indicating the highest number of proteins interacting with them, and were therefore identified as hub genes. All of these genes are members of the MAPKKK17_18 family (Table S4), and they are Zm00001d011655, Zm00001d011656, Zm00001d038883, Zm00001d043740 and Zm00001d043741. KEGG analysis revealed that all five genes were enriched in the MAPK signaling pathway-plant, which may be related to stress adaptation in plants (Figure S6). In addition, we found 10 radiation nodes associated with the hub nodes in the PPI network (Figure 10). Three of these genes (Zm00001d018261, Zm00001d027463 and Zm00001d037114) were also enriched in the MAPK signaling pathway-plant, and one gene (Zm00001d022044) was enriched in the plant hormone signal transduction pathway (Table S4). These genes play a role in processes such as elongation and division of plant cells and form a core subnetwork together with the hub nodes (Figure 10).

4. Discussion

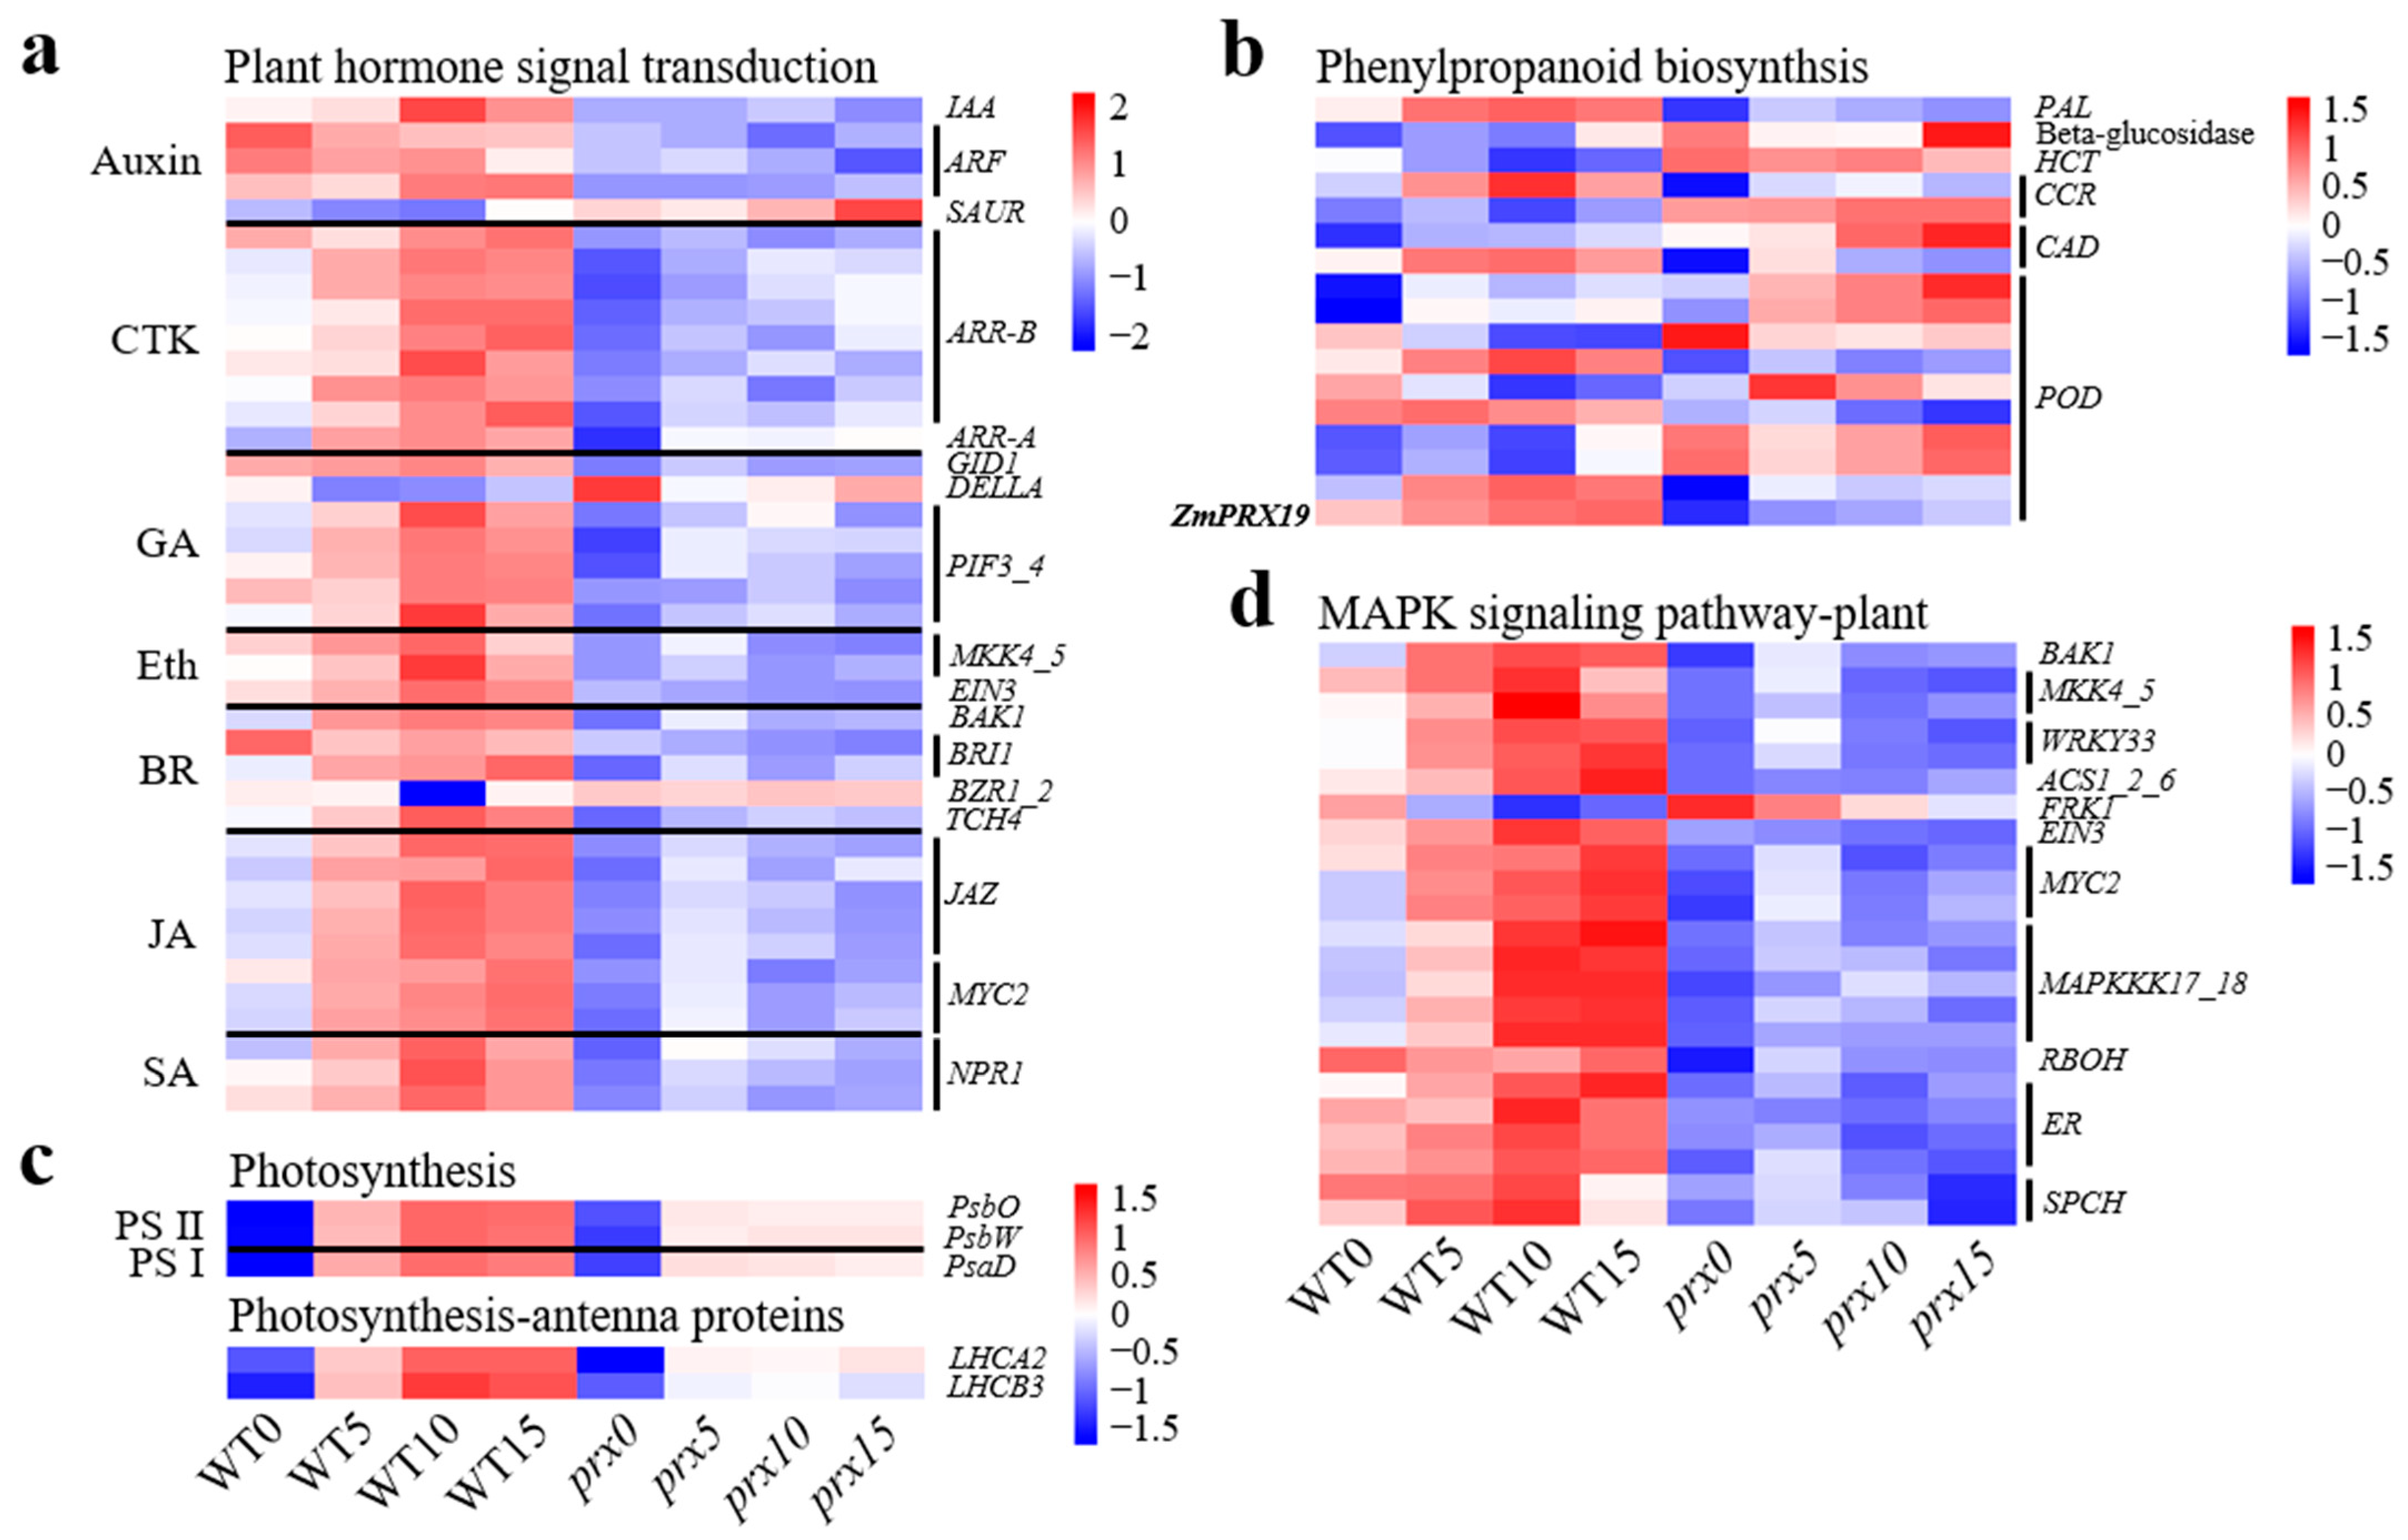
4.1. Signaling Pathways Involved in EC Differentiation

A signaling pathway involves a series of enzymatic reactions in which molecular signals are transmitted from outside the cell through the cell membrane into the cell to exert their effects. In this study, two signaling pathways, plant hormone signal transduction and the MAPK signaling pathway-plant, were found to be involved in EC differentiation (Table S6). Among them, plant hormone signal transduction is responsible for transmitting external stimulus signals, such as auxin, cytokinin, and gibberellin to the nucleus, which regulate gene expression and initiate developmental programs [32]. A total of 40 common DEGs were significantly enriched in this pathway (Figure 8). These genes were involved in seven classes of phytohormone signaling pathways in addition to abscisic acid (Figure S2). Lee et al. [33] revealed that cytokinin-responsive type-B Arabidopsis response regulator 1 (ARR1) transiently interacts with the auxin-inducible Arabidopsis trithorax-related 2 (ATXR2) protein at the early stage of shoot regeneration. The resulting ARR1-ATXR2 complex directly activates type-A ARR genes, which in turn regulate cytokinin signaling to ensure proper cell fate transitions. Eight downregulated DEGs encoding B-ARR and one encoding A-ARR were significantly enriched in this pathway in our study (Figure 9a and Figure S2). Silencing of these genes may reduce the ability of the mutants to redifferentiate plantlets by inhibiting the callus response to cytokinin. In jasmonic acid signaling, five JAZ genes and three MYC2 transcription factor genes were downregulated more than 2.2-fold in the mutant compared to the wild type (Figure 9a and Table S4). These genes may be associated with the stress response and senescence in plants by restricting the transcription of downstream genes (Figure S2). Zhang et al. [34] reported that jasmonate accumulates rapidly in Arabidopsis leaves within 10 min after cutting. Subsequent activation of ASA1, a key gene for auxin synthesis, by ERF109 promotes adventitious root regeneration in the leaves. In the present study, jasmonate signaling was inhibited in the mutant by eight downregulated DEGs. The resulting decrease in auxin synthesis may be the main reason why the mutant EC was virtually unable to regenerate. In addition, Zhao et al. [35] showed that phytochrome interacting factor 3 (PIF3) promotes cucumber hypocotyl growth by activating the expression of GA20ox-2 and ARF18. Here, five PIF genes and three ARF genes were downregulated in the gibberellin and auxin signaling pathways, respectively, which in turn inhibited somatic elongation and differentiation (Figure 9a and Figure S2). This observation is basically consistent with the results of previous studies. Overall, we conclude that plant cell fate reprogramming involves a complex interplay of multiple phytohormone-mediated signaling pathways.
Mitogen-activated protein kinases (MAPK) are a group of serine-threonine protein kinases that can be activated by various extracellular stimuli. MAPK activation is the final step in the intracellular phosphorylation cascade and has multiple effects on cell proliferation, stress, differentiation and apoptosis [36]. A total of 23 DEGs were significantly enriched in the MAPK signaling pathway-plant in this study (Figure 9d and Table S4). These genes included five MAPKKK17_18 genes and two MKK4_5 genes, which were downregulated up to 37.4-fold in the mutant (Table S4). Zhang et al. [37] reported that mutations in Arabidopsis MKK4_5 cause defective embryogenesis under maternal control. The MKK4_5 genes mined in this study belong to the same family as previously reported genes. Moreover, the MAPKKK17_18 genes are located upstream of MKK in the cascade reaction. Strong inhibition of the transcriptional activity of these DEGs may also lead to the loss of embryogenesis in plant somatic cells [38]. In addition, all five MAPKKK17_18 genes were identified as hub genes in the PPI network analysis (Figure 10), which further supports the above analysis. Overall, we speculate that the five MAPKKK17_18 genes may be the key genes controlling plant somatic regeneration. The genes Zm00001d018261, Zm00001d027463 and Zm00001d037114 are three radiation nodes associated with the hub nodes (Figure 10). These genes are significantly enriched in the MAPK pathway, which encodes the LRR receptor-like serine/threonine-protein kinase ERECTA (ER) located at the cell membrane (Figure S6). These products play important roles in organ morphogenesis, such as the meristematic organization of plant stem tips and the development of reproductive organs [39]. Finally, the three MYC2 genes involved in plant hormone signal transduction were also detected in the MAPK pathway (Figure 9 and Table S4). MYC2 not only regulates the crosstalk between JA signaling and other hormone signals but is also involved in the interaction between JA signaling and light and the biological clock, which ultimately functions in plant development, adventitious root formation, and flowering time [40].

4.2. Phenylpropanoid Biosynthesis in EC Differentiation

It has been previously shown that browning or even death of the callus during differentiation culture is a major obstacle to its regeneration [41]. The cause of this browning may be related to the differential expression of phenylpropanoid biosynthesis-related genes [42]. In this study, 10 upregulated and 7 downregulated genes were significantly enriched in this pathway (Figure 9b and Table S4). Among them, the gene HCT was upregulated up to 7.5-fold in the mutant, and its encoded product catalyzed the formation of caffeoyl-CoA from p-coumaryl-CoA, which provides a substrate for further synthesis of the corresponding lignin (Figure S3). Chang et al. [43] reported that excessive accumulation of lignin and flavonoids in ancient Platycladus orientalis led to callus lignification and inhibited adventitious root formation. Here, after HCT promoted caffeoyl-CoA production, we identified 2 CCR genes, 2 CAD genes, and 10 POD genes that participate in the subsequent key reactions (Figure 9b and Figure S3). Unfortunately, all three types of genes were simultaneously up- and downregulated in the mutant (Figure 9b). In particular, four downregulated genes, including Zmprx19, and six upregulated genes were detected in the POD gene family (Figure 9b). How these genes coordinate to catalyze the formation of the corresponding lignin from CoA and thus the loss of differentiation potential of the lignified callus is unclear. Additionally, Laukkanen et al. [44] examined enzyme activities in Scots pine browning callus and found that β-glucosidase activity was closely related to cell lignification. In this study, the gene Zm00001d035756, which encodes a β-glucosidase, was upregulated up to 8.2-fold in the mutant (Figure 9b and Table S4). This may be related to the excessive accumulation of lignin in the callus and ultimately its reduced regenerative capacity.

4.3. Photosynthesis in Plant Regeneration

The process of EC redifferentiation requires light. Light induces the differentiation of proplastids in the callus into chloroplasts, which photosynthesize to provide organic matter for plant regeneration [45]. In this study, a total of five DEGs were significantly enriched in the photosynthesis and photosynthesis-antenna proteins pathways (Figure 9c). Among them, the genes light-harvesting complex I chlorophyll a/b binding protein 2 (LHCA2) and light-harvesting complex II chlorophyll a/b binding protein 3 (LHCB3) encode the important components of LHC I and LHC II, respectively (Figure S5). LHCA2 and LHCB3 were downregulated up to 14.1-fold and 12.1-fold, respectively, during Zmprx19-1 mutant differentiation compared to that in the wild type (Table S4). A reduction in the LHCA2 and LHCB3 subunits impairs the integrity of the LHC, which in turn decreases the efficiency of light energy capture and transfer, leading to the inhibition of cellular photosynthesis [46]. In addition, three DEGs, PsbO, PsbW and PsaD, were enriched in photosystem II and photosystem I (Figure 9c). PsbO, PsbW and PsaD encode oxygen-evolving enhancer protein 1, PsbW protein and photosystem I subunit II, respectively, which are involved in photochemical reactions [47,48]. Using RNA interference technology Wang et al. [49] reduced the transcript levels of the PsbO gene, resulting in yellowing of wheat leaves. PtoPsbW had the highest expression in Populus tomentosa leaves, and the expression increased with leaf growth, suggesting that the function of this gene may be related to plant morphogenesis [50]. In this study, all three genes, including PsbO, showed a trend of downregulated expression in the mutant Zmprx19-1 compared with the wild-type after the onset of differentiation (Table S4). This downregulation may lead to the inhibition of photochemical reactions in the photosystem, resulting in a reduced capacity of somatic cells to differentiate plantlets. Finally, pathways such as fatty acid elongation (ko00062), pentose and glucuronate interconversions (ko00940) and flavonoid biosynthesis (ko00941) were also detected in the enrichment analysis (Table S6). The mechanism of action of these pathways in plant regeneration and their interconnections need further experimental verification.

5. Conclusions

In plants, the genotype dependence of somatic regeneration severely restricts the application of gene editing and other modern technologies for variety improvement. In this study, we performed a comparative transcriptomic analysis of the ECs of the extreme maize inbred line KN5585 and its peroxidase gene mutants during four differentiation stages. The results revealed that a total of 689 common DEGs were associated with the differentiation of plantlets from ECs. These genes were divided into nine gene modules that are involved mainly in plant hormone signal transduction, the MAPK signaling pathway-plant, phenylpropanoid biosynthesis, and photosynthesis. In addition, PPI network analysis revealed five MAPKKK17_18 hub nodes and ten radiation nodes. The MAPKKK17_18 genes are located upstream of MKK in the MAPK cascade, whose expression is downregulated up to 37.4-fold in the mutant, and these genes may be key in controlling plantlet differentiation. Our research provides a foundation for further analysis of the molecular mechanisms underlying cell fate determination in plant cells.

Supplementary Materials

The following supporting information can be downloaded at: https://www.mdpi.com/article/10.3390/agronomy14081689/s1, Figure S1: Nucleotide sequence comparison between the wild-type (WT) KN5585 and its three gene-edited mutants; Figure S2: KEGG pathway map of plant hormone signal transduction; Figure S3: KEGG pathway map of phenylpropanoid biosynthesis; Figure S4: KEGG pathway map of photosynthesis; Figure S5: KEGG pathway map of photosynthesis-antenna proteins; Figure S6: KEGG pathway map of MAPK signaling pathway-plant; Table S1: Amplification primers for the gene-edited regions in ZmPRX19; Table S2: Real-time PCR primers of the differentially expressed genes (DEGs); Table S3: Overview of the RNA-seq data; Table S4: Detailed information on the common differentially expressed genes (DEGs); Table S5: Gene Ontology (GO) annotation for the nine modules, with blue boxes indicating significant enrichment (q < 0.05); Table S6: Kyoto Encyclopedia of Genes and Genomes (KEGG) pathway annotation for the nine modules with green boxes denoting significant enrichment (q < 0.05).

Author Contributions

Conceptualization, L.D.; methodology, L.D.; software, L.D. and T.L; validation, L.D. and T.L.; formal analysis, L.D. and T.L.; investigation, L.D.; resources, L.D.; data curation, L.D.; writing—original draft preparation, L.D.; writing—review and editing, L.D. and T.L.; visualization, L.D. and T.L.; supervision, L.D. and T.L.; project administration, L.D.; funding acquisition, L.D. All authors have read and agreed to the published version of the manuscript.

Funding

This work was funded by the Science and Technology Development Program of Jilin Province of China (Grant No. 20230101190JC).

Data Availability Statement

The RNA-seq data presented in the study are openly available in the NCBI Sequence Read Archive (https://submit.ncbi.nlm.nih.gov/subs/sra/, accessed on 21 June 2024) database under BioProject PRJNA1126324.

Acknowledgments

We thank Biomarker Technologies Co., Ltd. for assisting in bioinformatics analysis.

Conflicts of Interest

The authors declare no conflicts of interest.

References

  1. Bidabadi, S.S.; Jain, S.M. Cellular, molecular, and physiological aspects of in vitro plant regeneration. Plants 2020, 9, 702. [Google Scholar] [CrossRef] [PubMed]
  2. Haberlandt, G. Culturversuche mit isolierten Pflanzenzellen. In Sitzungsberichte der Kaiserlichen Akademie der Wissenschaften; Mathematisch-Naturwissenschaftliche Classe; Springer: Wien, Austria, 1902; Volume 111, pp. 69–92. [Google Scholar]
  3. Ishida, Y.; Hiei, Y.; Komari, T. Agrobacterium-mediated transformation of maize. Nat. Protoc. 2007, 2, 1614–1621. [Google Scholar] [CrossRef] [PubMed]
  4. Liu, L.; Luo, W.; Linghu, Q.; Abe, F.; Hisano, H.; Sato, K.; Kamiya, Y.; Kanako, K.; Onishi, K.; Endo, M.; et al. In planta genome editing in commercial wheat varieties. Front. Plant Sci. 2021, 12, 648841. [Google Scholar] [CrossRef] [PubMed]
  5. Lardon, R.; Geelen, D. Natural variation in plant pluripotency and regeneration. Plants 2020, 9, 1261. [Google Scholar] [CrossRef] [PubMed]
  6. Nagle, M.F.; Yuan, J.; Kaur, D.; Ma, C.; Peremyslova, E.; Jiang, Y.; Rivera, A.N.; Jawdt, S.; Chen, J.G.; Feng, K.; et al. GWAS supported by computer vision identifies large numbers of candidate regulators of in planta regeneration in Populus trichocarpa. G3-Genes Genomes Genet. 2024, 14, jkae026. [Google Scholar] [CrossRef] [PubMed]
  7. Long, Y.; Yang, Y.; Pan, G.; Shen, Y. New insights into tissue culture plant-regeneration mechanisms. Front. Plant Sci. 2022, 13, 926752. [Google Scholar] [CrossRef] [PubMed]
  8. Ma, L.; Liu, M.; Yan, Y.; Qing, C.; Zhang, X.; Zhang, Y.; Long, Y.; Wang, L.; Pan, L.; Zou, C.; et al. Genetic dissection of maize embryonic callus regenerative capacity using multi-locus genome-wide association studies. Front. Plant Sci. 2018, 9, 561. [Google Scholar] [CrossRef] [PubMed]
  9. Sinha, A.; Solanki, M.; Shukla, L.I. Evidences for differential expression of miR167d-5p, target, positional nucleotide preference, and its role in somatic and different stages of regenerating calli of Oryza sativa. Plant Cell Tissue Organ Cult. 2019, 136, 537–548. [Google Scholar] [CrossRef]
  10. Islam, M.K.; Mummadi, S.T.; Liu, S.; Wei, H. Regulation of regeneration in Arabidopsis thaliana. aBIOTECH 2023, 4, 332–351. [Google Scholar] [CrossRef]
  11. Wang, Y.; Zhou, Q.; Zhu, G.; Wang, S.; Ma, Y.; Miao, H.; Zhang, S.; Huang, S.; Zhang, Z.; Gu, X. Genetic analysis and identifcation of a candidate gene associated with in vitro regeneration ability of cucumber. Theor. Appl. Genet. 2018, 131, 2663–2675. [Google Scholar] [CrossRef]
  12. Cheng, Y.; Liu, H.; Cao, L.; Wang, S.; Li, Y.; Zhang, Y.; Jiang, W.; Zhou, Y.; Wang, H. Down-regulation of multiple CDK inhibitor ICK/KRP genes promotes cell proliferation, callus induction and plant regeneration in Arabidopsis. Front. Plant Sci. 2015, 6, 825. [Google Scholar] [CrossRef]
  13. Shim, S.; Lee, H.G.; Seo, P.J. MET1-dependent DNA methylation represses light signaling and influences plant regeneration in Arabidopsis. Mol. Cells 2021, 44, 746–757. [Google Scholar] [CrossRef] [PubMed]
  14. Lopes, F.L.; Galvan-Ampudia, C.; Landrein, B. WUSCHEL in the shoot apical meristem: Old player, new tricks. J. Exp. Bot. 2021, 72, 1527–1535. [Google Scholar] [CrossRef] [PubMed]
  15. Guo, H.; Guo, H.; Zhang, L.; Fan, Y.; Fan, Y.; Zeng, F. SELTP-assembled battery drives totipotency of somatic plant cell. Plant Biotechnol. J. 2019, 17, 1188–1190. [Google Scholar] [CrossRef]
  16. Luján-Soto, E.; Juárez-González, V.T.; Reyes, J.L.; Dinkova, T.D. MicroRNA Zma-miR528 versatile regulation on target mRNAs during maize somatic embryogenesis. Int. J. Mol. Sci. 2021, 22, 5310. [Google Scholar] [CrossRef]
  17. Wójcik, A.M.; Wójcikowska, B.; Gaj, M.D. Current perspectives on the auxin-mediated genetic network that controls the induction of somatic embryogenesis in plants. Int. J. Mol. Sci. 2020, 21, 1333. [Google Scholar] [CrossRef]
  18. Dai, L.; Zhang, Y.; Han, S.; Hao, D. QTL mapping of somatic regeneration-related traits in maize. Agriculture 2022, 12, 393. [Google Scholar] [CrossRef]
  19. Kim, D.; Langmead, B.; Salzberg, S.L. HISAT: A fast spliced aligner with low memory requirements. Nat. Methods 2015, 12, 357–360. [Google Scholar] [CrossRef] [PubMed]
  20. Pertea, M.; Pertea, G.M.; Antonescu, C.M.; Chang, T.C.; Mendell, J.T.; Salzberg, S.L. StringTie enables improved reconstruction of a transcriptome from RNA-seq reads. Nat. Biotechnol. 2015, 33, 290–295. [Google Scholar] [CrossRef]
  21. Trapnell, C.; Williams, B.A.; Pertea, G.; Mortazavi, A.; Kwan, G.; Baren, M.J.; Salzberg, S.L.; Word, B.J.; Pachter, L. Transcript assembly and quantification by RNA Seq reveals unannotated transcripts and isoform switching during cell differentiation. Nat. Biotechnol. 2010, 28, 511–515. [Google Scholar] [CrossRef]
  22. Love, M.I.; Huber, W.; Anders, S. Moderated estimation of fold change and dispersion for RNA-seq data with DESeq2. Genome Biol. 2014, 15, 550. [Google Scholar] [CrossRef]
  23. Langfelder, P.; Horvath, S. WGCNA: An R package for weighted correlation network analysis. BMC Bioinform. 2008, 9, 559. [Google Scholar] [CrossRef]
  24. Kaufman, L.; Rousseeuw, P.J. Finding Groups in Data: An Introduction to Cluster Analysis; John Wiley & Sons: Hoboken, NJ, USA, 2009; Volume 344. [Google Scholar]
  25. Yu, G.; Wang, L.; Han, Y.; He, Q. clusterProfiler: An R package for comparing biological themes among gene clusters. OMICS 2012, 16, 284–287. [Google Scholar] [CrossRef] [PubMed]
  26. Mao, X.; Cai, T.; Olyarchuk, J.G.; Wei, L. Automated genome annotation and pathway identification using the KEGG Orthology (KO) as a controlled vocabulary. Bioinformatics 2005, 21, 3787–3793. [Google Scholar] [CrossRef]
  27. Becker, R.A.; Chambers, J.M.; Wilks, A.R. The New S Language; Wadsworth & Brooks; Chapman & Hall: London, UK, 1988. [Google Scholar]
  28. Rychlik, W. OLIGO 7 primer analysis software. Methods Mol. Biol. 2007, 402, 35–39. [Google Scholar]
  29. Schefe, J.H.; Lehmann, K.E.; Buschmann, I.R.; Unger, T.; Funke-Kaiser, H. Quantitative real-time RT-PCR data analysis: Current concepts and the novel “gene expression’s CT difference” formula. J. Mol. Med. 2006, 84, 901–910. [Google Scholar] [CrossRef]
  30. Zhou, W.; Lozano-Torres, J.L.; Blilou, I.; Zhang, X.; Zhai, Q.; Smant, G.; Li, C.; Scheres, B. A jasmonate signaling network activates root stem cells and promotes regeneration. Cell 2019, 177, 942–956. [Google Scholar] [CrossRef] [PubMed]
  31. Ikeuchi, M.; Favero, D.S.; Sakamoto, Y.; Iwase, A.; Coleman, D.; Rymen, B.; Sugimoto, K. Molecular mechanisms of plant regeneration. Annu. Rev. Plant Biol. 2019, 70, 377–406. [Google Scholar] [CrossRef]
  32. Takeuchi, J.; Fukui, K.; Seto, Y.; Takaoka, Y.; Okamoto, M. Ligand–receptor interactions in plant hormone signaling. Plant J. 2021, 105, 290–3306. [Google Scholar] [CrossRef] [PubMed]
  33. Lee, K.; Park, O.S.; Go, J.Y.; Yu, J.; Han, J.H.; Kim, J.; Bae, S.; Jung, Y.J.; Seo, P.J. Arabidopsis ATXR2 represses de novo shoot organogenesis in the transition from callus to shoot formation. Cell Rep. 2021, 37, 109980. [Google Scholar] [CrossRef]
  34. Zhang, G.; Zhao, F.; Chen, L.; Pan, Y.; Sun, L.; Bao, N.; Zhang, T.; Cui, C.; Qiu, Z.; Zhang, Y.; et al. Jasmonate-mediated wound signalling promotes plant regeneration. Nat. Plants 2019, 5, 491–497. [Google Scholar] [CrossRef] [PubMed]
  35. Zhao, J.; Bo, K.; Pan, Y.; Li, Y.; Yu, D.; Li, C.; Chang, J.; Wu, S.; Wang, Z.; Zhang, X.; et al. Phytochrome-interacting factor PIF3 integrates phytochrome B and UV-B signaling pathways to regulate gibberellin-and auxin-dependent growth in cucumber hypocotyls. J. Exp. Bot. 2023, 74, 4520–4539. [Google Scholar] [CrossRef] [PubMed]
  36. Yao, Y.; Zhao, H.; Sun, L.; Wu, W.; Li, C.; Wu, Q. Genome-wide identification of MAPK gene family members in Fagopyrum tataricum and their expression during development and stress responses. BMC Genom. 2022, 23, 96. [Google Scholar] [CrossRef] [PubMed]
  37. Zhang, M.; Wu, H.; Su, J.; Wang, H.; Zhu, Q.; Liu, Y.; Xu, J.; Lukowitz, W.; Zhang, S. Maternal control of embryogenesis by MPK6 and its upstream MKK4/MKK5 in Arabidopsis. Plant J. 2017, 92, 1005–1019. [Google Scholar] [CrossRef] [PubMed]
  38. Winkelmann, T. Somatic versus zygotic embryogenesis: Learning from seeds. In Methods in Molecular Biology; Humana Press: New York, NY, USA, 2016; Volume 1359. [Google Scholar]
  39. Jiang, H.; Chen, Y.; Liu, Y.; Shang, J.; Sun, X.; Du, J. Multifaceted roles of the ERECTA family in plant organ morphogenesis. J. Exp. Bot. 2022, 73, 7208–7218. [Google Scholar] [CrossRef]
  40. Kazan, K.; Manners, J.M. MYC2: The master in action. Mol. Plant 2013, 6, 686–703. [Google Scholar] [CrossRef] [PubMed]
  41. López-Ruiz, B.A.; Juárez-González, V.T.; Sandoval-Zapotitla, E.; Dinkova, T.D. Development-related miRNA expression and target regulation during staggered in vitro plant regeneration of Tuxpeño VS-535 maize cultivar. Int. J. Mol. Sci. 2019, 20, 2079. [Google Scholar] [CrossRef]
  42. Zhang, X.; Wang, Y.; Yan, Y.; Peng, H.; Long, Y.; Zhang, Y.; Jiang, Z.; Liu, P.; Zou, C.; Peng, H.; et al. Transcriptome sequencing analysis of maize embryonic callus during early redifferentiation. BMC Genom. 2019, 20, 159. [Google Scholar] [CrossRef] [PubMed]
  43. Change, E.; Guo, W.; Xie, Y.; Jiang, Z.; Dong, Y.; Jia, Z.; Zhao, X.; Liu, J.; Zhang, J. Changes of lignified-callus and wound-induced adventitious rooting in ancient Platycladus orientalis cuttings as affected by tree age. Ind. Crops Prod. 2023, 203, 117183. [Google Scholar] [CrossRef]
  44. Laukkanen, H.; Rautiainen, L.; Taulavuori, E.; Hohtola, A. Changes in cellular structures and enzymatic activities during browning of Scots pine callus derived from mature buds. Tree Physiol. 2000, 20, 467–475. [Google Scholar] [CrossRef]
  45. Siddique, A.B.; Islam, S.S. Effect of light and dark on callus induction and regeneration in tobacco (Nicotiana tabacum L.). Bangladesh J. Bot. 2015, 44, 643–651. [Google Scholar] [CrossRef]
  46. Pan, X.; Cao, P.; Su, X.; Liu, Z.; Li, M. Structural analysis and comparison of light-harvesting complexes I and II. Biochim. Biophys. Acta Bioenerg. 2020, 1861, 148038. [Google Scholar] [CrossRef] [PubMed]
  47. Bricker, T.M.; Frankel, L.K. Auxiliary functions of the PsbO, PsbP and PsbQ proteins of higher plant Photosystem II: A critical analysis. J. Photoch. Photobio. B 2011, 104, 165–178. [Google Scholar] [CrossRef] [PubMed]
  48. Murakami, R.; Ifuku, K.; Takabayashi, A.; Shikanai, T.; Endo, T.; Sato, F. Functional dissection of two Arabidopsis PsbO proteins. FEBS J. 2005, 272, 2165–2175. [Google Scholar] [CrossRef] [PubMed]
  49. Wang, S.; Li, Q.; Wang, J.; Yan, Y.; Zhang, G.; Yan, Y.; Zhang, H.; Wu, J.; Chen, F.; Wang, X.; et al. YR36/WKS1-mediated phosphorylation of PsbO, an extrinsic member of photosystem II, inhibits photosynthesis and confers stripe rust resistance in wheat. Mol. Plant 2019, 12, 1639–1650. [Google Scholar] [CrossRef]
  50. Wang, L.; Wang, B.; Du, Q.; Chen, J.; Tian, J.; Yang, X.; Zhang, D. Allelic variation in PtoPsbW associated with photosynthesis, growth, and wood properties in Populus tomentosa. Mol. Genet. Genom. 2016, 292, 77–91. [Google Scholar] [CrossRef]
Figure 1. Culture characteristics of the embryogenic callus (EC) during the differentiation stage. WT: wild type; Zmprx19-1, Zmprx19-2 and Zmprx19-3: gene-edited mutants; Bars = 8 mm.
Agronomy 14 01689 g001
Figure 2. Transcriptome differences between the wild-type (WT) KN5585 and its mutant Zmprx19-1. (a) Principal component analysis (PCA) plot of sample expression at different differentiation time points for the two genotypes. The circles represent 95% confidence intervals. (b) Cluster heatmap of Pearson’s correlation coefficients of the expression levels of all the samples, where red indicates high correlation and blue indicates low correlation.
Agronomy 14 01689 g002
Figure 3. Differentially expressed genes (DEGs) in each paired sample during the whole time course. (a) Statistical quantity histogram of the DEGs. (b) Venn diagrams of the DEGs between KN5585 and Zmprx19-1 during regeneration.
Agronomy 14 01689 g003
Figure 4. Correlation of the differential expression ratio between RNA-Seq and qPCR in the four differentiation stages. Three spots of the same color for each gene represent biological replicates.
Agronomy 14 01689 g004
Figure 5. Weighted gene coexpression network analysis (WGCNA) of KN5585 and its mutant Zmprx19-1 at the four regeneration stages. (a) Hierarchical cluster trees showing the coexpression modules identified by WGCNA. (b) Relationships between the modules (left) and the samples (bottom). Red and blue represent positive and negative correlations, respectively, with coefficient and p values.
Agronomy 14 01689 g005
Figure 6. Expression patterns of the common DEGs in the nine clusters. The horizontal axis indicates the samples at different regeneration time points. The vertical axis indicates the expression level of the DEGs. Each gray line represents the expression pattern of one gene, and the blue line shows the average expression trend of all genes in each cluster.
Agronomy 14 01689 g006
Figure 7. Gene Ontology (GO) enrichment analysis of the biological process terms of the partial modules. Gene numbers (circle size) and enrichment q-values (circle color) are shown. The green font indicates that the q value of the term is greater than 0.05.
Agronomy 14 01689 g007
Figure 8. Air bubble graph and classification graph showing Kyoto Encyclopedia of Genes and Genomes (KEGG) pathways enriched in all the common DEGs. The red font represents significantly enriched terms (q < 0.05).
Agronomy 14 01689 g008
Figure 9. Relative expression patterns of the common DEGs involved in somatic regeneration. The data were mapped by log2(FC), and the data were row standardized. (a) Expression patterns of the genes related to plant hormone biosynthesis. (b) Expression patterns of the genes related to phenylpropanoid biosynthesis. (c) Expression patterns of the genes related to photosynthesis mechanisms. (d) Expression patterns of the genes related to the plant MAPK signaling pathway.
Agronomy 14 01689 g009
Figure 10. Protein–protein interaction (PPI) network generated by all the common DEGs. The top 5 nodes with the highest scores are represented by pentacles. The radiation nodes associated with the top nodes are represented by squares.
Agronomy 14 01689 g010
Table 1. Phenotypic performance of somatic regeneration traits in the maize inbred lines.
LineEIR (%)GCR (%)PRR (%)
KN5585 (WT)96.58 ± 1.23 A 192.66 ± 1.59 A75.25 ± 3.50 A
Zmprx19-180.65 ± 2.70 C59.24 ± 2.21 B8.78 ± 1.04 B
Zmprx19-285.92 ± 1.63 B60.30 ± 2.15 B15.08 ± 1.23 B
Zmprx19-383.35 ± 1.52 BC64.29 ± 1.76 B12.29 ± 1.61 B
1 Mean values in a list without the same capital letter are significantly different at p < 0.01.
Disclaimer/Publisher’s Note: The statements, opinions and data contained in all publications are solely those of the individual author(s) and contributor(s) and not of MDPI and/or the editor(s). MDPI and/or the editor(s) disclaim responsibility for any injury to people or property resulting from any ideas, methods, instructions or products referred to in the content.

