Abstract
Researchers are depending more than ever on remote sensing techniques to monitor and assess the agricultural water status, as well as to estimate crop water usage or crop actual evapotranspiration. In the current work, normal and stressed baselines for irrigated wheat genotypes were developed in an arid part of the Sohag governorate, Egypt, using infrared thermometry in conjunction with weather parameters. The experiment was carried out in a randomized complete block design in the normal and drought stress conditions based on three replicates using ten bread wheat genotypes (G1–G10), including five accessions, under drought stress. A standard Class-A-Pan in the experimental field provided the daily evaporation measurements (mm/day), which was multiplied by a pan factor of 0.8 and 0.4 for normal and stressed conditions, respectively. The relationship between the vapor pressure deficit (VPD) and canopy-air temperature differences (Tc − Ta) was plotted under upper (fully stressed) and lower baseline (normal) equations. Accordingly, the crop water stress indexes (CWSIs) for the stressed and normal baselines for wheat genotypes were developed. Additionally, the intercept (b) and the slope (a) of the lower baseline equation were computed for different genotypes. The results indicate that, before applying irrigation water, the CWSI values were high in both growing seasons and under all irrigation regimes. After that, the CWSI values declined. G10 underwent stress treatment, which produced the greatest CWSI (0.975). Conversely, the G6 condition that received well-watered irrigation yielded the lowest result (−0.007). When compared to a well-watered one, the CWSI values indicated a trend toward rising stress. There existed an inverse link between the CWSI and grain yield (GY); that is, a lower CWSI resulted in better plant water conditions and a higher GY. Under standard conditions, the wheat’s highest GY was recorded in G2, 8.36 Ton/ha and a WCSI of 0.481. In contrast, the CWSI result for the stress treatment was 0.883, indicating a minimum GY of 5.25 Ton/ha. The Water Use Efficiency (WUE) results demonstrated that the stress irrigation regime produced a greater WUE value than the usual one. This study makes a significant contribution by investigating the techniques that would allow CWSI to be used to estimate irrigation requirements, in addition to determining the irrigation time.
1. Introduction
Cereal crops are among the most significant crops in the world and have a great impact on a nation’s ability to feed its citizens [1]. Around the world, wheat (Triticum aestivum L.) is the most significant and extensively adapted food crop [2]. Large-scale wheat farming is possible, and its production provides long-term food storage possibilities. Wheat grows in a variety of farming systems, and a range of agro-climatic parameters, such as temperature, rainfall, day length, soil type, and terrain, as well as biotic and socioeconomic factors, influence production management approaches [3]. However, particularly in arid areas, changes in precipitation patterns brought on by anthropogenic or natural causes are causing crop damage [4,5]. One of the most frequent abiotic stresses on plants in these regions is drought, which causes a 20% reduction in wheat yields globally [6,7]. Also, wheat has a significant role in maintaining the food balance in Egypt; according to FAOSTA [8], it accounts for 20.23, 38.32, 36.76, and 10.9% of all food, calories, protein, and fat in the daily food supply per capita. Egypt produces over 9.7 million tonnes of grain annually, with an average yield of 6.78 tonnes per hectare. Presently, the annual consumption stands at 18.207 million tonnes. [8]. The world consistently needs wheat due to its grain qualities and applications; 20% or more of a person’s daily energy needs come from wheat grains [9,10]. Additionally, whole wheat grains improve essential nutrition by providing proteins, carbohydrates, dietary fiber, minerals, and filaments. Phytochemicals found in whole wheat grains include benzoic acid, anthocyanins, flavonoids, tocopherols, and carotenoids [11,12]. Since 2020, there has been an increase in the price of food globally, and wheat in particular because to the COVID-19 pandemic’s effects on global supply chains [13]. For example, in the first half of 2021, wheat prices averaged USD 280 per metric ton, and by November of the same year, they had reached USD 317 per metric ton. They were as high as around USD 500 per metric ton in February–April 2022 and will keep increasing, causing a 20% decrease in wheat yields globally [14,15]. The country that imports the most wheat worldwide is Egypt. Domestic production can only meet less than half of the country’s consumption; imports must make up the remaining amount [16]. Roughly 12 million tons of wheat were imported in 2018 [13,17]. The average grain yield in Egypt is 6.78 tons per hectare, and the country produces roughly 9.7 million tons of grain overall. In the meantime, 18.207 million tons are consumed annually [8]. Egypt’s population is growing at one of the fastest rates in the world, which is another problem. At the moment, the population is expanding at 1.94% per year, or over 2 million people [18]. Two strategies could be used to boost local wheat output and close this disparity. The first method is vertical expansion, which is the process of producing more wheat per unit area by developing new cultivars with high yielding potential, early maturity, resistance to biotic and abiotic stresses [19], and the use of suggested cultural practices for cultivating these cultivars. The second method involves horizontal extension, or increasing wheat cultivation outside of the Nile Valley into desert areas [20]. Wheat plants in these regions are unfortunately susceptible to drought stress because of the sandy, low-water-holding soil. Such drought stress results in significant losses in the wheat yield, as well as in its constituent parts and quality [21]. Drought-tolerant wheat varieties that consume less water and can tolerate soil water deficits could solve this problem [22]. Therefore, increasing productivity through new varieties appropriate for cultivation on recently reclaimed lands is the solution to the deficit of wheat output. Breeding and selecting new, high-yielding, drought-resistant cultivars look to be the answer.
With the use of modern technology like remote sensing, drought can be identified and monitored early [23]. In today’s competitive environment with limited water resources, efficient agricultural production and quality maximization through the use of indices for water status detection and monitoring is necessary [24]. Water stress indices (WSIs) are therefore crucial for preventing drought and deciding when to schedule irrigation [25,26]. As a result, it may be determined to use water stress indicators for improved water management. The principle behind the Crop Water Stress Index (CWSI) is that when rhizosphere humidity decreases, leaf transpiration and stomatal conductance decrease and the canopy temperature increases respectively. The CWSI application became well-known after Idso [27] presented an empirical technique to measure crop water stress and demonstrated a linear association between Tc − Ta (canopy and air temperature differential) with a vapor pressure deficit (VPD). It was proposed that water management, particularly in semi-arid regions, might benefit from the application of CWSI by measuring the water stress of various wheat genotypes under various irrigation regimes. Based on the above-mentioned information, the current study’s goals were determined to be as follows: (a) creating baselines for irrigated wheat genotypes in an arid climate under no water stressed conditions; (b) computing the CWSI throughout the study period using data from infrared thermometry that was gathered during the growing seasons; and (c) looking into the relationship between the CWSI and both grain yield and water use efficiency.
2. Materials and Methods
2.1. Experimental Layout
The current study was conducted during the winter growing seasons of 2021 and 2022 at the Research Farm of the Faculty of Agriculture, Sohag University (Figure 1). The climatic parameters, which included the highest, lowest, and average temperature, the relative humidity, the number of hours of sunshine, the wind speed, and the amount of rainfall, were acquired (Table 1). Using the ETo_Calculator_V3.1, the reference evapotranspiration (ETo) value was determined [28]. Three repetitions of the experiment were conducted in both normal and drought stress circumstances using a randomized full block design, with a plot size of 10.5 m2 (3 × 3.5 m). On 21 November 2021, for the first season, and 24 November 2022, for the second, the seeds of different genotypes were planted at a rate of 143 kg ha−1 using a drilling machine with an inter- and intra-raw spacing of 20 and 10 cm, respectively. The NPK 100% recommended fertilizer dose was 2380 kg ha−1 of N, 56 kg ha−1 of P2O5, and 60 kg ha−1 of K2O. Three weeks after the date of planting, irrigation treatments were commenced. In the experimental plots, Derby herbicide (17.5% SC) was administered at a rate of 72 mL ha−1 for 25 days in order to control broad-leaved weeds. In contrast, 35 days after planting, 1190 mL ha−1 of Traxoms herbicide (4.5% EC) was applied to control grassy weeds. The remaining weeds were dug up by hand. In the first season, the plants were harvested on 10 April 2021, and in the second season, on 15 April 2022.
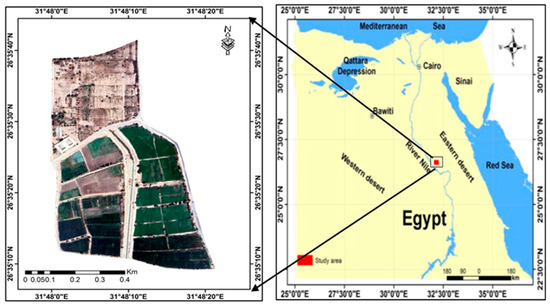
Figure 1.
The location of the experimental site.

Table 1.
Meteorological data and calculated evapotranspiration reference (ETo) during the growing season of 2020/2021 and 2021/2022 (https://weatherspark.com/s/96901/1/Average-Summer-Weather-in-Sohag-Egypt. (Accessed on 28 May 2021 and on 10 May 2022)).
As shown in Table 2, the physical and chemical characteristics of the experimental soil were analyzed in accordance with Klute [29].
Table 2.
Physical and chemical properties of the experimental soil.
2.2. Plant Materials
In the current investigation, ten genotypes of bread wheat were employed (Table S1). The five accessions (NGB8950 (G1), NGB6681 (G2), NGB10893 (G3), NGB6406 (G4), and NGB6404 (G5)) that were introduced from the Nord Genetic Resource Center (NordGen) in 2010 are among these genotypes, as are the five Egyptian genotypes, Sids 14 (G6), Sids 1 (G7), Giza 171 (G8), Gemmiza 11 (G9), and Gemmiza 7 (G10).
2.3. Irrigation Requirement Consumption and Water Supply
Water quantities were added to the experimental plots to bring the top 45 cm soil layer’s moisture content up to the field’s capacity. To guarantee a good, uniform distribution of water throughout the plots, the amount of water applied to each irrigation was equal to the difference between the moisture at the field capacity and the soil moisture content at the irrigation time (for each irrigation treatment) plus 10% of the quantity.
2.4. Time of Irrigation
A standard Class-A-Pan in the experimental field provided the daily evaporation measurements (mm/day), which were then recorded. Daily evaporation was multiplied by the researched evaporation pan coefficient to determine cumulative pan evaporation data for each irrigation treatment, as follows:
- Treatment for no stress: intervals of irrigation based on the pan factor (Ef = 0.8). This means near irrigation intervals (after collecting 53 mm from the evaporation pan);
- Treatment for stress: intervals of irrigation according to the pan factor (Ef = 0.4). This means far irrigation intervals (after collecting 107 mm from the evaporation pan).
The number of days in which the cumulative pan evaporation (CPE) roughly meets the estimated water amount of the treatment under consideration is known as the irrigation interval per treatment. Formula (1) is as follows:
where the cumulative pan evaporation is known as CPE, Ef = empirical pan factor treatments (0.8 and 0.4), stands for available water (mm) in the soils for the effective depth of the root zone, and stands for allowed moisture depletion when a lower limit of 50% is applied. Next, the corresponding for every pan factor (Ef) may be calculated, leading to the determination of the optimal number of days for the irrigation event to be carried out. For treatments of 0.8 and 0.4, the corresponding CPE values are 54 and 107 mm, which correspond to the various measured levels.
2.5. Applied Water
During the irrigation treatments, the irrigation water applied was in accordance with the ETc (Equations (2) and (3).
where represents the reference evapotranspiration measured in mm/day. stands for the evaporation from the pan in mm. is the pan coefficient, which is 0.85 for a Class A evaporation pan. signifies the crop evapotranspiration in mm. is the crop coefficient as per Allen et al. [28].
The irrigation water amount was computed using the subsequent Equation (4).
where the amount of irrigation water is represented by IW in cubic meters. The plot area, denoted as A, is measured in square meters. Ea stands for the application efficiency.
2.6. Water Use Efficiency (WUE)
Water Use Efficiency (WUE), measured in kg m−3 and defined as the efficiency of water utilization, was calculated based on the method outlined by Doorenbos and Pruitt [30]. This calculation is as follows (Equation (5)):
where yield (Ton/ha) and Applied irrigation water (m3).
2.7. Upper and Lower Baselines and CWSI Measurement
The LT Lutron infrared thermometer, Model TM-958 from Taiwan, is a portable, non-contact temperature-measuring device that can measure temperatures ranging from −30 to 300 °C (−22 to 572 degrees Fahrenheit) with a resolution of 0.5 °C or 0.5 degrees Fahrenheit. It is designed with a spectral band filter of 9–14 μm and an air temperature sensor. The emissivity value for the target was set to 0.95. The infrared thermometer was used to measure the canopy temperature before and after each irrigation cycle. To ensure accurate data collection, the thermometer was positioned at a 45-degree angle and placed at a height of 1.5 m above the ground during assessments. Additionally, temperature measurements were taken under clear sky conditions. According to the Idso [27] empirical method, the midday canopy temperature can be used to assess crop water stress. The data in each plot were gathered from all four directions (North, South, East, and West). Additionally, relative humidity and air temperature were concurrently recorded to calculate the vapor pressure deficit (VPD) as per the methodology outlined by Monteith and Unsworth [31]. The vapor pressure deficit (VPD) was calculated using the standard psychrometer Equation (6) proposed by Allen et al., in 2001. Subsequently, the Crop Water Stress Index (CWSI) values were determined empirically using the method outlined by Idso [27]. A comparison of the relationship between the VPD and the temperature difference between the canopy and the air (Tc − Ta) was depicted using upper (fully stressed) and lower (non-stressed) baseline equations. The data collected three days after irrigation in the well-watered treatment were used to evaluate the non-stressed baseline in this graph. The following equation demonstrates the non-stressed baseline, also known as the lower baseline.
where, here, Tc stands for canopy temperature (°C), Ta for air temperature (°C), AVPD for air vapor pressure deficit (mbar), RH for relative humidity (%), and a and b for constant coefficients that vary depending on the crop. The upper baseline also represents the maximum value that can be expected for (Tc − Ta) [27].
CWSI is one of the indices that express the water status of the plant based on (Tc − Ta) and is calculated from the following Formula (7) [27]:
Where the temperature difference between the air and canopy at the moment of measurement (°C) is represented by dTm. For the observed AVPD, dTLL is the difference between the canopy and air temperatures, as determined by the lower baseline equation. For the upper baseline, dTUL is a constant value.
3. Results and Discussion
3.1. Irrigation Requirements (Applied Water)
Wheat plants irrigated in accordance with a 0.8 cumulative pan evaporation had irrigation demands (m3) during the growing seasons of 2021 and 2022 of 6748.90 and 7104.10 (m3 ha−1), respectively. During the 2021 and 2022 growing seasons, the m3 irrigation requirement of wheat plants that were irrigated in line with a 0.4 cumulative pan evaporation was 4639.57 and 4758.52 (m3 ha−1), respectively. The net irrigation need, according to Ibrahim et al. [32], was around 568.29 mm/season, or 5682.9 (m3/ha).
3.2. Wheat Genotypes (CWSI)
The normal and stressed baselines for wheat genotypes were created in order to assess the CWSI. In order to accomplish this, Idso’s [27] instructions were followed. The lower baseline regression equations for each genotype of wheat were derived for the two seasons of 2021 and 2022 individually. Figure 2, Figure 3 and Figure 4 display the relationships between (Tc − Ta) and VPD for wheat genotypes. As the sun rises in the morning, the stomata of the crop canopy open for the majority of crops, including wheat. Potential evapotranspiration does not predominate until the stomata reach a critical degree of openness, and radiant and convective heat exchange predominate in the canopy’s energy balance [33]. The canopy temperature (Tc) steadily rises in relation to the air temperature (Ta) until the critical degree of stomata openness for potential evapotranspiration has been reached, or around midday. Subsequently, a linear association is established between (Tc − Ta) and VPD (kPa), which continues until the stomata closer commences in the late afternoon when solar radiation decreases. The potential evapotranspiration state is characterized by this linear relationship between (Tc − Ta) and VPD.
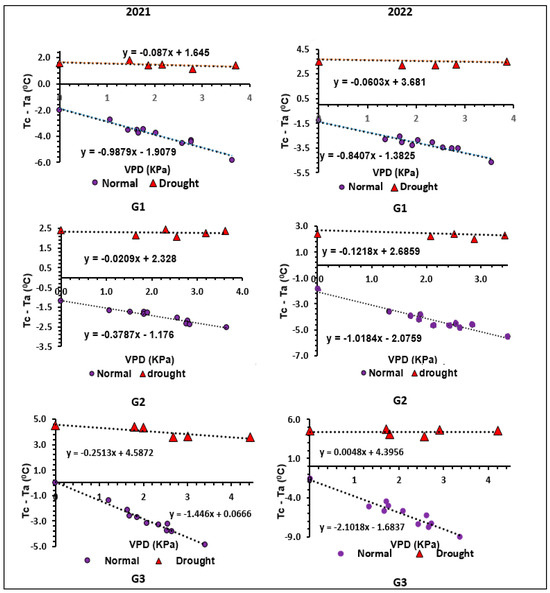
Figure 2.
Upper and lower baseline regression equations of (G1, G2, and G3) wheat genotypes under normal and drought stress in 2021 and 2022.
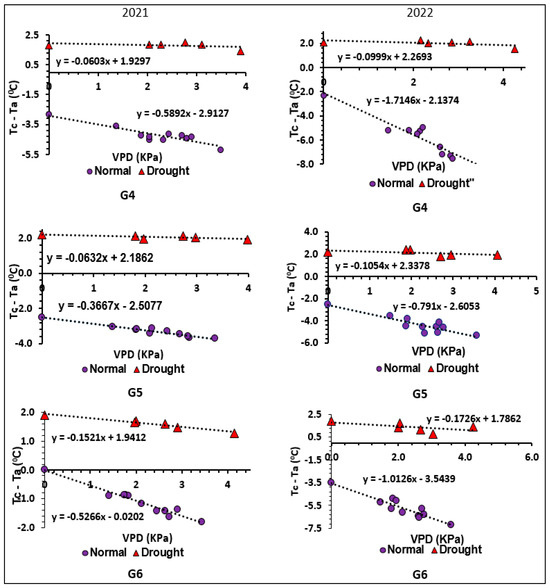
Figure 3.
Upper and lower baseline regression equations of (G4, G5, and G6) wheat genotypes under normal and drought stress in 2021 and 2022.
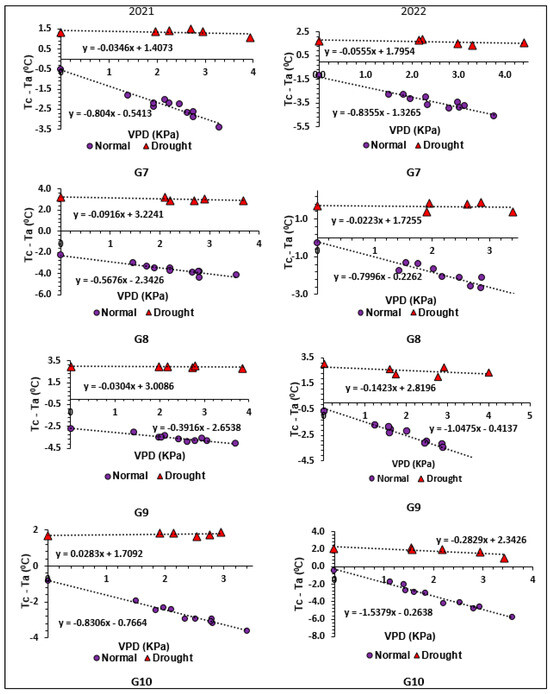
Figure 4.
Upper and lower baseline regression equations of (G7, G8, G9, and G10) wheat genotypes under normal and drought stress in 2021 and 2022.
3.3. Upper and Lower Baseline Evaluation
Due to further restrictions on water availability, the distance between the upper and lower baselines increased in all wheat cultivars with each VPD increment. Practically speaking, the lower baseline’s Tc − Ta is crucial for determining the CWSI. For the seasons 2021 and 2022, respectively, the slope (a) of the lower baseline equation varied from −1.446 to −0.366 and from −2.102 to −0.791. For the seasons 2021 and 2022, respectively, the intercept (b) fluctuated between −2.508 and 0.067 and from −3.544 to −0.226 (Table 3). The genotypes with larger (a) values appeared to be more sensitive to VPD increments. Similarly, the types that are most vulnerable to water stress have the most difference between the completely stressed upper baseline and the non-stressed lower baseline. As a result, the Tc − Ta differential in the canopy temperature between the very sensitive and less sensitive cultivars to water stress is increased. In their study, Orta et al. [34] proposed, in line with our findings, that Tc − Ta measured above a plant canopy was inversely correlated with the atmospheric VPD. Numerous researchers evaluating the lower and upper baselines for the CWSI computation in various crops have been published. According to Sneha et al. [35] the lower baseline equation’s a and b values in mahogany (Swietenia macrophylla King) were −0.25 and −2.9, respectively. In addition, Emekli et al. [36] determined, in a related study, that at a 40 °C air temperature, the upper limit for bermudagrass (Cynodon dactylon) was 8.5 °C. The lower baseline’s slope, which was similar to our data, was determined by Gontia and Tiwari [33] for winter wheat in India. Similarly, Irandoust and Bijanzadeh [37] reported a slope value of −1.0 and an intercept of 0.72 for wheat in the southern region of Iran. In general, variables, such as the crop variety, plant density, crop color quality, volume of water consumed, and amount of rainfall during the reproductive stages, may be associated with variances in the lower and upper baseline equations [38,39].
Table 3.
The lower baseline regression equations of studied wheat genotypes under drought stress in 2020/2021 and 2021/2022.
Irandoust and Bijanzadeh [37] compared the upper limit values of three triticale cultivars’ canopy and air temperature difference (Tc − Ta) ul, as well as the slopes (a) and intercepts (b) for the lower limit [(Tc − Ta)ll = a VPD + b]. They came to the conclusion that greater water limitations and rising VPD were the main causes of the substantial increases in variables and b of the lower baseline equation between Tc − Ta and VPD in all cultivars. Furthermore, Bijanzadeh and Emam [40] demonstrated that the lower baseline equation for the wheat crop was (Tc − Ta)ll = −1.0001 (VPD) + 1.8934 from flowering to maturity and that the a and b parameters in the ensuing equation were similar to the ET-84-5 parameter (Figure 2). However, the value of b in this equation was smaller than that for the ET-83-3 and Sanabad cultivars of our study. In contrast, the value of an in these cultivars was very close to that reported by Alderfarsi and Nielsen [41] for winter wheat in Colorado [(Tc − Ta)ll = −1.35VPD+0.41]. This could be explained by the fact that, in comparison to Colorado, the temperature at our experimental site, ET-83-3, was higher from April to June. Overall, a number of studies have shown that the cultivar type and environmental factors may affect the baseline equation, resulting in variations in the slopes (a) and intercepts (b) [42].
3.4. CWSI before and after Supplying Irrigation Water
The mean seasonal CWSI values before and after each irrigation for each cultivar under various irrigation regimes were determined based on the climate data for both seasons (Table 4 and Figure 5 and Figure 6). The CWSI values were high prior to irrigation and decreased following the supply of irrigation water in both growing seasons and under all irrigation regimes. Compared to a well-watered one, the CWSI values indicated an increasing tendency in the stress treatment. Furthermore, distinct cultivars have varying CWSI values. Prior to providing irrigation water, G10 underwent stress treatment, which produced the greatest CWSI (0.975). Conversely, the G6 condition that received well-watered irrigation yielded the lowest result (−0.007). Much research has been conducted to assess the use of CWSI in irrigation scheduling for various plants, including turfgrass (Cynodon dactylon L.) and tall fescue (Festuca arundinacea Schreb.); [42,43]. Moreover, Jalali Farahani et al. [44] came to the conclusion that the applied irrigation level affected the variations in CWSI values. Tall fescue (Festuca arundinacea Schreb.) Tc − Ta rose with a reduction in the soil water content, according to Al-Faraj et al. [13]. They recommended that turfgrass irrigation timing be adjusted using the CWSI. The low canopy temperature in wheat could be used as an index to assess the physiological capacities of wheat under drought stress and as a helpful marker in wheat breeding for drought tolerance, according to Baili, and Changfa [45]. A low canopy temperature in wheat could also maintain superiority over cultivars with a high canopy temperature.
Table 4.
Mean seasonal CWSI values of wheat genotype under different irrigation regimes in 2020/2021 and 2021/2022 growing seasons.
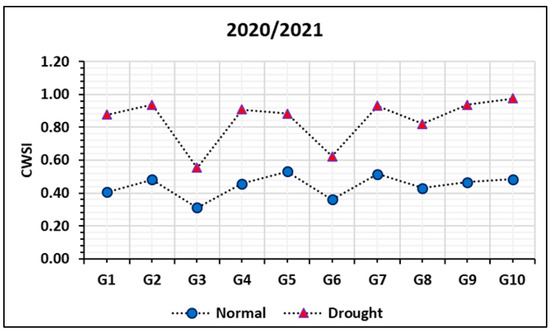
Figure 5.
Average of the CWSI of studied genotypes under normal and drought stress in 2020/2021.
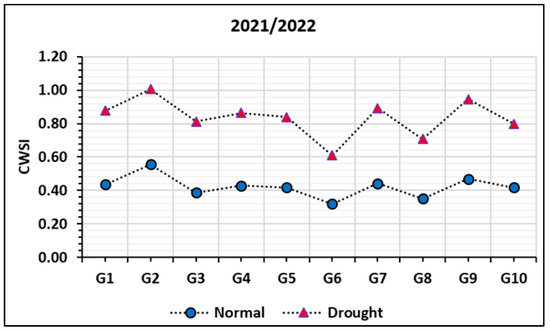
Figure 6.
Average of the CWSI of studied genotypes under normal and drought stress in 2021/2022.
3.5. Monthly Variations in CWSI
High levels of variance in the monthly CWSI were noted in all cultivars and cutting off irrigation regimes from January to April. These variations increased as the drought stress from cutting off irrigation progressed. According to Garrot et al. [46], the mean CWSI of durum wheat (CV. Aldura) varied from 0.11 in well-watered conditions to 0.82 under extreme drought stress. According to Gontia and Tiwari [33], irrigation was shown to be responsible for the greatest CWSI of 0.52, 0.58, 0.68, and 0.89, corresponding to a 100, 60, 40, and 20% of field capacity, respectively. Due to a rise in the Tc − Ta difference and greater VPD levels, the CWSI progressively rose in both treatments as Tc increased. Tc − Ta differential enhancement results from crop transpiration restriction and VPD increases when available water content is limited under stress [36,39,47,48]. The highest monthly mean values of the CWSI were recorded in the current study’s two experimental seasons as the air warmed from February to March and April, enhancing the Tc − Ta disparity (Figure 7 and Figure 8).
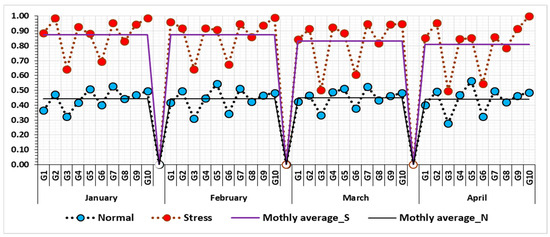
Figure 7.
Monthly CWSI for 10 genotypes before irrigations across the 2020/2021 growth season.
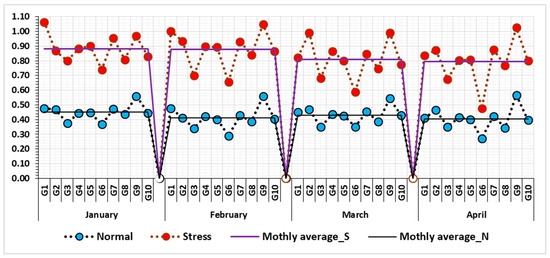
Figure 8.
Monthly CWSI for 10 genotypes before irrigations across the 2021/2022 growth season.
In a related study, Alghory and Yazar [38] found that when wheat was irrigated during flowering, the amount of CWSI increased from flowering to the seed maturity stage. This increase may have been caused by the canopy temperature rising in the late season and the irrigation being stopped at flowering, which led to leaf drying and encouraged plant senescing. According to Fattahi et al. [49], the upper baseline equation was 2.3 °C, while the lower baseline equation’s a and b for irrigation based on 75% total available water (TAW) were −1.41 and −1.7 for corn, respectively. They came to the conclusion that 75% TAW should be used for irrigation scheduling in maize fields. According to [50], the CWSI in Indian mustard (Brassica juncea) under severe water stress (50 percent SMD) remained above 0.3 for most of the growing season and reached 0.9 at the maturity stage. According to Heydari et al. [51], irrigation in semi-arid locations based on 75% FC in canola (Brassica napus L.) is a viable approach for canola, with CWSI amounts ranging from 0.198 to 0.294. This is in relation to the yield output and RWC. As was indicated in the aforementioned earlier studies, the crop performed better when the CWSI quantity was closer to zero. As a result, in relation to the water deficit during the reproductive stage of wheat in the study area, the normal stress (0.8 EP) could be an appropriate irrigation regime, with a mean CWSI amount in the range of 0.35–0.45. This is in contrast to the severe and most severe water stress, which varied from 0.65 to 1.00, depending on the genotypes of the wheat.
3.6. CWSI and Grain Yield (GY)
Compared to the stress treatment, the well-watered treatment produced more seeds during both growing seasons. Figure 9 and Figure 10 show the GY link between the genotype of wheat and the CWSI. These figures show that the relationship between GY and the CWSI is inverse, meaning that a lower CWSI corresponds to better plant water conditions and a higher GY. As a result, the CWSI can be used to estimate GY in water-stressed conditions [52]. The two experiment seasons of the current investigation had the highest monthly mean values of CWSI when the air warmed from February to March and April, increasing the Tc − Ta gap (Figure 7 and Figure 8). Under standard conditions, the wheat’s highest GY was recorded in G2, yielding 8.36 Ton/ha and a WCSI score of 0.481. Under the same excrement conditions, this figure is advised for the wheat irrigation schedule. In contrast, the water stress index result for the stress treatment was 0.883, indicating a minimum GY of 5.25 Ton/ha. The crop’s lower GY value is a result of the plant experiencing a higher level of water stress. Grain yield in all cultivars dropped precipitously when water application was reduced and the CWSI was raised. According to Garrot et al. [46], grain yields of up to 606 g/m2 were greatest at CWSI levels of 0.3 to 0.37. These findings demonstrated the usefulness of the CWSI as a crop water status indicator, and numerous researchers proposed using CWSI to assess the crop water status, enhance irrigation scheduling, and achieve the best grain yield possible—particularly in situations where there is a water scarcity. Bijanzadeh and Emam [40]; Gardner et al. [53], Alderfarsi and Nielsen [41], Emekli et al. [36], and Irandoust and Bijanzadeh [37] determined that the grain yield was associated by the polynomial equation with mean seasonal CWSI values Y = 107.61 (CWSI) − 580.22 (CWSI) + 580.39. The seasonal mean CWSI and grain yield had a negative correlation (R2 = 0.79). This formula could be applied to triticale yield prediction under various CWSI values. In order to develop strategies and make decisions for irrigation scheduling under conditions of water scarcity, researchers and farmers relied heavily on the prediction of grain yield to crop water stress [40,52,54].
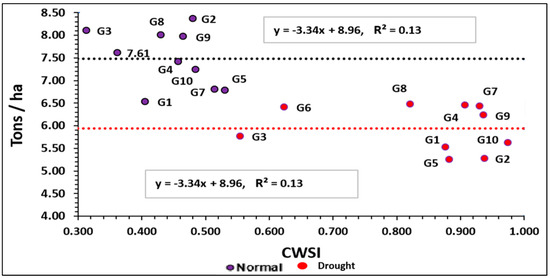
Figure 9.
Crop water stress index (CWSI) and grain yield before irrigations under normal and stress in 2020/2021.
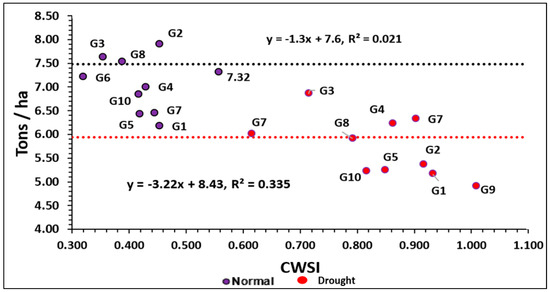
Figure 10.
Crop water stress index (CWSI) and grain yield before irrigations under normal and stress in 2021/2022.
3.7. CWSI and WUE
The WUE results for each irrigation regime and wheat cultivars demonstrated that the stress irrigation regime produced a greater WUE value than the typical one (Figure 11 and Figure 12). This might be the result of consuming more water during normal treatment as opposed to water stress treatment. Interestingly, in 2021, the normal treatment of G1 showed the lowest WUE value of 0.97 and the maximum WUE of 1.39 kg m−3. In their study, [38] evaluated CWSI and midday flag leaf water potential in wheat under the three different supplemental and conventional irrigation strategies using sprinkler irrigation. They concluded that 75% of the conventional irrigation (CI75) level had the greatest water use efficiency of 1.20 kg m− 3, and 25% of the supplemental irrigation during flowering (SIF25) resulted in the lowest WUE. Our findings are consistent with several studies that propose that deficit irrigation and water stress, particularly during the reproductive growth stages, may considerably raise the WUE [37]. According to Kumar [50], Indian mustard produced 900 kg ha−1 of seed production when grown in a well-watered condition, yet only used 260 mm of irrigation water. On the other hand, an irrigation regime that corresponded to 30% soil moisture depletion (SMD) increased the seed yield by 850 kg ha−1, used only 200 mm of irrigation water, and had the highest WUE. The current study found that the best irrigation treatment to achieve an acceptable seed yield and water consumption was one with a mild water stress (75%FC) WUE greater than that of a well-watered treatment (100% FC). Put differently, minor water stress treatment (i.e., 25% water savings) yielded higher seed production in relation to the WUE than well-watered circumstances. It yielded seeds, but used 260 mm of irrigation water
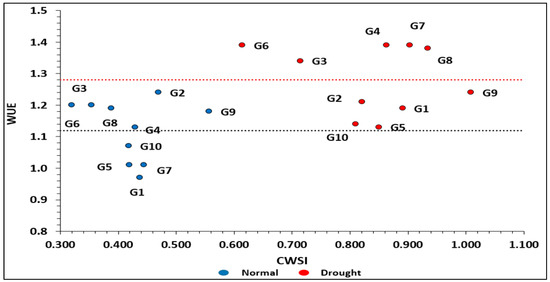
Figure 11.
Water use efficiency (WUE) and CWSI in the growing season of 2020/2021 for 10 bread wheat genotypes.
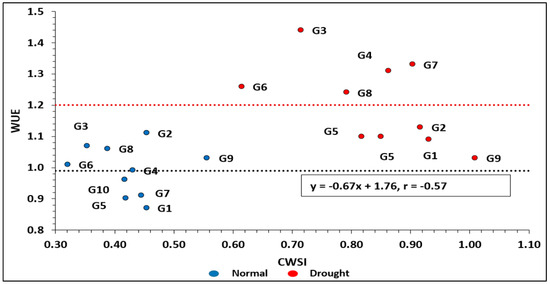
Figure 12.
Water use efficiency (WUE) and CWSI in the growing season of 2021/2022 for 10 bread wheat genotypes.
4. Conclusions
To establish a relationship among CWSI values, the amount of irrigation used, and the wheat yield, a field experiment was conducted during the winter growing seasons of 2021 and 2022 at the Research Farm of the Faculty of Agriculture, Sohag University. The CWSI method has a number of significant benefits for measuring plant stress in between irrigations. The technique is responsive to water stress and does not harm or disturb the crop. The method can also be used to forecast the yield and schedule irrigations. The lower baseline regression equations for each genotype of wheat were derived for the two seasons of 2021 and 2022 individually. The slope (a) of the lower baseline equation varied from −1.446 to −0.366 and from −2.102 to −0.791. For the seasons 2021 and 2022, respectively, the intercept (b) fluctuated between −2.508 and 0.067 and from −3.544 to −0.226. The genotypes with larger (a) values appeared to be more sensitive to VPD increments. Similarly, the types that are most vulnerable to water stress have the most difference between the completely stressed upper baseline and the non-stressed lower baseline. As a result, the Tc − Ta differential in the canopy temperature between the very sensitive and less sensitive cultivars to water stress is increased. The crop’s lower GY value is a result of the plant experiencing a higher level of water stress. The WUE results for each irrigation regime and wheat genotypes demonstrated that the stress irrigation regime produced a greater WUE value than the usual one. The investigation of techniques that would allow for the use of the CWSI for both timing and the requirement estimation of irrigation was a significant contribution of this study. Furthermore, we propose that establishing the CWSI for irrigation scheduling would be more appropriate if it were monitored daily.
Supplementary Materials
The following supporting information can be downloaded at: https://www.mdpi.com/article/10.3390/agronomy14081814/s1, Table S1: The pedigree and sources of studied bread wheat genotypes.
Author Contributions
Conceptualization, N.E.M., A.-r.A.M., I.M.A.B., A.s.A. and M.S.S.; Methodology, N.E.M., A.-r.A.M., I.M.A.B. and A.s.A.; Software, A.s.A.; Validation A.s.A.; Formal analysis, A.s.A. and E.A.A.; Investigation, A.s.A. and M.S.S.; Resources, A.s.A.; Data curation, N.E.M., I.M.A.B., E.A.A. and M.S.S.; Writing—original draft, N.E.M., A.-r.A.M., I.M.A.B., E.A.A., E.S.M., N.Y.R. and M.S.S.; Writing—review and editing, N.E.M., A.-r.A.M., E.S.M.; Supervision, E.S.M. and N.Y.R.; Project administration, N.Y.R. All authors have read and agreed to the published version of the manuscript.
Funding
This research received no external funding.
Data Availability Statement
The data presented in this study are available in the manuscript.
Acknowledgments
This paper was supported by the RUDN University Strategic Academic Leadership Program.
Conflicts of Interest
The authors declare no conflicts of interest.
References
- Temirbekova, S.K.; Kulikov, I.M.; Afanasyeva, Y.V.; Ashirbekov, M.Z.; Beloshapkina, O.O.; Kalashnikova, E.A.; Sardarova, I.; Begeulov, M.S.; Kucher, D.E.; Ionova, N.E.; et al. The Biological Traumatization of Crops Due to the Enzyme Stage of Enzyme-Mycotic Seed Depletion. Pathogens 2022, 11, 376. [Google Scholar] [CrossRef]
- Giura, A.; Saulescu, N. Chromosomal location of genes controlling grain size in a large grained selection of wheat (Triticum aestivum L.). Euphytica 1996, 89, 77–80. [Google Scholar] [CrossRef]
- Khedr, R.A.; Sorour, S.G.R.; Aboukhadrah, S.H.; El Shafey, N.M.; Abd Elsalam, H.E.; El-Sharnouby, M.E.; El-Tahan, A.M. Alleviation of salinity stress effects on agro-physiological traits of wheat by auxin, glycine betaine, and soil additives. Saudi J. Biol. Sci. 2022, 29, 534–540. [Google Scholar] [CrossRef]
- Ning, D.; Zhang, Y.; Li, X.; Qin, A.; Huang, C.; Fu, Y.; Gao, Y.; Duan, A.J.P. The effects of foliar supplementation of silicon on physiological and biochemical responses of winter wheat to drought stress during different growth stages. Plants 2023, 12, 2386. [Google Scholar] [CrossRef]
- Pang, Z.; Tayyab, M.; Islam, W.; Tarin, M.; Sarfaraz, R.; Naveed, H.; Zaman, S.; Zhang, B.; Yuan, Z.; Zhang, H. Silicon mediated improvement in tolerance of economically important crops under drought stress. Appl. Ecol. Environ. Res. 2019, 17, 6151–6170. [Google Scholar] [CrossRef]
- Snehalatha, D.; Bharghavi, J.; Rao, P.R.; Srikanth, B.; Kumar, C.; Ramesh, T.; Change, C. Silicon Improved Water Stress Tolerance in Rice Genotypes. Int. J. Environ. Clim. Change 2023, 13, 2056–2068. [Google Scholar] [CrossRef]
- Sousa, L.; Brito, A.; Souza, L.; Teixeira, K.; Nascimento, V.; Albuquerque, G.; Oliveira, C.; Okumura, R.; Nogueira, G.; Freitas, J. Does silicon attenuate PEG 6000-induced water deficit in germination and growth initial the seedlings corn. Braz. J. Biol. 2023, 83, e265991. [Google Scholar] [CrossRef]
- FAOSTAT. Food. In Crops and Livestock Products; Agriculture Organization of the United Nations: Rome, Italy, 2022. [Google Scholar]
- Reynolds, M.P. Climate Change and Crop Production; Cabi: Oxon, UK, 2010. [Google Scholar]
- Guo, L.; Ma, L.; Jiang, H.; Zeng, D.; Hu, J.; Wu, L.; Gao, Z.; Zhang, G.; Qian, Q.J. Genetic analysis and fine mapping of two genes for grain shape and weight in rice. J. Integr. Plant Biol. 2009, 51, 45–51. [Google Scholar] [CrossRef] [PubMed]
- Gorinstein, S.; Lojek, A.; Číž, M.; Pawelzik, E.; Delgado-Licon, E.; Medina, O.J.; Moreno, M.; Salas, I.A.; Goshev, I. Comparison of composition and antioxidant capacity of some cereals and pseudocereals. Int. J. Food Sci. Technol. 2008, 43, 629–637. [Google Scholar] [CrossRef]
- Tsao, R. Carotenoid, tocopherol, lignan, flavonoid, and phytosterol compositions of wheat grain and its fractions. Wheat Antioxid. 2007, 4, 42–53. [Google Scholar]
- Abdalla, A.; Stellmacher, T.; Becker, M. Trends and prospects of change in wheat self-sufficiency in Egypt. Agriculture 2022, 13, 7. [Google Scholar] [CrossRef]
- McGill, J.; Prikhodko, D.; Sterk, B.; Talks, P. Egypt: Wheat Sector Review; FAO: Rome, Italy, 2015. [Google Scholar]
- Salevurakis, J.W.; Abdel-Haleim, S.M. Bread subsidies in Egypt: Choosing social stability or fiscal responsibility. Rev. Radic. Political Econ. 2008, 40, 35–49. [Google Scholar] [CrossRef]
- Tellioglu, I.; Konandreas, P. Agricultural Policies, Trade and Sustainable Development in Egypt; FAO: Rome, Italy, 2017. [Google Scholar]
- Mohamed, N.E.; Bedawy, I.M.; Hefny, Y.A. Diallel Analysis for Area, Chlorophyll and Temperature of Flag Leaf in Bread Wheat under Well Watered and Drought Stress Conditions. J. Agric. Sci. 2021, 13, 10. [Google Scholar] [CrossRef]
- Shalaby, M.; Al-Zahrani, K.; Baig, M.; Straquadine, G.; Aldosari, F.; Sciences, P. Threats and challenges to sustainable agriculture and rural development in Egypt: Implications for agricultural extension. J. Anim. Plant Sci. 2011, 21, 581–588. [Google Scholar]
- Temirbekova, S.K.; Kulikov, I.M.; Ashirbekov, M.Z.; Afanasyeva, Y.V.; Beloshapkina, O.O.; Tyryshkin, L.G.; Zuev, E.V.; Kirakosyan, R.N.; Glinushkin, A.P.; Potapova, E.S.; et al. Evaluation of Wheat Resistance to Snow Mold Caused by Microdochium nivale (Fr) Samuels and I.C. Hallett under Abiotic Stress Influence in the Central Non-Black Earth Region of Russia. Plants 2022, 11, 699. [Google Scholar] [CrossRef]
- Raghib Bakheit Alwafy, B.; Ali, M.; Abdel-Moneim El-Morsidy, M. Assessment of Bread Wheat Genotypes Under Normal Irrigation and Water Stress. Assiut J. Agric. Sci. 2020, 51, 42–65. [Google Scholar]
- Mirbahar, A.A.; Markhand, G.; Mahar, A.; Abro, S.A.; Kanhar, N.A. Effect of water stress on yield and yield components of wheat (Triticum aestivum L.) varieties. Pak. J. Bot. 2009, 41, 1303–1310. [Google Scholar]
- Clarke, J.M.; DePauw, R.M.; Townley-Smith, T.F. Evaluation of methods for quantification of drought tolerance in wheat. Crop Sci. 1992, 32, 723–728. [Google Scholar] [CrossRef]
- Nash, M.S.; Wickham, J.; Christensen, J.; Wade, T. Changes in landscape greenness and climatic factors over 25 years (1989–2013) in the USA. Remote Sens. 2017, 9, 295. [Google Scholar] [CrossRef] [PubMed]
- Rud, R.; Cohen, Y.; Alchanatis, V.; Levi, A.; Brikman, R.; Shenderey, C.; Heuer, B.; Markovitch, T.; Dar, Z.; Rosen, C. Crop water stress index derived from multi-year ground and aerial thermal images as an indicator of potato water status. Precis. Agric. 2014, 15, 273–289. [Google Scholar] [CrossRef]
- Kaçar, M. Investigation of Cotton Water Stress Index Variations under Different Water and Fertilizer Systems. 2007.Ç.Ü Fen Bilimleri Enstitüsü Yıl:2008 Cilt:19-2 in Turkish. Available online: https://fbe.cu.edu.tr/storage/fbeyedek/makaleler/200819-2-4.pdf (accessed on 14 August 2024).
- Sharda, V.; Srivastava, P.; Kalin, L.; Ingram, K.; Chelliah, M. Development of community Water Deficit Index: Drought-forecasting tool for small-to mid-size communities of the Southeastern United States. J. Hydrol. Eng. 2013, 18, 846–858. [Google Scholar] [CrossRef]
- Idso, S.; Jackson, R.; Pinter, P., Jr.; Reginato, R.; Hatfield, J. Normalizing the stress-degree-day parameter for environmental variability. Agric. Meteorol. 1981, 24, 45–55. [Google Scholar] [CrossRef]
- Allen, R.G.; Smith, M.; Pereira, L.S.; Raes, D.; Wright, J. Revised FAO procedures for calculating evapotranspiration: Irrigation and drainage paper no. 56 with testing in Idaho. In Watershed Management and Operations Management 2000; FAO: Rome, Italy, 2000; pp. 1–10. [Google Scholar]
- Klute, A. Methods of Soil Analysis: Chemical and Microbiological Properties; Wiley: New York, NY, USA, 1986. [Google Scholar]
- Doorenbos, J.; Pruitt, W. Crop water requirement: Food and agriculture organization of the United Nations. FAO Irrig. Drain. Pap. 1977, 24, 144. [Google Scholar]
- Monteith, J.; Unsworth, M.H. Principles of Environmental Physics, 2nd ed.; Butterworth-Heinemann, Elsevier: Oxford, UK, 1990. [Google Scholar]
- Ibrahim, M.M.; Abd El Fattah, N.G.; El-Mageed, A. Net Irrigation Water Requirements for Wheat in Egypt Under Climate Change Conditions. J. Soil Sci. Agric. Eng. 2020, 11, 385–393. [Google Scholar]
- Gontia, N.; Tiwari, K. Development of crop water stress index of wheat crop for scheduling irrigation using infrared thermometry. Agric. Water Manag. 2008, 95, 1144–1152. [Google Scholar] [CrossRef]
- Orta, A.H.; Erdem, T.; Erdem, Y. Determination of Water Stress Index in Sunflower/Determinación Del Indice De Estrés Hídrico Para Girasol/Détermination De L’index Du Stress Dû Au Manque D’humidité Pour Le Tournesol. Helia 2002, 25, 27–38. [Google Scholar] [CrossRef]
- Sneha, C.; Santhoshkumar, A.; Sunil, K. Quantifying water stress using crop water stress index in mahogany (Swietenia macrophylla King) seedlings. Curr. Sci. 2013, 104, 348–351. [Google Scholar]
- Emekli, Y.; Bastug, R.; Buyuktas, D.; Emekli, N.Y. Evaluation of a crop water stress index for irrigation scheduling of bermudagrass. Agric. Water Manag. 2007, 90, 205–212. [Google Scholar] [CrossRef]
- Irandoust, T.; Bijanzadeh, E. Effect of two irrigation regimes on crop water stress index and yield and yield components of Triticale (X Triticosecale wittmack) Cultivars. J. Plant Process Funct. 2018, 6, 15–22. [Google Scholar]
- Alghory, A.; Yazar, A. Evaluation of crop water stress index and leaf water potential for deficit irrigation management of sprinkler-irrigated wheat. Irrig. Sci. 2019, 37, 61–77. [Google Scholar]
- Bijanzadeh, E.; Barati, V.; Emam, Y.; Pessarakli, M. Assessment of the crop water stress index and color quality of bur clover (Medicago polymorpha L.) under different irrigation regimes. Commun. Soil Sci. Plant Anal. 2019, 50, 2825–2835. [Google Scholar] [CrossRef]
- Bijanzadeh, E.; Emam, Y. Evaluation of crop water stress index, canopy temperature and grain yield of five Iranian wheat cultivars under late season drought stress. J. Plant Physiol. Breed. 2012, 2, 23–33. [Google Scholar]
- Alderfasi, A.A.; Nielsen, D.C. Use of crop water stress index for monitoring water status and scheduling irrigation in wheat. Agric. Water Manag. 2001, 47, 69–75. [Google Scholar] [CrossRef]
- Bijanzadeh, E.; Naderi, R.; Emam, Y. Determination of crop water stress index for irrigation scheduling of turfgrass (Cynodon dactylon L. Pers.) under drought conditions. J. Plant Physiol. Breed. 2013, 3, 13–22. [Google Scholar]
- Al-Faraj, A.; Meyer, G.E.; Horst, G.L. A crop water stress index for tall fescue (Festuca arundinacea Schreb.) irrigation decision-making—A traditional method. Comput. Electron. Agric. 2001, 31, 107–124. [Google Scholar] [CrossRef]
- Jalali-Farahani, H.; Slack, D.C.; Kopec, D.M.; Matthias, A.D. Crop water stress index models for Bermudagrass turf: A comparison. Agron. J. 1993, 85, 1210–1217. [Google Scholar] [CrossRef]
- Baili, F.; Changfa, W.; Fang, M.; Songwu, Z.; Yongjie, H. Leaf gas exchange character of low canopy temperature wheat in drought conditions. J. Triticeae Crops 2001, 21, 48–51. [Google Scholar]
- Garrot, D.J., Jr.; Ottman, M.J.; Fangmeier, D.; Husman, S.H. Quantifying wheat water stress with the crop water stress index to schedule irrigations. Agron. J. 1994, 86, 195–199. [Google Scholar] [CrossRef]
- Kumar, N.; Poddar, A.; Shankar, V.; Ojha, C.S.P.; Adeloye, A. Crop water stress index for scheduling irrigation of Indian mustard (Brassica juncea) based on water use efficiency considerations. J. Agron. Crop Sci. 2020, 206, 148–159. [Google Scholar] [CrossRef]
- Bijanzadeh, E.; Moosavi, S.M.; Bahadori, F. Quantifying water stress of safflower (Carthamus tinctorius L.) cultivars by crop water stress index under different irrigation regimes. Heliyon 2022, 8, e09010. [Google Scholar] [CrossRef]
- Fattahi, K.; Babazadeh, H.; Najafi, P.; Sedghi, H. Scheduling maize irrigation based on Crop Water Stress Index (CWSI). Appl. Ecol. Environ. Res. 2018, 16, 7535–7549. [Google Scholar] [CrossRef]
- Kumar, V.; Sharma, A.; Kaur, P.; Kumar, R.; Keshavarzi, A.; Bhardwaj, R.; Thukral, A.K. Assessment of soil properties from catchment areas of Ravi and Beas rivers: A review. Geol. Ecol. Landsc. 2019, 3, 149–157. [Google Scholar] [CrossRef]
- Heydari, A.; Bijanzadeh, E.; Naderi, R.; Emam, Y. Quantifying water stress in canola (Brassica napus L.) using crop water stress index. Iran Agric. Res. 2019, 38, 1–8. [Google Scholar]
- Ahmadi, H.; Nasrolahi, A.H.; Sharifipour, M.; Isvand, H. Determination of soybean water stress index (CWSI) for irrigation management for maximum yield and water productivity. Irrig. Water Eng. 2018, 8, 121–131. [Google Scholar]
- Gardner, B.; Nielsen, D.; Shock, C. Infrared thermometry and the crop water stress index. II. Sampling procedures and interpretation. J. Prod. Agric. 1992, 5, 466–475. [Google Scholar] [CrossRef]
- Orta, A.H.; Başer, İ.; Şehirali, S.; Erdem, T.; Erdem, Y. Use of infrared thermometry for developing baseline equations and scheduling irrigation in wheat. Cereal Res. Commun. 2004, 32, 363–370. [Google Scholar] [CrossRef]


Disclaimer/Publisher’s Note: The statements, opinions and data contained in all publications are solely those of the individual author(s) and contributor(s) and not of MDPI and/or the editor(s). MDPI and/or the editor(s) disclaim responsibility for any injury to people or property resulting from any ideas, methods, instructions or products referred to in the content. |
© 2024 by the authors. Licensee MDPI, Basel, Switzerland. This article is an open access article distributed under the terms and conditions of the Creative Commons Attribution (CC BY) license (https://creativecommons.org/licenses/by/4.0/).