Article

Research on Acoustic Signal Identification Mechanism and Denoising Methods of Combine Harvesting Loss

School of Agricultural Equipment Engineering, Jiangsu University, Zhenjiang 212013, China
*
Author to whom correspondence should be addressed.
Agronomy 2024, 14(8), 1816; https://doi.org/10.3390/agronomy14081816 (registering DOI)
Submission received: 24 July 2024 / Revised: 9 August 2024 / Accepted: 15 August 2024 / Published: 17 August 2024
(This article belongs to the Special Issue Application of Internet of Things in Agroecosystems)

Abstract

:
Sensors are very import parts of the IoT (Internet of Things). To detect the cleaning loss of combine harvesters during operation, a new detection method based on acoustic signal was proposed. The simulation models of the impact among grain, stem and plate were established by using the ALE algorithm, and the vibration excitation characteristics of the grain and stem were investigated; the results showed that both grain and stem signal were generated by surface vibration’s excitation of the air, and the highest amplitudes of grain and stem signal were 15 kHz and 7 kHz respectively, which made it possible to distinguish grain and stem impact acoustic signals. Therefore, this paper proposed a novel method to separate the grain and stem signals by identifying the characteristic frequency area and subsequently an improved EMD denoising method based on an autocorrelation function was proposed. The critical stratum of EMD was identified based on the autocorrelation value of the eigenmode function, and the improved de-noising method was able to effectively remove the noise and the stem signal. To verify the feasibility of the improved denoising method, a field wheat harvesting experiment was conducted to acquire the actual acoustic signal of the cleaning operation. Data processing results showed that the average error of the comparison between the detected loss amount and the actual loss amount was 6.1%. This paper presents a novel approach for researching combine harvester cleaning loss detection and denoising methods.

1. Introduction

China is a country with enormous food production and consumption, and it is estimated that the annual amount of total food waste in China reaches approximately 120 million tons, while the share of harvest loss is second only to that of storage loss [1,2]. Grain losses are inevitably generated by combine harvesters during operation. Among them, 80% of the loss is caused by the grains being excluded along with the stems through the discharge opening during the cleaning process [3], which is called the cleaning loss, and the cleaning loss of a harvester is an important index to measure harvester operation performance [4]. Various regional organizations have set standards for the quality of combine operations. The Ministry of Agriculture of China stipulates that the operating loss rate of full-feed combine harvesters should not exceed 35%, and that of semi-feed combine harvesters should not exceed 25%; meanwhile, machinery industry standards in China state that the total loss rate of self-propelled combine harvesters should be less than 12% and 3% for wheat and rice harvesting, respectively. In fact, the rate of cleaning loss during harvesting is often affected by factors such as the forward speed of the combine, the cutting width, the stubble height, and the moisture content of the stems and the grains. Designing novel cleaning loss monitoring devices in China is of particular significance for both grain loss reduction and agricultural informatization [5,6].
At present, many advanced combines in Europe and the US have been fitted with cleaning loss sensors and have become indispensable accessories for combines, such as Case’s Case2366IH combine harvester, John Deere’s JD9660STS harvester and Class’s Lexion 760 harvester [4]. However, in China, cleaning loss sensors are still in the experimental research stage, and have not been well promoted and applied in actual products. The cleaning loss sensors developed could be categorized into three kinds according to the signal generation principle: electric signal, microwave sensors, and machine vision sensors. Among them, the electrical signal sensors included piezoelectric, photoelectric sensors, and acoustic-electric sensors. For example, Wayne M. et al. utilized the different response signals triggered by different masses of substances in the microwave field to detect the impact of grains [7]. The photoelectric sensor designed by Richard K. utilized the interruption of the current flow when the light path is cut to count the number of grains. The above two monitoring principles had been gradually abandoned because the technology cannot be adapted to the field operation environment [8]. In recent years, two more researched methods for cleaning loss detection have been studied based on machine vision and the piezoelectric principle. Jahari et al. developed a double lighting machine vision system that utilizes captured images to discriminate between materials and grains excluded during operation to provide loss parameters in real time [9]. Chen et al. utilized a decision-tree algorithm for a rice combine harvester to detect rice grain impurities in images and classify the grains and impurities [10]. The use of visual methods can indeed distinguish well between grain, stem, and weeds, but in the actual engineering the combine harvester will produce a huge shake and a lot of dust, which will seriously affect the quality of the image and reduce the accuracy of detection. At the present stage, the research on this technique only remains in the theoretical and laboratory stage, and has not been applied in actual harvesting operations. Currently, most grain sensors mounted in combine harvesters are impact sensors, based on mounting a piezoelectric unit onto a thin flat sensitive plate. Gao et al. employed piezoelectric ceramics as a sensitive element to extract the grain impact signal from vibration noise using a chaos algorithm [11]. However, this noise-reduction detection method was not designed for validation in field experiments. Liang et al. used DEM simulation to test the performance of a piezoelectric crystal-type cleaning loss detection device and applied it to tangential–longitudinal flow combine harvesters [12,13]. However, this method has significant requirements for fan airflow distribution in the cleaning device and cannot be applied to a wide range of operating conditions. Recently, many scholars utilized a PVDF piezoelectric film as a force-sensitive element to detect the grain impact signal and performed performance tests [14,15]. Jin et al. designed a piezoelectric sensor using piezoelectric ceramics as the material and based it on an adaptive neuro-fuzzy inference system, and the relative error of the loss rate was found to be less than 8% in the field experiment [16]. Wu et al. developed a sensor software system using PVDF as the sensitive material and proposed an algorithm to correct the seed and stray residue recognition errors, which was applied in a corn harvester [17]. The results of the real machine experiment showed that the error was below 6%.
Acoustic-electric technology had been widely employed in various types of engineering [18,19], and, as early as the 1990s, Loss et al. utilized the acoustic-electric principle to collect the acoustic signals of grains impacting sounding boards to calculate the amount of losses [20]. However, due to the limitations of technical devices, the acoustic signals of the grains were easily masked by the operating noise of the harvester. With the development of signal processing methods and computer algorithms, it was possible to utilize the acoustic signals of the grains in the calculation of losses. Barry et al. employed sounding boards and acoustic pickup elements as sensing devices for acoustic signals, and through bandpass filtering and acoustic energy detection, the information of the time-domain and frequency-domain features of the signals was fed to a neural network to calculate the amount of cleaning loss [21]. Despite these advancements, there is still room for improvement in signal noise reduction and classification.
Based on the above research, it could be observed that the current research on the cleaning loss sensor is mostly based on the piezoelectric principle, but this principle is difficult to recognize when dealing with the continuous impact of the variety of materials mixed in this method. Acoustic signal has been applied in many engineering fields due to its unique physically fluctuating nature and information carrying capacity. The acoustic signal provides a solution to reduce the effect of stems on cleaning loss detection, and there has been almost no systematic research on acoustic-electric cleaning loss sensors in China at present, so this technology has significant research value.
This paper will construct a collision simulation model to investigate the acoustic collision mechanism between the cleaning throw and the plate, and find the difference between the grain signal and the stem signal. For the problem of interference of harvester operation noise, an improved EMD denoising method based on an autocorrelation function and wavelet soft-threshold denoising is proposed to make the noise reduction process more flexible and reliable. This paper provides a theoretical basis for the cleaning loss detection method based on acoustic signals. And it provides a solution and reference to reduce the interference of stems and improve the accuracy of detection in the process of cleaning loss detection.

2. Materials and Methods

2.1. Impact Simulation between Plate and Throws

The cleaning loss detection method researched in this paper was based on the acoustic signals generated by the impact of the cleaning throws and the plate, which can be defined as follows: when two surfaces approach each other, the air will be ejected from the gap between them, which will cause slight compression of the medium and produce a high-pressure, high-density region between two surfaces. In the rebound phase after contact, the gap between the two surfaces will become a sinking point, the air will flow inward, producing pressure pulses, and this sudden inflow will make the air between the surfaces extremely susceptible to vibrations caused by the object excitation; this is the acoustic wave generation process, with these sound waves ultimately propagated through a medium (air, water, etc.) to the human ear or other receivers. The process of the sound generated by the impact between the cleaning throws and the plate is the same. As shown in Figure 1a,b, before the impact occurs, the throw is close to the plate at a speed of V1 and the air between the surface of the plate and throw is compressed. At the rebound phase (shown in Figure 1c,d), the throw rebounds with a velocity of V2 due to the force exerted by the plate, while the plate and the throw are deformed and vibrated as a result, and these vibrations excite the surrounding air and generate sound.
In order to investigate the characteristics of the acoustic signals generated by the impact, the simulation of the impact process was carried out by the ALE (Arbitrary Lagrange-Euler) algorithm attached to the Ls-Dyna platform (Ls-Prepost V4.7.7).
The ALE algorithm could simulate the realization of the solid impact coupling process in a fluid medium. This approach made it possible to observe the phenomenon of air disturbance after impact and to analyze the differences in sound generated by grain and stem impacts on the plate. The grain was modeled as an ellipsoid with a long radius of 3 mm and a short radius of 1.5 mm. The stem was modeled as a hollow cylindrical structure with a diameter of 4 mm, a length of 40 mm, and a thickness of 0.4 mm. The model was subjected to structured body meshing. The grain model consists of 18,564 tetrahedral meshes and 1176 pentahedral meshes with a minimum mesh length of 2.5 × 10⁻³ mm; the stem model consists of 18,208 tetrahedral meshes with a minimum mesh length of 5 × 10⁻³ mm. The acoustic signal of the subtext study was generated by the collision between the cleaning throws and the plate; therefore, it is important to select a suitable metal material for the plate. As a common raw material for sheet metal, 304 stainless steel has a lower cost and better strength and durability, and can adapt to the high-strength scenarios of combine harvester operation. In addition, it generates a larger contact force during collision, which enables greater excitation of the grain and the plate. Therefore, 304 stainless steel was selected as the material for the plate in this study [12]. The simulation parameters for the throws (including grain and stem), plate, and air model are shown in Table 1.
The contact between the throw and the plate was defined through the keyword *surface_to_surface. The coupling model with air was implemented by setting the keywords *lagrange_in_solid and *control_ale. To ensure the stable operation of the simulation model, the air domain was set separately using the keyword *ale_multi-material_group to turn it into an independent ALE substance. The specific parameter settings are shown in Table 2.
The impact angle between the long axis of the throws and the plane and the initial velocity of the projectiles (including grain and stem) were assumed to be 45° and 3 m/s, respectively. Pictures of the air disturbances in the simulation are shown in Figure 2.
Figure 2 shows that the air surrounding the grain and stem is significantly disturbed by the impact during the rebound phase. The grain model indicates strong excitation of the air above the plate during the rebound phase, and the air around the grain remains significantly excited until the rotation phase. Also, Figure 2 shows that bounce motion of the grain and stem during the impact process causes a strong excitation of nearby air, leading to the generation of acoustic waves.
In order to quantify the post-collision air disturbance, sampling points were selected on the surface nodes of the grain and stem models, and the acceleration time courses of these points were analyzed to study the movement characteristics. In order to clearly analyze the characteristics of the sampling points in terms of frequency, a fast Fourier transform was conducted on the acceleration time course data, and the results are presented in Figure 3 and Figure 4.
It can be seen from Figure 4 that the highest vibration acceleration amplitude of the stems in both the X and Y directions is 6 kHz, whereas the particles in the Z direction also have significant vibration characteristics at 6 kHz, but the peak of the vibration occurred at 7.5 kHz. It should be noted that the amplitude (Amp) of the scale in the Z direction is significantly smaller than that in X and Y directions, indicating that the vibration of the stems in the Z direction is relatively weak. In addition, the vibration frequency bands of the seeds are distributed in low, medium, and high frequencies, with the most significant frequency feature in the high-frequency band, while the significant vibration frequencies of the stems are all in the medium frequency band. This indicates that there are differences in the impact vibration frequencies of grains and stems, and these frequency characteristics can be used to distinguish them from each other.
However, the impact of the throws on the plate may also cause resonance in the material and generate self-resonating noise. Therefore, the finite element method was applied to determine the intrinsic modal frequencies of the grain and stem model. Due to the features of actual operation, the thrown grains and stems were free to move in the air except for contact with the plate, so there was no need to impose additional constraints on the model. In ANSYS Workbench (Workbench 2022 R1), the intrinsic frequencies of the two models were solved, and the modal step could be calculated by setting the modal step to 12. The intrinsic frequencies of each step are shown in Table 3.
It can be seen from Table 3 that the first six steps of the intrinsic frequency of the grain and stem models are almost zero for free modes. The frequency response of the microphone sensor is within 20 kHz, whereas the inherent frequencies of the grain model are all higher than 20 kHz, far beyond the perceptual range of the microphone sensor. By contrast, the stem model exhibits inherent frequencies at 4.78 kHz, 12 kHz, and 13 kHz, and compared to the results shown in Figure 4, it is evident that there are no obvious vibration amplitudes corresponding to these characteristic frequencies. The analysis above indicated that the sounds exited by grain and stem impacting on the plate were not from their surface vibration.

2.2. Signal Acquisition and Analysis

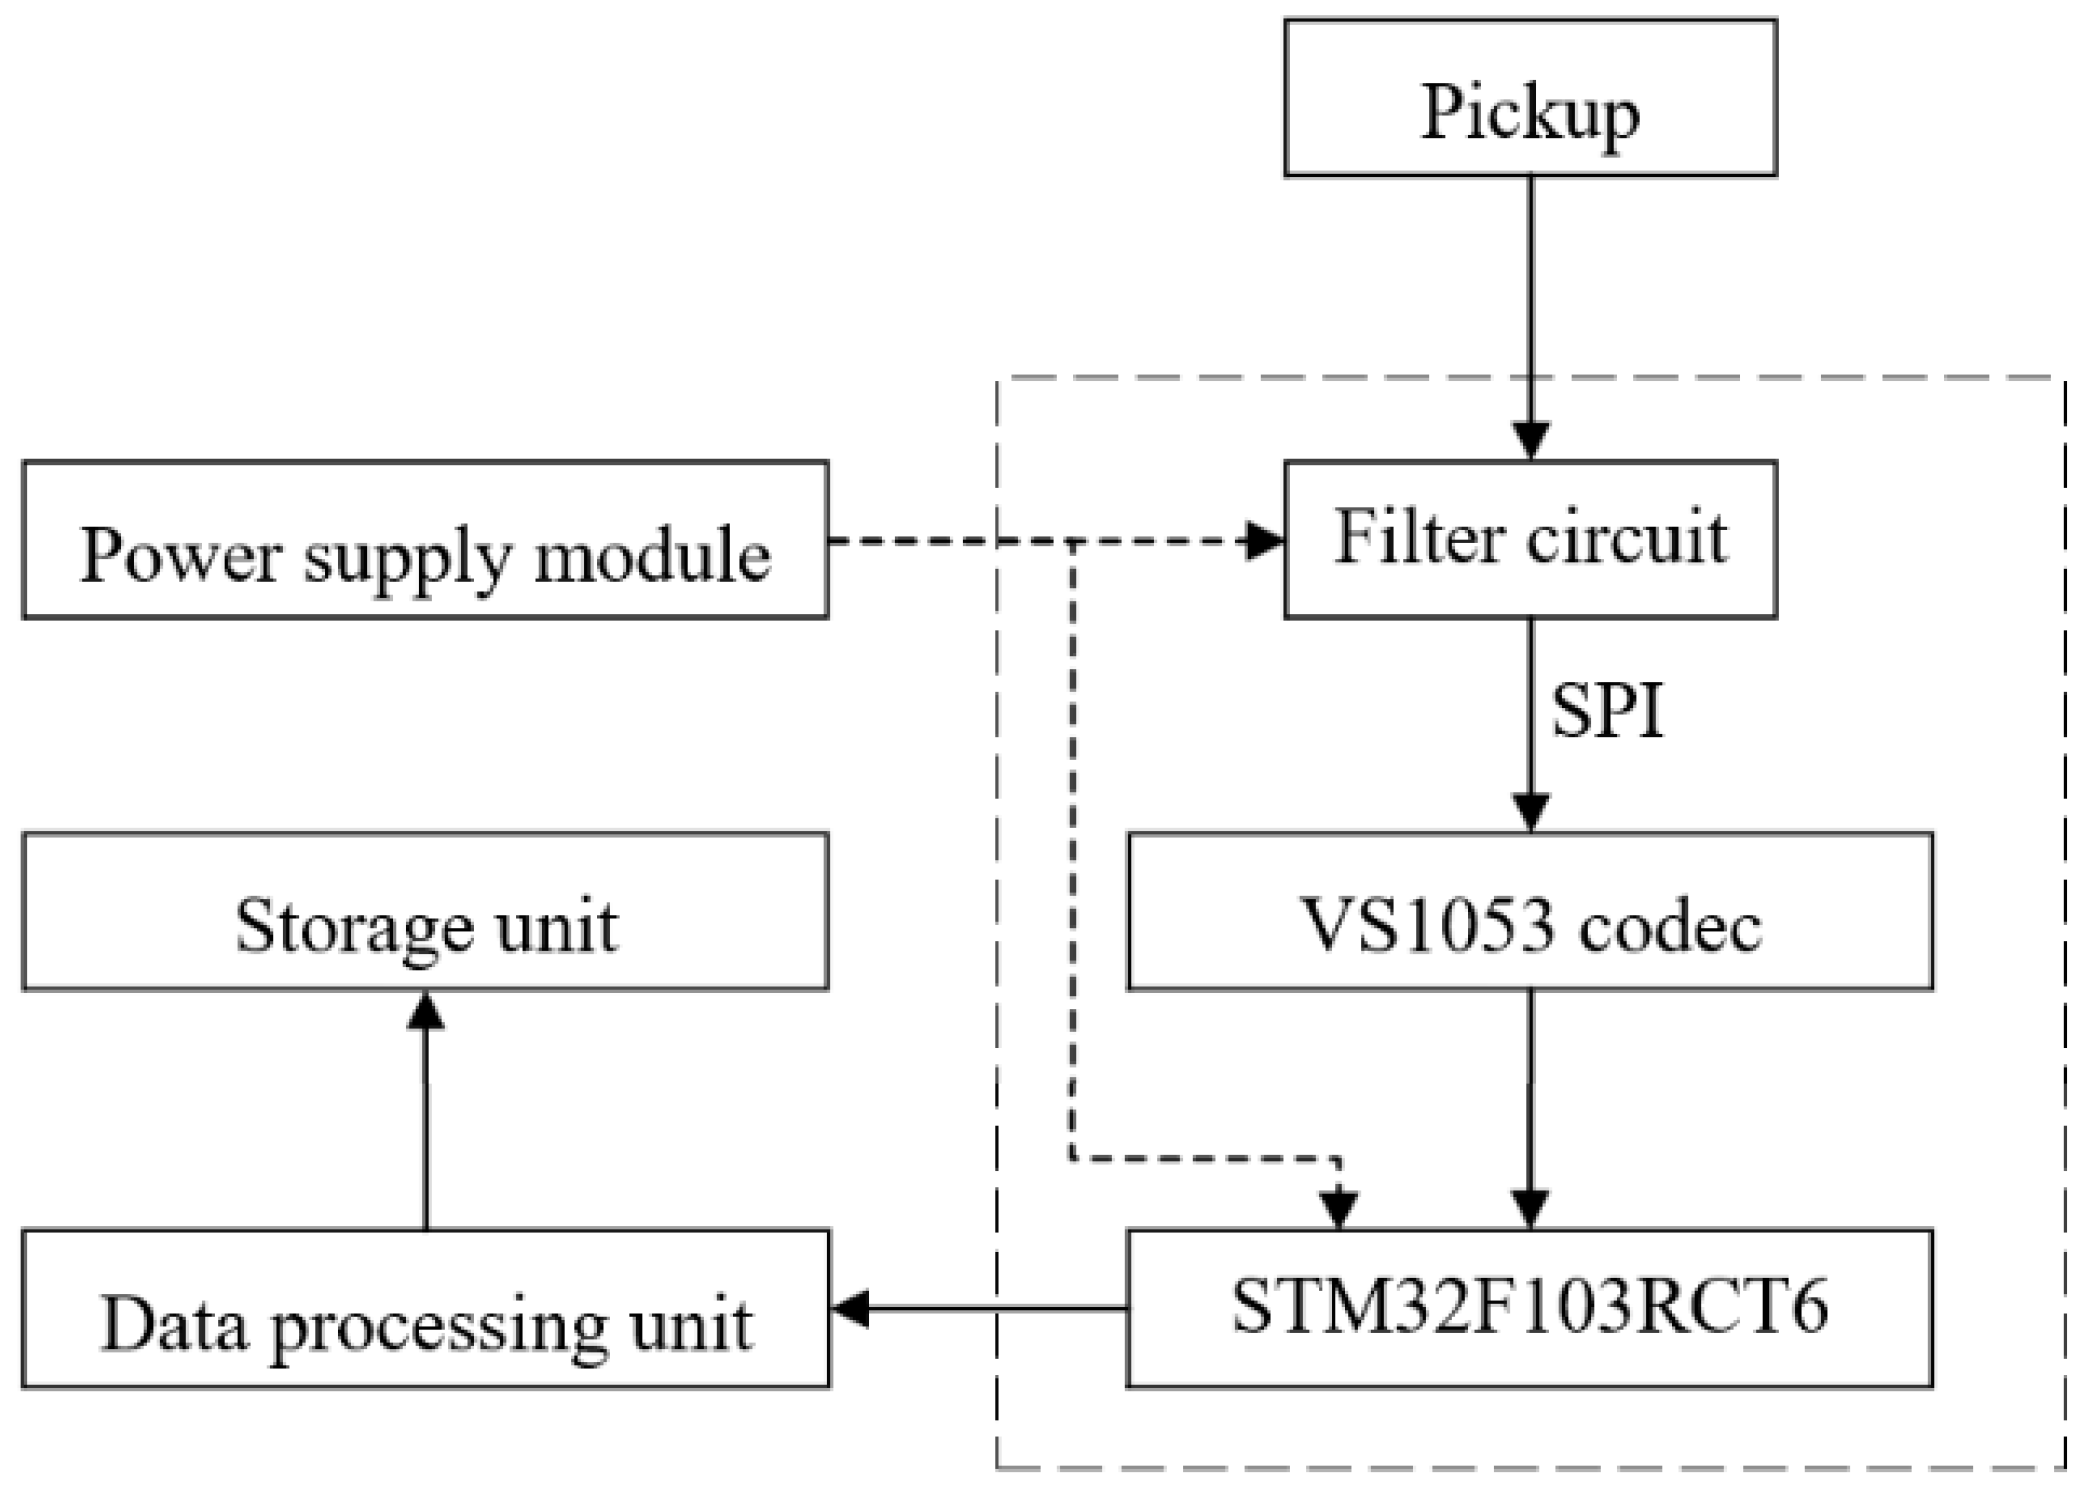
2.2.1. Design of the Signal Acquisition Circuit

The principle of the circuit is shown in Figure 5, which mainly includes a sound pickup, a power supply module, a signal conditioning unit, a data processing unit, and a storage unit. The sound pickup is an SGC-578 condenser microphone (Depusheng electronics co., Shenzheng, China). The power supply module provides voltage for the filtering circuit and the development board. The signal conditioning unit includes an active bandpass filter and a VS1053 codec, which filter out the background noise and encode the audio signal. The data processing unit performs amplitude discrimination on the encoded signal. Finally, the storage unit saves the data to an SD card.

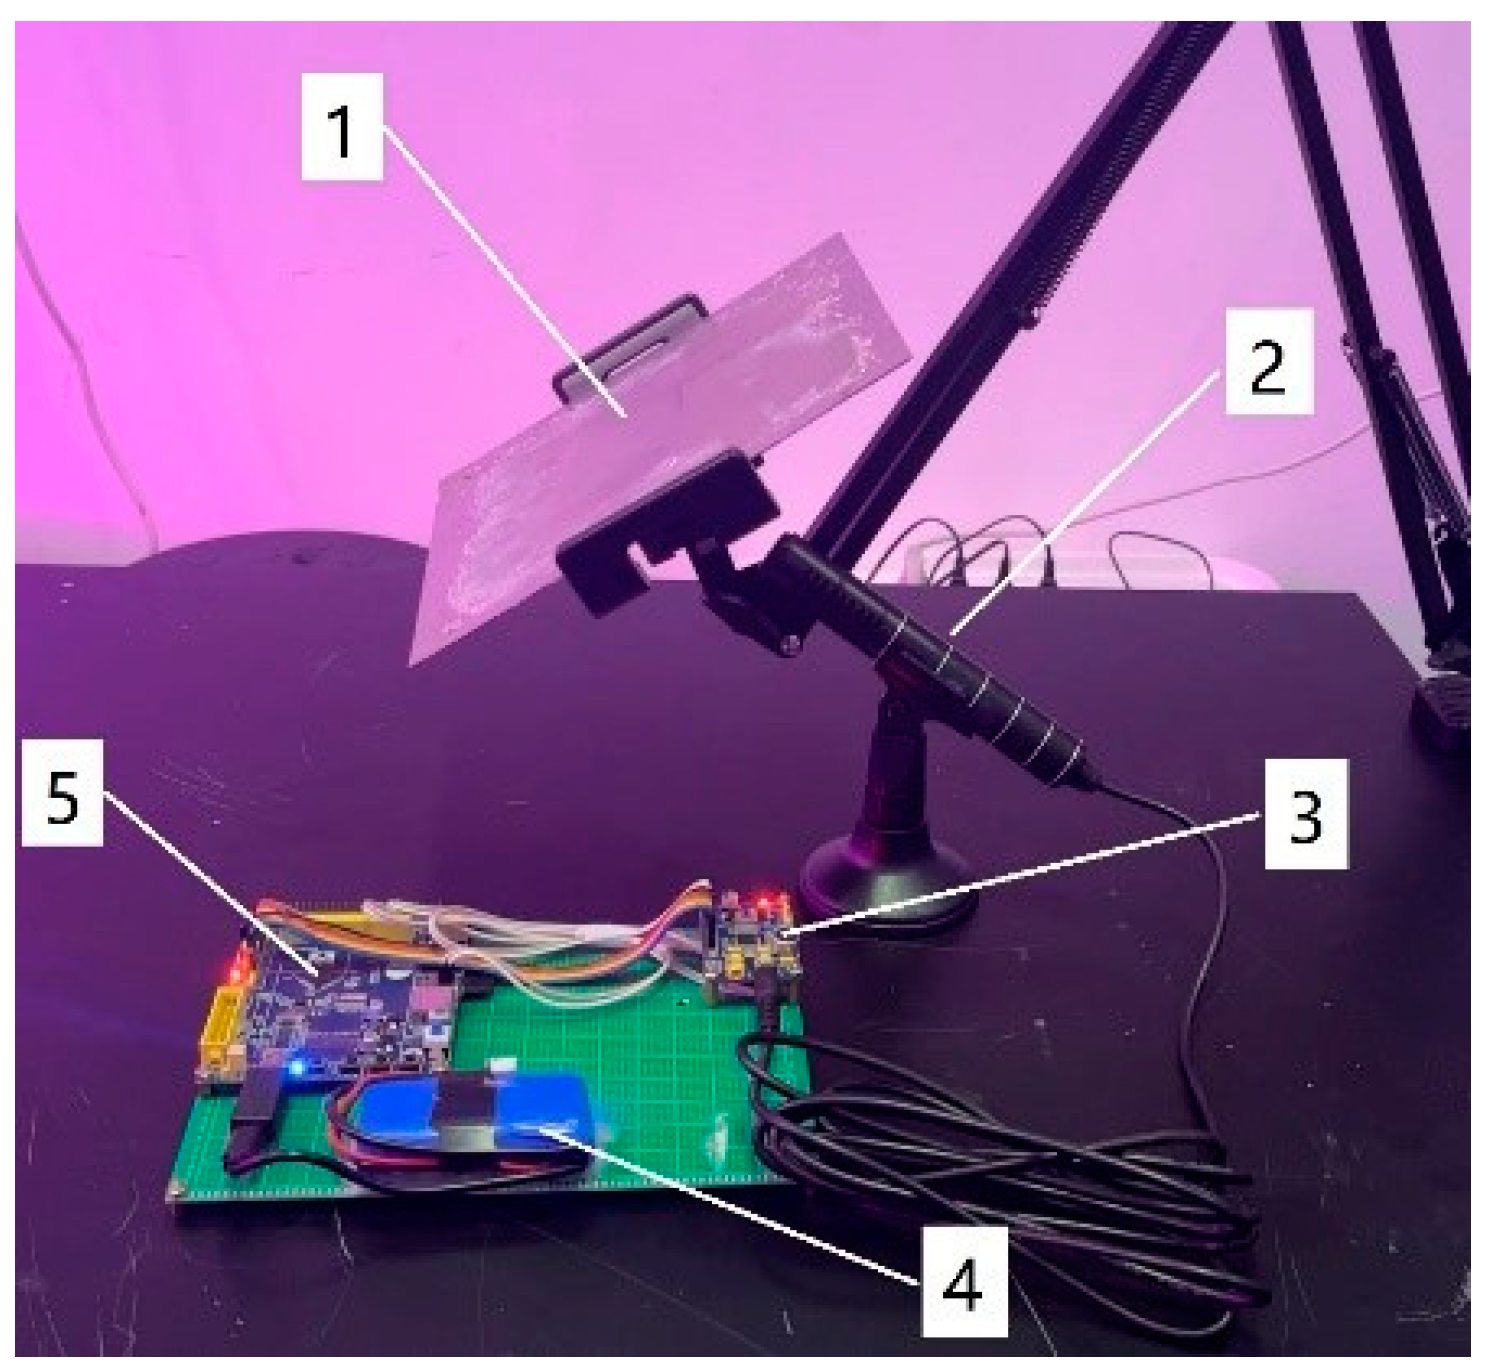
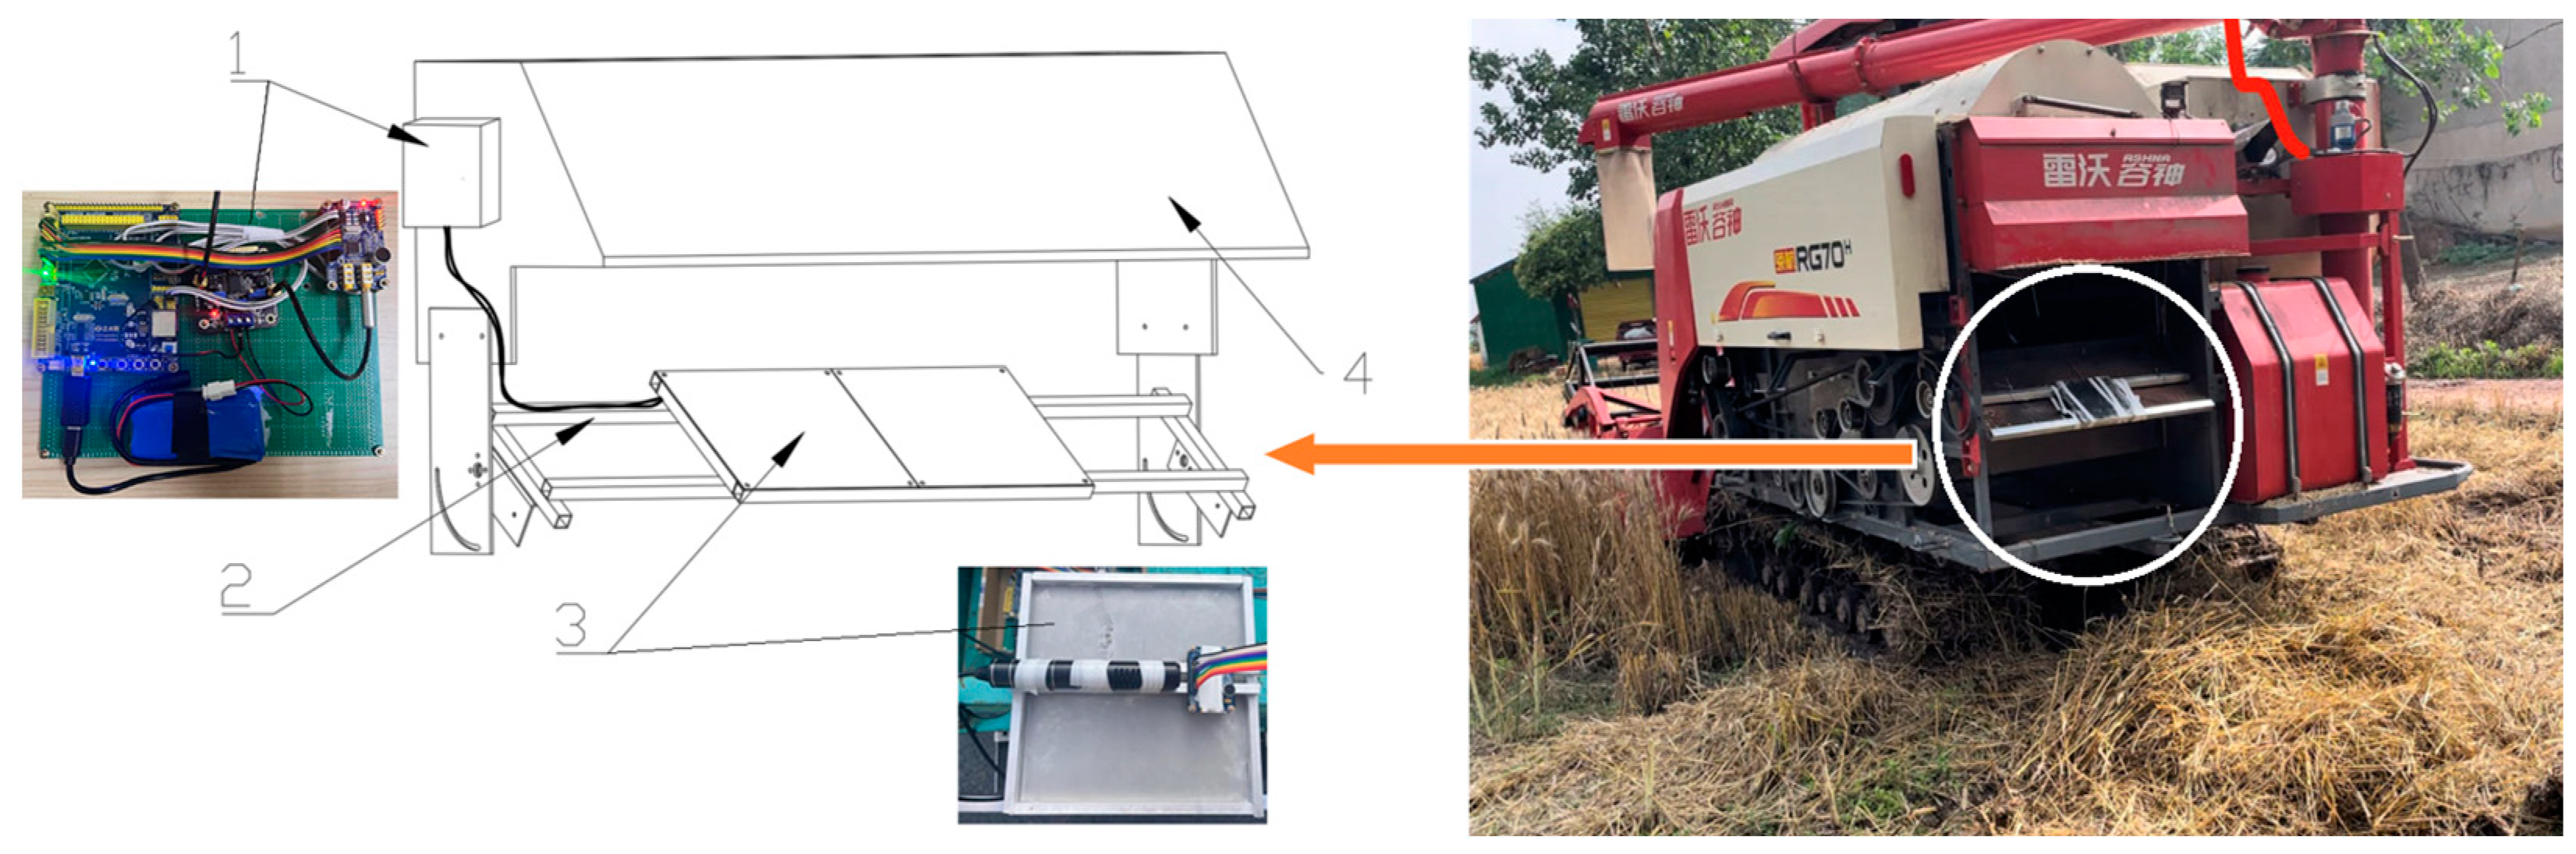
2.2.2. Acoustic Monitoring Test Bench

An impact acoustic monitoring test bench, as shown in Figure 6, was constructed to collect impact acoustic signals. The test bench primarily consists of a sensitive metal plate, a microphone, a signal conditioning storage module, and a power supply module. According to the principle of harvester sorting, the main components in the wheat harvesting sorting throw are wheat grain, stems, and wheat glumes.
Wheat grains, wheat glumes, and wheat stems were selected for the experiment, using the wheat variety Yangmai 25. The acoustic signals of different materials impacting an aluminum plate were collected, with a signal sampling rate of 32,000 Hz and a bit depth of 16 bits. Figure 7 shows a schematic diagram of the material classification.
The cleaning throw was placed at a height of 35 cm above the sensitive metal plate to allow the material to impact the plate through free fall, ensuring the instantaneous velocity of the collision was between 2 and 3 m/s. This setup was designed to ensure the stability of the impact sound [28]. The collected impact sound signals from the experiment were imported into MATLAB and analyzed for their respective characteristics. In this research, a digital microphone was used for signal pickup, and the amplitude of its output signal was normalized; with only relative value having meaning, the unit was recorded as dBFS. The dBFS benchmark depends on the maximum value of the output amplitude. For the microphone selected in this research, the maximum amplitude of the output signal was normalized to 1, which corresponds to 0 dBFS. The minimum amplitude I can be calculated by the following equation:
I = 20 × log 10 1 2 16 = 96 d B F S
where 2 16 is the maximum value of a signal with a bit depth of 16 bits, i.e., 65,536.

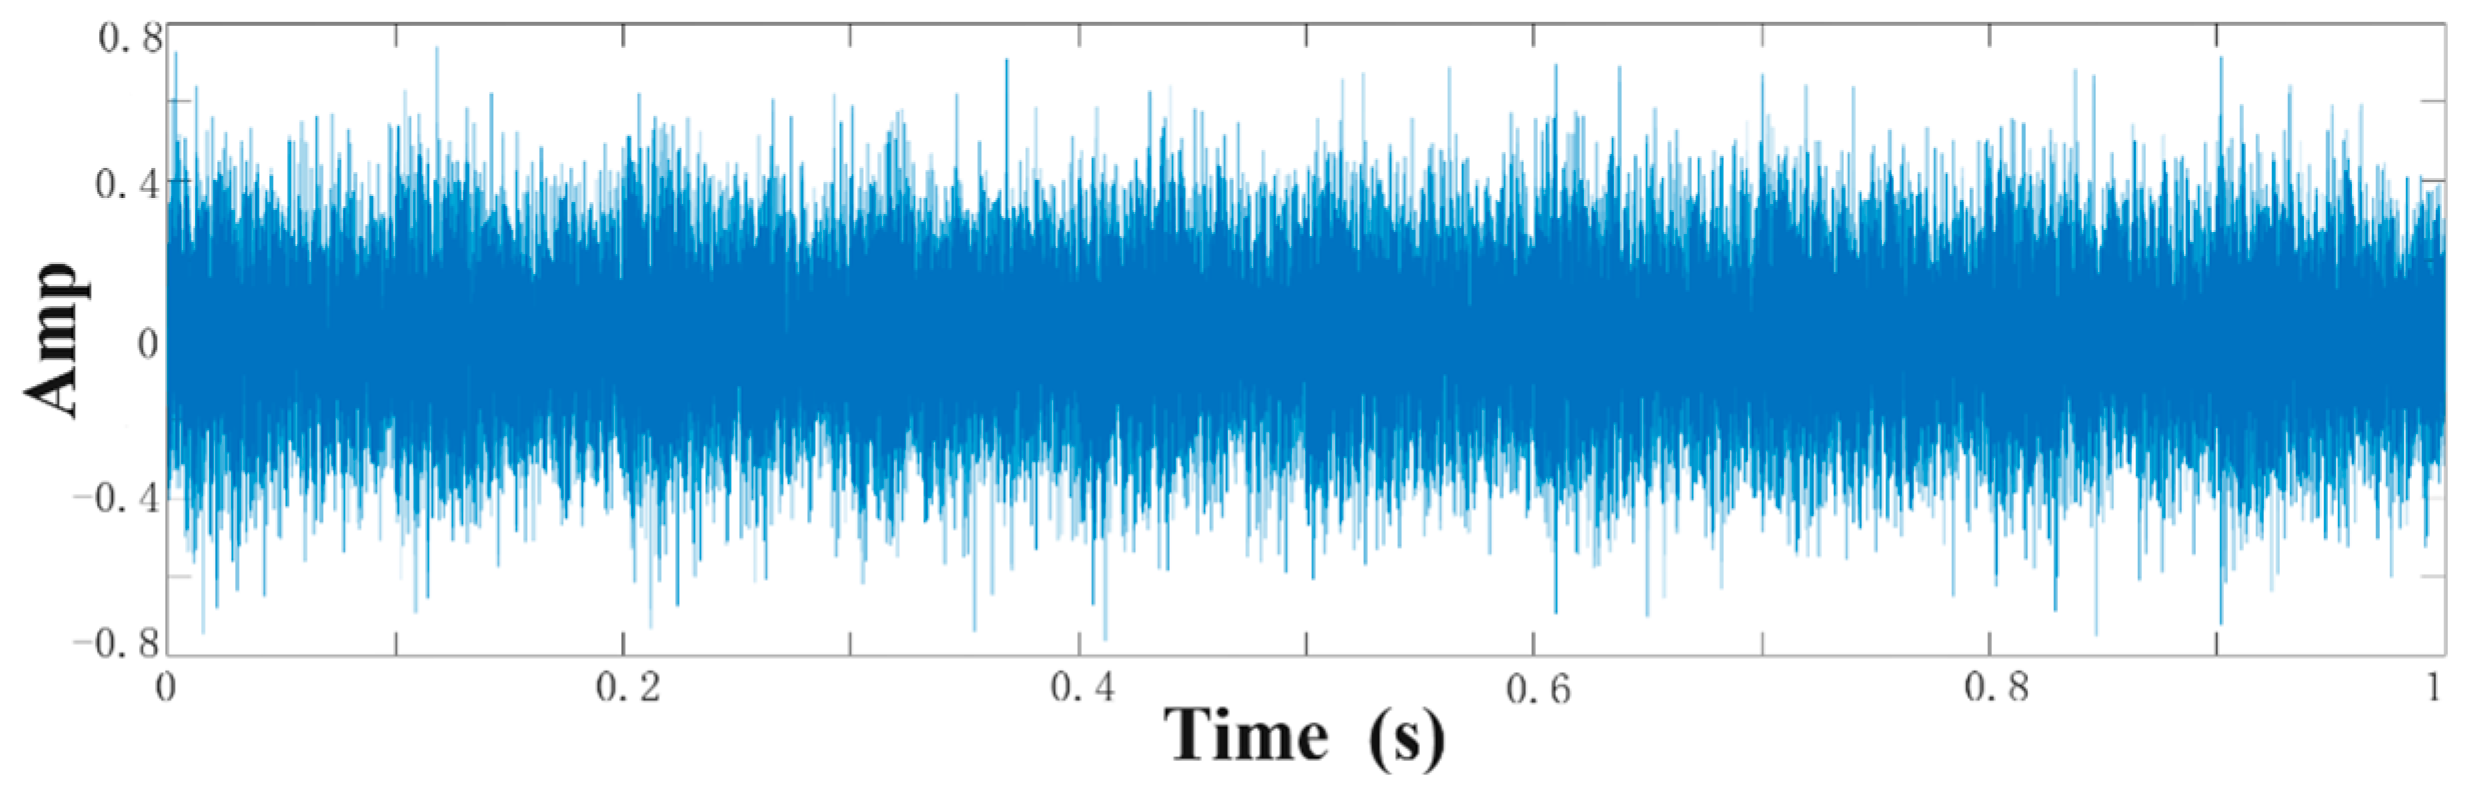
2.2.3. Acoustic Feature Analysis

Through the analysis of the acoustic signals captured from the experiment, it was shown that the glumes almost do not produce a large-amplitude acoustic signal. Their amplitude range is essentially maintained at 0~0.05 (−∞~−26.02 dBFS). Furthermore, during the actual operation of the harvester, the vast majority of the glumes are directly blown out of the discharge opening by the fan and do not impact the plate. So, it can be assumed that the impact acoustic signals in the actual harvesting operation consist of grain signals and stem signals. The maximum peak range of the impact acoustic amplitude of wheat grains is 0.3~0.45 (−10.46~−6.94 dBFS), which is similar to the range of the acoustic amplitude produced by the impact of stems, making it very difficult to distinguish them directly. For this reason, the grain and stem acoustic signals were subjected to a fast Fourier transform; the results are shown in Figure 8, and it was found that the frequency range of the stem signals was concentrated within 0~10 kHz, while the grain signals had a large number of audio signals in the frequency range of 10~16 kHz. Thus, this is a further demonstration that the grain signal and the stem signal can be effectively separated based on their frequency characteristics.

2.3. Research on Loss Detection Methods

Compared with the experimental bench environment, a significant amount of operational noise and instrument vibration noise exists during the actual harvesting process, affecting the recognition of acoustic signals. To verify the feasibility of the recognition method based on acoustic signals for field application, we generated white noise and weakened sinusoidal waveforms with different frequencies to simulate the impact acoustic signals of seeds and stems using MATLAB. The frequencies of the two simulated signals were 10,000 Hz and 4000 Hz, with sampling rates of 32,000 Hz, and lengths of 0.5 s. These two signals were randomly sorted and spliced into a continuous signal with a length of 5 s, and Gaussian white noise was added to simulate the continuous impact acoustic signals during field operation. The simulated signal is shown in Figure 9. To ensure that the signal-to-noise ratio of the simulated signal is close to that of the actual signal, the signal-to-noise ratio of the simulated signal is computed as follows:
S = 10 lg P 2 / 2 N
where S represents the signal-to-noise ratio of the signal, P denotes the maximum magnitude of the weakened sinusoidal signal, and N indicates the noise power [29,30].
The noise generated during the operation of the combine harvester was recorded, and its power spectral density was calculated to be 0.003 W/Hz. Based on the maximum amplitude of the acoustic signal from the grain impact on the plate, which was 0.00034 (−10.46 dBFS), the signal-to-noise ratio during actual operation was calculated to be −47.15 dB. The amplitudes of the simulated grain and stem signals were both 0.2, which allowed for the introduction of Gaussian white noise with a power spectral density of 1037 W/Hz.

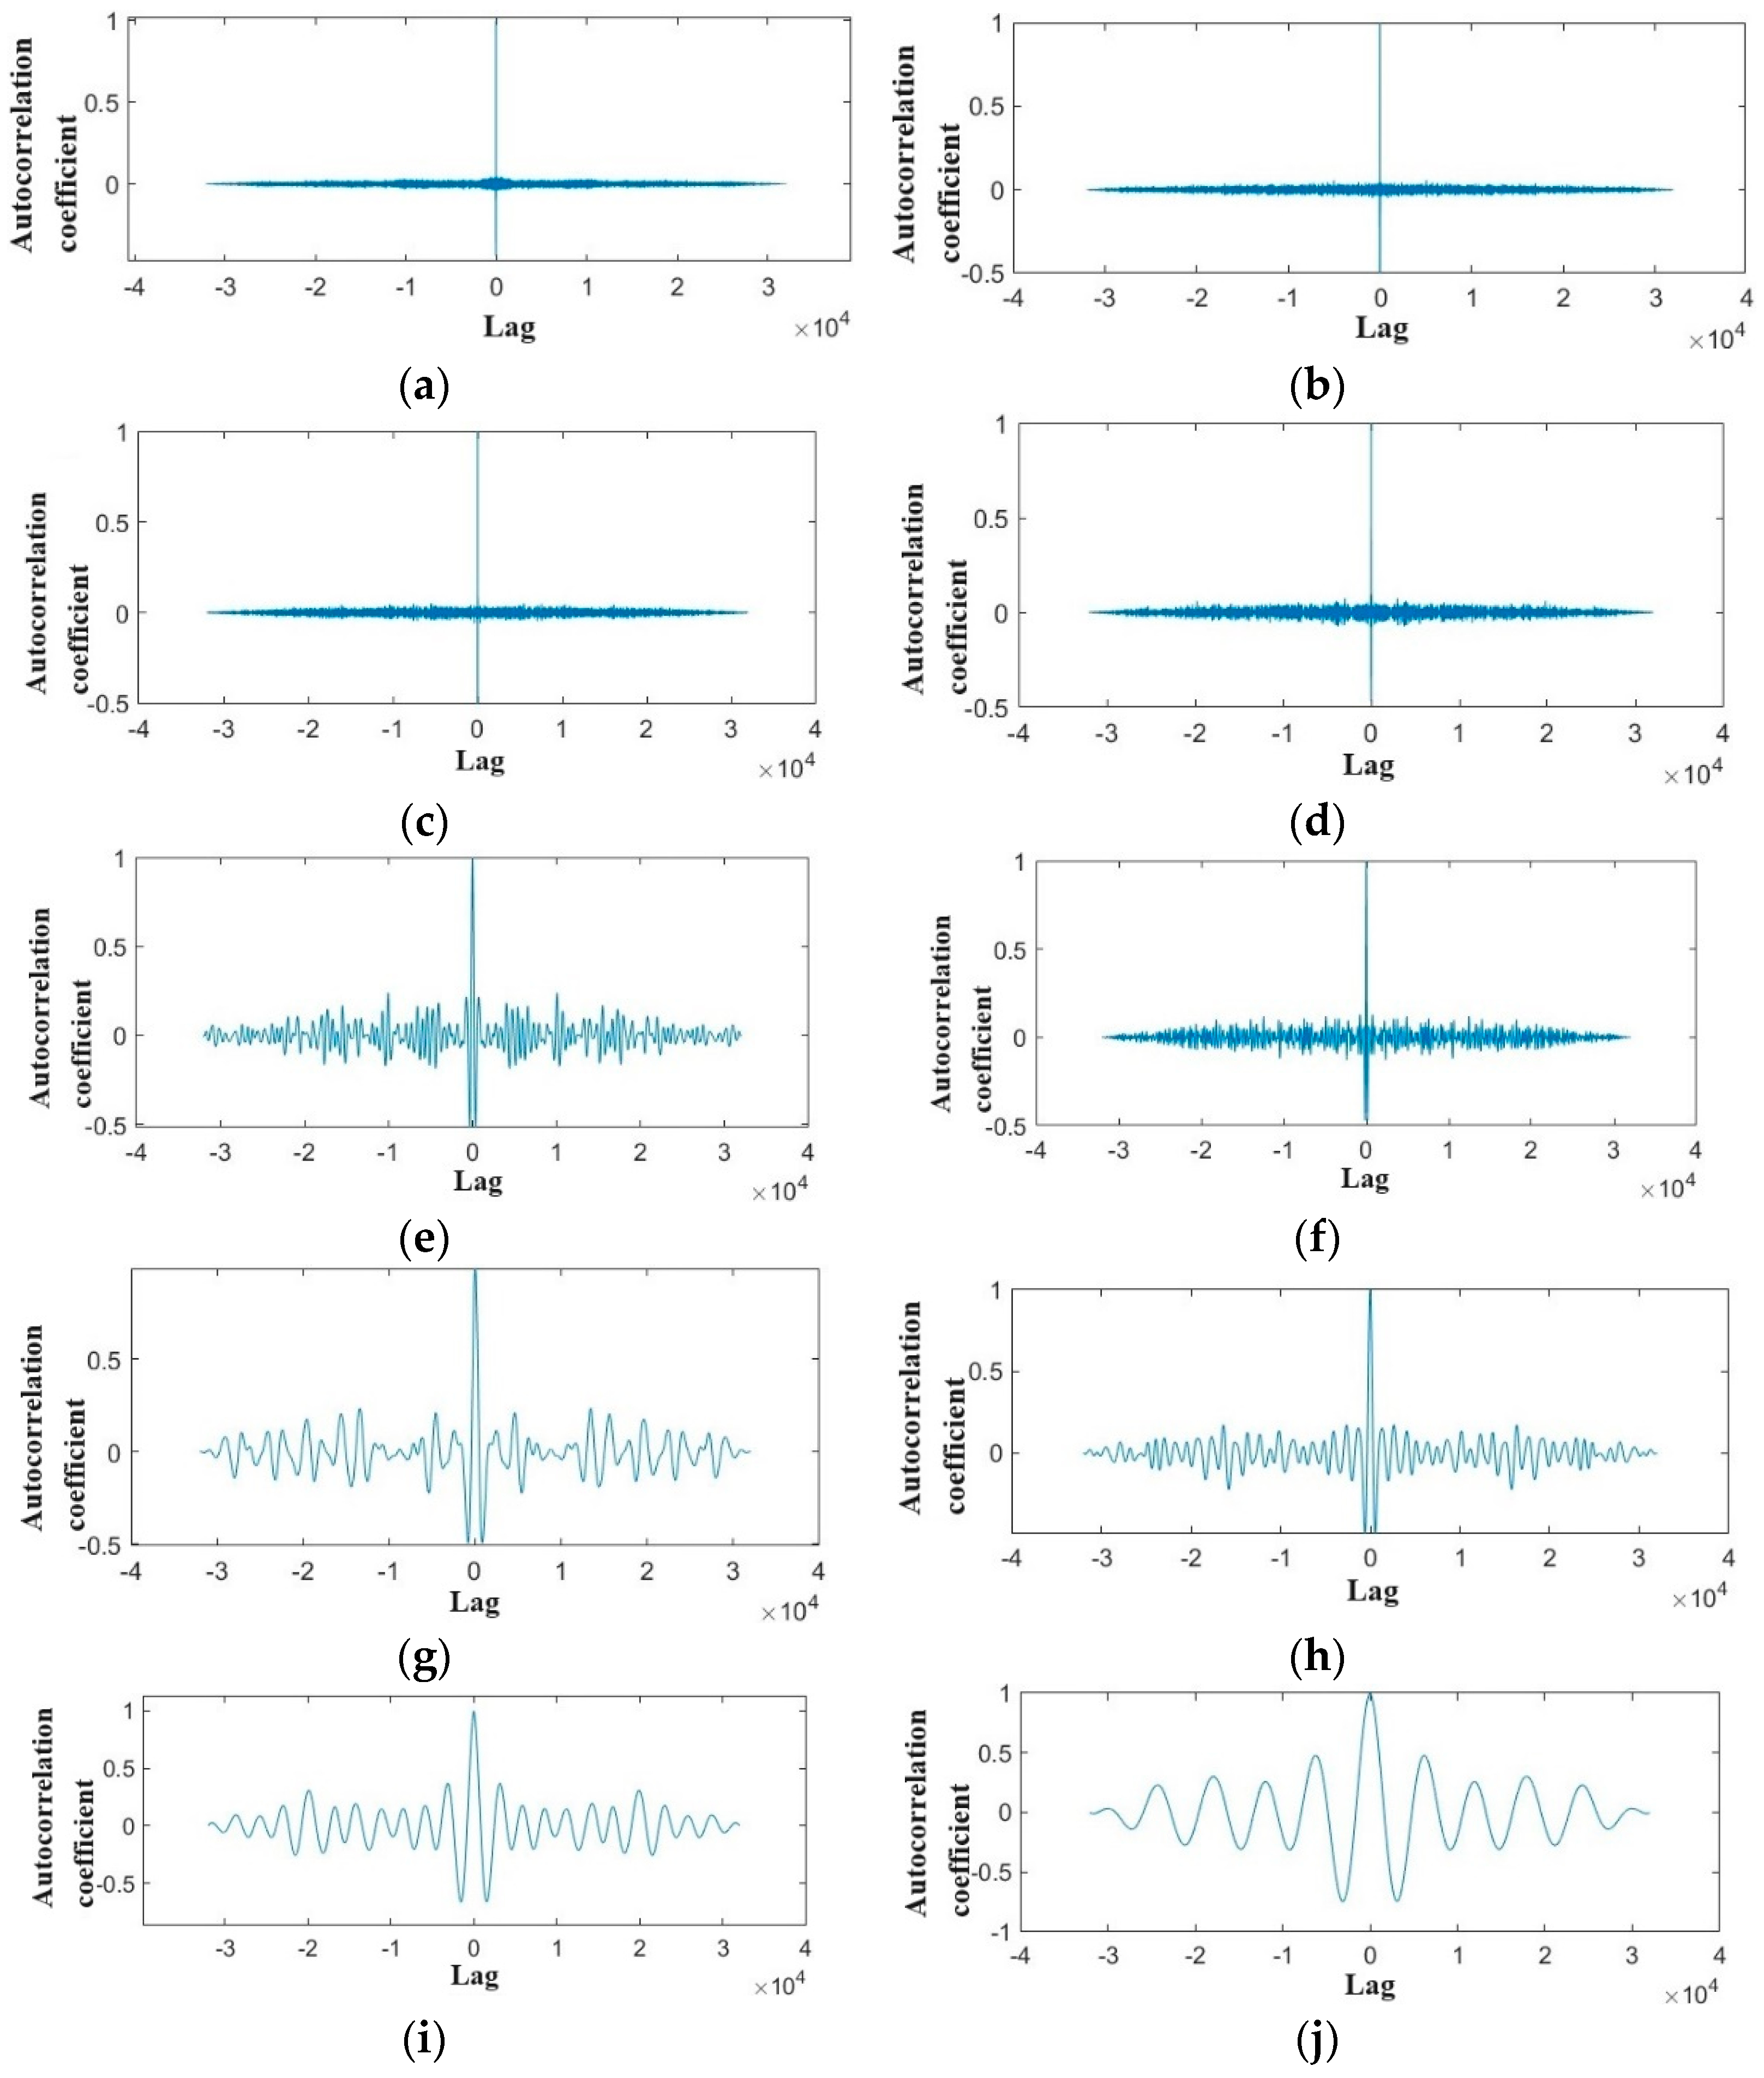
2.3.1. Signal Denoising Method

This research focuses on using the frequency characteristics of acoustic signal to distinguish between grains and stems. The empirical mode decomposition (EMD) method, which is based on the frequency distribution of a signal, was chosen to reduce signal noise. Therefore, the EMD method was selected for the initial processing of the noise-containing simulation signal. Empirical mode decomposition is an adaptive time–frequency signal processing method proposed by Huang et al. [31]. Unlike traditional methods, it is not constrained by Heinsberg’s uncertainty principle, allowing for high-frequency resolution in the high-frequency band. In addition, compared to traditional short-time Fourier transform and wavelet transform methods, the EMD method eliminates the limitations of window and basis functions, making it more suitable for analyzing and processing nonlinear and non-smooth signals. The signal containing the noise is represented as follows:
y t = x t + n t + r ( t )
where x t is the original signal, n t is the operational noise, and r ( t ) is the machine vibration noise.
The signal y ( t ) was decomposed using EMD to obtain a finite number of Intrinsic Mode Functions ( I M F s) with frequencies ranging from high to low. The IMFs with lower orders correspond to the high-frequency components of the signal y ( t ) , while the IMFs with higher orders correspond to the low-frequency components. The decomposed signal y ( t ) can be expressed as follows:
y t = k = 1 N I M F k + r N
where I M F k is the k th I M F and r N is the residual after decomposition.
The principle of EMD denoising is based on the fact that in signals contaminated by noise, most of the energy is concentrated in the low-frequency bands, with higher-frequency bands containing progressively less energy. Therefore, there must exist an I M F k component after which the I M F s are dominated by the energy for each order mode [32,33]. The impact acoustic signal consists of an acceleration acoustic signal and a self-tone signal [34,35]. The acceleration acoustic signal is caused by the pressure perturbation formed by the accelerated motion of the grains in the air medium. This is the initial pulse part of the impact sound, which is the peak of the whole signal, and it contains very little energy. Meanwhile, the impact sound of the wheat stem is a low-frequency signal, whereas the I M F components before the k th order contain the high-frequency band of the signal. Their use maximizes the retention of the grain signal while removing the stem signal and instrument vibration noise. However, this method gives poor performance at low signal-to-noise ratios, which can lead to the loss of grain signals.
The autocorrelation function of the signal is a function used to describe the degree of correlation of the signal at different points in time, which has important statistical characteristics. Therefore, this research proposed a method of class determination based on the autocorrelation function. According to the characteristics of the autocorrelation function, the modal cutoff point k was found. The EMD process was applied to the generated simulation signal and autocorrelation was calculated for each I M F , and the results are shown in Figure 10. The autocorrelation function value of the components before the 4th order is 1 at the zero point, while the values at other points rapidly attenuated to a very low value. This indicates that the correlation of these components is very weak. Based on the characteristics of the autocorrelation function, we selected I M F 1 to I M F 4 as the dominant modes of the grain signal.
Although the modal cut-off point was found, there was, however, still a slight amount of noise in the high-frequency part; for this reason, wavelet threshold denoising was performed on the component containing the grain signal. In this research, coif4 was used as the wavelet basis function to perform soft threshold denoising on I M F 1 ~ I M F 4 , with the number of decomposition layers set to 6. The threshold function is as follows [36,37,38]:
I M F n = s g n I M F n i I M F n i t ,   I M F n ( i ) > t n 0 ,   I M F n ( i ) t n
where t n is the threshold of the I M F n component:
t n = ε n 2 ln N = m e d i a ( a b s ( I M F n ) ) 0.6745 2 ln N
where N is the signal length, ε n is the standard deviation of the noise in the n th layer ( ε n = m e d i a / 0.6745 ), and the median is the absolute median of the I M F n component.
The high-pass components of the denoised I M F 1 ~ I M F 4 were reconstructed to obtain the noise-reduced simulated stem signal, as depicted in Figure 11. It can be seen that the low-frequency part of the signal has been filtered out cleanly, while the time-domain features of the signal in the high-frequency band have been preserved. This indicates that the denoising method was able to filter out the grain signal in a strong noise environment and achieve the separation of the grain signal from the stem signal.

2.3.2. Recognition and Counting Method of Grain Signals

Unlike loss detection based on piezoelectric signals, impact acoustic signals have a much higher sampling frequency than piezoelectric signals. This makes it necessary to process an extremely large amount of data when searching for and identifying impact signals. In this research, the envelope curve of the signal was used to represent the overall trend of the signal, and the grain signal was identified and counted based on the local peaks of the envelope curve. It is important to notice that envelope curves can be generated in three different ways, namely, “analytic”, “rms”, and “peak”. In “analytic”, the envelope is determined by analyzing the size of the signal; in “rms”, the upper and lower RMS envelopes are obtained; and in “peak”, the upper and lower peaks of the signal are used to determine the envelope. Thus, the envelope is based on the upper and lower peaks of the signal, and the fineness of the curve is adjusted by controlling the size of the interval of localization (window size). Since the grain signal to be detected in this study showed an impulse pattern after noise reduction, the “peak” method was chosen to envelope the signal after noise reduction. According to the results of the grain signal in the time domain, the time threshold of the signal pulse can be obtained as 30 ms. Since the sampling frequency of the signal was 32 kHz, the window interval, np, of the envelope curve was set to 960, i.e., np = Fs/33, where Fs means the sampling frequency. Unlike the data distribution of the signal, the envelope curve is a continuous curve, which can be used to find the extreme value points directly through the findpeaks function. The counting of the grain signal can be achieved by setting the threshold value according to the maximum magnitude of the grain signal.

3. Results

The cleaning loss sensor was designed to allow the operator to adjust operating parameters in real-time to optimize yield during harvester operation. An experiment was conducted to gather acoustic parameters related to cleaning efficiency while the harvester operated in the field, assessing the practical feasibility of detecting cleaning losses based on acoustic signals. The wheat harvesting experiment took place on 31 May 2023, in Qianmiao Township, Huainan City, Anhui Province, China. A Lovol Gushen Pilot RG70h combine harvester, with a 2200 mm width, operating at a 2 km/h speed, with a cutting width of 2000 mm, and leaving a stubble height of 10 cm, was used. The monitored experimental area in the field measured 20 m × 12 m.
The plate was fixed to the stainless steel square tubes by welding around the perimeter of the plate; this fixing method of the plate ensures that the acoustic signal generated by the impact will be stable. Two additional parallel square tubes of the same size were welded on top of the four square tubes to fix the pickup, which ensures that there was no direct contact between the pickup and the plate, thus constituting a thin-plate acoustic structure. The entire plate and the fixed tubes were mounted by welding to the support bar. The support bar was installed underneath the discharge opening. The collection circuit board was positioned in the shelf box above the opening. The schematic diagram of the installation position of the sensing device on the combine harvester is shown in Figure 12.
Harvesting intervals of 20 m were designated within the monitoring area, yielding six sets of experimental data. According to the grain loss monitoring model developed by Liang et al. for a longitudinal flow combine [39], the distribution curve of grain ejection in the radial direction approximated a normal distribution. Approximately 26% of the grains were captured in the catch box located centrally at the discharge opening. Using this model, the plate was positioned centrally at the discharge opening, and total loss was calculated accordingly. Throughout the experiment, a mesh pocket was employed to collect ejected grains from the discharge opening. These grains were manually sorted, weighed to determine total mass lost, and counted based on the thousand-grain weight.
The acoustic signals captured in the field were imported into MATLAB for noise reduction, recognition, and counting. A partial original signal and its recognition result are shown in Figure 13.
The computerized identification results and the actual amount of loss were recorded. The detection error was calculated, and the results are shown in Table 4.
The maximum detection error in wheat harvesting was found to be 8.1%. Among the six groups of detection outcomes, three groups showed large detection errors. This may be due to the narrow local window function of the envelope curve or signal mutations. Considering the difference between the actual signal and the simulated signal, the local window size of the envelope curve requires further calibration with more experimental data, as well as data on crop type, maturity, machine model, and operating parameters. However, the detection error of the cleaning loss method based on acoustic signals was significantly lower compared to the results of Jin et al. [16]. In this work, the average detection error was 6.1%, which meets the design requirements.

4. Discussion

In this research, we aimed to investigate a novel detection method for cleaning loss sensors. By processing the actual cleaning signals from an axial flow combine harvester harvesting wheat crop, the results showed that the average error of the detection method based on acoustic signals compared to the actual amount of loss was 6.1%. Compared to the acoustic signals used in this research, Jin et al. [16] used piezoelectric ceramics as a sensitive material and processed the piezoelectric signals for identification using the adaptive neuro-fuzzy inference method, and used this method to detect the cleaning losses during wheat harvesting, with an average error of 8%, which was close to the results of this research. However, since this method could not distinguish the grains and stems very well, which resulted in a slightly higher average error in their detection, it can be shown that the detection method of cleaning loss based on acoustic signals has a better research value and application prospect.

5. Conclusions

Cleaning loss is an important index to measure the quality of harvester operation. However, the cleaning loss sensor is still in the experimental research stage in China, and has not been well promoted and applied in actual products. At present, most of the grain sensors installed on combine harvesters are based on impact sensors with piezoelectric units, but this approach always has the problem of a variable amplitude and difficulty in discriminating between grains and stems in the face of the continuous impact of a mixture of multiple materials. In this paper, a cleaning loss detection method based on acoustic signals was proposed. The simulation models of the impact among the grain, stem, air, and plate were established by using the ALE algorithm. The fast Fourier transform was carried out to analyze air vibration spectral data. Analysis showed that the highest amplitudes of air vibration excited by thrown grain and stem were 15 kHz and 7 kHz, respectively, which makes it possible to separate acoustic air signals excited by thrown grain and stem according to the relevant frequencies.
Based on the characteristics of grain and stem acoustic signals, an improved EMD denoising method based on the autocorrelation function and wavelet soft-threshold denoising was put forward and used to analyze the analog signals with Gaussian white noise added. The results showed that the reconstructed signals of the method could filter out the low-frequency signals and restore the waveforms of the high-frequency signals at the same time. In addition, the reconstructed signal was processed using the upper peak envelope curve of the signal, and the method could identify and count the high-frequency analog signals.
In order to test the performance of the detection methods proposed in this paper in real environments, a field experiment was designed. The results showed that the cleaning loss detection method based on acoustic signals proposed in this paper was feasible; the average and maximum detection errors in wheat harvesting loss were 6.1% and 8.1%, respectively.
However, in actual operation, factors such as feeding volume, fan speed, and the vibrating screen opening might affect the amount of cleaning loss. In future research, a more complex experimental system can be constructed to verify the performance of the cleaning loss detection method proposed in this paper under different working conditions. In addition, different crop types, maturity levels, and different combine harvester models can also affect the measurement results. In future research, it is necessary to establish an experimental system with more variable parameters to investigate the applicability of the acoustic signal-based cleaning loss detection method, and to provide a reference for the promotion of its engineering applications.

Author Contributions

Conceptualization, J.G.; methodology, J.G.; software, Y.S.; validation, J.G. and Z.J.; formal analysis, Y.S.; investigation, Y.S.; resources, J.G.; data curation, Y.S.; writing—original draft preparation, Y.S.; writing—review and editing, J.G. and Z.J.; visualization, Y.S.; supervision, J.G.; project administration, J.G.; funding acquisition, J.G. All authors have read and agreed to the published version of the manuscript.

Funding

This work was financially supported by the National Key Research and Development Program of China (No. 2017YFD0700101), and the project was funded by the Priority Academic Program Development of Jiangsu Higher Education Institutions (No. PAPD-2023-87).

Data Availability Statement

All datasets used in this study are included in the manuscript.

Conflicts of Interest

The authors declare no conflicts of interest.

References

  1. Gao, L.; Xu, S.; Li, Z.; Cheng, S.; Yu, W.; Zhang, Y.; Wu, C. Main grain crop postharvest losses and its reducing potential in China. Trans. Chin. Soc. Agric. Eng. (Trans. CSAE) 2016, 32, 1–11. [Google Scholar]
  2. Liu, J.G.; Lundqvist, J.; Weinberg, J.; Gustafsson, J. Food Losses and Waste in China and Their Implication for Water and Land. Environ. Sci. Technol. 2013, 47, 10137–10144. [Google Scholar] [CrossRef]
  3. Nie, X.; Sun, Y.; Chen, X.; Wang, J. Based on DSP and Winform, the software research of online monitoring system of grain loss rate and the construction of cloud platform are studied. In Proceedings of the 2020 ASABE Annual International Meeting, Virtual, 13–15 July 2020. [Google Scholar] [CrossRef]
  4. Liang, Z.; Wada, M. Development of cleaning systems for combine harvesters: A review. Biosyst. Eng. 2023, 236, 79–102. [Google Scholar] [CrossRef]
  5. Jie, Z.; Liu, H.; Hou, F. Research advances and prospects of combine on precision agriculture in China. Trans. Chin. Soc. Agric. Eng. 2005, 21, 179–182. [Google Scholar]
  6. Zhuo, W.; Dong, C.; Xiaoping, B.; Hechun, H. Improvement and Experiment of Cleaning Loss Rate Monitoring Device for Corn Combine Harvester. Trans. Chin. Soc. Agric. Mach. 2018, 49, 100–108. [Google Scholar] [CrossRef]
  7. Wayne, M.; Thomas, G.; Robert, J.; James, N. Unthreshed Head Grain Loss Monitor. U.S. Patent US4825146A, 25 April 1989. Available online: https://patents.google.com/patent/US4825146A/en (accessed on 14 August 2024).
  8. Richard, K. Absolute Grain Loss Monitor. U.S. Patent US4360998A, 30 November 1982. Available online: https://patents.google.com/patent/US4360998A/en (accessed on 14 August 2024).
  9. Jahari, M.; Yamamoto, K.; Miyamoto, M.; Kondo, N.; Ogawa, Y.; Suzuki, T.; Ahmad, U. Double lighting machine vision system to monitor harvested paddy grain quality during head-feeding combine harvester operation. Machines 2015, 3, 352–363. [Google Scholar] [CrossRef]
  10. Chen, J.; Lian, Y.; Li, Y. Real-time grain impurity sensing for rice combine harvesters using image processing and decision-tree algorithm. Comput. Electron. Agric. 2020, 175, 105591. [Google Scholar] [CrossRef]
  11. Gao, J.; Zhang, G.; Yu, L.; Li, Y. Chaos detection of grain impact at combine cleaning loss sensor. Trans. Chin. Soc. Agric. Eng. (Trans. CSAE) 2011, 27, 22–27. [Google Scholar] [CrossRef]
  12. Liang, Z. Selecting the proper material for a grain loss sensor based on DEM simulation and structure optimization to improve monitoring ability. Precis. Agric. 2021, 22, 1120–1133. [Google Scholar] [CrossRef]
  13. Liang, Z.; Li, Y.; Baerdemaeker, J.; Xu, L.; Saeys, W. Development and testing of a multi-duct cleaning device for tangential-longitudinal flow rice combine harvesters. Biosyst. Eng. 2019, 182, 95–106. [Google Scholar] [CrossRef]
  14. Sun, Y.; Yu, Y.; Tian, H.; Qian, X.; Wang, J. Design and modeling of grain impact sensor utilizing two crossed polyvinylidene fluoride films. In Proceedings of the 2017 ASABE Annual International Meeting, Spokane, DC, USA, 16–19 July 2017. [Google Scholar] [CrossRef]
  15. Xu, L.; Wei, C.; Liang, Z.; Chai, X.; Li, Y.; Liu, Q. Development of rapeseed cleaning loss monitoring system and experiments in a combine harvester. Biosyst. Eng. 2019, 178, 118–130. [Google Scholar] [CrossRef]
  16. Jin, M.; Zhao, Z.; Chen, S.; Chen, J. Improved piezoelectric grain cleaning loss sensor based on adaptive neuro-fuzzy inference system. Precis. Agric. 2022, 23, 1174–1188. [Google Scholar] [CrossRef]
  17. Wu, Y.H.; Li, X.Y.; Mao, E.R.; Du, Y.F.; Yang, F. Design and development of monitoring device for corn grain cleaning loss based on piezoelectric effect. Comput. Electron. Agric. 2020, 179, 11. [Google Scholar] [CrossRef]
  18. Baydar, N.; Ball, A. Detection of gear failures via vibration and acoustic signals using wavelet transform. Mech. Syst. Signal Process. 2003, 17, 787–804. [Google Scholar] [CrossRef]
  19. Park, S.W.; Lee, S.K. Development of a new sound metric for impact sound in a passenger car using the wavelet transform. Int. J. Automot. Technol. 2010, 11, 809–818. [Google Scholar] [CrossRef]
  20. Loss, L.H. Experiments with Acoustic Sensors for Grain Loss Measuring on Combines; SAE International: Warrendale, PA, USA, 1992. [Google Scholar] [CrossRef]
  21. Batcheller, B.D.; Gelinske, J.N.; Nystuen, P.A.; Reich, A.A. System and Method for Determining Material Yield and/or Loss from a Harvesting Machine Using Acoustic Sensors. U.S. Patent US9474208B2, 25 October 2016. Available online: https://patents.google.com/patent/US9474208B2/en (accessed on 14 August 2024).
  22. Li, Q.; Jones, N. Shear and adiabatic shear failures in an impulsively loaded fully clamped beam. Int. J. Impact Eng. 1999, 22, 589–607. [Google Scholar] [CrossRef]
  23. Benson, D.J.; Stander, N.; Jensen, M.R.; Craig, K.J. On the application of LS-OPT to identify non-linear material models in LS-DYNA. In Proceedings of the 7th International LS-DYNA Users Conference, Dearborn, MI, USA, 6–8 May 2002; Available online: https://www.dynalook.com/conferences/international-conf-2002/Session_16-4.pdf (accessed on 14 August 2024).
  24. Carney, K.; Pereira, J.M.; Revilock, D.; Matheny, P. Jet engine fan blade containment using an alternate geometry. Int. J. Impact Eng. 2009, 36, 720–728. [Google Scholar] [CrossRef]
  25. Jorgensen, K.; Swan, V. Modeling of armour-piercing projectile perforation of thick aluminium plates. In Proceedings of the 13th International LS-DYNA Users Conference, Detroit, MI, USA, 8–10 June 2014. [Google Scholar]
  26. Ma, X.; Lei, D.; Zhao, S.; Zhao, Z. Study on the Mechanical-Rheological Properties of Soybean and Wheat Grain Grown in Northeast China. Trans. CSAE 1999, 3, 70–75. [Google Scholar]
  27. Liang, L.; Guo, Y. Relationship between stalk biomechanical properties and morphological traits of wheat at different growth stages. Trans. CSAE 2008, 8, 131–134. [Google Scholar]
  28. Liang, Z.; Li, Y.; Zhao, Z. Monitoring method and sensor for grain separation loss on axial flow combine harvester. Trans. Chin. Soc. Agric. Eng. (Trans. CSAE) 2014, 30, 18–26. [Google Scholar] [CrossRef]
  29. Feldman, M. Hilbert transform in vibration analysis. Mech. Syst. Signal Process. 2011, 25, 735–802. [Google Scholar] [CrossRef]
  30. Shen, J.; Zhao, S.; Chen, J. The Processing Way of Pipeline Vibration Signal based on Wavelet Transform. In Proceedings of the International Conference on Advanced Design and Manufacturing Engineering (ADME 2011), Guangzhou, China, 16–18 September 2011. [Google Scholar] [CrossRef]
  31. Huang, N.E.; Shen, Z.; Long, S.R.; Wu, M.C.; Shih, H.H.; Zheng, Q.; Liu, H.H. The empirical mode decomposition and the Hilbert spectrum for nonlinear and non-stationary time series analysis. Proc. R. Soc. Lond. Ser. A Math. Phys. Eng. Sci. 1998, 454, 903–995. [Google Scholar] [CrossRef]
  32. Boudraa, A.O.; Cexus, J.C. EMD-based signal filtering. IEEE Trans. Instrum. Meas. 2007, 56, 2196–2202. [Google Scholar] [CrossRef]
  33. Du, Y.; Zhang, L.; Mao, E.; Li, X.; Wang, H. Design and experiment of corn combine harvester grain loss monitoring sensor based on EMD. Trans. Chin. Soc. Agric. Mach. 2022, 53, 158–165. [Google Scholar] [CrossRef]
  34. Li, Y.; Chen, T.; Xiaopeng, W.; Kunpeng, Y.; Chao, Z. Theoretical analysis and numerical simulation for impact noise due to impact of two cylinders. J. Vib. Shock 2014, 33, 162–166+173. [Google Scholar] [CrossRef]
  35. Sasaoka, N.; Hamahashi, N.; Itoh, Y. Speech Enhancement with Impact Noise Activity Detection Based on the Kurtosis of an Instantaneous Power Spectrum. Ieice Trans. Fundam. Electron. Commun. Comput. Sci. 2017, E100A, 1942–1950. [Google Scholar] [CrossRef]
  36. Jiao, Y.; Shi, H.; Wang, X. Lifting Wavelet Denoising Algorithm For Acoustic Emission Signal. In Proceedings of the International Conference on Robots & Intelligent System (ICRIS), Zhangjiajie, China, 27–28 August 2016. [Google Scholar] [CrossRef]
  37. Shi, Y.; Zhang, J.; Jiao, J.; Zhao, R.; Cao, H. Calibration Analysis of High-G MEMS Accelerometer Sensor Based on Wavelet and Wavelet Packet Denoising. Sensors 2021, 21, 1231. [Google Scholar] [CrossRef] [PubMed]
  38. Wang, Z.; Liu, X.; Liu, X. Wavelet and Empirical Mode Decomposition Denoising for GLAS Full Waveform Data. Laser Optoelectron. Prog. 2021, 58, 364–371. [Google Scholar]
  39. Liang, Z.; Li, Y.; Zhao, Z.; Xu, L.; Zhao, Z. Sensor for monitoring rice grain sieve losses in combine harvesters. Biosyst. Eng. 2016, 147, 51–66. [Google Scholar] [CrossRef]
Figure 1. A schematic diagram of the impact acoustic process: (a) free fall; (b) impact; (c) rebound; (d) rotation.
Agronomy 14 01816 g001
Figure 2. Impact throws impacting the plate: (a) grain; (b) stem.
Agronomy 14 01816 g002
Figure 3. Spectrogram of acceleration of grain sampling point: (a) X direction; (b) Y direction; (c) Z direction.
Agronomy 14 01816 g003
Figure 4. Spectrogram of acceleration of stem sampling point: (a) X direction; (b) Y direction; (c) Z direction.
Agronomy 14 01816 g004
Figure 5. A schematic of the signal acquisition circuit.
Agronomy 14 01816 g005
Figure 6. Impact sound monitoring test bench: 1. plate; 2. microphone; 3. Vs1053 module; 4. power supply module; 5. storage module.
Agronomy 14 01816 g006
Figure 7. Material classification diagram: (a) grains; (b) stems; (c) glumes.
Agronomy 14 01816 g007
Figure 8. Time-domain and frequency-domain plots of actual signal: (a) grain signal; (b) stem signal.
Agronomy 14 01816 g008
Figure 9. Simulation experiment signals.
Agronomy 14 01816 g009
Figure 10. Schematic of autocorrelation of IMF components of each degree: (a) I M F 1 ; (b) I M F 2 ; (c) I M F 3 ; (d) I M F 4 ; (e) I M F 5 ; (f) I M F 6 ; (g) I M F 7 ; (h) I M F 8 ; (i) I M F 9 ; (j) I M F 10 .
Agronomy 14 01816 g010
Figure 11. Signal after denoising and reconstruction.
Agronomy 14 01816 g011
Figure 12. The installation position of the sensing device on the combine harvester: 1. collection circuit board; 2. support rod; 3. plate; 4. discharge opening.
Agronomy 14 01816 g012
Figure 13. Recognition result.
Agronomy 14 01816 g013
Table 1. Summary of simulation material parameters [22,23,24,25,26,27].
Material PropertiesGrainStemPlateAir
Density/kg·m−376016078501.3
Young’s modulus/MPa4644102.1 × 105
Poisson’s ratio0.400.350.30
Pressure cutoff/Pa −1 × 10⁻¹⁰
Viscosity coefficient/N·s·m−2 2 × 10⁻⁵
Initial internal energy/Pa 2.5 × 10⁵
Table 2. Contact and coupling parameters of the model.
*surface_to_surfaceStatic Coefficient of FrictionDynamic Coefficient of Friction
Parameter value0.560.02
*lagrange_in_solidNumber of Coupling PointsFluid–Structure Coupling MethodCoupling Direction
Parameter value342
*control_aleAlternate Advection LogicNumber of CyclesALE Smoothing Weight Factor
Parameter value−11−1
Table 3. Intrinsic frequencies of grain and stem models.
StepIntrinsic Modes of the Grain Model (Hz)Intrinsic Modes of the Stem Model (Hz)
100
23.2584 × 10−40
37.6664 × 10−40
41.4152 × 10−35.2634 × 10−3
51.5645 × 10−35.7461 × 10−3
62.1082 × 10−36.6704 × 10−3
737,7504784.1
837,83712,009
944,10613,063
1046,97821,041
1146,98521,082
1251,15424,800
Table 4. Wheat monitoring experimental data.
GroupExperimental Time (Sec)Detected Grain LossActual Grain LossDetection Error (%)
14516361695−3.4
24316231772−8.4
34213301233+7.9
44611301079+4.8
54714041464−4.1
64212501156+8.1
Average 44139614006.1
Disclaimer/Publisher’s Note: The statements, opinions and data contained in all publications are solely those of the individual author(s) and contributor(s) and not of MDPI and/or the editor(s). MDPI and/or the editor(s) disclaim responsibility for any injury to people or property resulting from any ideas, methods, instructions or products referred to in the content.

