Article

Marigold (Tagetes erecta) MADS-Box Genes: A Systematic Analysis and Their Implications for Floral Organ Development

1
National Key Laboratory for Germplasm Innovation & Utilization of Horticultural Crops, College of Horticulture and Forestry Sciences, Huazhong Agricultural University, Wuhan 430070, China
2
College of Veterinary Medicine, Huazhong Agricultural University, Wuhan 430070, China
3
Key Laboratory of Landscape Architecture of Jiangsu Province, College of Landscape Architecture, Nanjing Forestry University, Nanjing 210037, China
*
Author to whom correspondence should be addressed.
Agronomy 2024, 14(9), 1889; https://doi.org/10.3390/agronomy14091889 (registering DOI)
Submission received: 26 July 2024 / Revised: 16 August 2024 / Accepted: 22 August 2024 / Published: 24 August 2024

Abstract

:
Marigold (Tagetes erecta) has a capitulum with two floret types: sterile ray florets and fertile disc florets. This distinction makes marigold a valuable model for studying floral organ development in Asteraceae, where MADS-box transcription factors play crucial roles. Here, 65 MADS-box genes were identified in the marigold genome, distributed across all 12 chromosomes. These genes were classified into type I (13 genes) and type II (52 genes) according to phylogenetic relationships. The gene structure of type I was simpler than that of type II, with fewer conserved motifs. Type I was further divided into three subclasses, Mα (8 genes), Mβ (2 genes), and Mγ (3 genes), while type II was divided into two groups: MIKCC (50 genes) and MIKC* (2 genes), with MIKCC comprising 13 subfamilies. Many type II MADS-box genes had evolutionarily conserved functions in marigold. Expression analysis of type II genes across different organs revealed organ-specific patterns, identifying 34 genes related to flower organ development. Given the distinct characteristics of the two floret types, four genes were specifically expressed only in the petals of one floret type, while twenty genes were expressed in the stamens of disc florets. These genes might have been related to the formation of different floret types. Our research provided a comprehensive and systematic analysis of the marigold MADS-box genes and laid the foundation for further studies on the roles of MADS-box genes in floral organ development in Asteraceae.

1. Introduction

Asteraceae, one of the largest and most diverse families within the angiosperms, is distinguished by its unique floral structure, the capitulum. This dense inflorescence comprises numerous tightly clustered florets, creating the appearance of a single flower [1,2]. The capitulum has homogamous and heterogamous flower heads [3]. The homogamous capitulum is composed of only a single type of floret, while the heterogamous capitulum consists of at least two distinct types of florets: ray florets at the margin of the capitulum and disc florets in the center, as seen in sunflower (Helianthus annuus) [4], daisy (Bellis perennis) [2], and marigold (Tagetes erecta) [5]. Understanding the genetic foundation of capitulum formation, especially the heterogamous capitulum, is crucial for comprehending the evolutionary success of Asteraceae.
The MADS-box genes, widely identified in eukaryotes [6], play important roles in plant growth and development, especially in the floral transition [7], flowering time [8], inflorescence architecture [9], floral organ identity [10], and fruit development [11]. These genes feature a conserved domain of 56–58 amino acids at the N-terminus, known as the MADS domain [12]. According to conserved protein domains, gene structures, and phylogenetic analysis, MADS-box genes are classified into two clades, type I and type II [13]. Type I proteins contain a conserved MADS (M) domain which can be subdivided into three groups, including Mα, Mβ, and Mγ. Type II proteins contain four domains: the MADS-box (M) domain, the intervening (I) domain, the keratin-like (K) domain, and the C-terminal (C) domain [14]. The M domain is the most conserved, followed by the I and K domains, with the C domain being the least conserved [15]. The M domain is involved in DNA binding [6], the I domain plays a role in specifying dimerization [16], the K domain facilitates the dimerization of MADS-box proteins [17], and the C domain either contains a transactivation domain or contributes to MADS-box protein interaction specificity [18,19]. The type II MADS-box genes are further classified into MIKCC and MIKC* groups, based on their structural characteristics [13]. Phylogenetic analysis allows for further classification of the MIKCC group into the following subfamilies: AP1 (SQUA)/FUL, AP3 (DEF)/PI (GLO), AG/STK, SEP, SOC1 (TM3), SVP (STMADS11), FLC, TM8, Bsister (GGM13), AGL6, AGL12, AGL15, AGL17 [13,20,21].
To date, the research on plant MADS-box transcription factors primarily focuses on the type II genes. Many type I genes remain to be characterized; the studies indicate that type I genes play a significant role in female gametophyte, embryo, and endosperm [22]. Type II MIKC* genes are essential for the male gametophyte in arabidopsis (Arabidopsis thaliana), significantly contributing to pollen maturation [23,24]. In contrast, type II MIKCC genes have been most intensively studied, which participate in the well-known ABCDE flower development model [20]. In the ABCDE model, A-class genes determine sepal identity, A- and B-class genes determine petal identity. B- and C-class genes determine stamen development, C-class genes alone determine carpel identity [25,26,27,28]. Lastly, D-class genes are required for ovule development and E-class genes are required for the specification of all floral organs [29,30]. In arabidopsis, A-class genes include AP1 and AP2, B-class genes include AP3 and PI, C-class genes include AG, D-class gene include AGL11, and E-class genes include SEP1, SEP2, SEP3, and SEP4 [31]. All functional proteins involved in the cascade reaction of flower development, except for the non-MADS-box functional gene AP2 of the A class, are encoded by one or more MIKCC genes [32,33]. MADS-box family genes are pivotal in flower development, with homologous genes evolving diverse functions across species through subfunctionalization or neofunctionalization [34]. Consequently, MADS-box genes serve as crucial targets for floral breeding.
The MADS-box gene family is crucial for the formation of complex floral patterns in the Asteraceae. For example, the AP1 homolog LsMADS55 in lettuce (Lactuca sativa) is specifically expressed in the inflorescence meristem [35]. The AP3/PI homologs in sunflower contributed to the formation of petals and stamens [4]. Additionally, MADS-box genes responsible for floral organ determination exhibited differential expression across various flower types [31,36]. For example, in gerbera (Gerbera hybrida), different MADS genes were differentially expressed in ray florets and disc florets. MADS-box genes are crucial for the formation of different flower types in gerbera, particularly through the regulation of stamen development arrest and organ identity differentiation [36]. Additionally, B-class and E-class genes of MADS-box might be essential in controlling the development of various ray floret types in chrysanthemum (Chrysanthemum × morifolium) [37].
Marigold, a commercially valuable plant in the Asteraceae family, is known for its ornamental and economic values. Its capitulum typically features two types of florets: peripheral ray florets and central disc florets [5]. Ray florets boast larger, more abundant petals with distinctive lobes and ruffles [38], yet they are sterile and devoid of stamens, rendering the floral structure incomplete. In contrast, disc florets are fertile. Marigold is a diploid plant with a clear genetic background, a short growth cycle [39], whole-genome information [40], and an efficient genetic transformation system. Therefore, marigold represents an exemplary material for investigating the floral organ development of ray florets and disc florets in Asteraceae. Up to now, a transcriptomic analysis has identified 31 unigenes as MADS-box transcription factors; however, the full complement of MADS-box genes in this species remains unknown [41]. Several key MADS-box genes within the ABCDE model have been studied, including five AP1/FUL-like genes [42], five AP3/PI-like genes [43], four AG-like genes [44], and five SEP-like genes [5]. However, other genes have not yet been thoroughly investigated, and comprehensive genome-wide identification of MADS-box family genes in marigold has not been reported to date. As whole-genome sequencing technology advances, an increasing number of plants are being used to identify MADS-box genes at the genome-wide level and analyze sequencing data using various bioinformatics tools. To delve deeper into the conservation and divergence of expression patterns among MADS-box genes in marigold, we identified MADS-box genes based on the marigold genome and analyzed their expression pattern.
In this study, we identified 65 MADS-box genes from the marigold genome, which were categorized into two types and further subdivided into 13 subfamilies. Additionally, we investigated their gene structure, conserved motifs, and performed analyses on gene duplication and synteny. Finally, we analyzed the expression patterns of type II genes in various organs using qRT-PCR. These results provide detailed insights into the marigold MADS-box family, highlighting the potential significance of differentially expressed genes in the formation of different floret types. Our research contributes to the study of gene function and trait control, facilitating advancements in marigold breeding and innovation.

2. Materials and Methods

2.1. Plant Material

The marigold inbred line M525B-1, characterized by a single whorl of ray florets at the periphery of the capitulum, was developed through 10 generations of self-crossing of M525B, a male fertile type isolated from the two-type line M525AB by He [41,44]. The plants were cultivated under natural conditions during the fall of 2022 at Huazhong Agricultural University, Wuhan, Hubei Province, China.

2.2. RNA Preparation

When the plants were in the florescence phase, we collected samples for tissue-specific expression analysis, including roots, stems, leaves, receptacles, bracts, seeds, flower buds with diameter of 0–1 mm (ray florets and outermost disc florets primordia formed), flower buds with diameter of 4–5 mm (stamens of outermost disc florets developed), and mature flower (floret organs were mature) [43]. Additionally, floral organs collected from disc florets include sepals, petals, stamens, pistils, and ovaries, while ray florets include sepals, petals, pistils, and ovaries. All plant materials were rapidly frozen in liquid nitrogen and subsequently stored at −80 °C for further RNA extraction. Total RNA was isolated using the Quick RNA Isolation Kit (Aidlab, Beijing, China). The concentration of the RNA was verified with a NanoDrop 2000c (Thermo Fisher Scientific, Waltham, MA, USA), and the quality was assessed on a 1% agarose gel, and cDNA was synthesized using the FastQuant RT Kit (Vazyme, Nanjing, China).

2.3. Identification of MADS-Box Genes in Marigold

The genome and protein sequences of marigold were all obtained from the NCBI database (Tagetes erecta genome assembly: GCA_026213115.1, https://www.ncbi.nlm.nih.gov/datasets/genome/GCA_026213115.1/, accessed on 29 December 2023) [40]. MADS-box genes in the marigold genome were identified using the hidden Markov model (HMM) profile via the HMMER version 3.3.2 program (http://hmmer.org, accessed on 30 December 2023) [45]. We utilized the HMM profile ‘SRF-type transcription factor (PF00319)’, obtained from the Pfam version 36.0 database (http://pfam.xfam.org, accessed on 30 December 2023) [46], to search the complete set of marigold proteins, resulting in the identification of 65 candidate MADS-box genes. Further, we searched for conserved domains within the protein via the Conserved Domain Database (https://www.ncbi.nlm.nih.gov/cdd/, accessed on 30 December 2023) [47] to confirm the presence of MADS-box domains in all candidate genes.
The online tool ProtParam (http://web.expasy.org/protparam/, accessed on 31 December 2023) [48] was employed to predict the physicochemical properties of the proteins encoded by the MADS-box genes of marigold, including amino acid lengths, molecular weights, theoretical isoelectric points, the instability index, and the aliphatic index. The online tool Plant-mPLoc version 2.0 (http://www.csbio.sjtu.edu.cn/bioinf/plant-multi/, accessed on 31 December 2023) was used to analyze subcellular localization [49].

2.4. Maximum Likelihood Phylogeny of MADS-Box Genes

The sequences of arabidopsis MADS-box family proteins [15] were obtained from TAIR (http://www.arabidopsis.org/, accessed on 1 January 2024) [50]. The sequences of lettuce MADS-box family proteins [35] were obtained from the Phytozome version 12 database (http://phytozome.jgi.doe.gov, accessed on 1 January 2024) [51]. The TM8 protein sequence [52] was downloaded from the NCBI protein database (https://www.ncbi.nlm.nih.gov/protein/, accessed on 1 January 2024) [53].
The subfamily alignments of MADS-box protein sequences were created using marigold, lettuce, and arabidopsis protein sequences via MAFFT version 7.487 (https://mafft.cbrc.jp/alignment/software/, accessed on 2 January 2024) [54,55]. Subsequently, a maximum likelihood phylogenetic tree was constructed using IQ-TREE version 1.6.12 software (http://www.iqtree.org/, accessed on 3 January 2024) with the best-fit model JTT + F + R8, as determined by the program [56,57]. The consistency of the phylogenetic estimate was evaluated using Ultrafast bootstraps with 10,000 replicates and SH-aLRT with 1000 replicates [58,59,60]. The MADS-box proteins were categorized into type I and type II according to their phylogenetic relationships with arabidopsis and lettuce. To further categorize the TeMADS proteins, we constructed maximum likelihood phylogenetic trees for type I and type II proteins independently, following the same procedure (best-fit model of type I: JTT + F + R4; best-fit model of type II: JTT + F + R7). Visualization of these phylogenetic trees was performed using the iTOL version 6.9 program (https://itol.embl.de/, accessed on 4 January 2024) [61].

2.5. Gene Structure and Conserved Motif Analysis

The GSDS version 2.0 online tool (http://gsds.gao-lab.org/, accessed on 6 January 2024) [62] was utilized to display the exon and intron composition based on the marigold genome annotation file, displaying the structure of the MADS-box genes. To identify conserved motifs in the TeMADS proteins, the MEME version 5.5.5 online tool (http://meme-suite.org, accessed on 4 March 2024) was employed [63]. The parameters were set to allow any number of repetitions, a maximum of 10 motifs, a minimum motif width of 6, and the default maximum motif width of 50, as both protein and DNA motifs are typically shorter than the default value [64]. The identified conserved protein motifs were subsequently annotated by Pfam database.

2.6. Chromosomal Locations, Gene Duplication and Synteny Analysis

The genomic locations of 65 identified genes were mapped onto the 12 chromosomes of marigold using MG2C version 2.1 online tool (http://mg2c.iask.in/mg2c_v2.1/, accessed on 5 January 2024) [65], according to their chromosomal locations. Analysis of segmental and tandem duplication events in TeMADS genes was conducted using MCScanX version 1.1.11 software (https://github.com/wyp1125/MCScanX, accessed on 21 March 2024) with default parameters [66].
Additionally, we downloaded the genome files for arabidopsis (http://www.arabidopsis.org/, accessed on 2 April 2024) and lettuce (https://genomevolution.org/coge/, accessed on 2 April 2024). Then, we used MCScanX to identify the synteny relationships among MADS-box genes obtained from marigold, arabidopsis and lettuce.

2.7. Expression Analysis of MADS-Box Genes in Marigold

The quantitative real-time PCR (qRT-PCR) experiment was conducted using the SYBR Green Master Mix (Yeasen, Shanghai, China) with three technical replicates per sample, and the analysis was performed on the QuantStudio™ 6 Flex Real-Time PCR System (Thermo Fisher Scientific, Waltham, MA, USA). The marigold β-actin gene was used as an internal reference to normalize gene expression data for marigold [67]. All primers were designed by Primer Premier version 5.0 (https://www.premierbiosoft.com/primerdesign/, accessed on 2 February 2024) software and are shown in Table S1. The relative expressions were analyzed using the 2−ΔΔCt method and visualized in a heatmap after data normalization [68].
First, we analyzed the expression of marigold type II genes in roots, stems, leaves, receptacles, bracts, seeds, flower buds with diameter of 0–1 mm, flower buds with diameter of 4–5 mm, and mature flowers. Further, we selected genes with normalized expression values greater than 0.5 in mature flowers and the genes belonging to the ABCDE model. We analyzed their expression in different organs of disc florets (sepals, petals, stamens, pistils, and ovaries) and ray florets (sepals, petals, pistils, and ovaries) to explore differences in gene expression between these two types of florets.

2.8. Analysis of MADS-Box Protein Interacting Network

We uploaded the TeMADS protein sequences to the STRING version 12.0 database (https://cn.string-db.org/, accessed on 24 April 2024) for analysis [69], using arabidopsis as a reference, and set the confidence (score) to medium (0.400) to establish a relatively comprehensive network for subsequent in-depth analysis. The protein–protein interaction network was visualized by Cytoscape version 3.10.2 software (https://cytoscape.org/, accessed on 24 April 2024) [70].

3. Results

3.1. Identification and Characterization of MADS-Box Genes in Marigold

Based on the HMM profile and the conserved domains, 65 MADS-box genes were identified from the marigold genome database (Table S2). These genes were sequentially renamed from TeMADS1 to TeMADS65 based on their positional information in the genome and subjected to further analyses of their detailed characteristics (Table S3). The results showed that the protein length ranged from 61 (TeMADS20, TeMADS48) to 821 (TeMADS52) amino acids, and the molecular weights varied from 6.83 kD (TeMADS48) to 93.21 kD (TeMADS52). Additionally, fifty-five MADS-box proteins exhibited alkaline properties, with isoelectric points exceeding 7.5, while seven proteins were classified as acidic, having PI values below 6.5. Only three proteins fell within the intermediate range of 6.5 to 7.5. Analysis of the instability index revealed that the majority of TeMADS proteins were unstable, with indices exceeding 40, whereas only eight proteins had instability indices below this threshold. Aliphatic index analysis showed that most of TeMADS protein were hydrophilic proteins, with an aliphatic index less than 100, except for TeMADS4, TeMADS19, and TeMADS39. Moreover, subcellular localization analysis showed that all TeMADS proteins were present in the nucleus (Table S3).

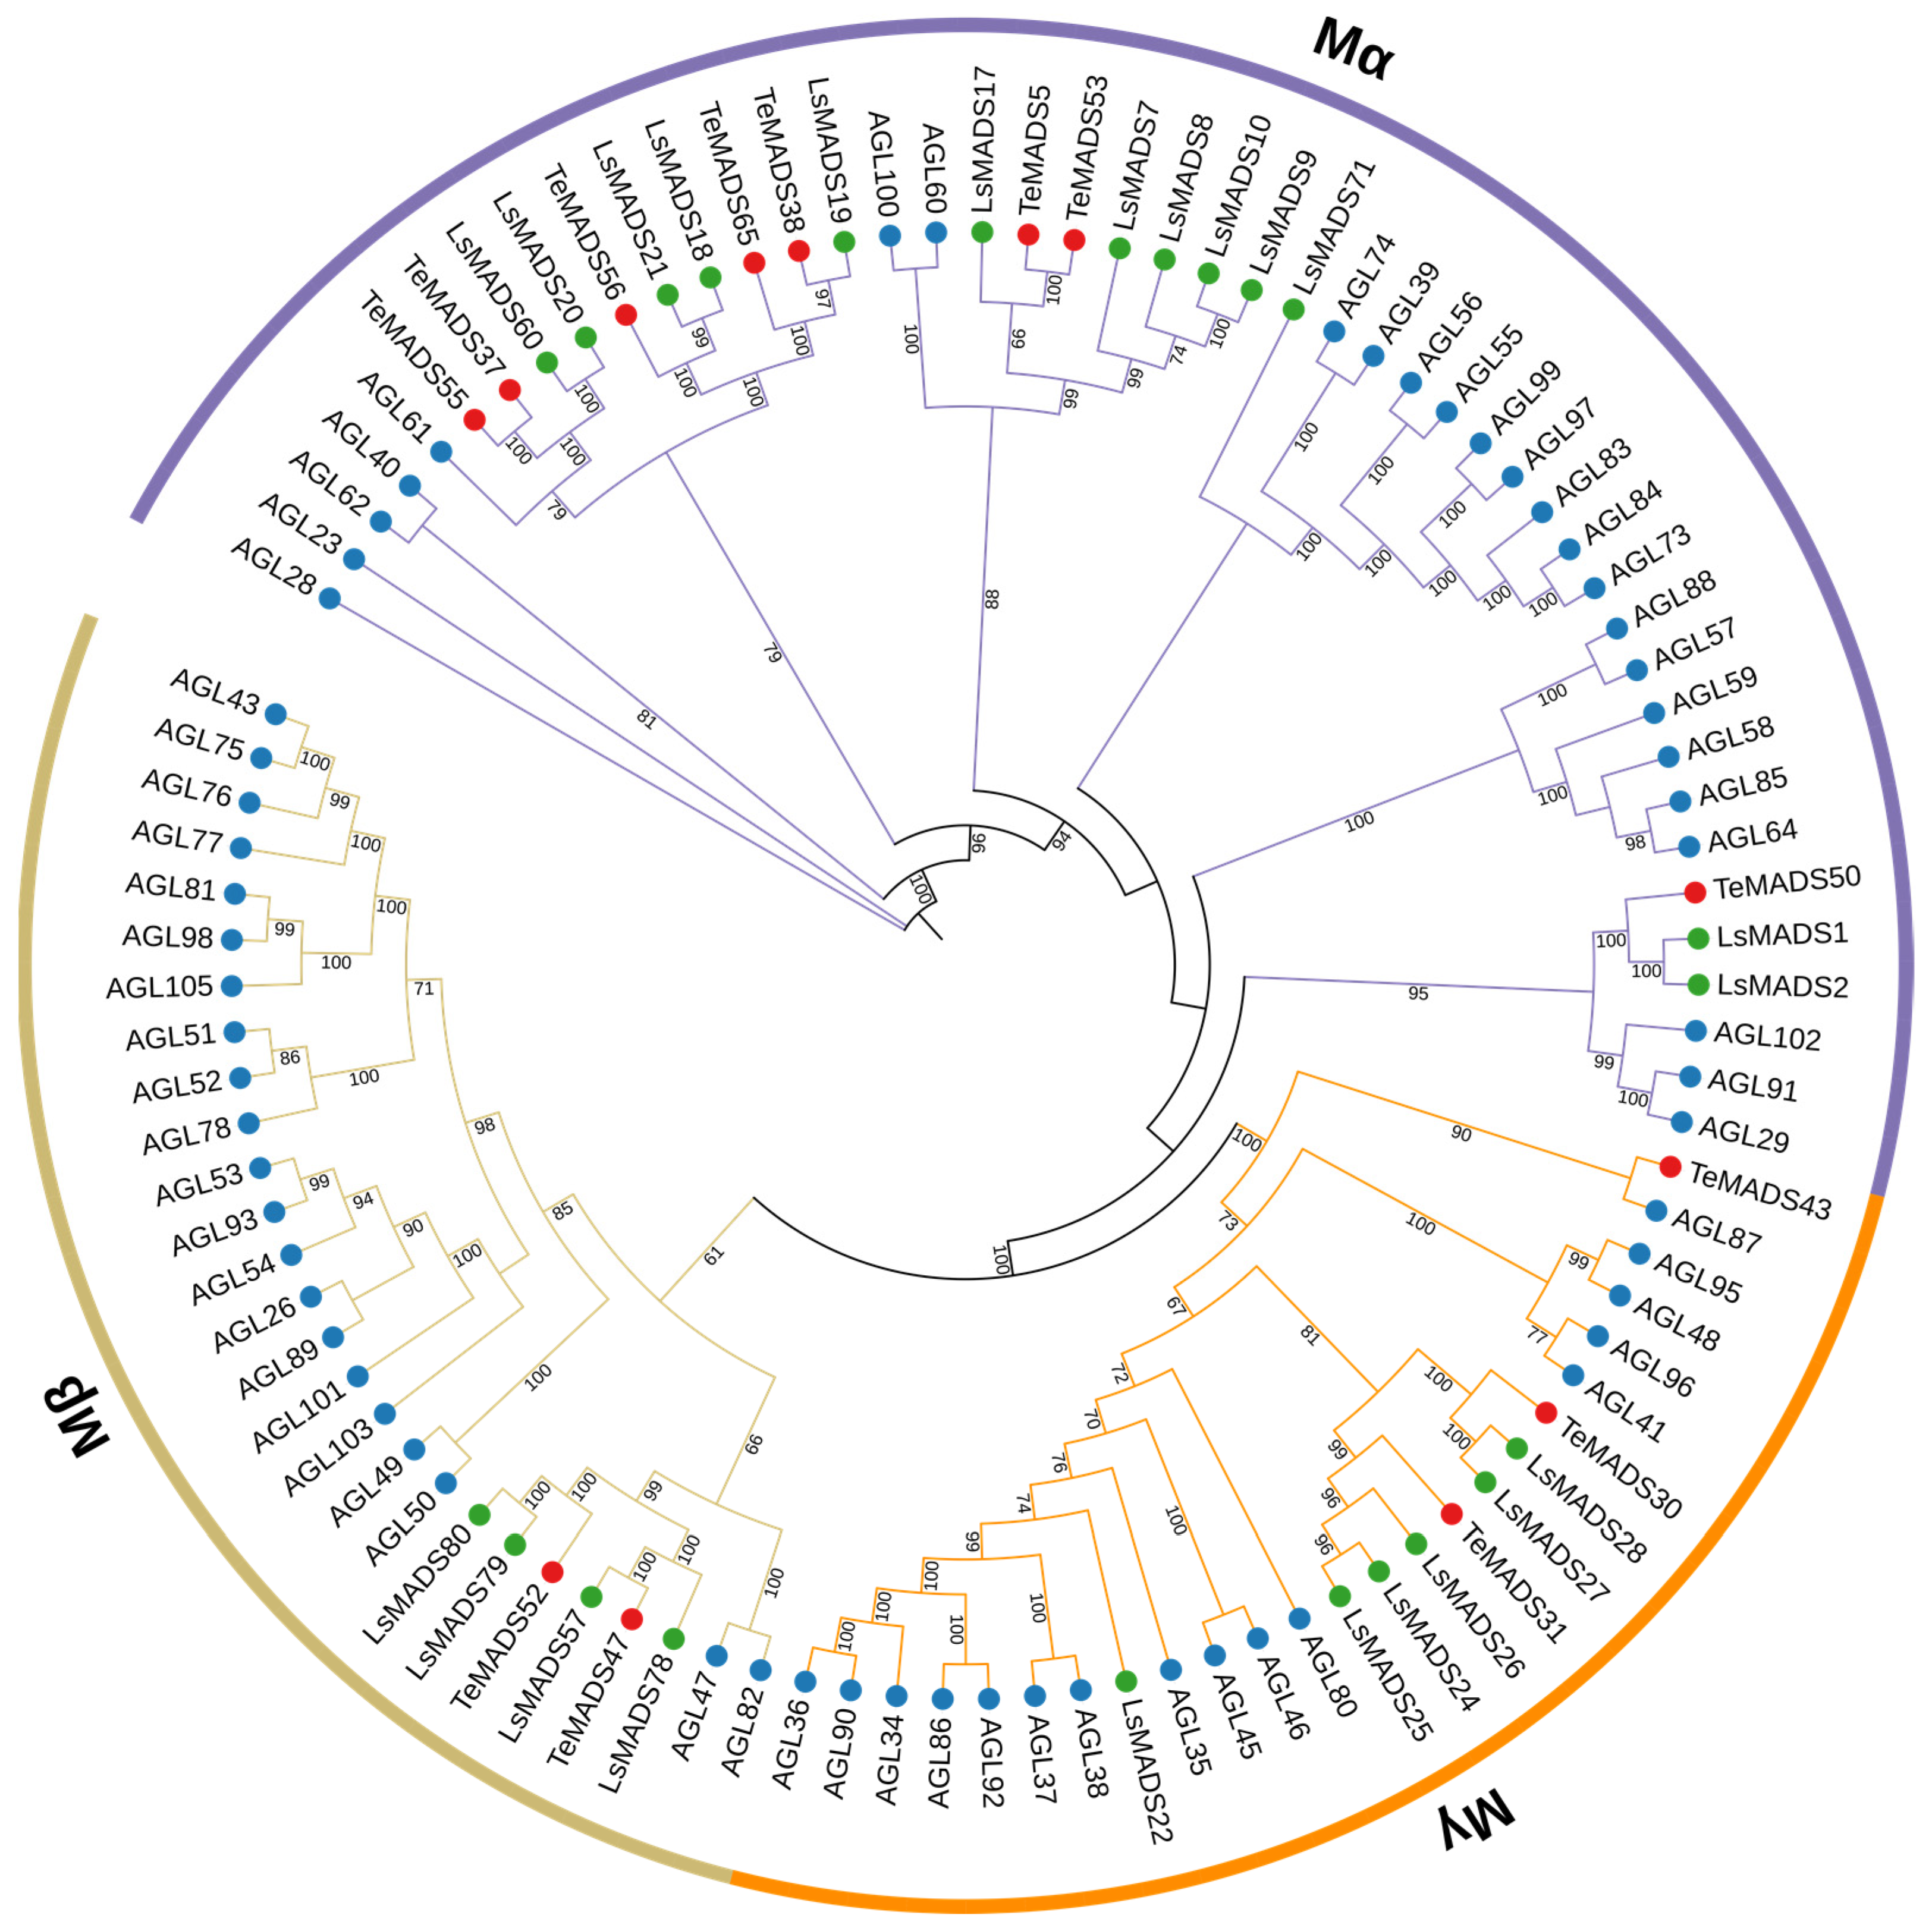
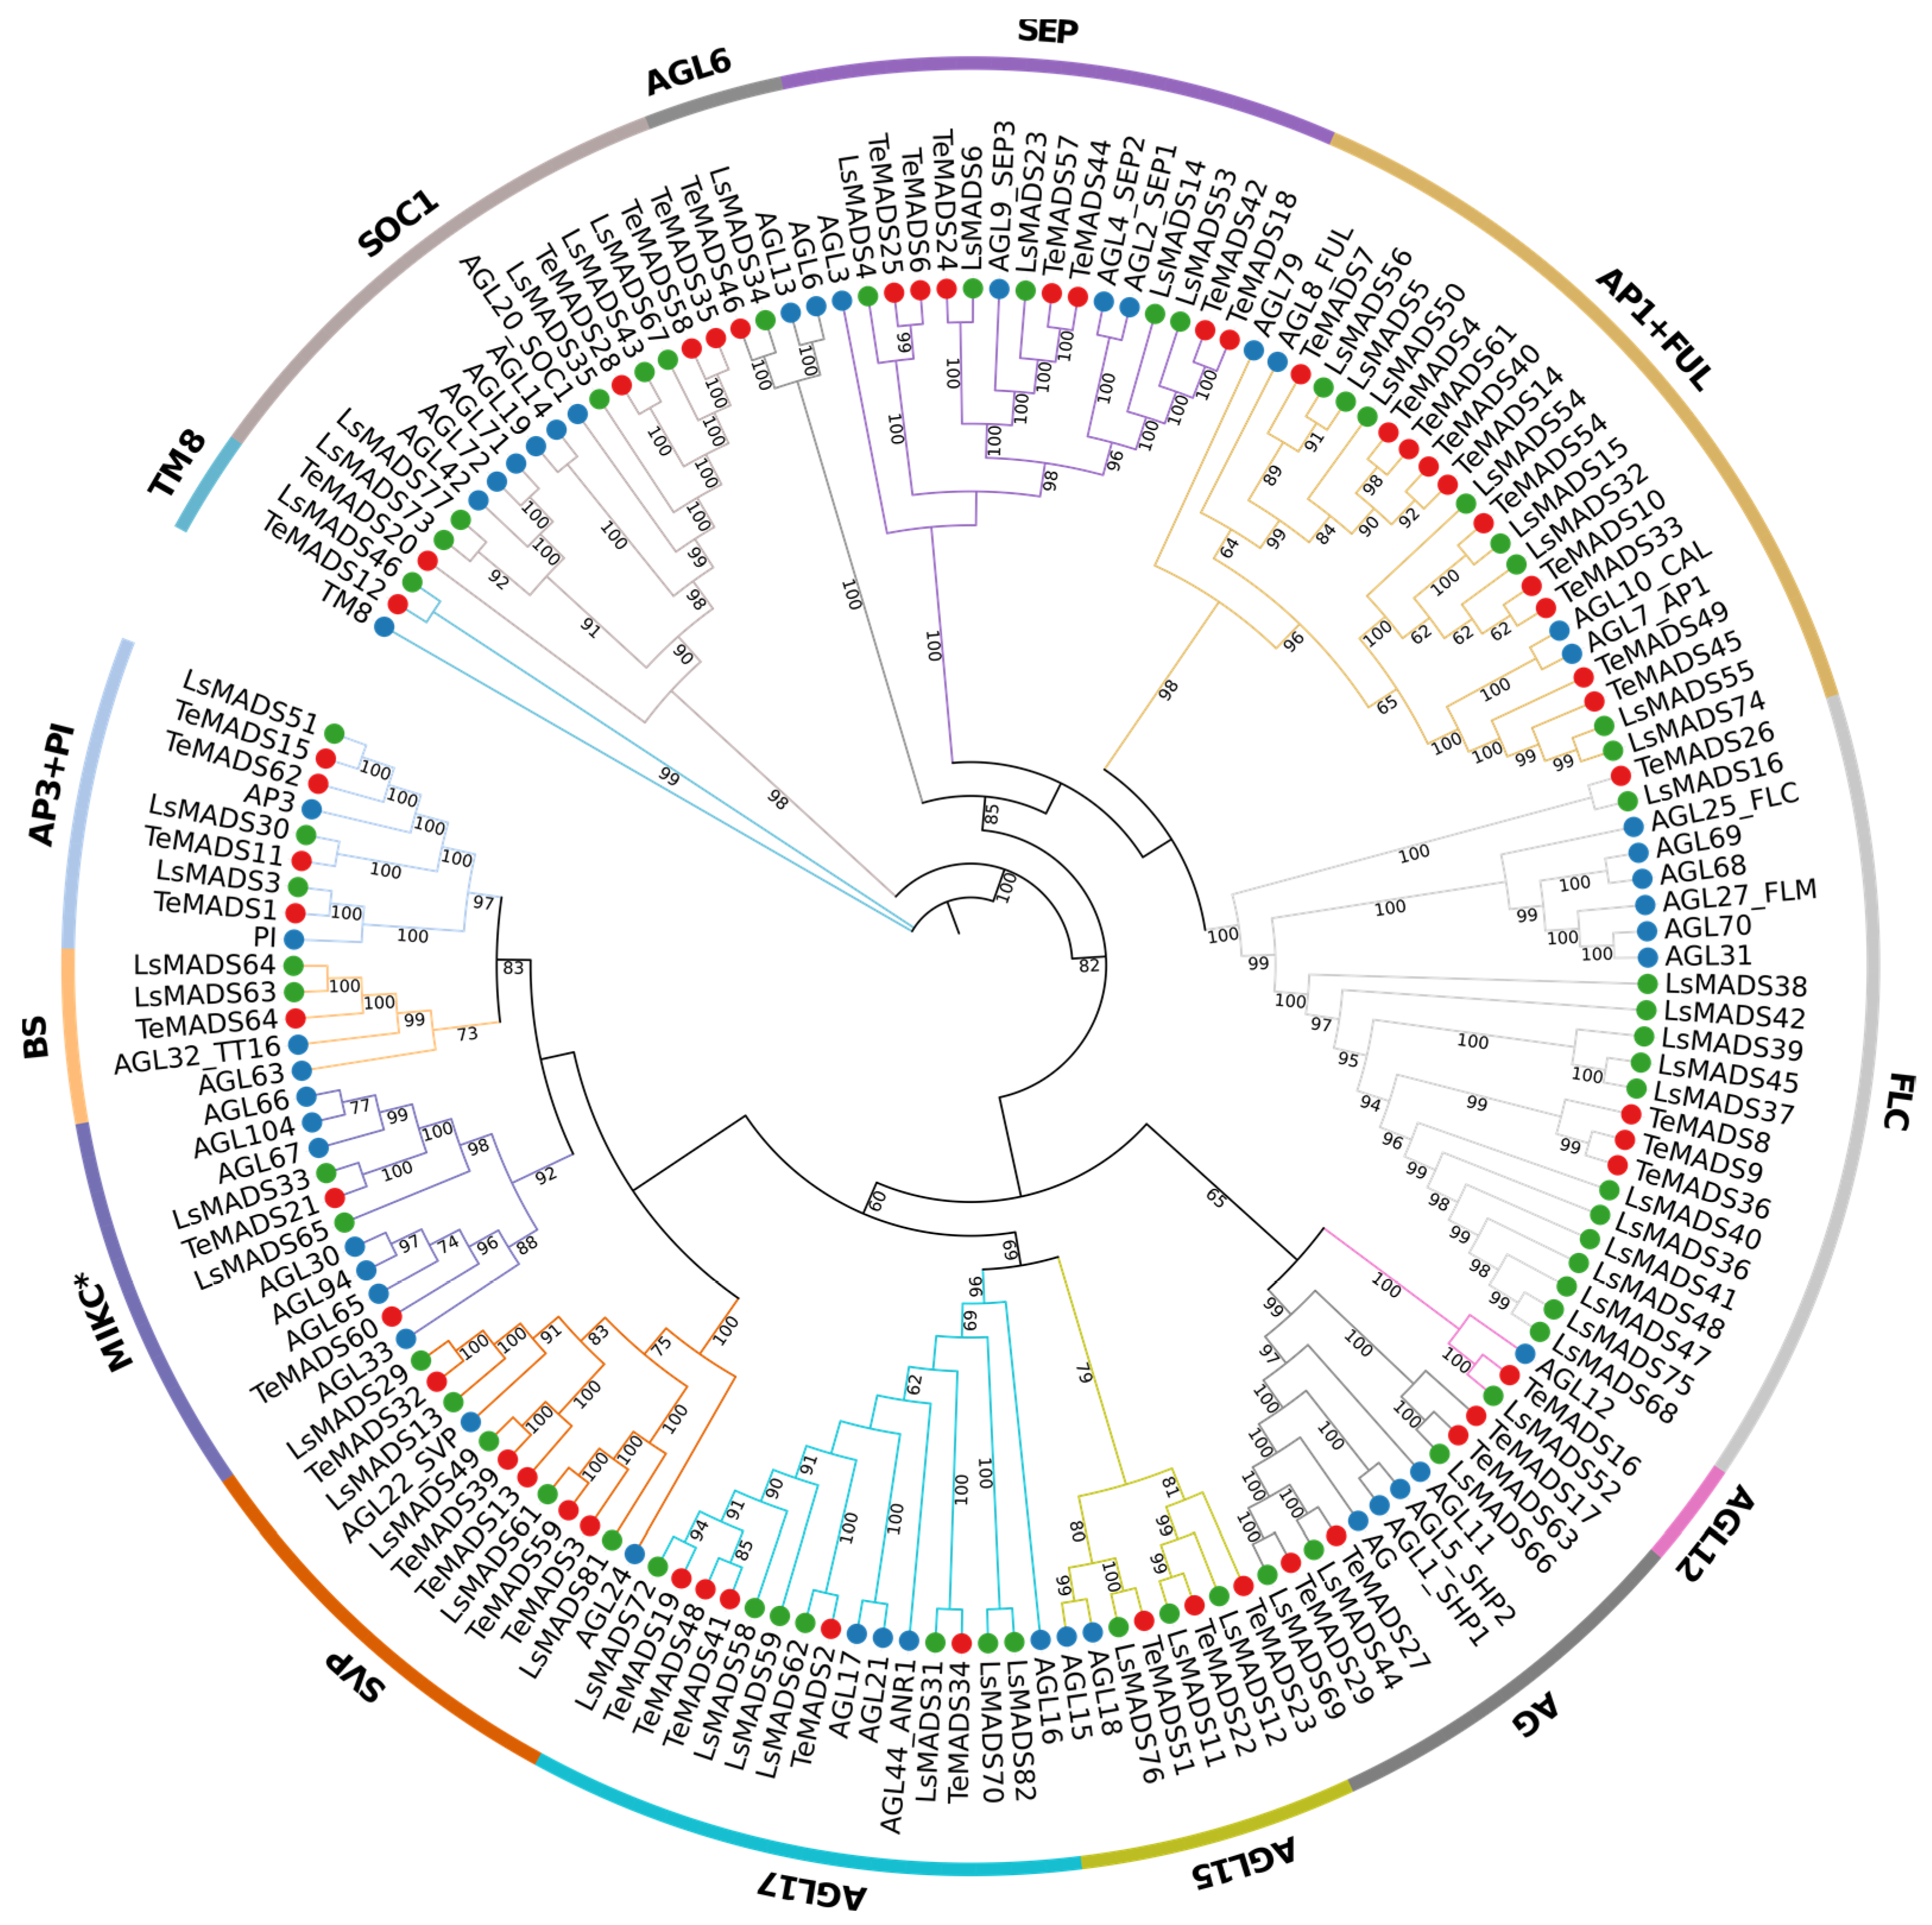
3.2. Phylogenetic Analysis of MADS-Box Genes in Marigold

To analyze the phylogenetic relationships, we constructed a maximum likelihood phylogenetic tree of all MADS-box proteins from arabidopsis, lettuce, and marigold, and TM8 protein from tomato. Phylogenetic analysis classified the TeMADS genes into 13 type I genes and 52 type II genes. The type I genes in marigold were further classified into the Mα (8 genes), Mβ (2 genes), and Mγ (3 genes) subclasses (Figure 1). And the type II genes were further classified into MIKCC (50 genes) and MIKC* (2 genes). Among the MIKCC genes, there were 13 distinct subfamilies, including TM8 (1), SOC1 (4). AGL6 (1), SEP (7), AP1/FUL (10), FLC (4), AGL12 (1), AG (4), AGL15 (3), AGL17 (5), SVP (5), BS (1), and AP3/PI (4) (Figure 2). Among these subfamilies, 13 subfamilies were presented in marigold and lettuce, suggesting a certain degree of conservation of MADS-box genes. However, the number of genes in each subfamily varied across species, indicating functional diversification within the MADS-box gene family during evolution.

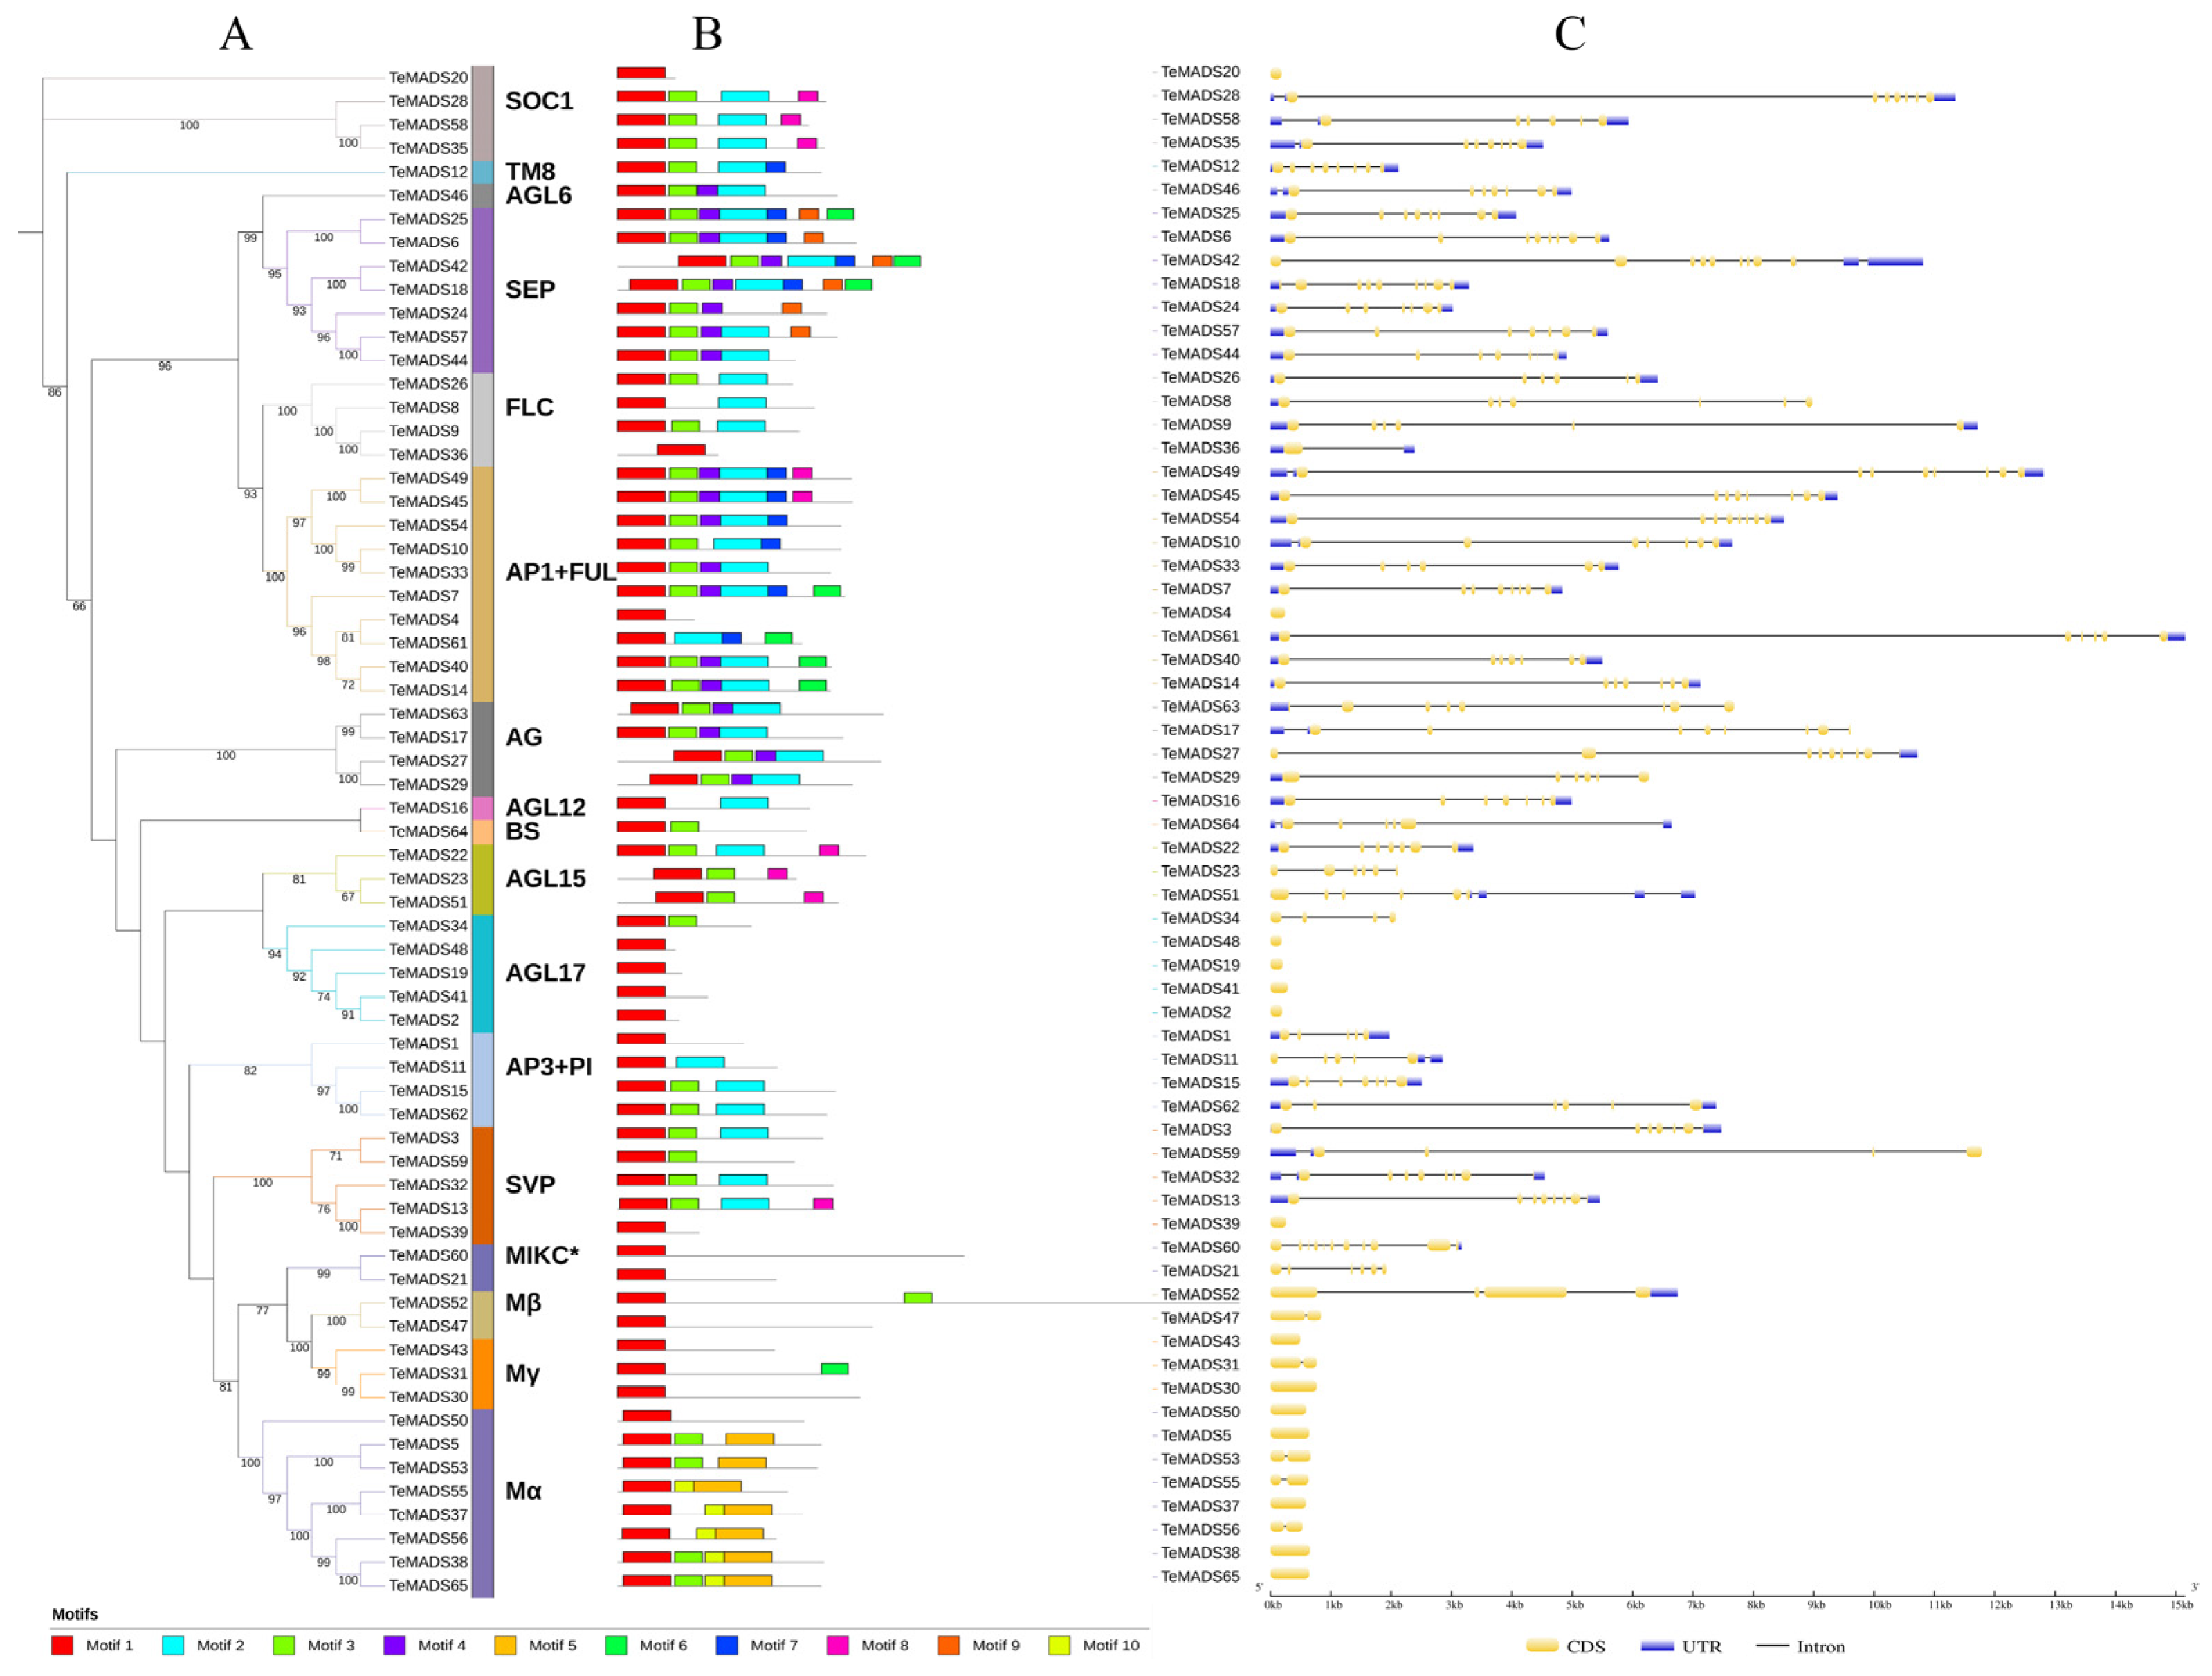
3.3. Gene Structure and Conserved Motif Analysis

To assess the diversity and similarity of TeMADS genes, we investigated the gene structure (Figure 3C) and conserved motifs (Figure 3B) of TeMADS proteins, and displayed their exon–intron structures and motifs in a diagram based on phylogenetic relationships established using the maximum likelihood method (Figure 3A).
The gene structures were analyzed to explore the structural diversity and evolution of the 65 MADS-box genes in marigold. As illustrated in Figure 3C, we obtained the intron–exon arrangement of each gene based on the marigold genome annotation file. The exon–intron structures differed between type I and type II genes. Type II genes contained multiple introns, except for AGL17 subfamily, whereas type I genes usually had no intron or a single intron, except for TeMADS52. In addition, the gene structures within the same subfamily tend to be relatively similar, although exceptions do exist, such as the TeMADS4 of the AP1/FUL subfamily.
To examine the characteristics of the MADS-box family and identify conserved motifs across various subfamilies in marigold, we employed MEME. Figure 3B illustrates the identification of 10 conserved motifs designated as Motifs 1–10; the motif sequences are shown in Table S4. Within each subfamily of MADS-box proteins, similar patterns of conserved motifs were observed. Notably, Motif 1 was found in all TeMADS proteins and was confirmed as the MADS-box domain through Pfam domain search. Motif 2, identified as the K-box domain, was exclusively found in the MIKCC group of type II genes, making it an important feature for distinguishing between type I and type II genes, as well as a key characteristic that differentiates MIKCC from MIKC*. Among the type II genes, most of the subfamilies of the MIKCC group contained more motifs, while the MIKC* group had only one motif, the MADS-box domain. Proteins from the same subfamily showed similar patterns of conserved motifs, indicating functional similarity and evolutionary conservation within each subfamily. For instance, the members of the AG subfamily were highly conserved, and all included only Motifs 1–4. Notably, the SEP subfamily and Mα group had their own unique characteristic motif; for example, Motif 9 only presented in the SEP subfamily, Motif 5 and Motif 10 only presented in the Mα group, implying that members of this subfamily may have distinct functional roles compared to those of other subfamilies.

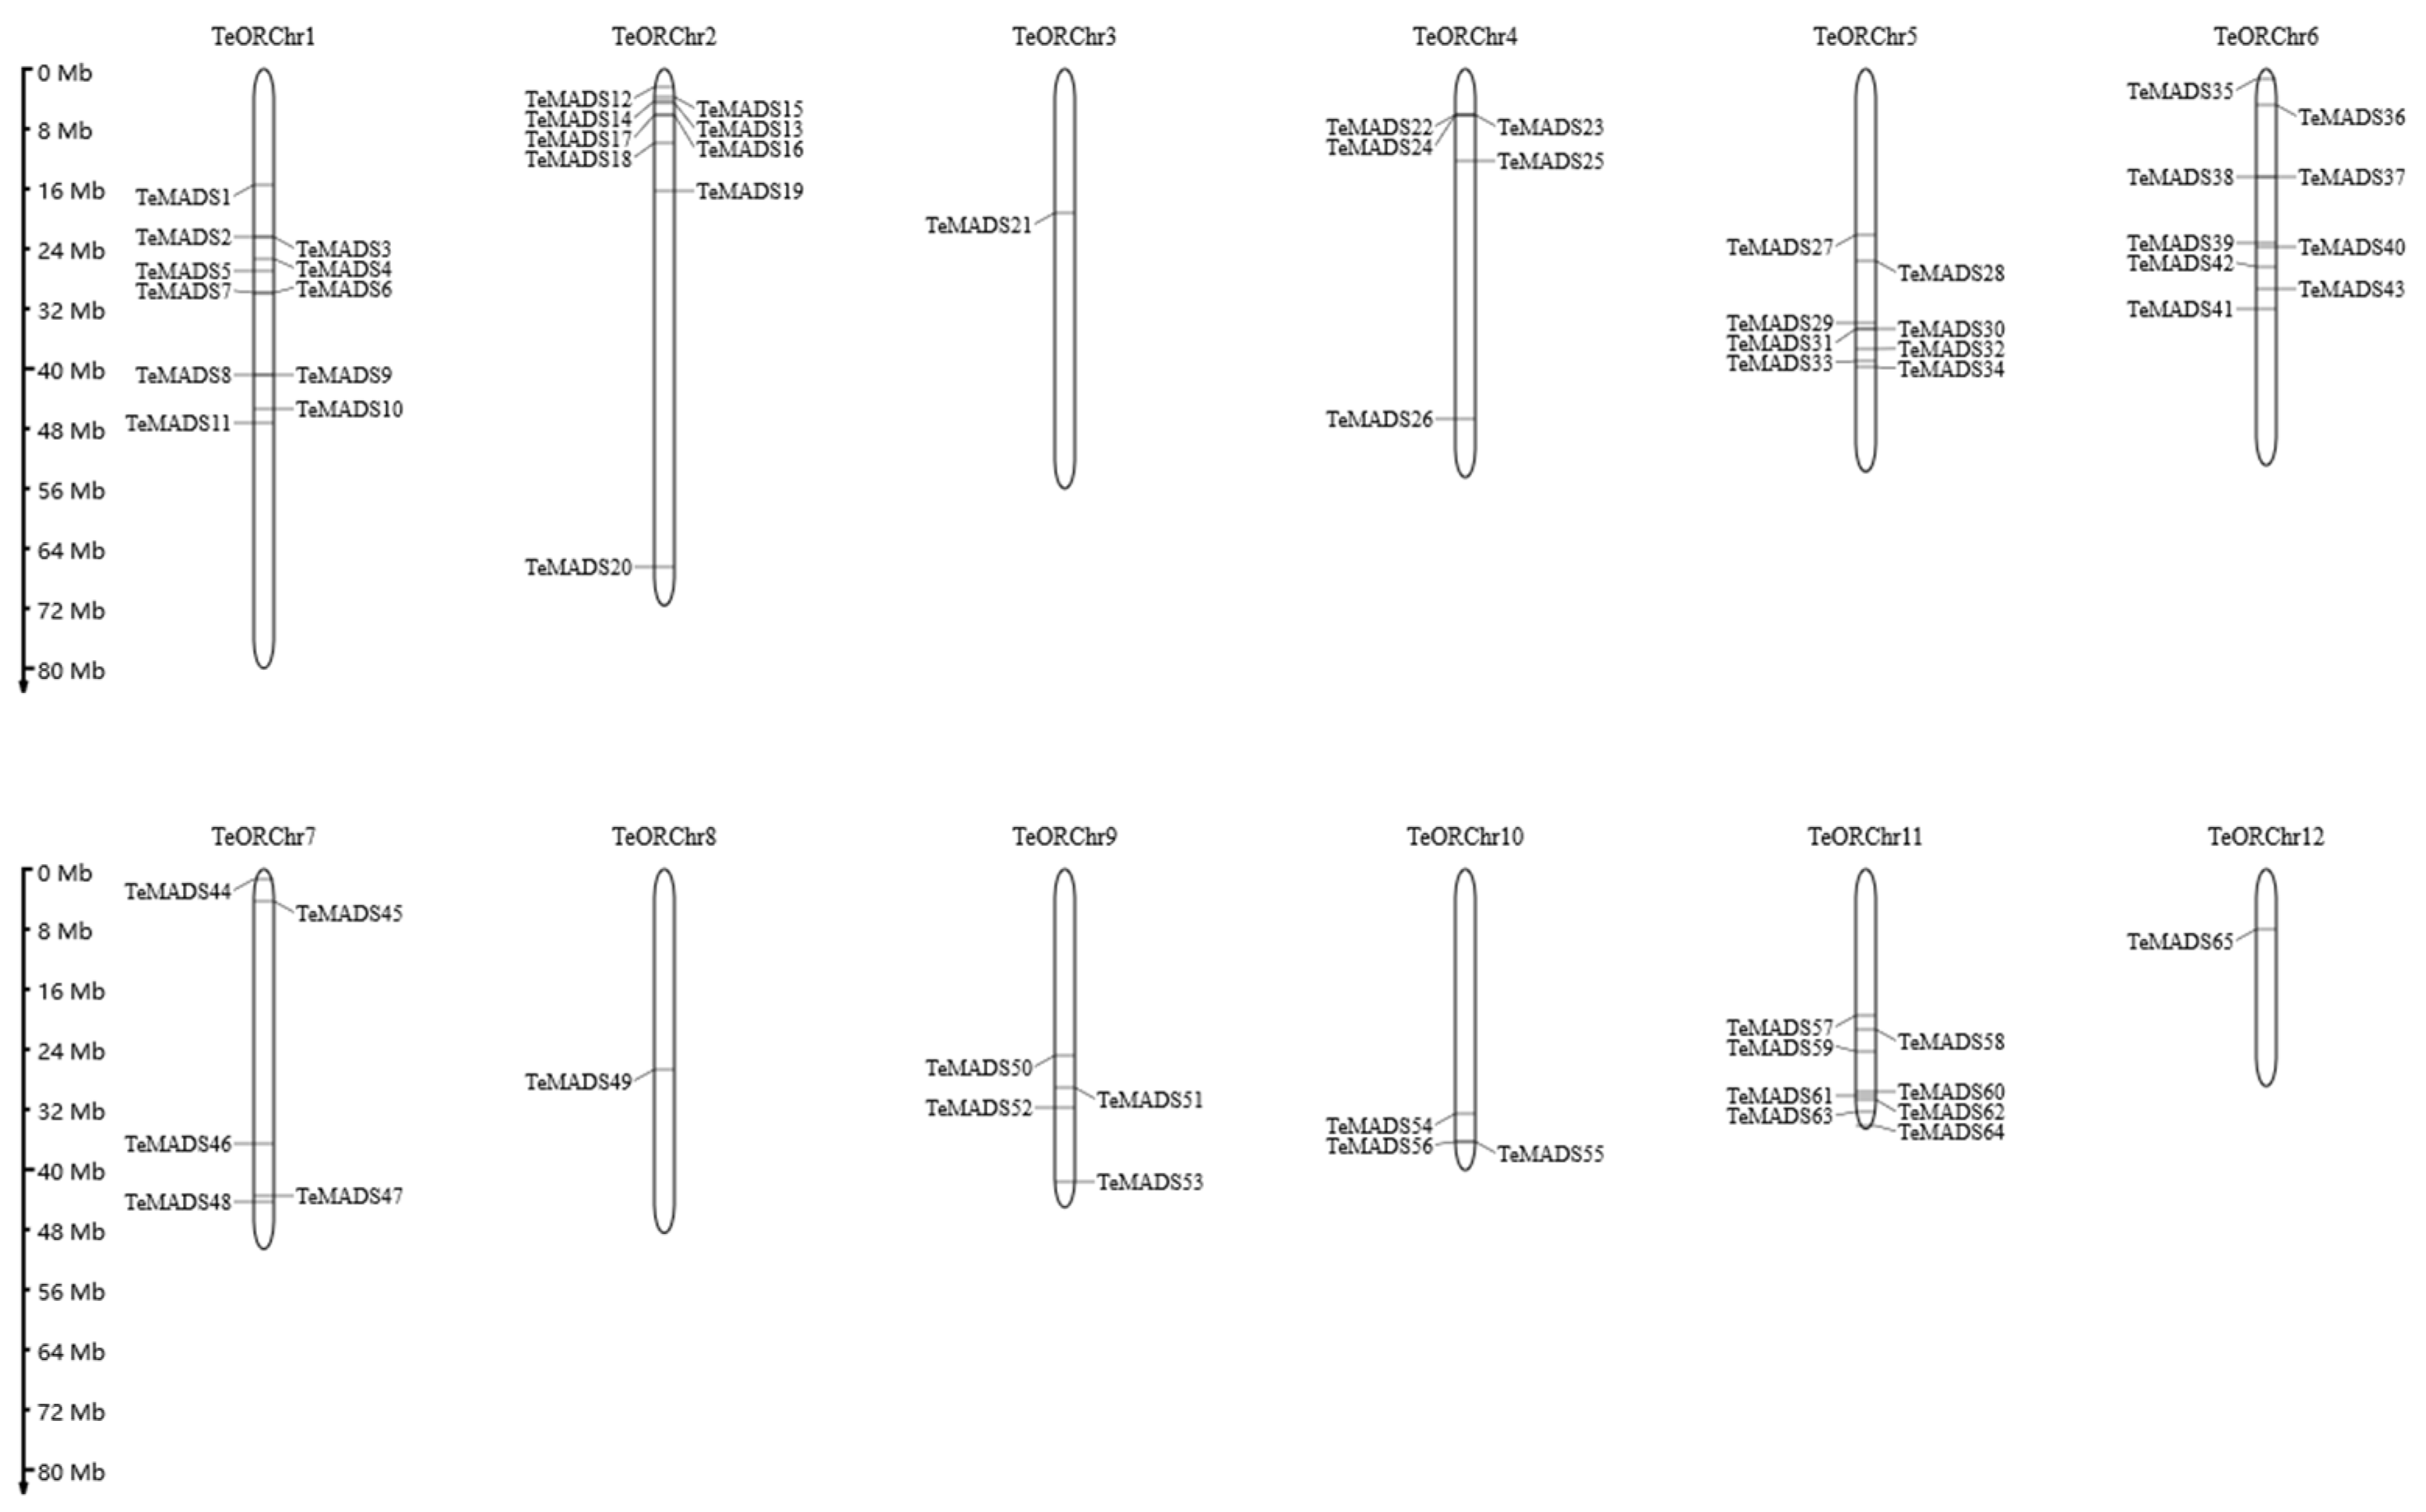
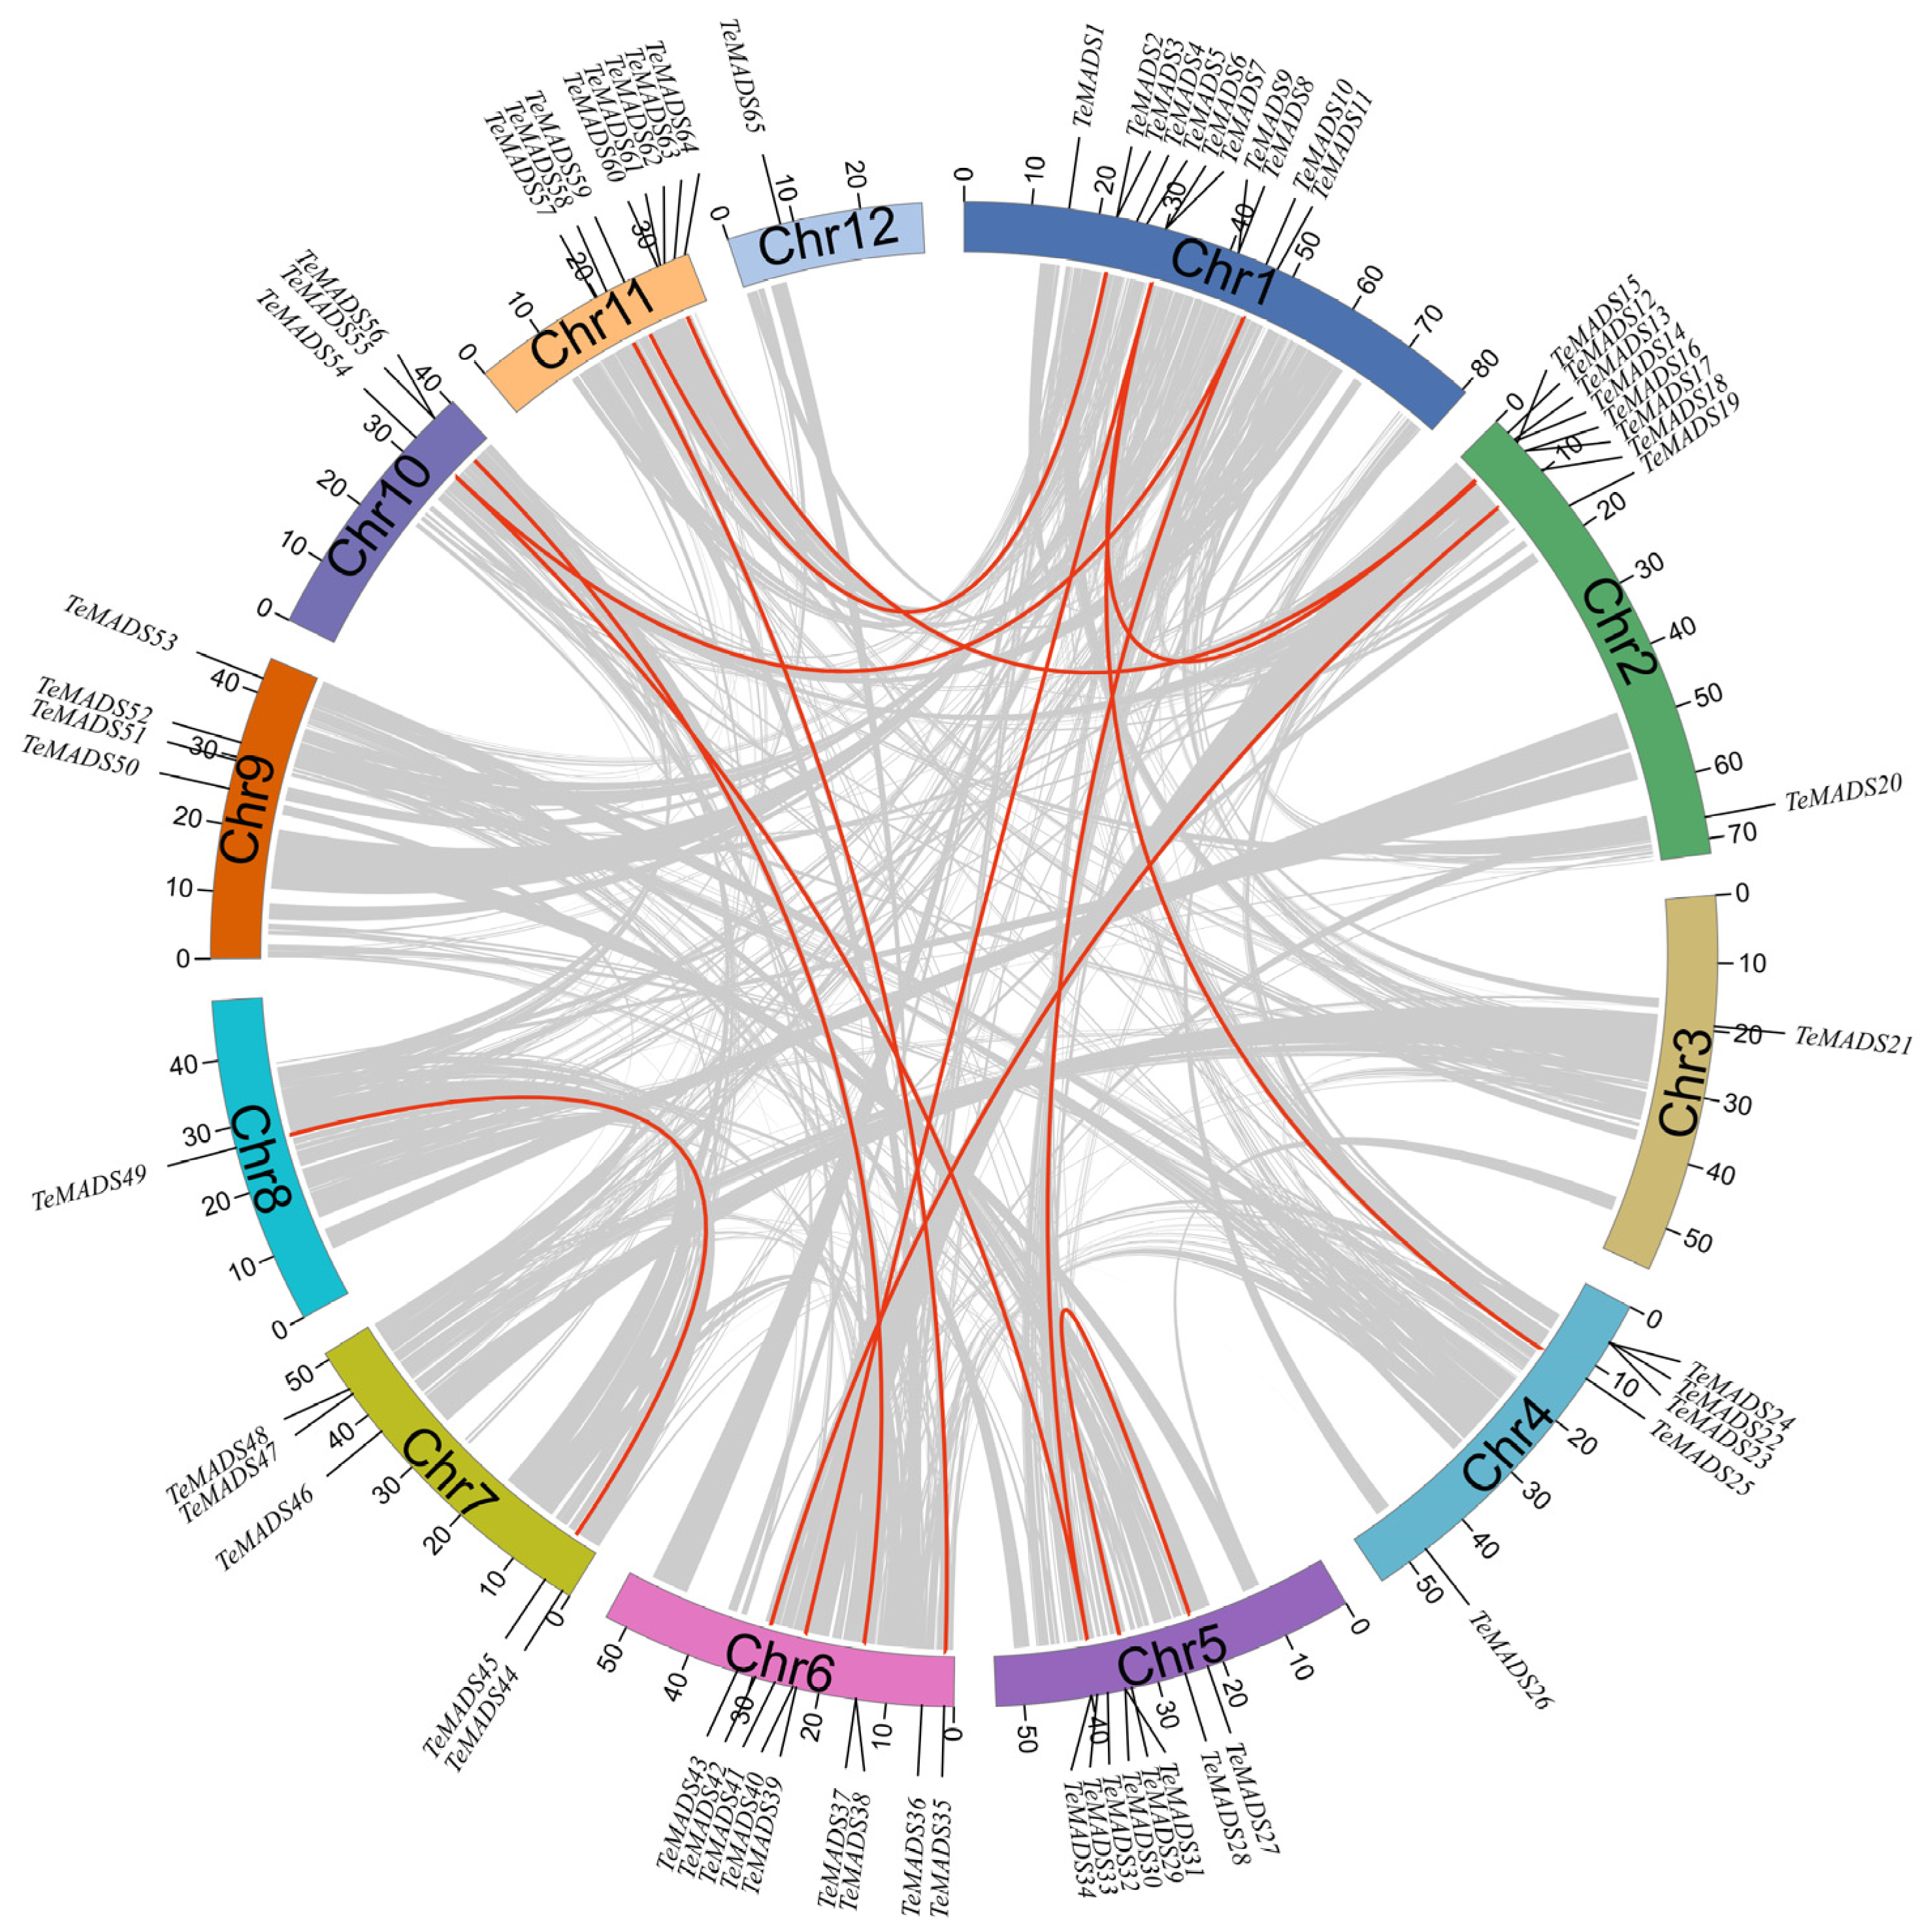
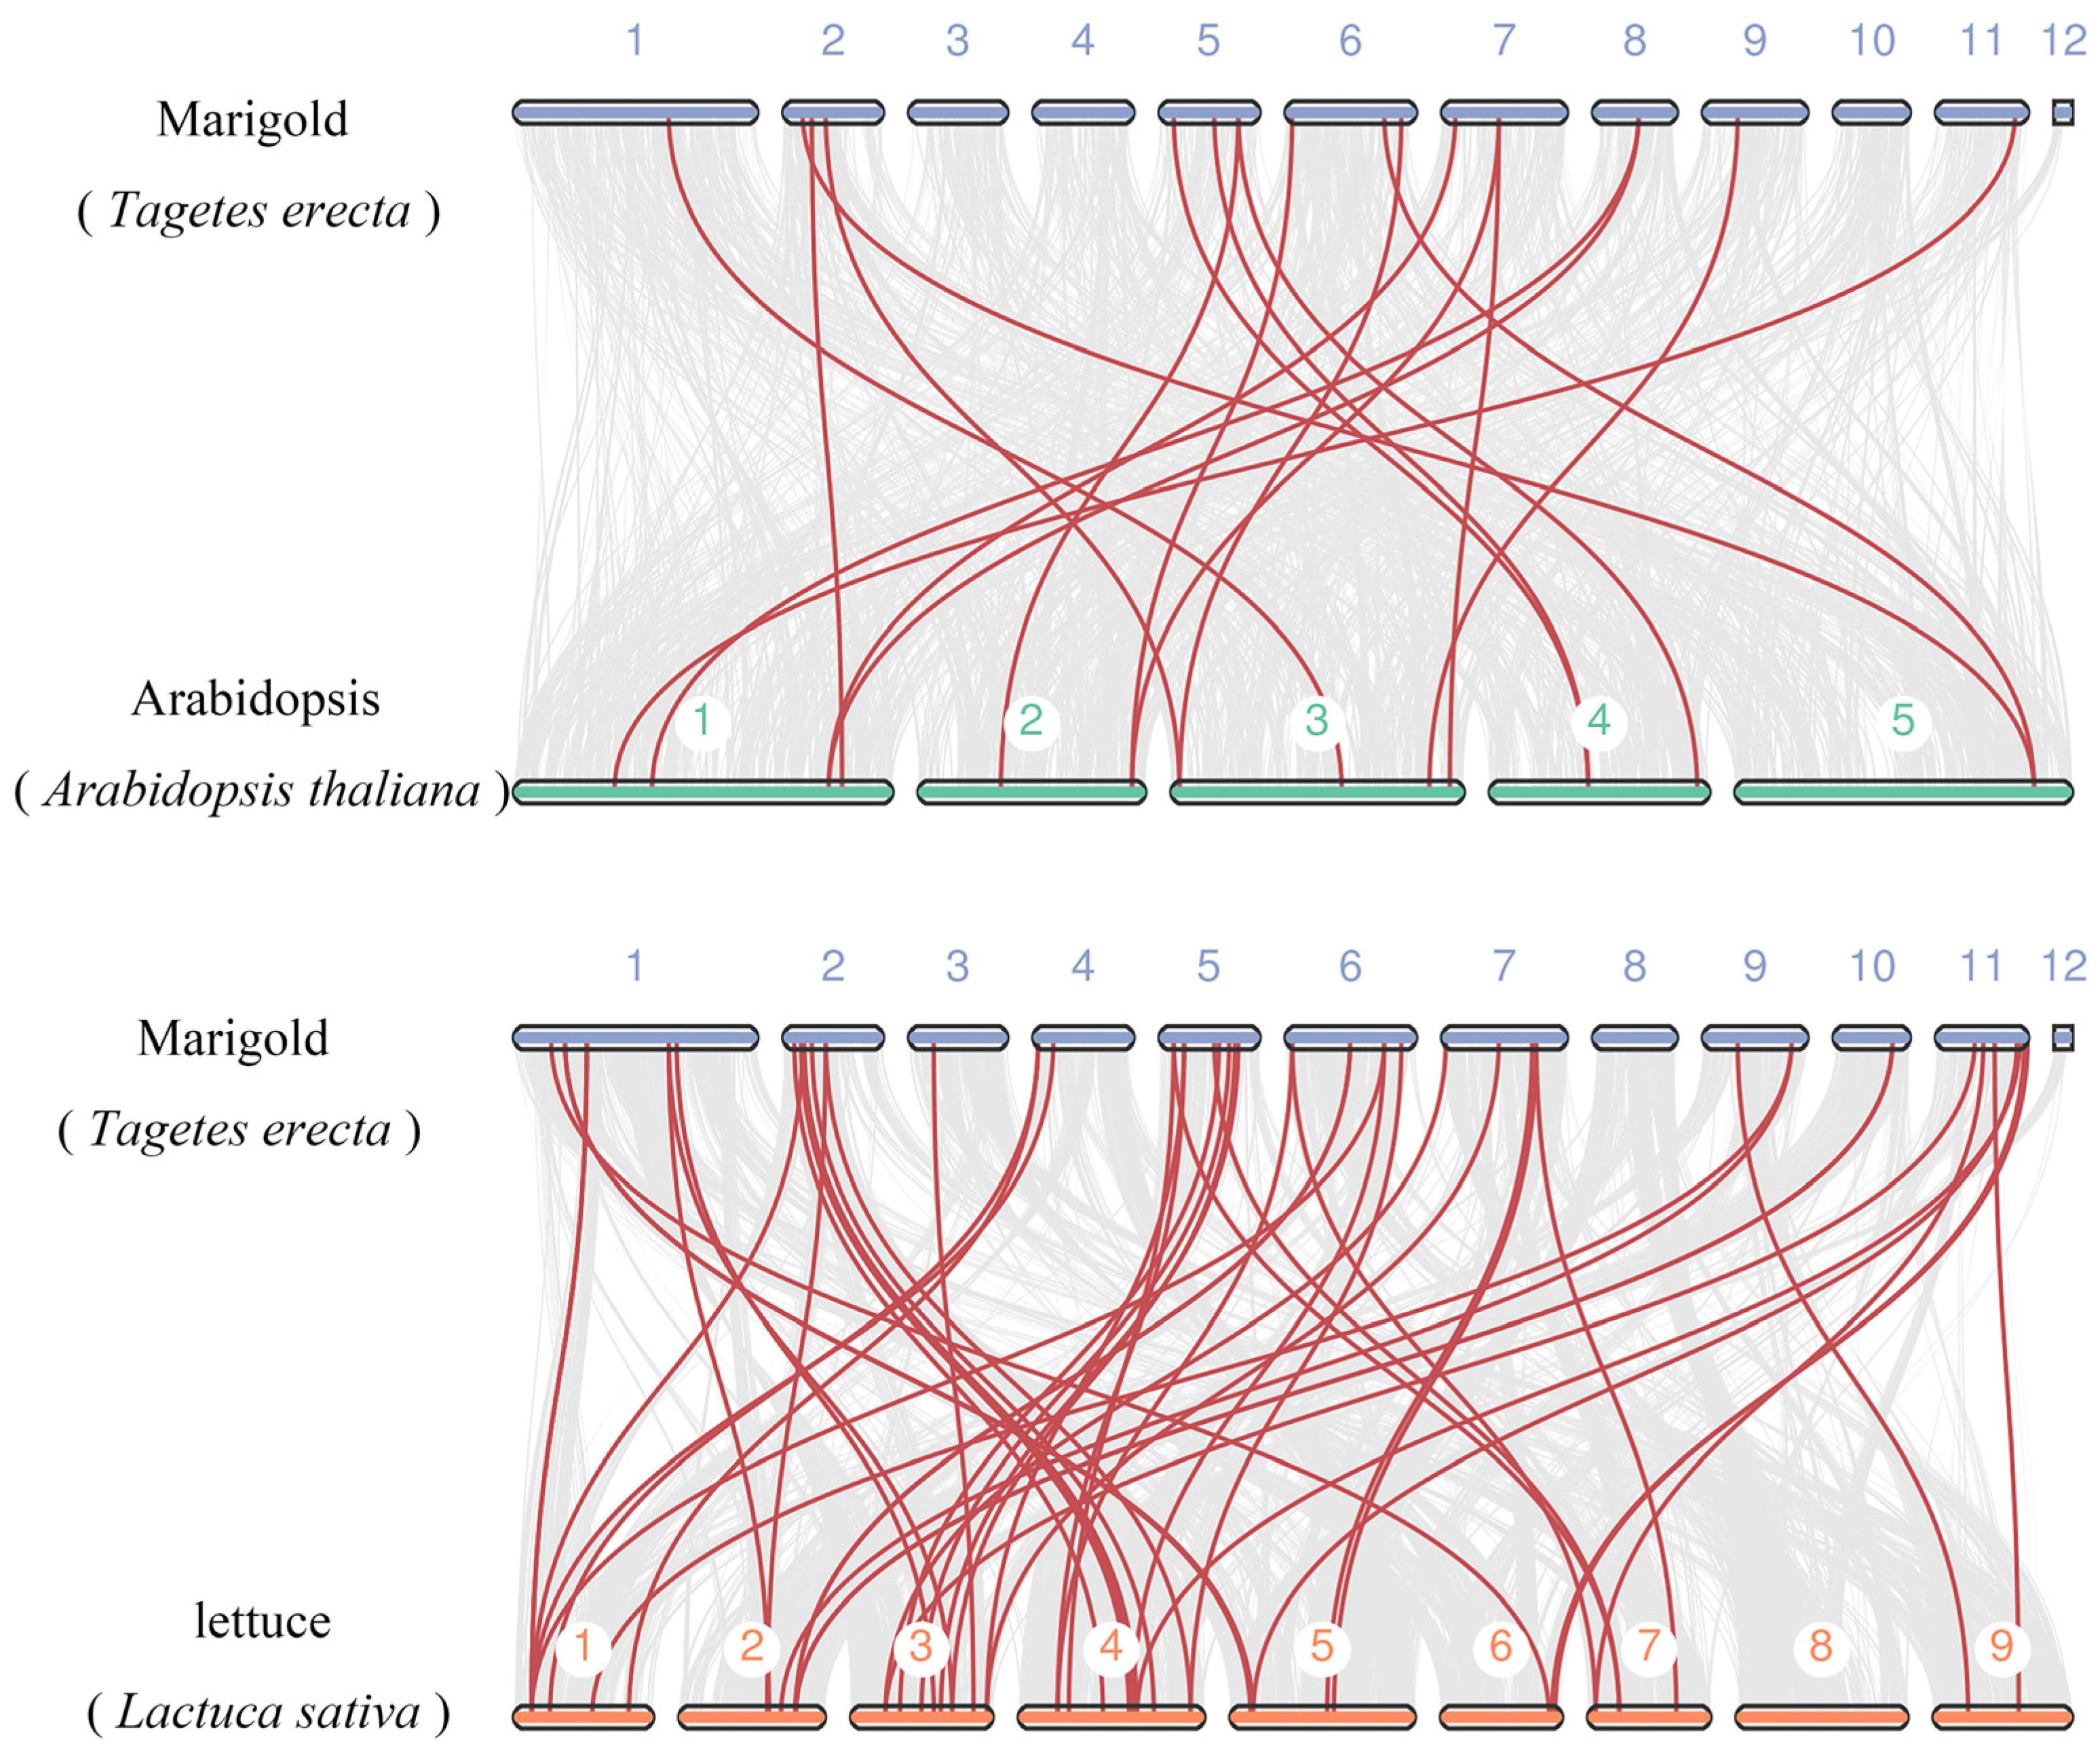
3.4. Chromosomal Locations, Gene Duplication, and Synteny Analysis

The TeMADS genes were distributed across the 12 chromosomes of the marigold (Figure 4). All marigold chromosomes contain MADS-box genes, and every chromosome has type II genes. However, the distribution of these genes was uneven. A higher abundance of MADS-box genes (11; 16.92%) in marigold was observed on chromosome (Chr) 1, whereas Chr3, Chr8, Chr12 had only one MADS-box gene.
To better explore the duplication of 65 MADS-box genes in marigold, we used MCScanX to search duplication events (Figure 5). A total of 14 syntenic pairs were distributed across 9 chromosomes, with the majority located on Chr1 and Chr6. Gene duplication may serve as a primary driving force in the evolution of the MADS-box gene family.
To investigate the evolutionary processes of MADS-box genes in the marigold genome and to better understand the dynamics of their evolution, synteny analysis was performed among marigold, arabidopsis, and lettuce to explore the evolutionary history of these genes. (Figure 6). In the synteny analysis between marigold (65 MADS-box genes) and arabidopsis (108 genes), 18 pairs of collinear genes were identified, while 53 pairs were identified between marigold and lettuce (82 genes). This discrepancy may be attributed to the genomic differences originating from the evolutionary history of plants. Arabidopsis belongs to the Brassicaceae family, while marigold and lettuce both belong to the Asteraceae family, with marigold belong to the Asteroideae group and lettuce under the Cichorioideae group [1].

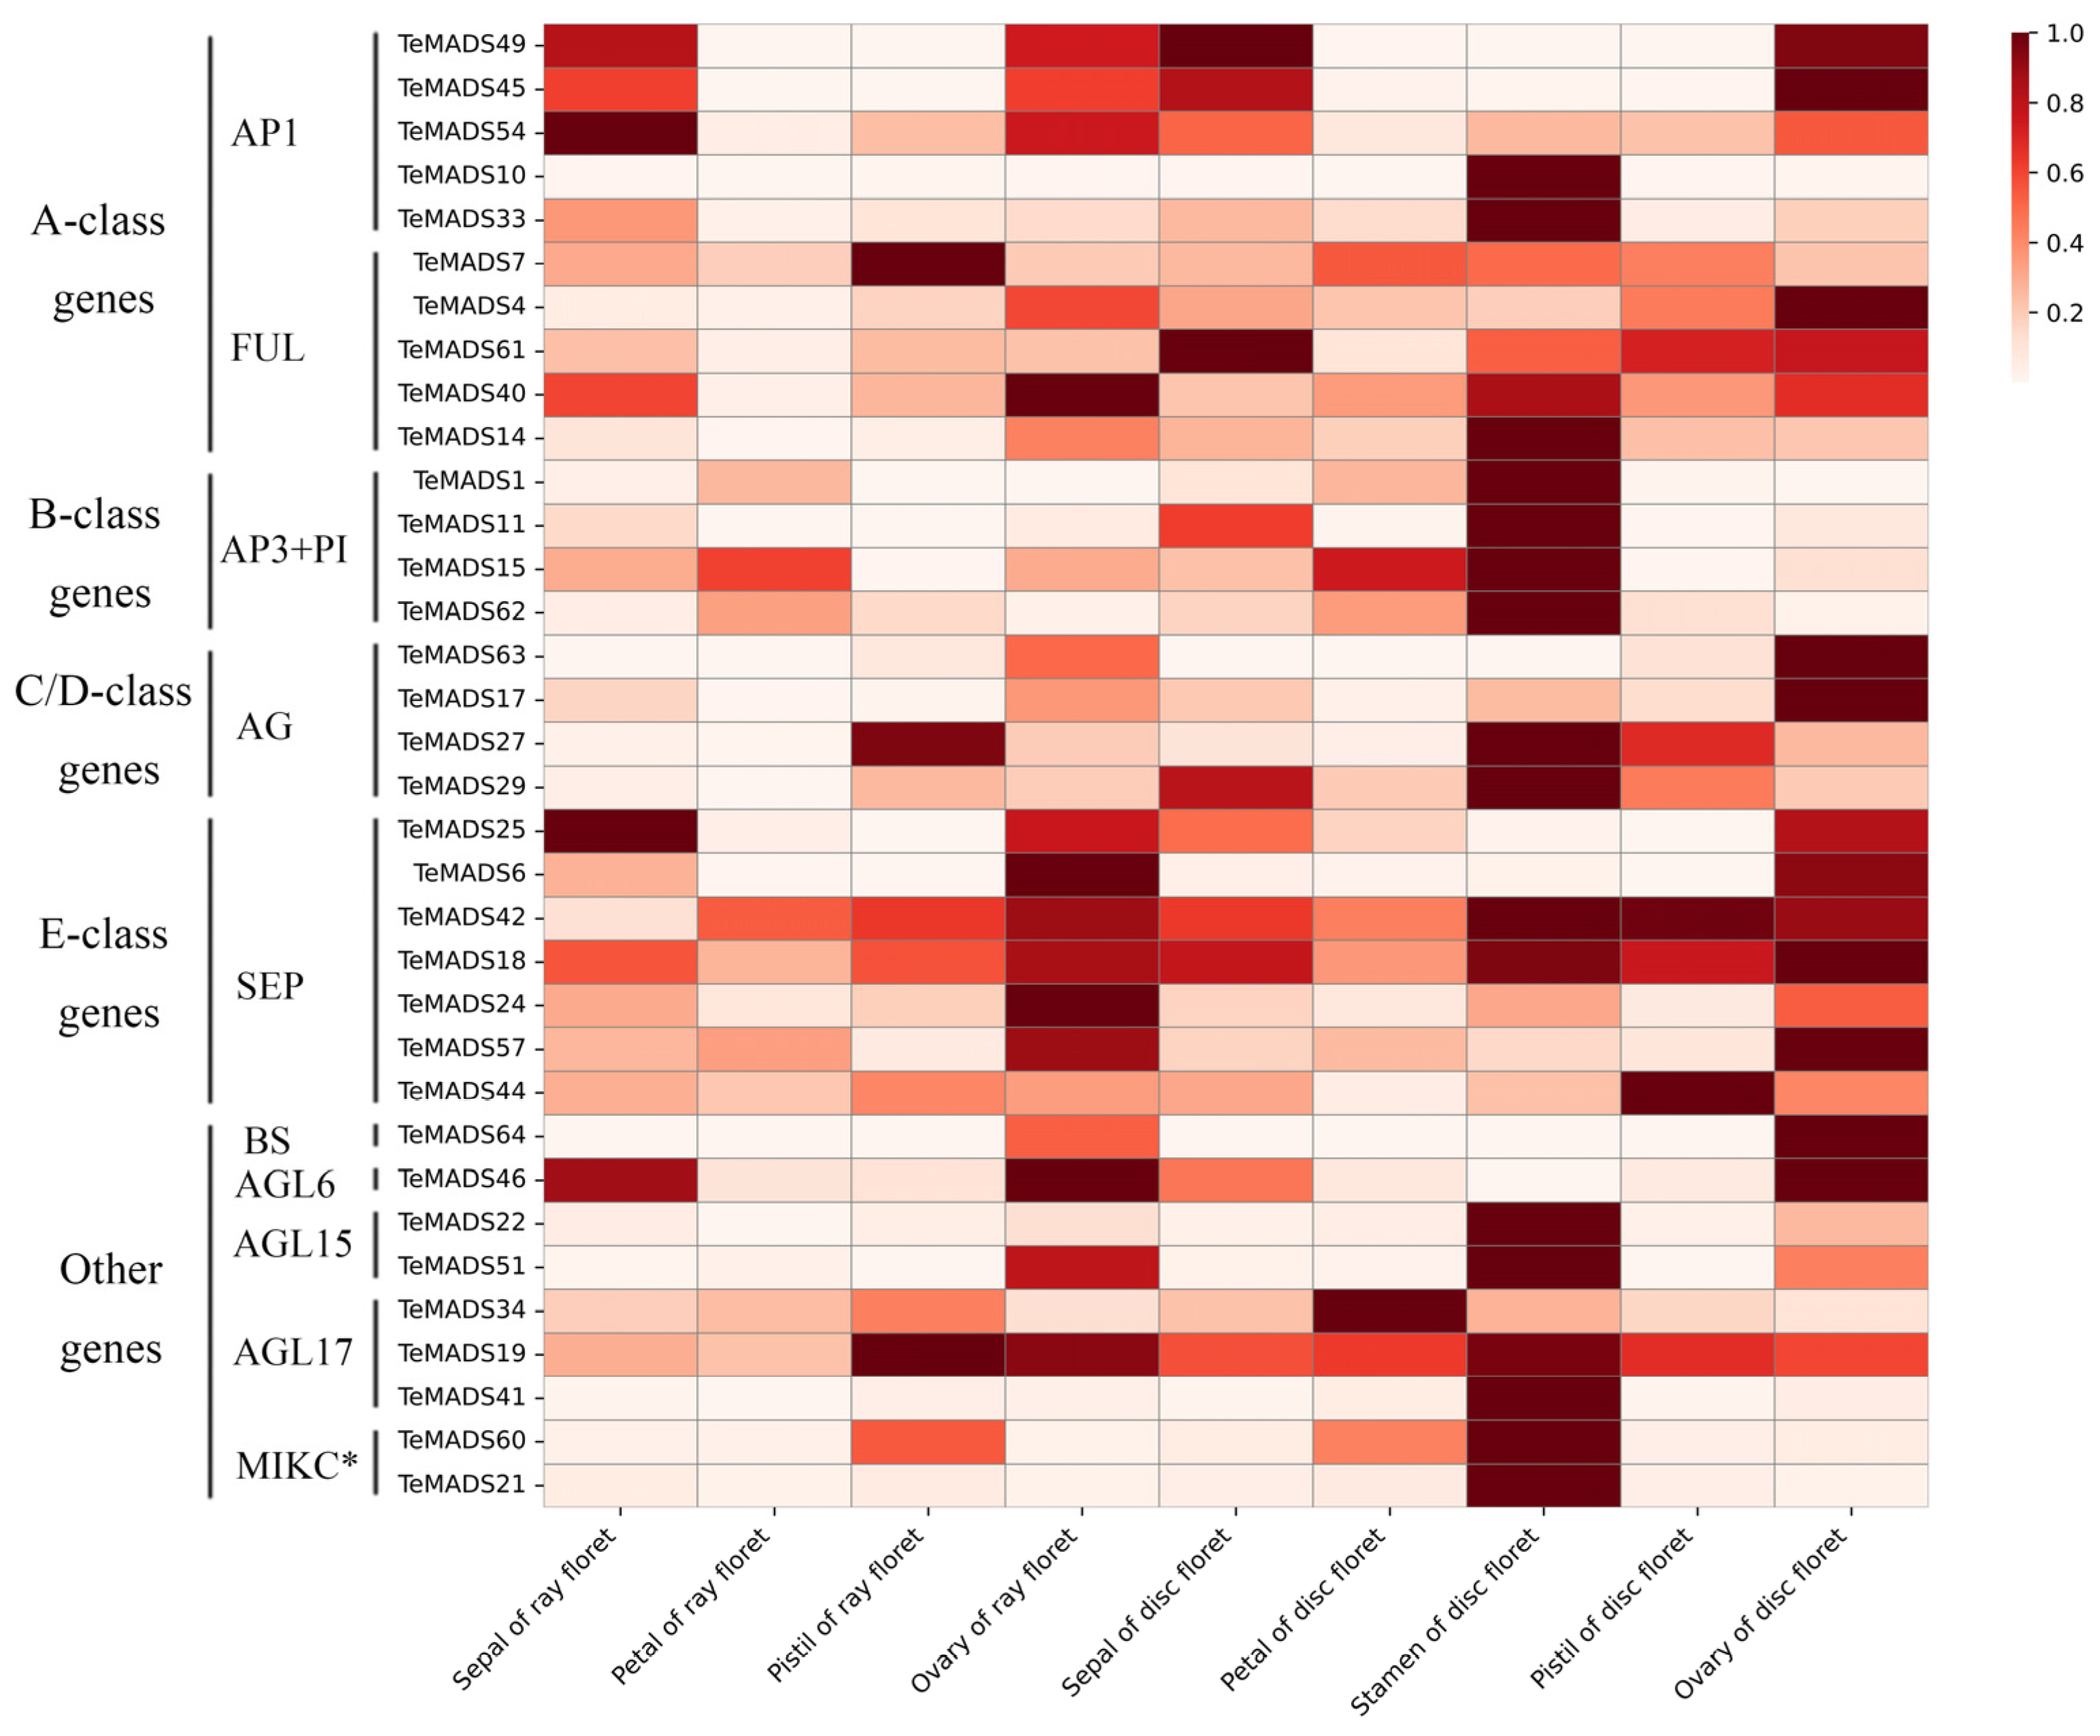
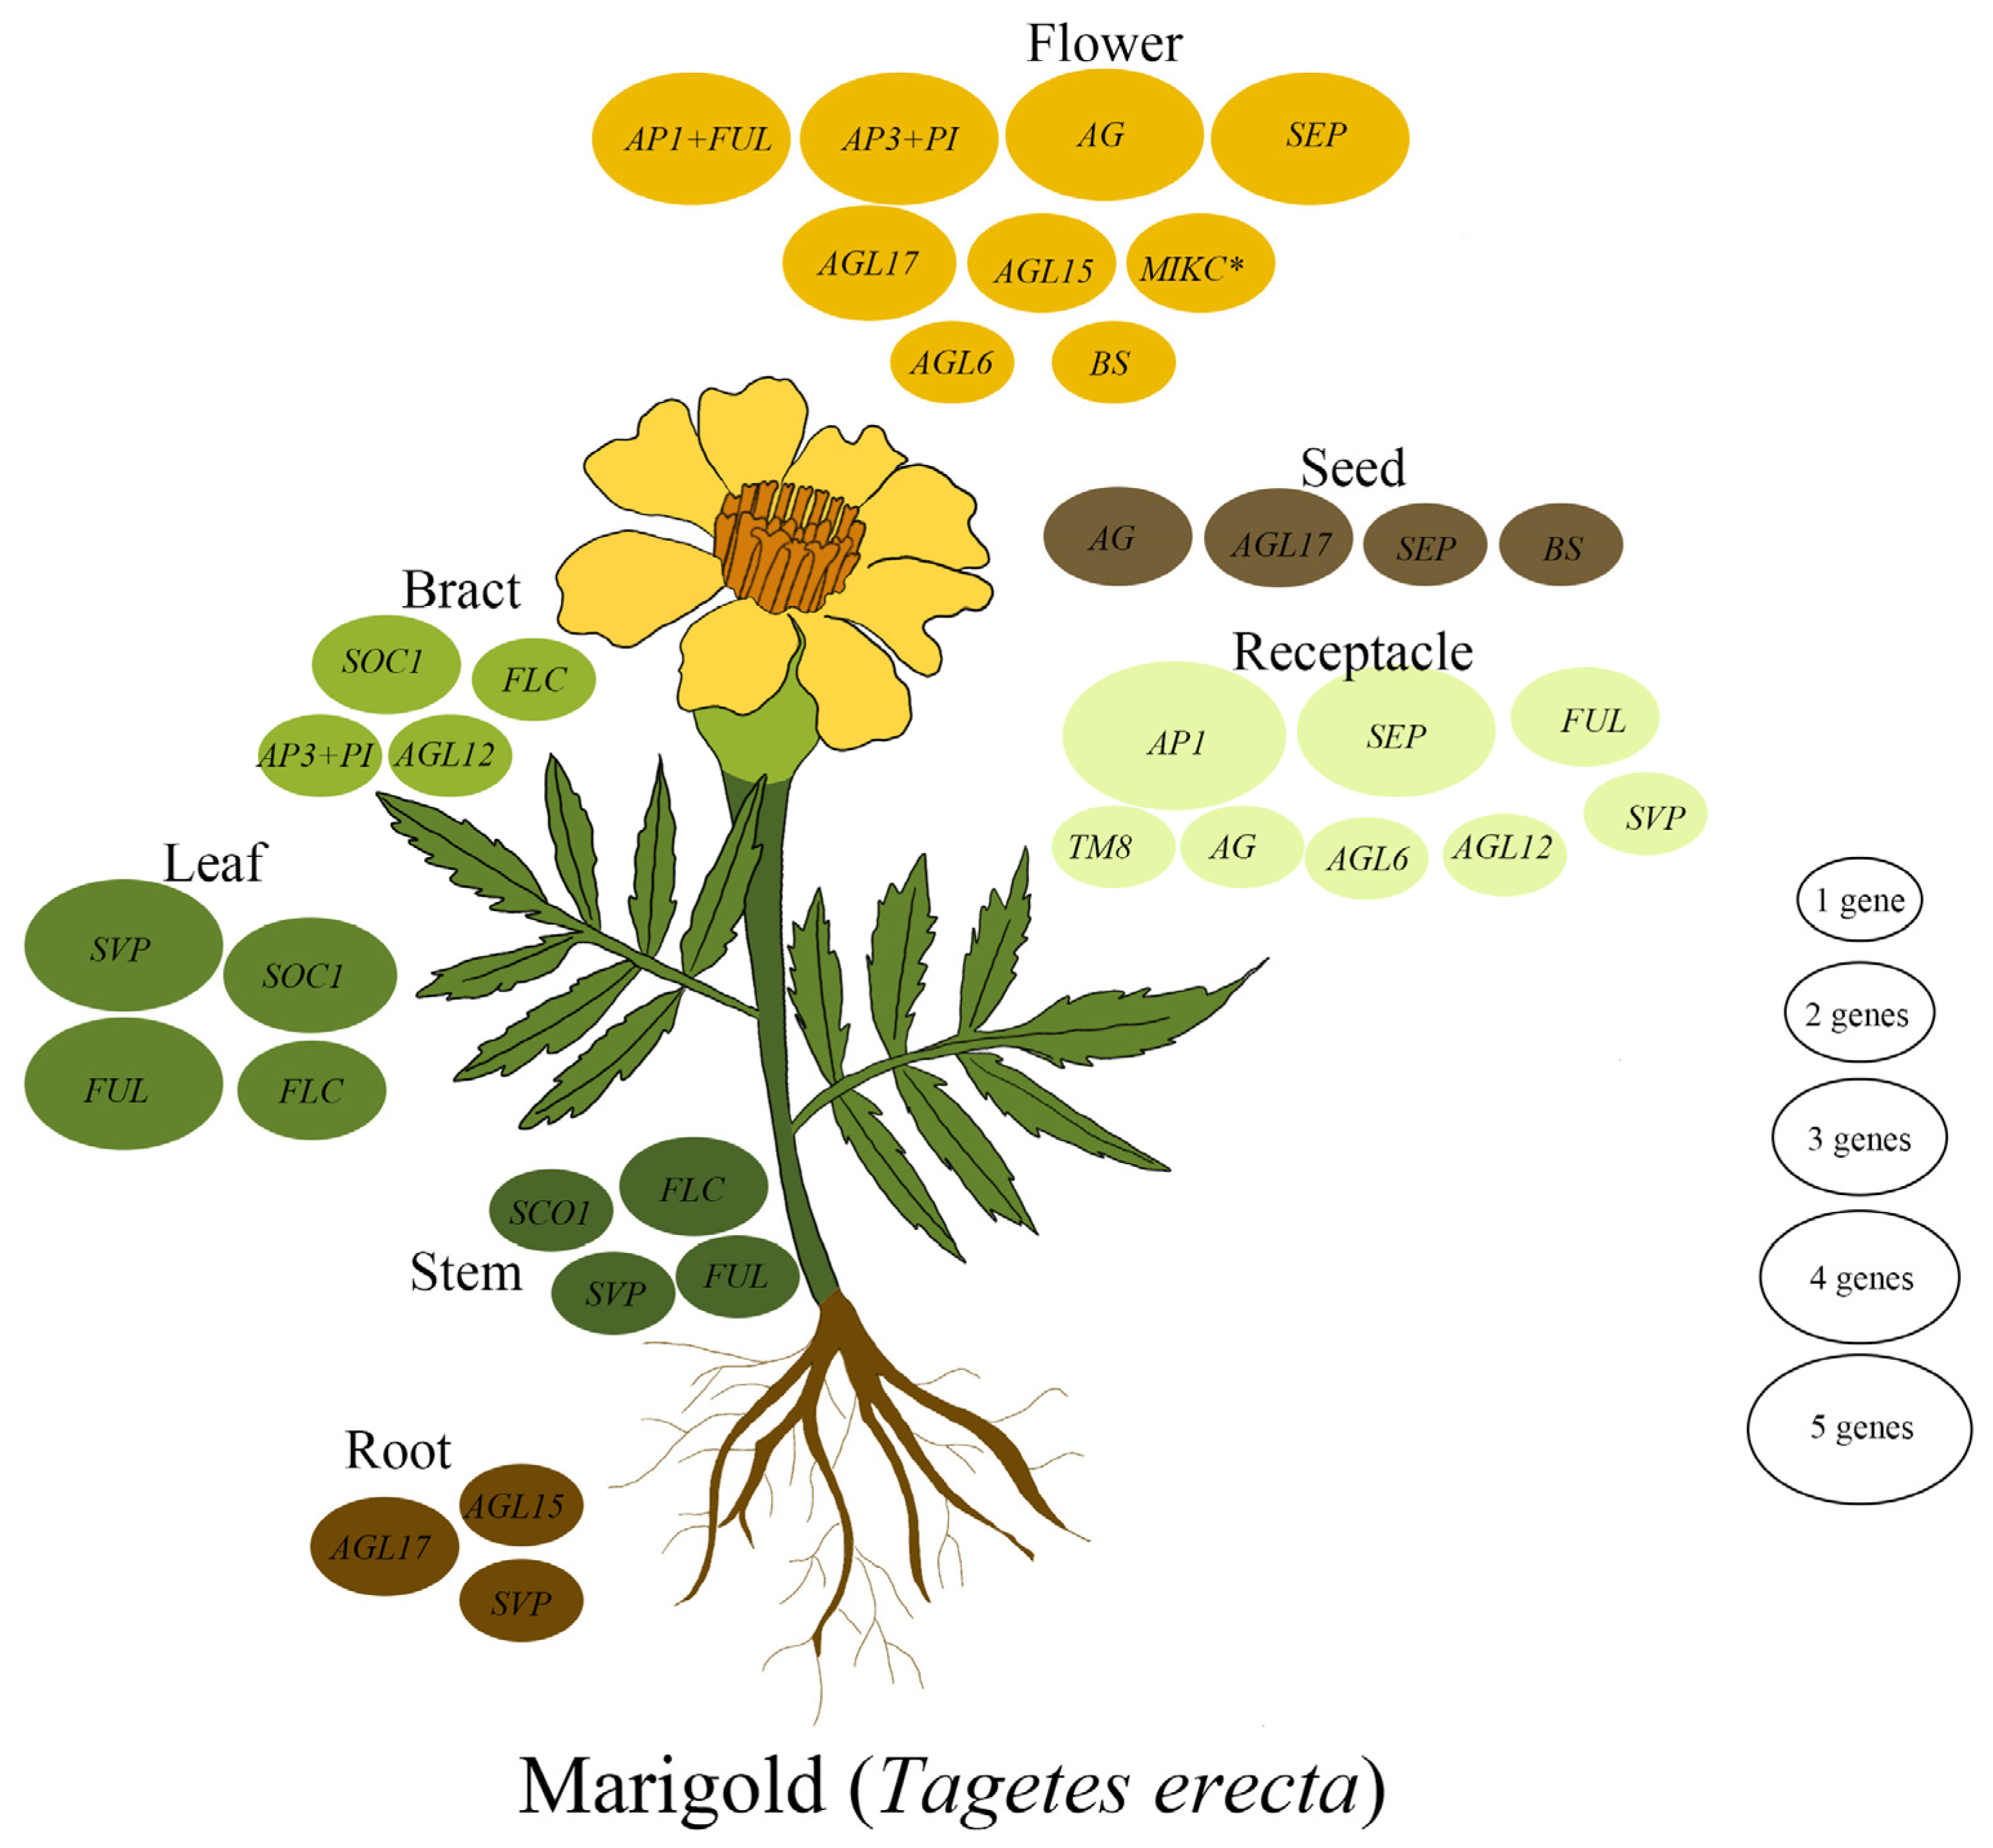
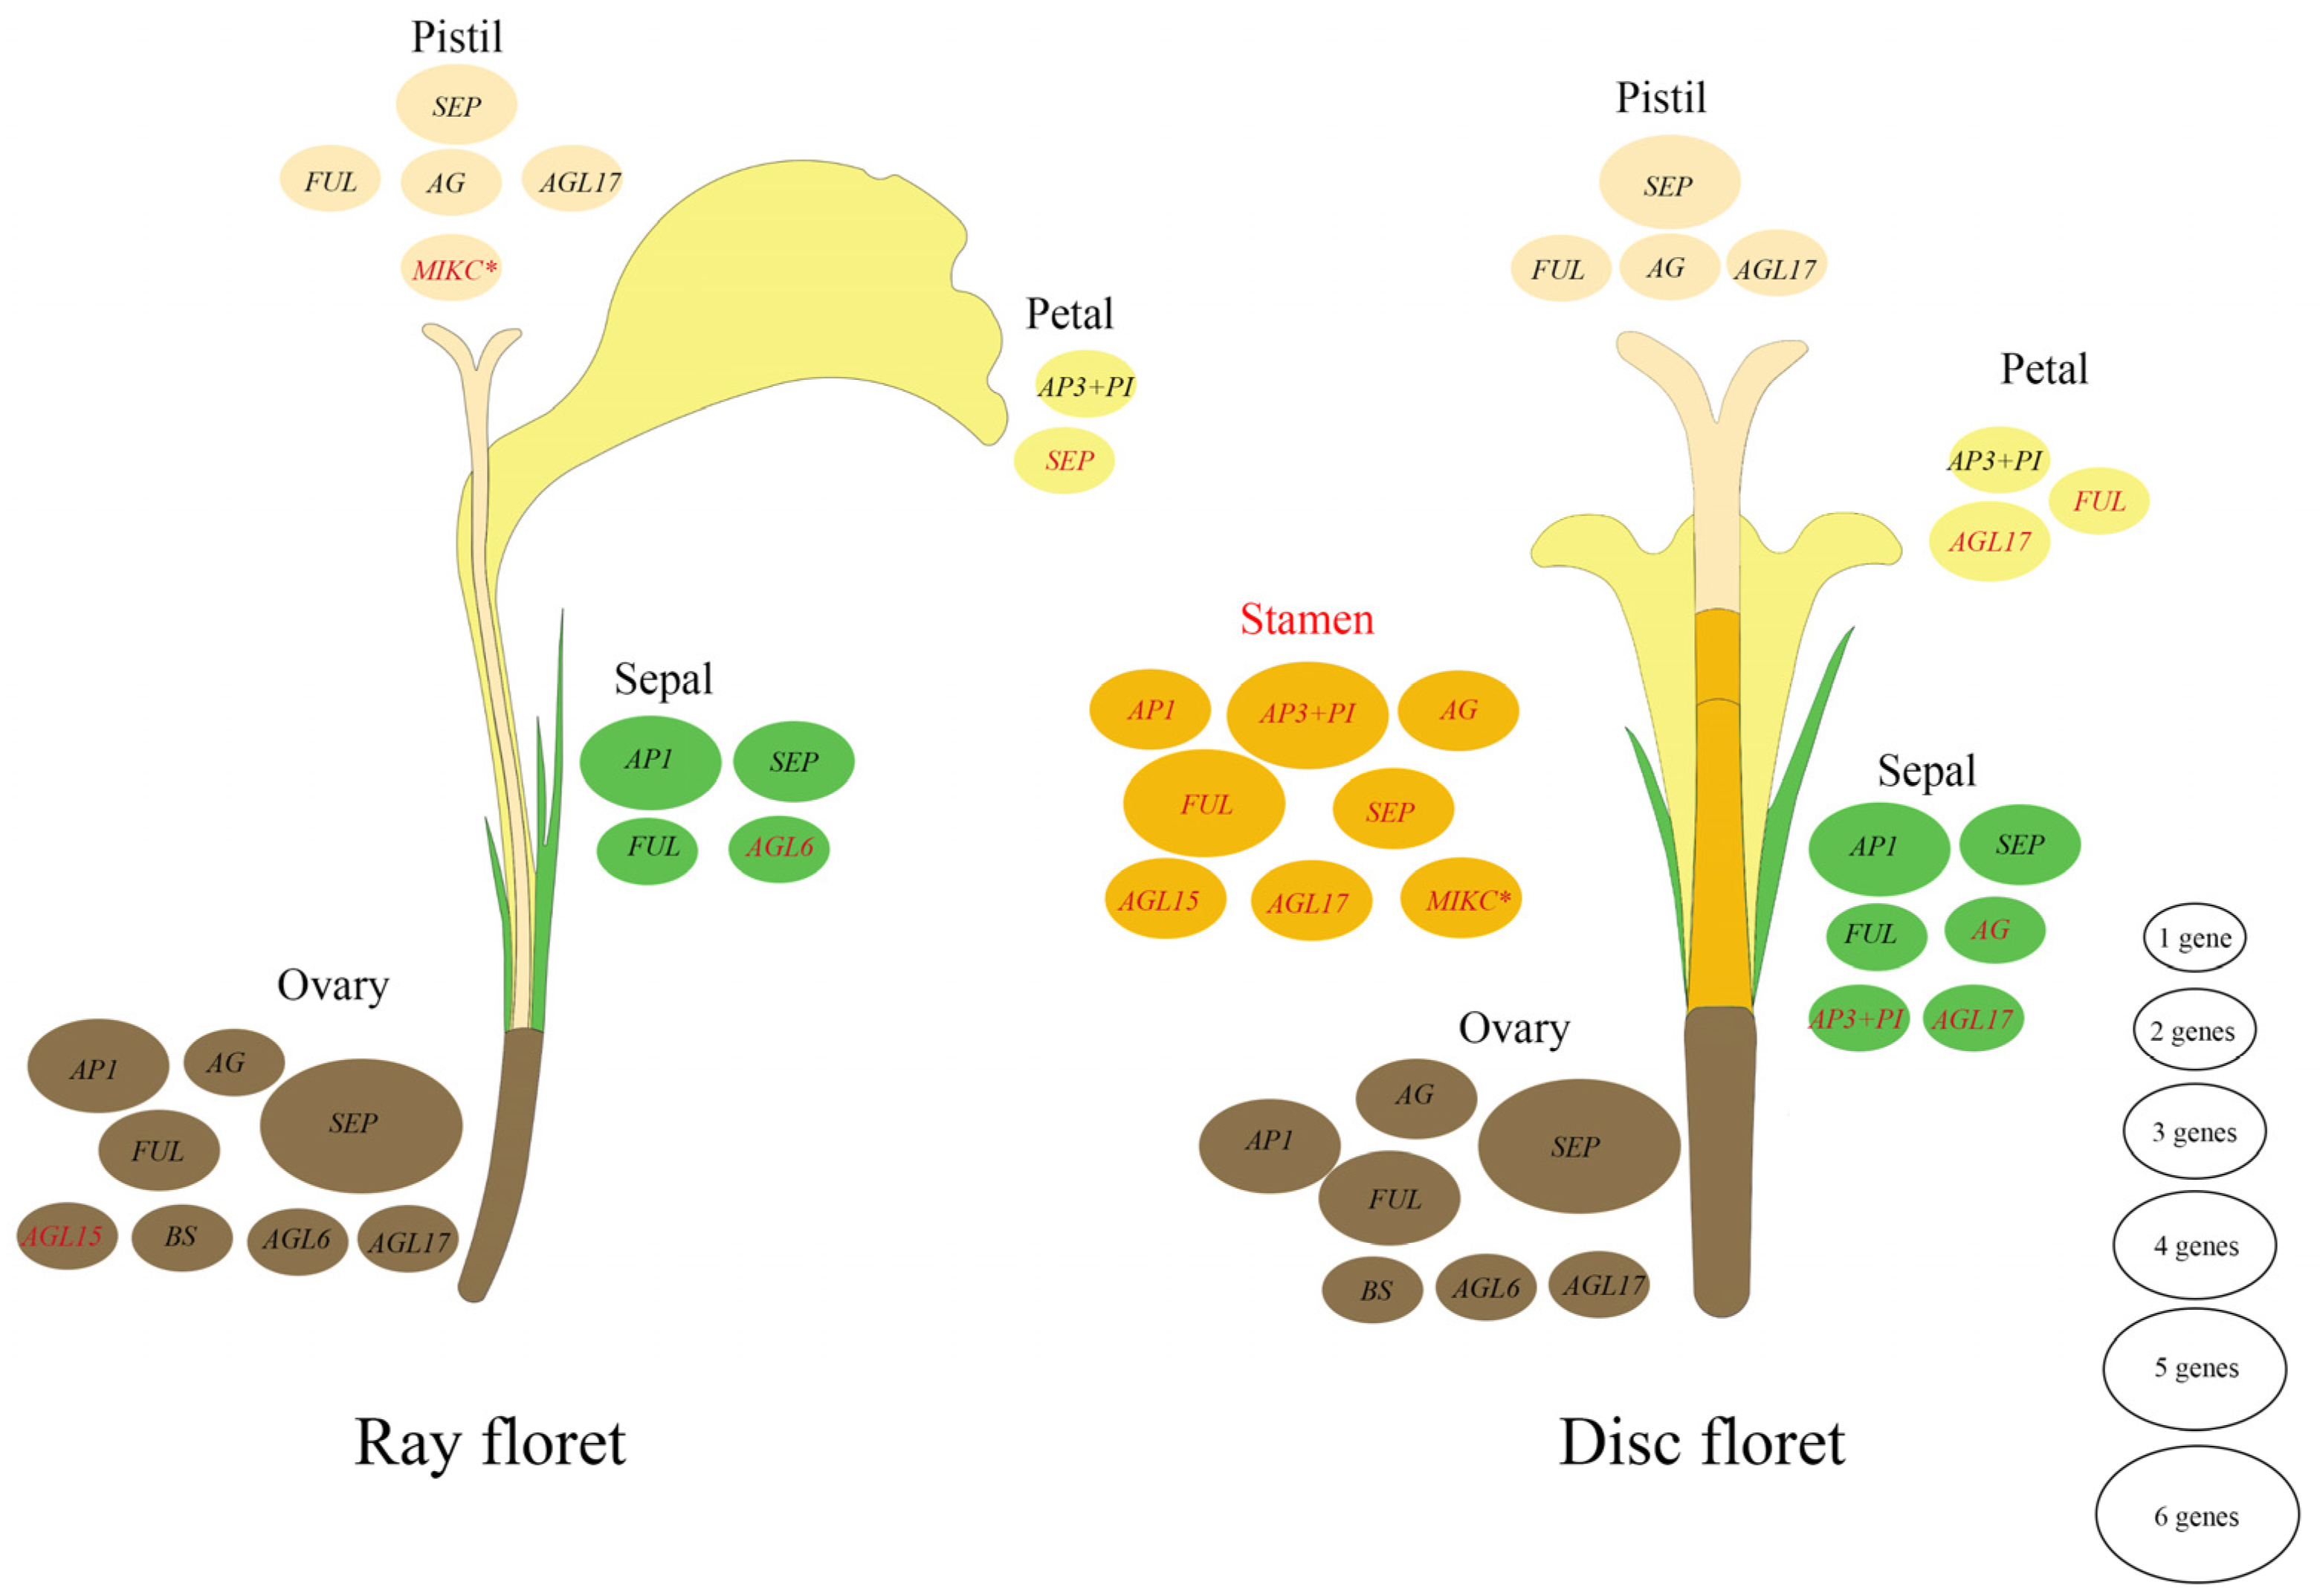
3.5. Expression Analysis of MADS-Box Genes in Marigold

To explore the expression patterns of type II genes in marigold, we analyzed the gene relative expression levels in nine tissues (Figure S1). As shown in Figure 7, the genes of SVP, SOC1, and FLC subfamilies, as well as the FUL clade of the AP1/FUL subfamily, were highly expressed in leaves, followed by stems, displaying similar expression patterns. In addition, the SOC1 and FLC subfamilies also exhibited relatively high expression in bracts. Notably, SVP subfamily gene TeMADS32 was an exception as it was mainly highly expressed in the receptacle. Additionally, the SEP, TM8, AGL6, and AGL12 subfamilies, and the AP1 clade of the AP1/FUL subfamily, were also highly expressed in the receptacle. Some genes in the AGL17, AGL15, and SVP subfamilies, including TeMADS48, TeMADS2, TeMADS23, and TeMADS39, were highly expressed in roots. SEP, BS, AG, and TeMADS34 of the AGL17 subfamily were highly expressed in seeds. In this research, we mainly focused on the subfamilies and genes that were highly expressed in the flowers. The SEP, FLC, and AP3/PI subfamilies show specific high expression in juvenile flower buds, particularly TeMADS6 and TeMADS15. The AP1/FUL, AP3/PI, AG, SEP, AGL17, AGL15, MIKC*, AGL6, and BS subfamilies were highly expressed in mature flowers.
To further investigate the expression pattern differences of these genes in the two types of marigold florets, we selected genes with normalized expression values greater than 0.5 in mature flowers and the genes belonging to the ABCDE model (Figures S2 and S3). We then analyzed their expression levels in different organs of disc florets and ray florets (Figure 8 and Figure S4). Among the A-class genes, TeMADS49, TeMADS45, and TeMADS54 belonging to the AP1 clade had similar expression patterns in the ray florets and disc florets of marigold, with high expression in the sepal and ovary. AGL6 and TeMADS25 of the SEP subfamily (E-class) also shared similar expression patterns. In contrast, the other AP1 clade genes TeMADS10 and TeMADS33 were specifically highly expressed only in the stamen of disc florets, which was similar to the expression pattern of the four members of the AP3/PI subfamily (B-class), and the expression pattern was also found in the AGL15 subfamily, TeMADS41 of the AGL17 subfamily, and the MIKC* group. These genes, all of which are likely to control the emergence of stamens in the disc florets of marigold, are also important genes that regulate the development of two types of florets in marigold. The AG subfamily (C/D-class) was mainly expressed in the reproductive organs, including the pistil and ovary of ray florets, and the stamen, pistil, and ovary of disc florets. The SEP subfamily genes were highly expressed in the ovaries of both ray florets and disc florets, and also showed expression in other floral organs. In contrast, the BS subfamily was highly expressed only in the ovaries of ray florets and disc florets, with no expression in other floral organs.

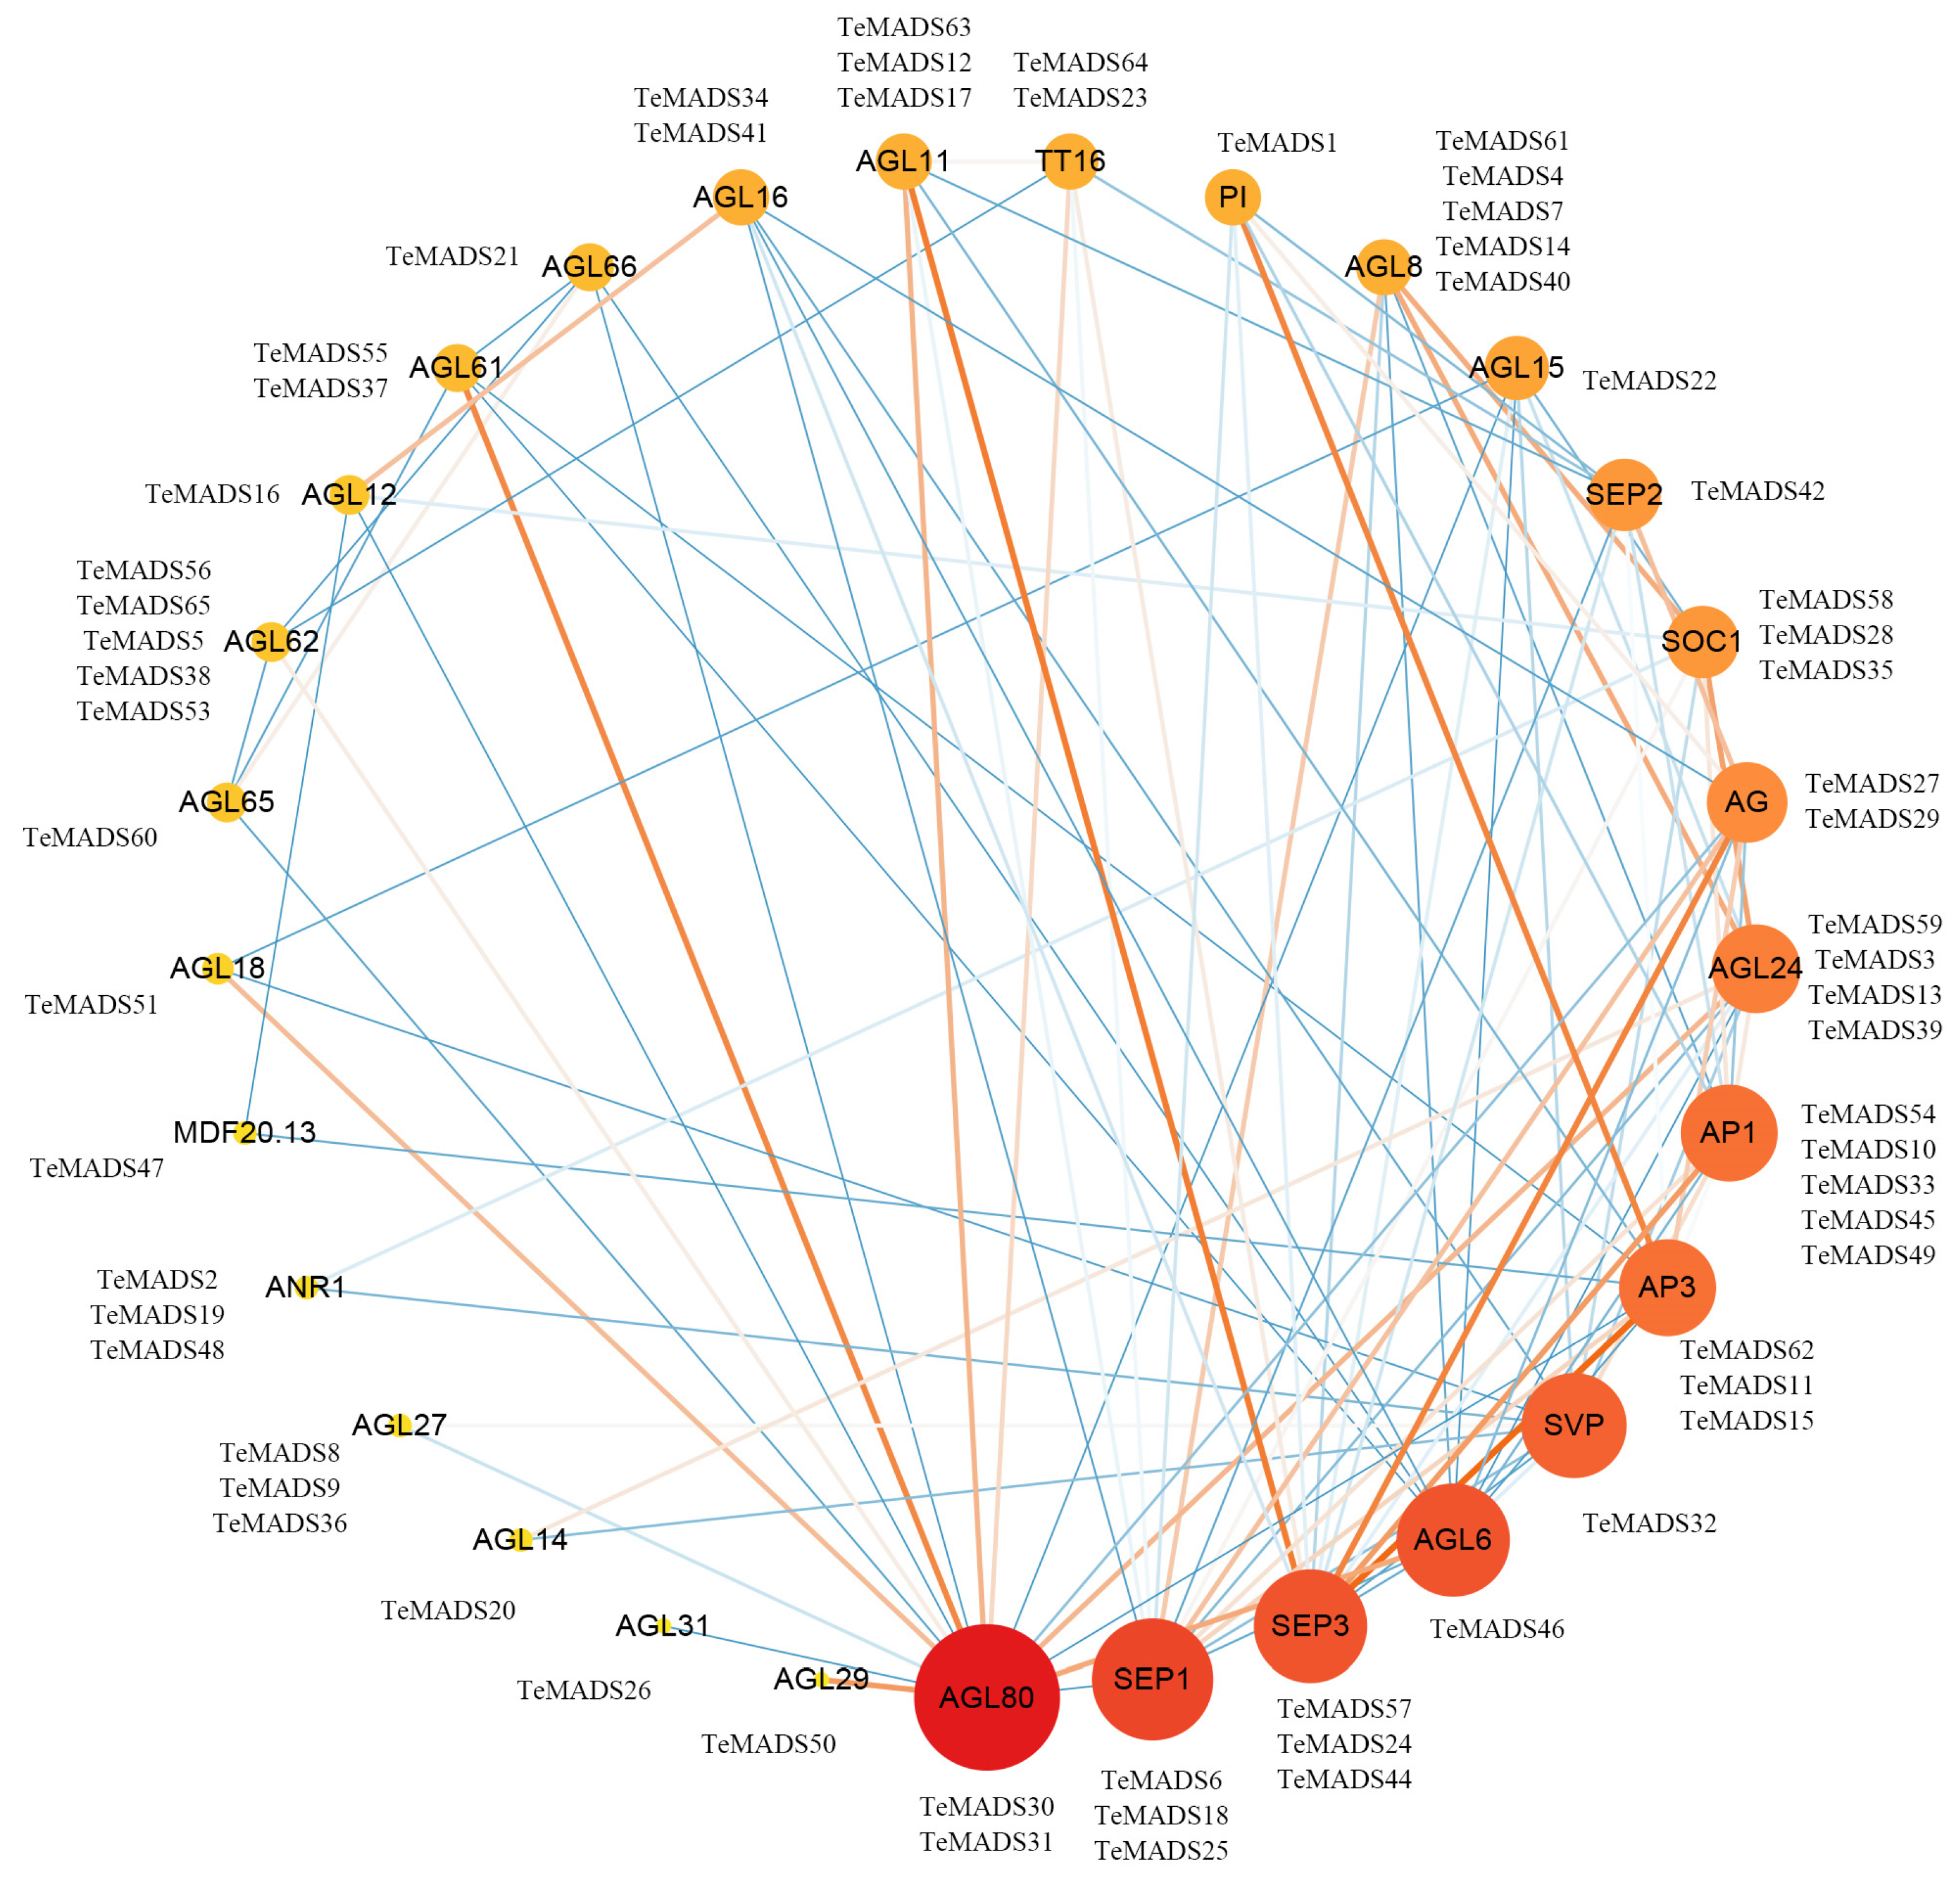
3.6. Protein Interaction Network of MADS-Box Genes

To gain deeper insights into the functions of marigold MADS-box gene family proteins, we utilized the String database to predict functional relationships and protein–protein interaction networks of TeMADS proteins, with arabidopsis proteins as references (Figure 9). The results revealed that 63 TeMADS proteins were involved in interactions, forming a total of 99 interaction relationships. Only the homologs of TeMADS43 and TeMADS52 did not show interaction relationships in this network. Highly interacting arabidopsis proteins such as AGL80, SEP1, SEP3, AGL6, and SVP displayed the most interactions, indicating their central roles in the network. The TeMADS30 and TeMADS31 proteins, homologous to AGL80, exhibited the highest degree of interaction with other proteins, establishing 17 interaction relationships with various MADS-box proteins; SEP1 and SEP3 followed. In particular, the SEP3 homologs have strong interaction relationships with AP3, AGL11, and AG proteins, highlighting the key roles of SEP proteins in marigold development.

4. Discussion

4.1. Genome-Wide Identification and Evolution of MADS-Box Gene Family in Marigold

The number of MADS-box genes varied among Asteraceae plants, marigold (65 genes), dengzhanhua (Erigeron breviscapus) (44 genes) [71], chrysanthemum (108 genes) [72], safflower (Carthamus tinctorius) (77 genes) [73], lettuce (82 genes) [35], and dandelion (Taraxacum officinale) (78 genes) [1], suggesting evolutionary expansions or contractions within the gene family of Asteraceae species. Additionally, the number of MADS-box genes in these Asteraceae plants, with the exception of chrysanthemum, was lower than that in arabidopsis. This suggests that some Asteraceae plants may have lost MADS-box genes during the course of evolution [73].
Compared with arabidopsis, the number of MADS-box genes in marigold (65 genes) was much lower than in arabidopsis (108 genes) [15]. However, the number of type II genes in marigold (52 genes) was similar to that in arabidopsis (46 genes), even slightly more, while the number of the three subclasses of type I in marigold was much smaller than that in arabidopsis. In type II, the MIKCC group had far more members than the MIKC* group. This pattern has been observed not only in the model plant arabidopsis [15] but also in other Asteraceae plants such as chrysanthemum [72] and lettuce [35]. The MIKCC group was further divided into 13 subfamilies in marigold; comparing the number of each subfamily, the members in the AP1/FUL, SEP, and SVP subfamilies were far more than in arabidopsis. Based on intra-species collinearity analysis, most of the collinear gene pairs belonged to the AP1/FUL subfamily (7 pairs), followed by the SEP subfamily (2 pairs). This indicates that gene duplication events may have occurred frequently in these subfamilies, which could explain why there are more clustered genes in the AP1/FUL (10 genes) and SEP (7 genes) subfamilies. Additionally, analysis of the structure and expression patterns of these gene pairs revealed some similarities in conserved motifs and expression patterns, indicating potential functional redundancy in the proteins encoded by these genes [35]. This gene clustering may also contribute to the stabilization of their expression patterns [74].
The phylogenetic analysis revealed that marigold contains 25 genes that belong to the ABCDE model, including ten genes in the AP1/FUL (A-class) subfamily, four genes in the AP3/PI (B-class) subfamily, four genes in the AG (C/D-class) subfamily, and seven genes in the SEP (E-class) subfamily, representing an increase compared to those identified based on the transcriptome database. In previous studies on MADS-box genes in marigold, Ai [43] and Zhang [5,42,44] identified 19 MADS-box genes related to flower organ development based on the second-generation transcriptome database and full-length transcriptome database of marigold, including five A-class genes, five B-class genes, two C-class genes, two D-class genes, and five E-class genes. The number of B-class genes was one less than the transcriptome results, possibly due to alternative splicing, which allows a single gene to generate multiple transcripts after transcription that can be translated into proteins with different structures and functions [75]. The rise in the number of A-class and E-class genes suggests potential functional significance, and the variations in identified MADS-box genes between transcriptome and genome analyses likely result from differences in sequencing depth, gene expression programs, and genomic resources [76,77]. Transcriptome analysis captures actively transcribed genes but may miss low-expressed or temporally regulated ones [78]. Whole-genome sequencing analysis provided a comprehensive view of gene content but may have included genes not actively transcribed under specific conditions [79]. Integrating both approaches offers a more comprehensive understanding of marigold flower development.

4.2. Conservation of the Type II Subfamilies in Marigold

Many type II genes had evolutionarily conserved functions in marigold. Specifically, the role of MIKC* proteins in pollen development has been conserved [80]. Based on expression patterns, the MIKC*-type genes were highly expressed in the stamens of disc florets, demonstrating their conservation in marigold. The MIKCC clade could be classified into 13 subfamilies in marigold, including TM8 (1), SOC1 (4). AGL6 (1), SEP (7), AP1/FUL (10), FLC (4), AGL12 (1), AG (4), AGL15 (3), AGL17 (5), SVP (5), BS (1), and AP3/PI (4) (Figure 2). For many plants, some clades in MIKCC-type have been conserved and not lost [13,20], and have also been retained in marigold. These clades contain genes that play crucial roles in flower development [20]. For example, the clades of AP1-like genes (A-class), AP3- and PI-like genes (B-class), AG-like genes (C-class), and SEP-like genes (E-class) have never been lost completely in any flowering plant. Based on their expression patterns, genes from these clades have also retained the function in classical models of flower development in marigold. The AP1-like genes were highly expressed in the sepals of marigold, including both ray and disc florets. All AP3/PI-like genes were specifically highly expressed in the stamens of disc florets, and one was highly expressed in petals; similar expression patterns were observed for gerbera [81]. The AG-like genes were highly expressed in seeds, and SEP-like genes were also identified in marigold, which synergistically regulate floral organ development [5]. This demonstrates the conserved function of these families.
And some other clades, BS-, SOC1-, SVP-, AGL17-, and AGL6-like genes, also did not show complete loss in any flowering plants [20]. The clade of BS-like genes, which is closely related to B-class genes [82], also exhibited an expression pattern similar to AP3/PI-like genes in marigold flowers. The SOC1-like genes were mainly expressed in developing leaves and shoot apical meristems in arabidopsis [7], and their expression was also conserved in marigold, mainly highly expressed in the leaves. The SVP family genes (SVP- and AGL24-like genes) were strongly expressed in young leaves and the shoot apical meristem in arabidopsis [13]. In marigold, these genes were also primarily highly expressed in the leaves. Additionally, AGL17-like genes exhibit different expression patterns across various plants, such as high expression in roots in Arabidopsis and high expression in pollen in maize (Zea mays) [83,84]. In marigold, two AGL17-like genes were highly expressed in roots, and two highly expressed in stamens. The clade of AGL6-like genes in petunia (Petunia hybrida), rice (Oryza sativa), and maize supported their involvement in the ‘E’ function of flower development [85], while the AGL6-like gene in marigold had a similar expression pattern to A-class genes. This indicated that the functions of some conserved clades were not conserved in marigold and may have undergone new functionalization.
The AGL12-, AGL15-, and AGL11-like (STK-like) genes clades have occasionally been lost, and the TM8-like genes and FLC-like genes have frequently been observed to be completely lost in plants [20], but the marigold has not lost these clades. The TM8 gene was absent in arabidopsis; however, marigold, lettuce, and chrysanthemum each possess one TM8 gene. FLC-like genes act as inhibitors of the floral transition in most plants and this subfamily has expanded in plants that require vernalization. For example, lettuce has expanded to 13 FLC-like genes [35], and chrysanthemum to 14 [72], compared to arabidopsis which has 6 FLC-like genes [15]. However, in some plants that do not require vernalization, such as watermelon (Citrullus lanatus) [86], the FLC-like gene was absent. Marigold had only 4 FLC-like genes, indicating a loss of some FLC-like genes compared to arabidopsis, possibly due to the lack of vernalization requirement for flowering.

4.3. Expression Analysis and Functional Prediction of MADS-Box Genes in Marigold

Type II genes play essential roles in flower development, particularly in floral organ identity [73]. In most plants, genes from different subfamilies typically exhibit distinct expression patterns [87]. Therefore, we analyzed the gene expression patterns of type II TeMADS genes to predict gene functions related to flower development in marigold. The expression patterns of MADS-box genes in marigold revealed distinct organ-specific profiles (Figure 7 and Figure 10). Genes from the AGL17, AGL15, and SVP subfamilies were predominantly expressed in roots. In contrast, genes from the SVP, SOC1, and FLC subfamilies, along with those from the FUL clade of the AP1/FUL subfamily, had high expression in leaves and stems, while genes from the SOC1 subfamily also had high expression levels in bracts. Additionally, the SEP, AP1/FUL, TM8, AGL6, and AGL12 subfamilies were highly expressed in the receptacle. Furthermore, genes from the AG, AGL17, SEP and BS subfamilies had high expression levels in seeds. Notably, the AP1/FUL, AP3/PI, AG, SEP, AGL17, AGL15, MIKC*, AGL6, and BS subfamilies were prominently expressed in mature flowers, highlighting their important roles in the development of marigold floral organs. This expression patterns further confirmed the vital role of MADS-box genes in plant growth and development, particularly in flower identities. Through these genes with specific expression patterns, we could delve deeper into the formation process of marigold flowers and the associated molecular mechanisms.
Floral organs are essential for plant reproduction, as they contain the structures necessary for pollination and seed production. Studying floral organs provides insights into the evolutionary processes that drive the diversity of flowering plants. To further analyze the expression patterns of MADS-box genes in marigold’s ray and disc florets, we selected the M525B-1 inbred line, which exhibits clearly differentiated florets without transitional forms, as our research material. We identified 34 MADS-box genes closely linked with flower organ development in the marigold genome, among which 25 genes belong to the ABCDE model (Figure 8). Based on the gene expression patterns in floral organs of ray florets and disc florets, the pistil and ovary exhibited analogous expression profiles between the two floret types, while significant expression differences were concentrated in the sepals, petals, and stamens (Figure 11 and Figure S5). Phenotypic differences between ray and disc florets in marigolds primarily involve petals and stamens, leading us to focus on differentially expressed genes in these floral organs. In the petals, the AP3/PI subfamily gene TeMADS15 was highly expressed in both floret types, whereas the SEP subfamily gene TeMADS42 was highly expressed only in ray floret petals. In contrast, the FUL subfamily gene TeMADS7 and two AGL17 subfamily genes, TeMADS19 and TeMADS34, were highly expressed only in disc floret petals. The high expression of A-class and B-class genes in disc floret petals aligned well with the classical flower development model. In ray florets, however, the elevated expression of B-class and E-class genes suggests that these genes are crucial for regulating the diversity of ray floret petals. This pattern, also reported in chrysanthemums, indicates that B-class and E-class genes are crucial for regulating the flat and tubular petal types [37]. In the stamens, unique to the disc florets, twenty genes from the AP1/FUL, AP3/PI, AG, SEP, AGL15, AGL17, and MIKC* subfamilies were all highly expressed. These differentially expressed genes likely play crucial roles in floret differentiation. Future research should focus on functional analyses of these candidate genes, investigating the regulatory networks and interactions among them to enhance our understanding of the molecular mechanisms driving marigold floret phenotypes. This could facilitate advanced breeding strategies to improve ornamental traits in marigolds and related Asteraceae species.

5. Conclusions

We have identified 65 MADS-box genes in the marigold genome, which were classified into two main types, type I (13 genes) and type II (52 genes), based on phylogenetic analysis. Type I included the Mα (8 genes), Mβ (2 genes), and Mγ (3 genes) subclasses, while type II contained two groups: MIKCC (50 genes) and MIKC* (2 genes), and further subdivision of MIKCC revealed 13 subfamilies. Based on phylogeny, gene structure, conserved motifs, gene duplication, and synteny analysis, we found that MADS-box genes exhibit a certain degree of conservation in marigold, while also displaying specificity. This conservation likely reflects the important roles of MADS-box genes in flower development, while specificity may have arisen from the functional differentiation of different genes and the influence of specific evolutionary histories. We further analyzed the expression pattern of type II genes in different organs, and revealed organ specificity in the expression pattern of the marigold MADS-box genes. We identified 34 MADS-box genes closely associated with floral organ development, of which 25 belong to the ABCDE model. In comparing the two floret types, the pistil and ovary exhibited similar expression profiles, while significant expression differences were observed in the sepals, petals, and stamens. Notably, four genes were exclusively expressed in the petals of one floret type, and twenty genes were highly expressed in the stamens of disc florets. These specific genes may play crucial roles in the development of distinct floret types, offering valuable insights into the mechanisms driving floral diversity in Asteraceae.

Supplementary Materials

The following supporting information can be downloaded at: https://www.mdpi.com/article/10.3390/agronomy14091889/s1, Figure S1: Relative Expression of type II TeMADS genes in different organs; Figure S2: Heat map normalized expression values of type II TeMADS genes in different organs; Figure S3: Relative Expression of 34 TeMADS genes in floral organs; Figure S4: Heat map normalized expression values of 34 TeMADS genes in floral organs; Figure S5: Expression Patterns of 34 TeMADS genes in floral organs; Table S1: Primer information of (qRT)-PCR; Table S2: Sequences of TeMADS proteins; Table S3: Physicochemical properties of the proteins and Subcellular localization; Table S4: Motif sequences of conserved motif analysis.

Author Contributions

Conceptualization, C.L. and Y.H.; methodology, C.L., F.W. and R.L.; software, C.L., F.W. and R.L.; validation, C.L., C.Z. and Y.H.; formal analysis, C.L., F.W. and Y.H.; investigation, C.L. and Y.Z.; resources, C.L., Y.Z. and Y.H.; data curation, C.L. and Y.H.; writing—original draft preparation, C.L., C.Z. and Y.H.; writing—review and editing, C.L. and Y.H.; visualization, C.L., F.W. and R.L.; supervision, C.Z. and Y.H.; project administration, Y.H.; funding acquisition, Y.H. All authors have read and agreed to the published version of the manuscript.

Funding

This work was funded by the National Natural Science Foundation of China (No. 32172616).

Data Availability Statement

The original data underlying this study are available within the article and its Supplementary Materials. For additional inquiries, please contact the corresponding author.

Conflicts of Interest

The authors declare no conflicts of interest.

References

  1. Xiong, W.; Risse, J.; Berke, L.; Zhao, T.; van de Geest, H.; Oplaat, C.; Busscher, M.; Ferreira, D.C.J.; van der Meer, I.M.; Verhoeven, K.; et al. Phylogenomic analysis provides insights into MADS-box and TCP gene diversification and floral development of the Asteraceae, supported by de novo genome and transcriptome sequences from dandelion (Taraxacum officinale). Front. Plant Sci. 2023, 14, 1198909. [Google Scholar] [CrossRef]
  2. Zhang, T.; Elomaa, P. Development and evolution of the Asteraceae capitulum. New Phytol. 2024, 242, 33–48. [Google Scholar] [CrossRef]
  3. Elomaa, P.; Zhao, Y.; Zhang, T. Flower heads in Asteraceae-recruitment of conserved developmental regulators to control the flower-like inflorescence architecture. Hortic. Res. 2018, 5, 36. [Google Scholar] [CrossRef]
  4. Dezar, C.A.; Tioni, M.F.; Gonzalez, D.H.; Chan, R.L. Identification of three MADS-box genes expressed in sunflower capitulum. J. Exp. Bot. 2003, 54, 1637–1639. [Google Scholar] [CrossRef]
  5. Zhang, C.; Wei, L.; Yu, X.; Li, H.; Wang, W.; Wu, S.; Duan, F.; Bao, M.; Chan, Z.; He, Y. Functional conservation and divergence of SEPALLATA-like genes in the development of two-type florets in marigold. Plant Sci. 2021, 309, 110938. [Google Scholar] [CrossRef]
  6. Shore, P.; Sharrocks, A.D. The MADS-Box Family of Transcription Factors. Eur. J. Biochem. 1995, 229, 1–13. [Google Scholar] [CrossRef]
  7. Tao, Z.; Shen, L.; Liu, C.; Liu, L.; Yan, Y.; Yu, H. Genome-wide identification of SOC1 and SVP targets during the floral transition in Arabidopsis. Plant J. 2012, 70, 549–561. [Google Scholar] [CrossRef]
  8. He, Y. Chromatin regulation of flowering. Trends Plant Sci. 2012, 17, 556–562. [Google Scholar] [CrossRef]
  9. Treccarichi, S.; Ben, A.H.; Amari, M.; Cali, R.; Tribulato, A.; Branca, F. Molecular Markers for Detecting Inflorescence Size of Brassica oleracea L. Crops and B. oleracea Complex Species (n = 9) Useful for Breeding of Broccoli (B. oleracea var. italica) and Cauliflower (B. oleracea var. botrytis). Plants 2023, 12, 407. [Google Scholar] [CrossRef]
  10. Theissen, G. Development of floral organ identity: Stories from the MADS house. Curr. Opin. Plant Biol. 2001, 4, 75–85. [Google Scholar] [CrossRef]
  11. Ng, M.; Yanofsky, M.F. Function and evolution of the plant MADS-box gene family. Nat. Rev. Genet. 2001, 2, 186–195. [Google Scholar] [CrossRef] [PubMed]
  12. Schwarz-Sommer, Z.; Huijser, P.; Nacken, W.; Saedler, H.; Sommer, H. Genetic Control of Flower Development by Homeotic Genes in Antirrhinum majus. Science 1990, 250, 931–936. [Google Scholar] [CrossRef]
  13. Becker, A.; Theissen, G. The major clades of MADS-box genes and their role in the development and evolution of flowering plants. Mol. Phylogenet Evol. 2003, 29, 464–489. [Google Scholar] [CrossRef]
  14. Ma, H.; Yanofsky, M.F.; Meyerowitz, E.M. AGL1-AGL6, an Arabidopsis gene family with similarity to floral homeotic and transcription factor genes. Gene Dev. 1991, 5, 484–495. [Google Scholar] [CrossRef] [PubMed]
  15. Parenicova, L.; de Folter, S.; Kieffer, M.; Horner, D.S.; Favalli, C.; Busscher, J.; Cook, H.E.; Ingram, R.M.; Kater, M.M.; Davies, B.; et al. Molecular and phylogenetic analyses of the complete MADS-box transcription factor family in Arabidopsis: New openings to the MADS world. Plant Cell 2003, 15, 1538–1551. [Google Scholar] [CrossRef] [PubMed]
  16. Munster, T.; Pahnke, J.; Di Rosa, A.; Kim, J.T.; Martin, W.; Saedler, H.; Theissen, G. Floral homeotic genes were recruited from homologous MADS-box genes preexisting in the common ancestor of ferns and seed plants. Proc. Natl. Acad. Sci. USA 1997, 94, 2415–2420. [Google Scholar] [CrossRef]
  17. Davies, B.; Egea-Cortines, M.; de Andrade, S.E.; Saedler, H.; Sommer, H. Multiple interactions amongst floral homeotic MADS box proteins. Embo J. 1996, 15, 4330–4343. [Google Scholar] [CrossRef]
  18. Honma, T.; Goto, K. Complexes of MADS-box proteins are sufficient to convert leaves into floral organs. Nature 2001, 409, 525–529. [Google Scholar] [CrossRef]
  19. van Dijk, A.D.; Morabito, G.; Fiers, M.; van Ham, R.C.; Angenent, G.C.; Immink, R.G. Sequence motifs in MADS transcription factors responsible for specificity and diversification of protein-protein interaction. PLoS Comput. Biol. 2010, 6, e1001017. [Google Scholar] [CrossRef]
  20. Gramzow, L.; Theissen, G. Phylogenomics reveals surprising sets of essential and dispensable clades of MIKC(c)-group MADS-box genes in flowering plants. J. Exp. Zool. Part B 2015, 324, 353–362. [Google Scholar] [CrossRef]
  21. Schilling, S.; Kennedy, A.; Pan, S.; Jermiin, L.S.; Melzer, R. Genome-wide analysis of MIKC-type MADS-box genes in wheat: Pervasive duplications, functional conservation and putative neofunctionalization. New Phytol. 2020, 225, 511–529. [Google Scholar] [CrossRef]
  22. Masiero, S.; Colombo, L.; Grini, P.E.; Schnittger, A.; Kater, M.M. The emerging importance of type I MADS box transcription factors for plant reproduction. Plant Cell 2011, 23, 865–872. [Google Scholar] [CrossRef] [PubMed]
  23. Verelst, W.; Saedler, H.; Munster, T. MIKC* MADS-protein complexes bind motifs enriched in the proximal region of late pollen-specific Arabidopsis promoters. Plant Physiol. 2007, 143, 447–460. [Google Scholar] [CrossRef] [PubMed]
  24. Verelst, W.; Twell, D.; de Folter, S.; Immink, R.; Saedler, H.; Munster, T. MADS-complexes regulate transcriptome dynamics during pollen maturation. Genome Biol. 2007, 8, R249. [Google Scholar] [CrossRef] [PubMed]
  25. Bowman, J.L.; Smyth, D.R.; Meyerowitz, E.M. Genetic interactions among floral homeotic genes of Arabidopsis. Development 1991, 112, 1–20. [Google Scholar] [CrossRef]
  26. Carpenter, R.; Coen, E.S. Floral homeotic mutations produced by transposon-mutagenesis in Antirrhinum majus. Gene Dev. 1990, 4, 1483–1493. [Google Scholar] [CrossRef] [PubMed]
  27. Coen, E.S.; Meyerowitz, E.M. The war of the whorls: Genetic interactions controlling flower development. Nature 1991, 353, 31–37. [Google Scholar] [CrossRef] [PubMed]
  28. Weigel, D.; Meyerowitz, E.M. The ABCs of floral homeotic genes. Cell 1994, 78, 203–209. [Google Scholar] [CrossRef]
  29. Pinyopich, A.; Ditta, G.S.; Savidge, B.; Liljegren, S.J.; Baumann, E.; Wisman, E.; Yanofsky, M.F. Assessing the redundancy of MADS-box genes during carpel and ovule development. Nature 2003, 424, 85–88. [Google Scholar] [CrossRef] [PubMed]
  30. Pelaz, S.; Ditta, G.S.; Baumann, E.; Wisman, E.; Yanofsky, M.F. B and C floral organ identity functions require SEPALLATA MADS-box genes. Nature 2000, 405, 200–203. [Google Scholar] [CrossRef]
  31. Kim, S.; Koh, J.; Yoo, M.J.; Kong, H.; Hu, Y.; Ma, H.; Soltis, P.S.; Soltis, D.E. Expression of floral MADS-box genes in basal angiosperms: Implications for the evolution of floral regulators. Plant J. 2005, 43, 724–744. [Google Scholar] [CrossRef] [PubMed]
  32. Yant, L.; Mathieu, J.; Dinh, T.T.; Ott, F.; Lanz, C.; Wollmann, H.; Chen, X.; Schmid, M. Orchestration of the floral transition and floral development in Arabidopsis by the bifunctional transcription factor APETALA2. Plant Cell 2010, 22, 2156–2170. [Google Scholar] [CrossRef] [PubMed]
  33. Ma, H.; DePamphilis, C. The ABCs of floral evolution. Cell 2000, 101, 5–8. [Google Scholar] [CrossRef] [PubMed]
  34. Irish, V.F.; Litt, A. Flower development and evolution: Gene duplication, diversification and redeployment. Curr. Opin. Genet. Dev. 2005, 15, 454–460. [Google Scholar] [CrossRef] [PubMed]
  35. Ning, K.; Han, Y.; Chen, Z.; Luo, C.; Wang, S.; Zhang, W.; Li, L.; Zhang, X.; Fan, S.; Wang, Q. Genome-wide analysis of MADS-box family genes during flower development in lettuce. Plant Cell Environ. 2019, 42, 1868–1881. [Google Scholar] [CrossRef] [PubMed]
  36. Laitinen, R.A.; Broholm, S.; Albert, V.A.; Teeri, T.H.; Elomaa, P. Patterns of MADS-box gene expression mark flower-type development in Gerbera hybrida (Asteraceae). BMC Plant Biol. 2006, 6, 11. [Google Scholar] [CrossRef]
  37. Pu, Y.; Liao, M.; Li, J.; Tian, Y.; Wang, Z.; Song, X.; Dai, S. Floral Development Stage-Specific Transcriptomic Analysis Reveals the Formation Mechanism of Different Shapes of Ray Florets in Chrysanthemum. Genes 2023, 14, 766. [Google Scholar] [CrossRef] [PubMed]
  38. Zhu, Y.; Liu, Y.; Wang, W.; Li, H.; Liu, C.; Dou, L.; Wei, L.; Cheng, W.; Bao, M.; Yi, Q.; et al. Identification and characterization of CYC2-like genes related to floral symmetric development in Tagetes erecta (Asteraceae). Gene 2023, 889, 147804. [Google Scholar] [CrossRef] [PubMed]
  39. Mandel, J.R.; Dikow, R.B.; Siniscalchi, C.M.; Thapa, R.; Watson, L.E.; Funk, V.A. A fully resolved backbone phylogeny reveals numerous dispersals and explosive diversifications throughout the history of Asteraceae. Proc. Natl. Acad. Sci. USA 2019, 116, 14083–14088. [Google Scholar] [CrossRef] [PubMed]
  40. Xin, H.; Ji, F.; Wu, J.; Zhang, S.; Yi, C.; Zhao, S.; Cong, R.; Zhao, L.; Zhang, H.; Zhang, Z. Chromosome-scale genome assembly of marigold (Tagetes erecta L.): An ornamental plant and feedstock for industrial lutein production. Hortic. Plant J. 2023, 9, 1119–1130. [Google Scholar] [CrossRef]
  41. Ai, Y.; Zhang, Q.; Wang, W.; Zhang, C.; Cao, Z.; Bao, M.; He, Y. Transcriptomic Analysis of Differentially Expressed Genes during Flower Organ Development in Genetic Male Sterile and Male Fertile Tagetes erecta by Digital Gene-Expression Profiling. PLoS ONE 2016, 11, e150892. [Google Scholar] [CrossRef]
  42. Zhang, C.; Sun, Y.; Yu, X.; Li, H.; Bao, M.; He, Y. Functional Conservation and Divergence of Five AP1/FUL-like Genes in Marigold (Tagetes erecta L.). Genes. 2021, 12, 2011. [Google Scholar] [CrossRef] [PubMed]
  43. Ai, Y.; Zhang, C.; Sun, Y.; Wang, W.; He, Y.; Bao, M. Characterization and Functional Analysis of Five MADS-Box B Class Genes Related to Floral Organ Identification in Tagetes erecta. PLoS ONE 2017, 12, e169777. [Google Scholar] [CrossRef] [PubMed]
  44. Zhang, C.; Wei, L.; Wang, W.; Qi, W.; Cao, Z.; Li, H.; Bao, M.; He, Y. Identification, characterization and functional analysis of AGAMOUS subfamily genes associated with floral organs and seed development in Marigold (Tagetes erecta). Bmc Plant Biol. 2020, 20, 439. [Google Scholar] [CrossRef] [PubMed]
  45. Finn, R.D.; Clements, J.; Eddy, S.R. HMMER web server: Interactive sequence similarity searching. Nucleic Acids Res. 2011, 39, W29–W37. [Google Scholar] [CrossRef] [PubMed]
  46. Mistry, J.; Chuguransky, S.; Williams, L.; Qureshi, M.; Salazar, G.A.; Sonnhammer, E.; Tosatto, S.; Paladin, L.; Raj, S.; Richardson, L.J.; et al. Pfam: The protein families database in 2021. Nucleic Acids Res 2021, 49, D412–D419. [Google Scholar] [CrossRef] [PubMed]
  47. Marchler-Bauer, A.; Bryant, S.H. CD-Search: Protein domain annotations on the fly. Nucleic Acids Res. 2004, 32, W327–W331. [Google Scholar] [CrossRef]
  48. Wilkins, M.R.; Gasteiger, E.; Bairoch, A.; Sanchez, J.C.; Williams, K.L.; Appel, R.D.; Hochstrasser, D.F. Protein identification and analysis tools in the ExPASy server. Methods Mol. Biol. 1999, 112, 531–552. [Google Scholar] [CrossRef] [PubMed]
  49. Chou, K.C.; Shen, H.B. Large-scale plant protein subcellular location prediction. J. Cell Biochem. 2007, 100, 665–678. [Google Scholar] [CrossRef]
  50. Berardini, T.Z.; Reiser, L.; Li, D.; Mezheritsky, Y.; Muller, R.; Strait, E.; Huala, E. The arabidopsis information resource: Making and mining the “gold standard” annotated reference plant genome. Genesis 2015, 53, 474–485. [Google Scholar] [CrossRef]
  51. Goodstein, D.M.; Shu, S.; Howson, R.; Neupane, R.; Hayes, R.D.; Fazo, J.; Mitros, T.; Dirks, W.; Hellsten, U.; Putnam, N.; et al. Phytozome: A comparative platform for green plant genomics. Nucleic Acids Res. 2012, 40, D1178–D1186. [Google Scholar] [CrossRef] [PubMed]
  52. Daminato, M.; Masiero, S.; Resentini, F.; Lovisetto, A.; Casadoro, G. Characterization of TM8, a MADS-box gene expressed in tomato flowers. BMC Plant Biol. 2014, 14, 319. [Google Scholar] [CrossRef] [PubMed]
  53. Sayers, E.W.; Beck, J.; Bolton, E.E.; Brister, J.R.; Chan, J.; Comeau, D.C.; Connor, R.; DiCuccio, M.; Farrell, C.M.; Feldgarden, M.; et al. Database resources of the National Center for Biotechnology Information. Nucleic Acids Res. 2024, 52, D33–D43. [Google Scholar] [CrossRef]
  54. Katoh, K.; Rozewicki, J.; Yamada, K.D. MAFFT online service: Multiple sequence alignment, interactive sequence choice and visualization. Brief. Bioinform. 2019, 20, 1160–1166. [Google Scholar] [CrossRef] [PubMed]
  55. Katoh, K.; Standley, D.M. MAFFT multiple sequence alignment software version 7: Improvements in performance and usability. Mol. Biol. Evol. 2013, 30, 772–780. [Google Scholar] [CrossRef] [PubMed]
  56. Nguyen, L.T.; Schmidt, H.A.; von Haeseler, A.; Minh, B.Q. IQ-TREE: A fast and effective stochastic algorithm for estimating maximum-likelihood phylogenies. Mol. Biol. Evol. 2015, 32, 268–274. [Google Scholar] [CrossRef] [PubMed]
  57. Kalyaanamoorthy, S.; Minh, B.Q.; Wong, T.; von Haeseler, A.; Jermiin, L.S. ModelFinder: Fast model selection for accurate phylogenetic estimates. Nat. Methods 2017, 14, 587–589. [Google Scholar] [CrossRef] [PubMed]
  58. Guindon, S.; Dufayard, J.F.; Lefort, V.; Anisimova, M.; Hordijk, W.; Gascuel, O. New algorithms and methods to estimate maximum-likelihood phylogenies: Assessing the performance of PhyML 3.0. Syst. Biol. 2010, 59, 307–321. [Google Scholar] [CrossRef] [PubMed]
  59. Minh, B.Q.; Nguyen, M.A.; von Haeseler, A. Ultrafast approximation for phylogenetic bootstrap. Mol. Biol. Evol. 2013, 30, 1188–1195. [Google Scholar] [CrossRef] [PubMed]
  60. Hoang, D.T.; Chernomor, O.; von Haeseler, A.; Minh, B.Q.; Vinh, L.S. UFBoot2: Improving the Ultrafast Bootstrap Approximation. Mol. Biol. Evol. 2018, 35, 518–522. [Google Scholar] [CrossRef] [PubMed]
  61. Letunic, I.; Bork, P. Interactive Tree Of Life (iTOL) v4: Recent updates and new developments. Nucleic Acids Res. 2019, 47, W256–W259. [Google Scholar] [CrossRef]
  62. Hu, B.; Jin, J.; Guo, A.Y.; Zhang, H.; Luo, J.; Gao, G. GSDS 2.0: An upgraded gene feature visualization server. Bioinformatics 2015, 31, 1296–1297. [Google Scholar] [CrossRef]
  63. Bailey, T.L.; Elkan, C. Fitting a mixture model by expectation maximization to discover motifs in biopolymers. Proc. Int. Conf. Intell. Syst. Mol. Biol. 1994, 2, 28–36. [Google Scholar] [PubMed]
  64. Bailey, T.L.; Boden, M.; Buske, F.A.; Frith, M.; Grant, C.E.; Clementi, L.; Ren, J.; Li, W.W.; Noble, W.S. MEME SUITE: Tools for motif discovery and searching. Nucleic Acids Res. 2009, 37, W202–W208. [Google Scholar] [CrossRef]
  65. Chao, J.; Li, Z.; Sun, Y.; Aluko, O.O.; Wu, X.; Wang, Q.; Liu, G. MG2C: A user-friendly online tool for drawing genetic maps. Mol. Hortic. 2021, 1, 16. [Google Scholar] [CrossRef] [PubMed]
  66. Wang, Y.; Tang, H.; Debarry, J.D.; Tan, X.; Li, J.; Wang, X.; Lee, T.H.; Jin, H.; Marler, B.; Guo, H.; et al. MCScanX: A toolkit for detection and evolutionary analysis of gene synteny and collinearity. Nucleic Acids Res. 2012, 40, e49. [Google Scholar] [CrossRef] [PubMed]
  67. Tang, N.; Zhang, W.; Chen, L.; Wang, Y.; Tang, D. Reference Gene Selection for Real-time Quantitative Reverse-transcription Polymerase Chain Reaction in Flower Buds of Marigold. J. Am. Soc. Hortic. Sci. 2021, 146, 363. [Google Scholar] [CrossRef]
  68. Livak, K.J.; Schmittgen, T.D. Analysis of relative gene expression data using real-time quantitative PCR and the 2(-Delta Delta C(T)) Method. Methods 2001, 25, 402–408. [Google Scholar] [CrossRef]
  69. Szklarczyk, D.; Kirsch, R.; Koutrouli, M.; Nastou, K.; Mehryary, F.; Hachilif, R.; Gable, A.L.; Fang, T.; Doncheva, N.T.; Pyysalo, S.; et al. The STRING database in 2023: Protein-protein association networks and functional enrichment analyses for any sequenced genome of interest. Nucleic Acids Res. 2023, 51, D638–D646. [Google Scholar] [CrossRef] [PubMed]
  70. Shannon, P.; Markiel, A.; Ozier, O.; Baliga, N.S.; Wang, J.T.; Ramage, D.; Amin, N.; Schwikowski, B.; Ideker, T. Cytoscape: A software environment for integrated models of biomolecular interaction networks. Genome Res. 2003, 13, 2498–2504. [Google Scholar] [CrossRef] [PubMed]
  71. Tang, W.; Tu, Y.; Cheng, X.; Zhang, L.; Meng, H.; Zhao, X.; Zhang, W.; He, B. Genome-wide identification and expression profile of the MADS-box gene family in Erigeron breviscapus. PLoS ONE 2019, 14, e226599. [Google Scholar] [CrossRef] [PubMed]
  72. Won, S.Y.; Jung, J.A.; Kim, J.S. Genome-wide analysis of the MADS-Box gene family in Chrysanthemum. Comput. Biol. Chem. 2021, 90, 107424. [Google Scholar] [CrossRef] [PubMed]
  73. Wang, Y.; Ge, H.; Ahmad, N.; Li, J.; Wang, Y.; Liu, X.; Liu, W.; Li, X.; Wang, N.; Wang, F.; et al. Genome-Wide Identification of MADS-Box Family Genes in Safflower (Carthamus tinctorius L.) and Functional Analysis of CtMADS24 during Flowering. Int. J. Mol. Sci. 2023, 24, 1026. [Google Scholar] [CrossRef] [PubMed]
  74. Cittadino, G.M.; Andrews, J.; Purewal, H.; Estanislao, A.A.P.; Arnone, J.T. Functional Clustering of Metabolically Related Genes Is Conserved across Dikarya. J. Fungi 2023, 9, 523. [Google Scholar] [CrossRef] [PubMed]
  75. Laloum, T.; Martin, G.; Duque, P. Alternative Splicing Control of Abiotic Stress Responses. Trends Plant Sci. 2018, 23, 140–150. [Google Scholar] [CrossRef]
  76. Sims, D.; Sudbery, I.; Ilott, N.E.; Heger, A.; Ponting, C.P. Sequencing depth and coverage: Key considerations in genomic analyses. Nat. Rev. Genet. 2014, 15, 121–132. [Google Scholar] [CrossRef] [PubMed]
  77. Cao, J.; Zhou, W.; Steemers, F.; Trapnell, C.; Shendure, J. Sci-fate characterizes the dynamics of gene expression in single cells. Nat. Biotechnol. 2020, 38, 980–988. [Google Scholar] [CrossRef] [PubMed]
  78. Raz, T.; Kapranov, P.; Lipson, D.; Letovsky, S.; Milos, P.M.; Thompson, J.F. Protocol dependence of sequencing-based gene expression measurements. PLoS ONE 2011, 6, e19287. [Google Scholar] [CrossRef]
  79. Ng, P.C.; Kirkness, E.F. Whole genome sequencing. Methods Mol. Biol. 2010, 628, 215–226. [Google Scholar] [CrossRef]
  80. Liu, Y.; Cui, S.; Wu, F.; Yan, S.; Lin, X.; Du, X.; Chong, K.; Schilling, S.; Theissen, G.; Meng, Z. Functional conservation of MIKC*-Type MADS box genes in Arabidopsis and rice pollen maturation. Plant Cell 2013, 25, 1288–1303. [Google Scholar] [CrossRef]
  81. Broholm, S.K.; Pollanen, E.; Ruokolainen, S.; Tahtiharju, S.; Kotilainen, M.; Albert, V.A.; Elomaa, P.; Teeri, T.H. Functional characterization of B class MADS-box transcription factors in Gerbera hybrida. J. Exp. Bot. 2010, 61, 75–85. [Google Scholar] [CrossRef]
  82. Gioppato, H.A.; Dornelas, M.C. When Bs Are Better than As: The Relationship between B-Class MADS-Box Gene Duplications and the Diversification of Perianth Morphology. Trop. Plant Biol. 2019, 12, 1–11. [Google Scholar] [CrossRef]
  83. Schreiber, D.N.; Bantin, J.; Dresselhaus, T. The MADS box transcription factor ZmMADS2 is required for anther and pollen maturation in maize and accumulates in apoptotic bodies during anther dehiscence. Plant Physiol. 2004, 134, 1069–1079. [Google Scholar] [CrossRef] [PubMed]
  84. Puig, J.; Meynard, D.; Khong, G.N.; Pauluzzi, G.; Guiderdoni, E.; Gantet, P. Analysis of the expression of the AGL17-like clade of MADS-box transcription factors in rice. Gene Expr. Patterns 2013, 13, 160–170. [Google Scholar] [CrossRef] [PubMed]
  85. Dreni, L.; Zhang, D. Flower development: The evolutionary history and functions of the AGL6 subfamily MADS-box genes. J. Exp. Bot. 2016, 67, 1625–1638. [Google Scholar] [CrossRef] [PubMed]
  86. Wang, P.; Wang, S.; Chen, Y.; Xu, X.; Guang, X.; Zhang, Y. Genome-wide Analysis of the MADS-Box Gene Family in Watermelon. Comput. Biol. Chem. 2019, 80, 341–350. [Google Scholar] [CrossRef] [PubMed]
  87. Li, C.; Wang, Y.; Xu, L.; Nie, S.; Chen, Y.; Liang, D.; Sun, X.; Karanja, B.K.; Luo, X.; Liu, L. Genome-Wide Characterization of the MADS-Box Gene Family in Radish (Raphanus sativus L.) and Assessment of Its Roles in Flowering and Floral Organogenesis. Front. Plant Sci. 2016, 7, 1390. [Google Scholar] [CrossRef] [PubMed]
Figure 1. Phylogenetic tree of type I genes in arabidopsis, marigold, and lettuce was constructed using IQ-TREE with the maximum likelihood method, following sequence alignment with MAFFT. The MADS-box genes are represented by blue, red, and green spots for arabidopsis, marigold, and lettuce, respectively.
Agronomy 14 01889 g001
Figure 2. Phylogenetic tree of type II genes in arabidopsis, marigold, and lettuce was constructed using IQ-TREE with the maximum likelihood method, following sequence alignment with MAFFT. The MADS-box genes are represented by blue, red, and green spots for arabidopsis, marigold, and lettuce, respectively.
Agronomy 14 01889 g002
Figure 3. Phylogenetic relationship, gene structure, and conserved motifs of the TeMADS proteins. (A) Maximum likelihood tree obtained using IQ-TREE based on TeMADS protein. (B) Conserved motifs of the TeMADS proteins. Detailed information on motifs is provided in Supplementary Table S3. (C) The gene structures of TeMADS genes. The lengths of CDS, intron, and UTR in each TeMADS gene are displayed proportionally.
Agronomy 14 01889 g003
Figure 4. Physical distribution of TeMADS genes among 12 chromosomes.
Agronomy 14 01889 g004
Figure 5. The duplication gene pairs of MADS-box in marigold.
Agronomy 14 01889 g005
Figure 6. Synteny analysis of marigold, arabidopsis, and lettuce. Colored rectangles denote the chromosomes of different plants. The red lines represent gene pairs of MADS-box gene with a collinear relationship. The grey lines represent other collinear gene pairs of non-MADS-box genes across genomes.
Agronomy 14 01889 g006
Figure 7. Heat map of type II TeMADS genes in various tissues based on qRT-PCR data. The tissues included the roots, stems, leaves, receptacles, bracts, seeds, flower buds with diameter of 0–1 mm, flower buds with diameter of 4–5 mm, and mature flowers.
Agronomy 14 01889 g007
Figure 8. Selected 34 TeMADS genes highly expressed in mature flowers, and analyzed for their expression in different organs of disc florets (sepal, petal, stamen, pistil, and ovary) and ray florets (sepal, petal, pistil, and ovary).
Agronomy 14 01889 g008
Figure 9. Protein interaction network of marigold MADS-box genes constructed by the homologs in arabidopsis. The red circles represent arabidopsis proteins, with a deeper color and larger size indicating a higher number of interactions. The color intensity of the lines denotes the interaction score. The genes adjacent to the arabidopsis proteins are the homologous genes in marigold.
Agronomy 14 01889 g009
Figure 10. Expression patterns of type II genes in various marigold tissues, including the root, stem, leaf, receptacle, bract, seed, and flower. The size of the ovals representing the genes indicate the number of genes expressed, with the legend showing 1 to 5 genes represented by different-sized ovals.
Agronomy 14 01889 g010
Figure 11. Selected the genes highly expressed in flowers, and analyzed for their expression patterns in different floret organs. The legend shows 1 to 6 genes represented by different-sized ovals. Red fonts are unique in one floret type, black in both types.
Agronomy 14 01889 g011
Disclaimer/Publisher’s Note: The statements, opinions and data contained in all publications are solely those of the individual author(s) and contributor(s) and not of MDPI and/or the editor(s). MDPI and/or the editor(s) disclaim responsibility for any injury to people or property resulting from any ideas, methods, instructions or products referred to in the content.

