

Spatio-Temporal Dynamics of Soil Penetration Resistance Depending on Different Conservation Tillage Systems

 ,
,  ,
,  ,
,  ,
,  ,
,  , and
, and 
Abstract
:1. Introduction
2. Materials and Methods
2.1. Site Description and Treatments
2.2. Measurement Methods
2.3. Data Analysis
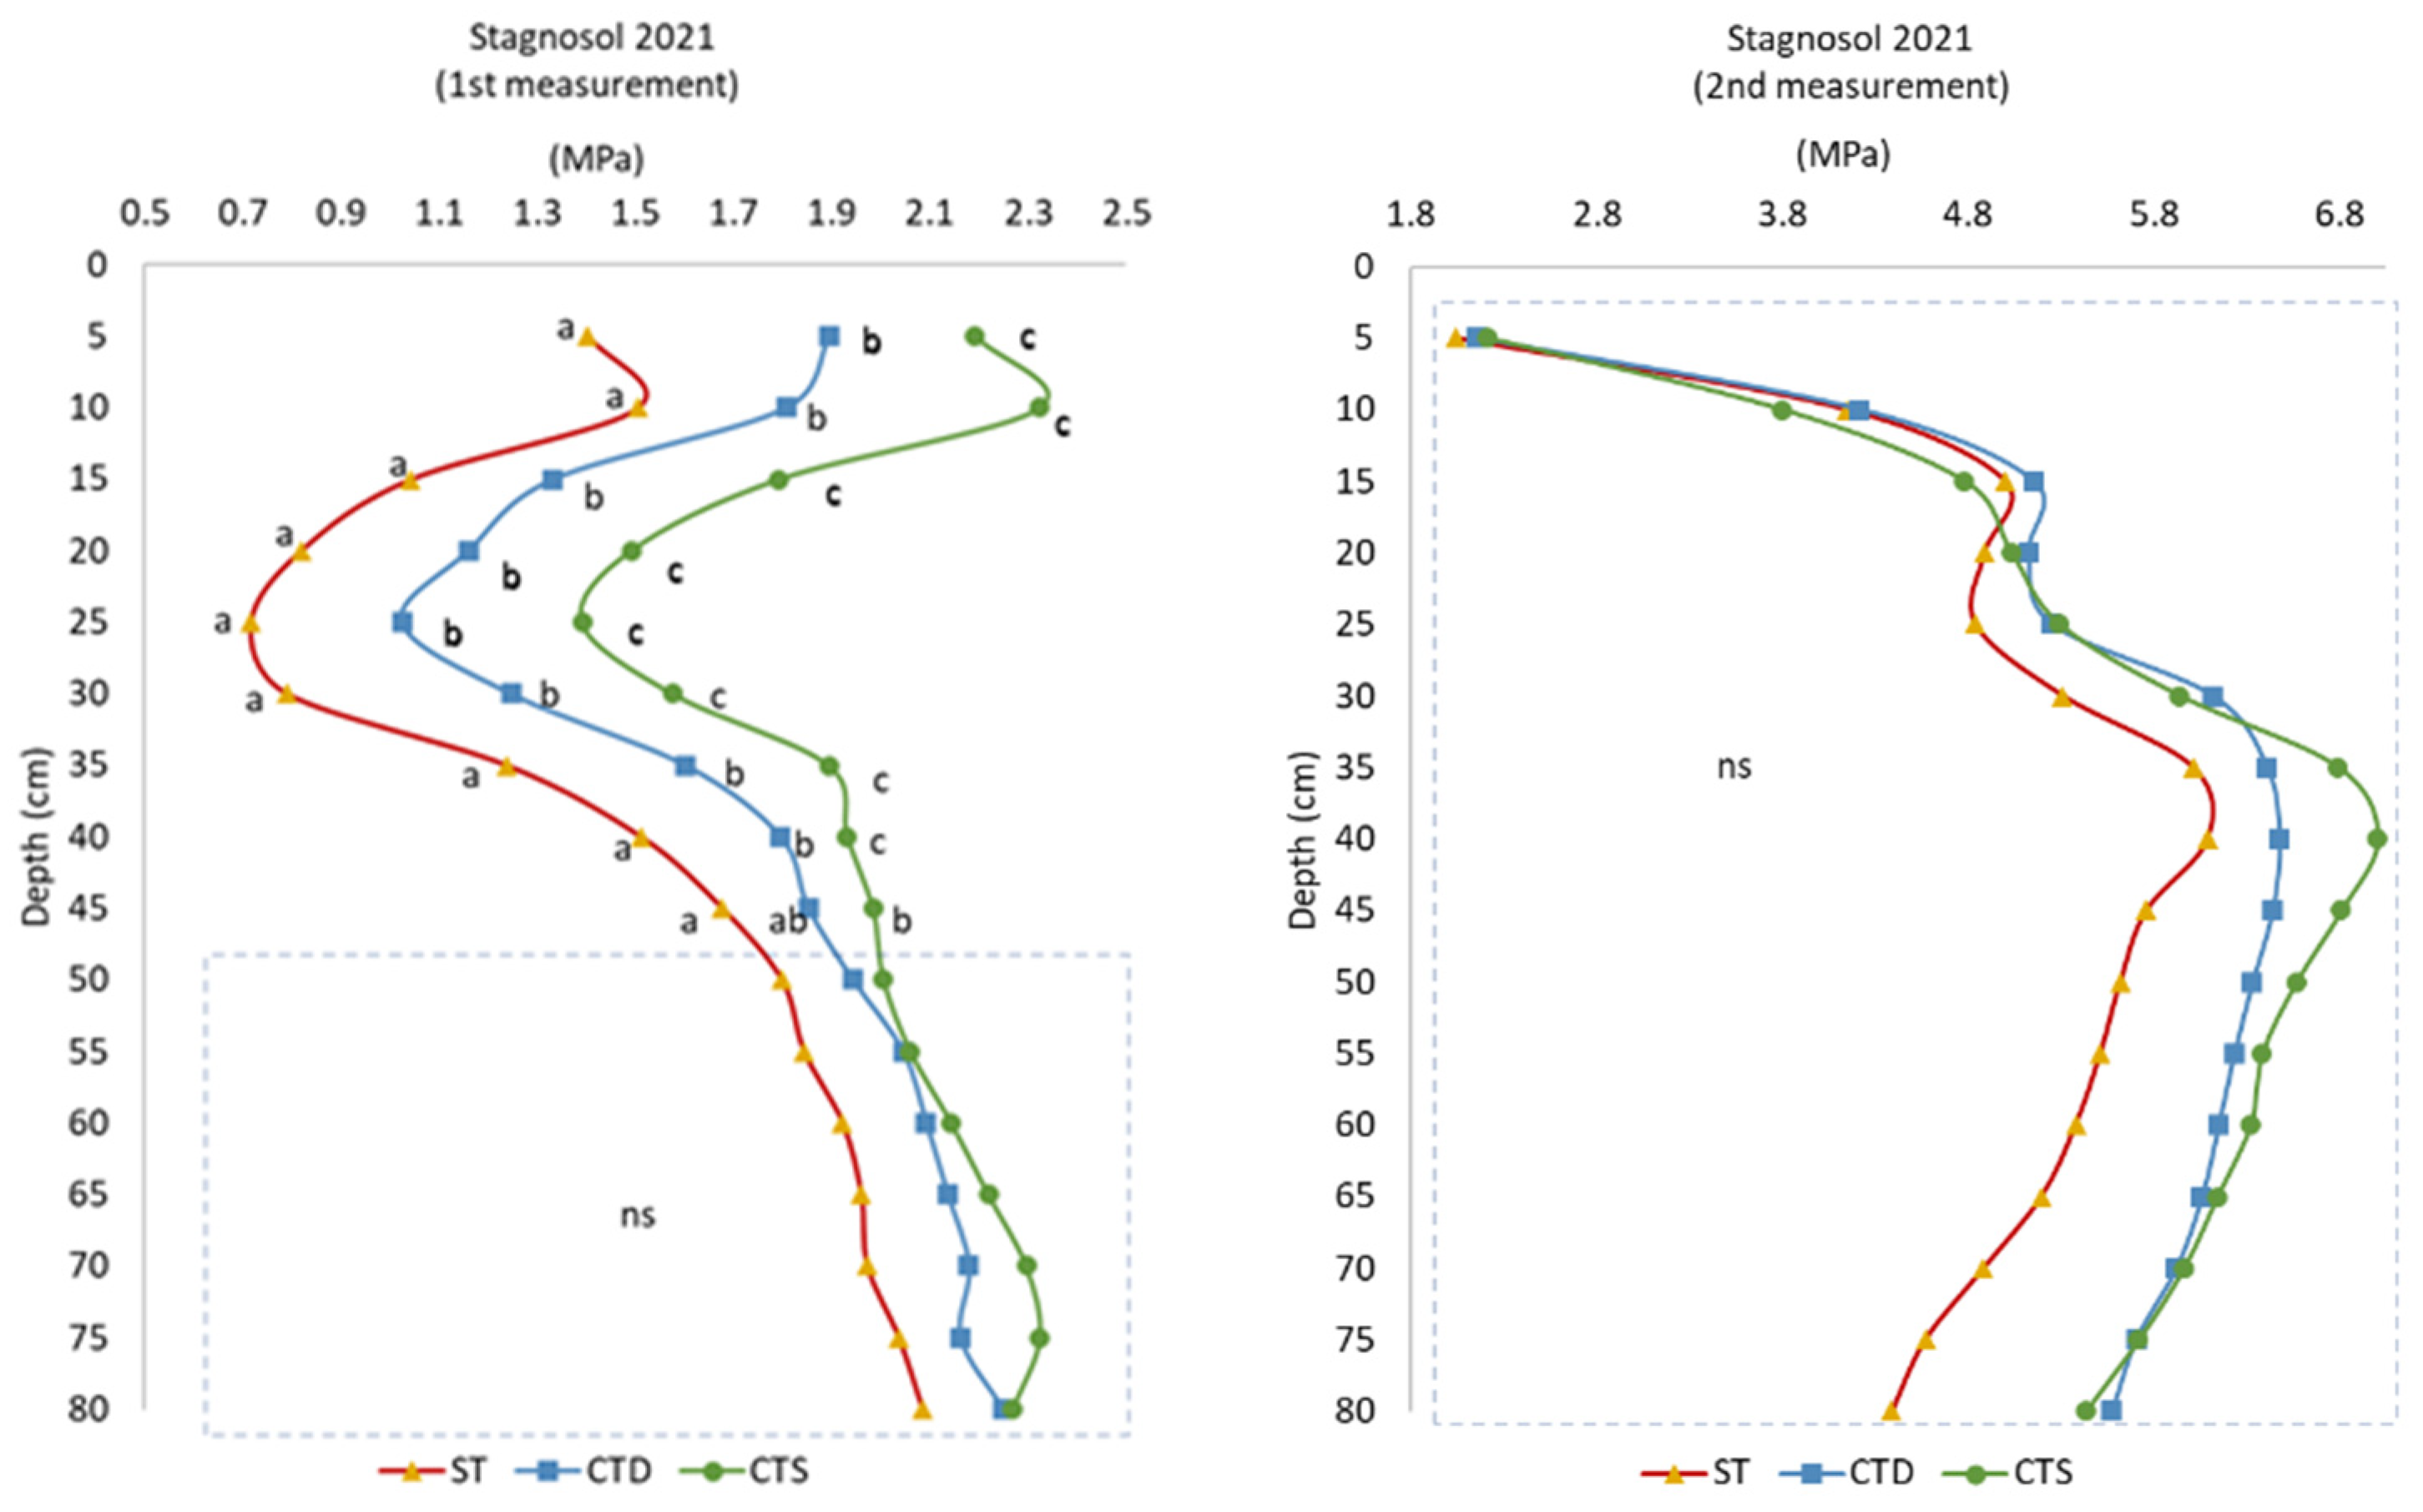
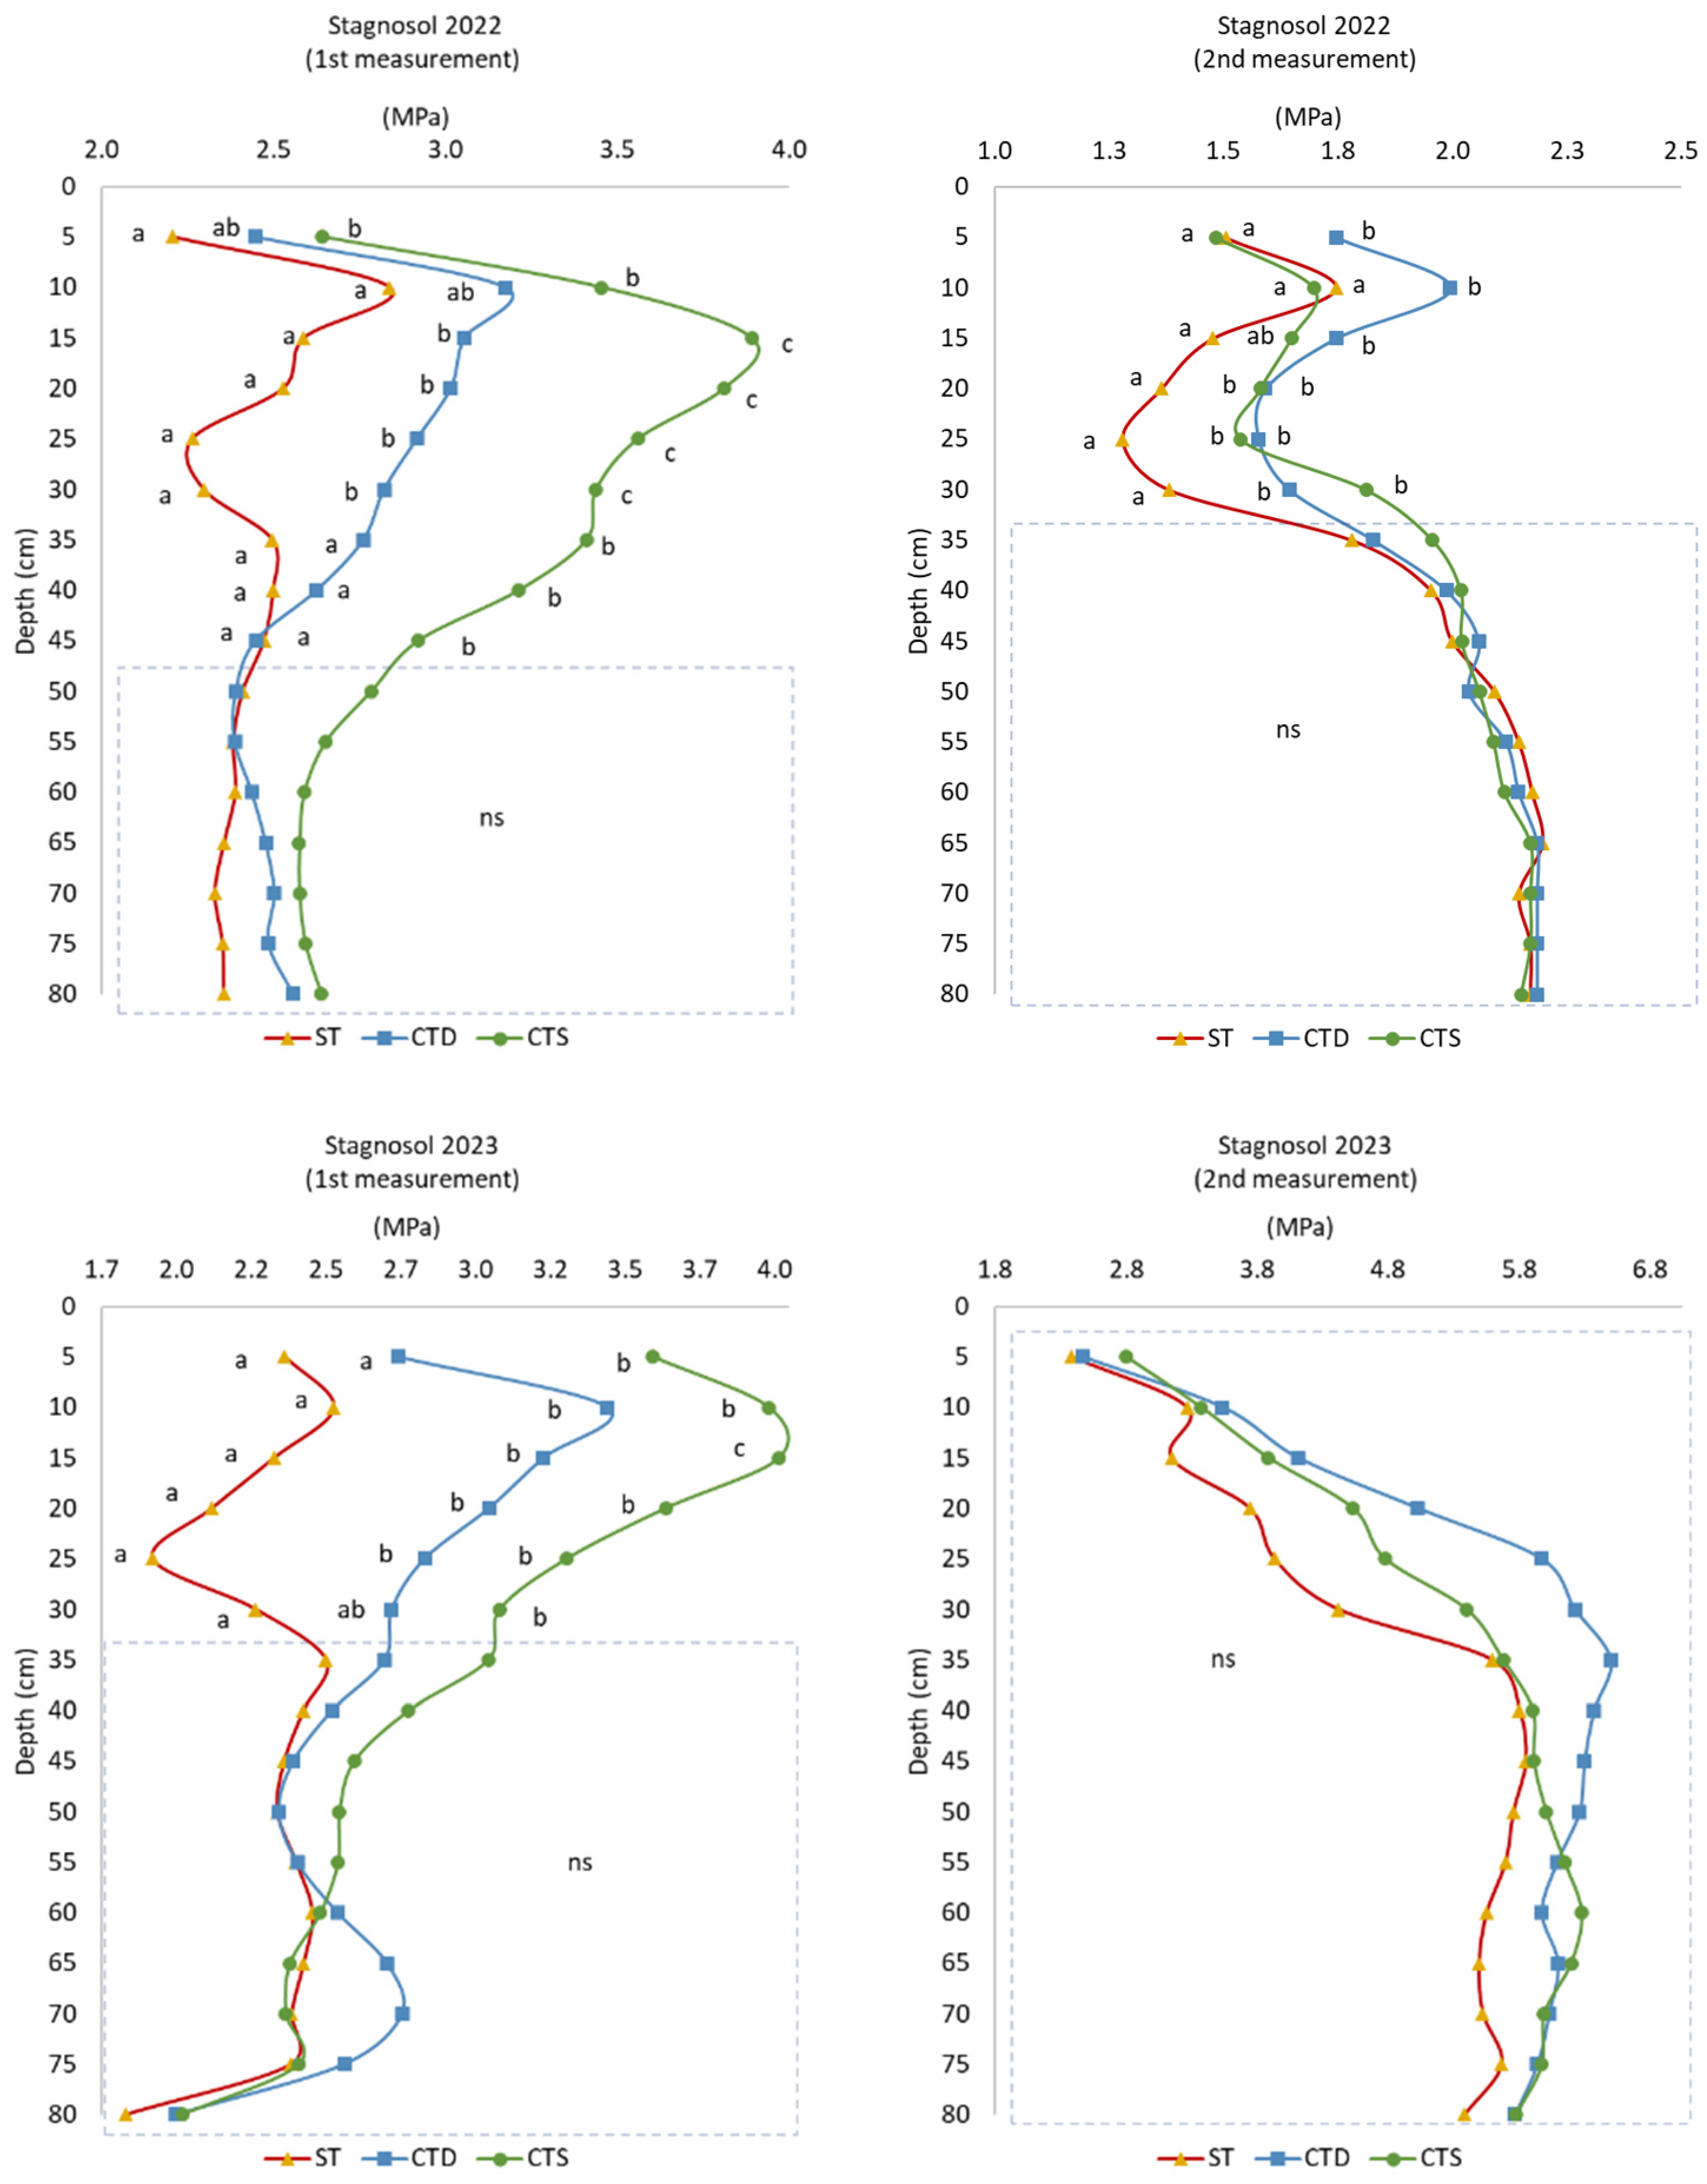
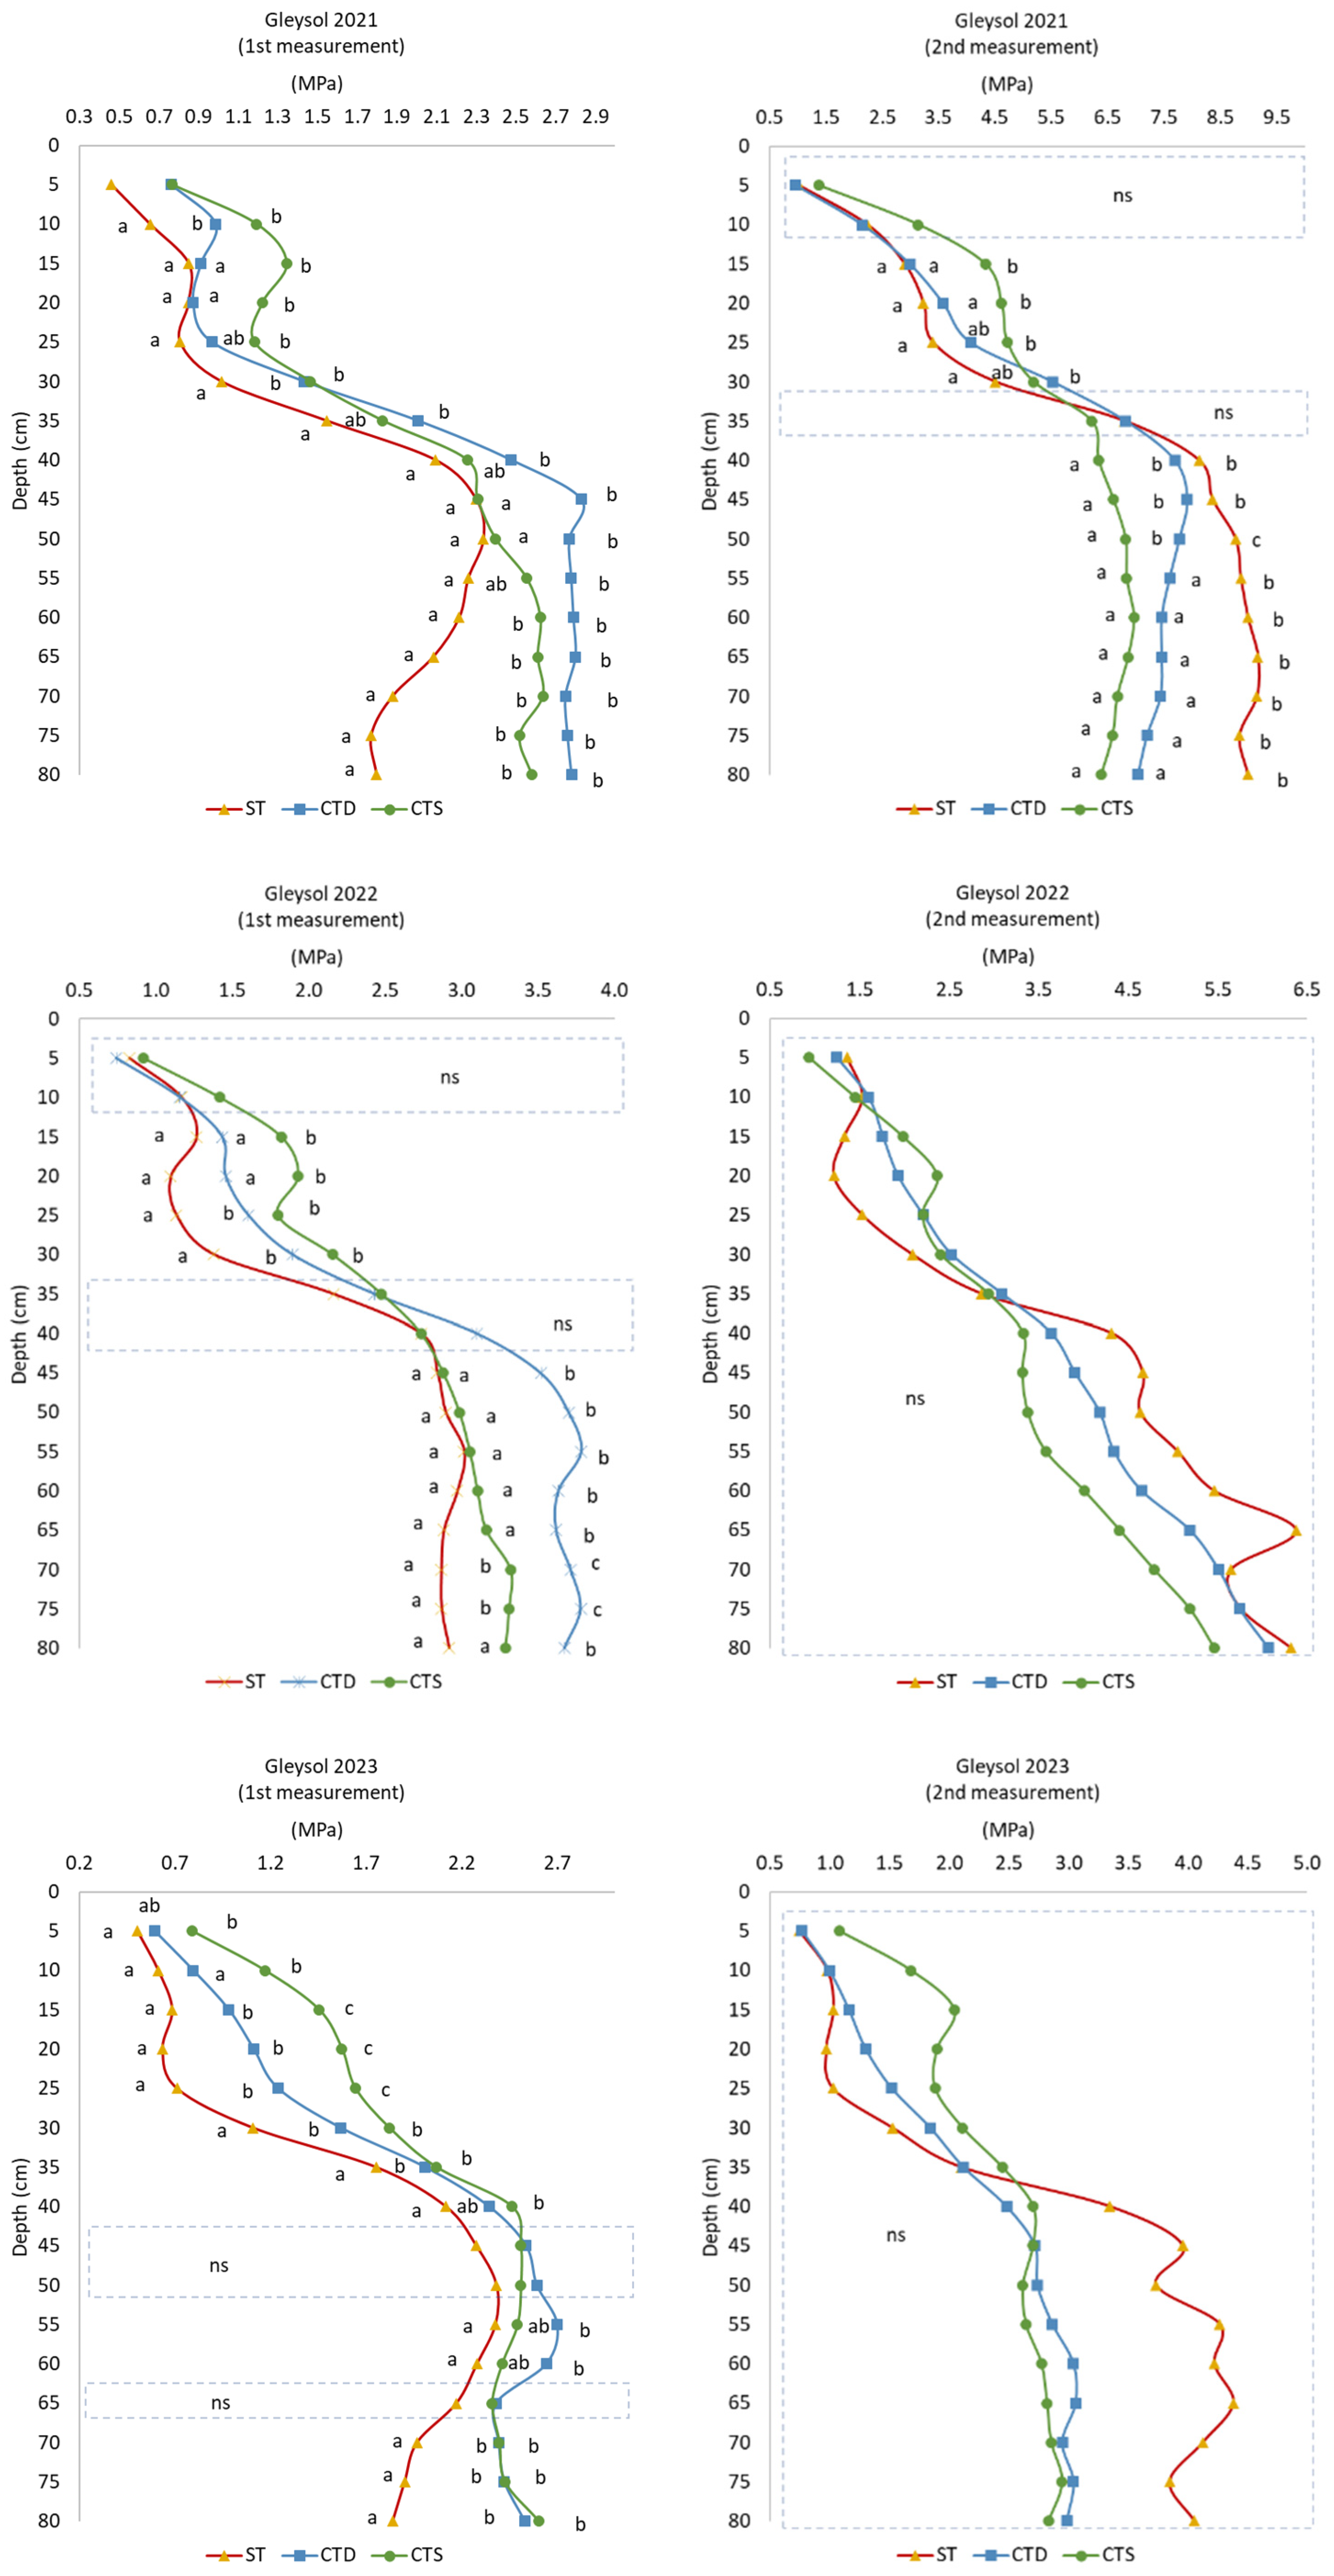
3. Results
4. Discussion
5. Conclusions
Author Contributions
Funding
Data Availability Statement
Conflicts of Interest
References
- Voltr, V.; Wollnerová, J.; Fuksa, P.; Hruška, M. Influence of Tillage on the Production Inputs, Outputs, Soil Compaction and GHG Emissions. Agriculture 2021, 11, 456. [Google Scholar] [CrossRef]
- Badalíková, B. Influence of Soil Tillage on Soil Compaction. In Soil Engineering; Dedousis, A.P., Bartzanas, T., Eds.; Springer: Berlin/Heidelberg, Germany, 2010; pp. 19–30. ISBN 978-3-642-03681-1. [Google Scholar]
- Busari, M.A.; Kukal, S.S.; Kaur, A.; Bhatt, R.; Dulazi, A.A. Conservation Tillage Impacts on Soil, Crop and the Environment. Int. Soil Water Conserv. Res. 2015, 3, 119–129. [Google Scholar] [CrossRef]
- Nyakudya, I.W.; Stroosnijder, L. Conservation Tillage of Rainfed Maize in Semi-Arid Zimbabwe: A Review. Soil Tillage Res. 2015, 145, 184–197. [Google Scholar] [CrossRef]
- Conservation Agriculture|Food and Agriculture Organization of the United Nations. Available online: https://www.fao.org/conservation-agriculture/en/ (accessed on 28 August 2024).
- Hussain, S.; Hussain, S.; Guo, R.; Sarwar, M.; Ren, X.; Krstic, D.; Aslam, Z.; Zulifqar, U.; Rauf, A.; Hano, C.; et al. Carbon Sequestration to Avoid Soil Degradation: A Review on the Role of Conservation Tillage. Plants 2021, 10, 2001. [Google Scholar] [CrossRef] [PubMed]
- Jug, D.; Jug, I.; Brozović, B.; Vukadinović, V.; Stipešević, B.; Đurđević, B. The Role of Conservation Agriculture in Mitigation and Adaptation to Climate Change. Poljoprivreda 2018, 24, 35–44. [Google Scholar] [CrossRef]
- Hessel, R.; Wyseure, G.; Panagea, I.S.; Alaoui, A.; Reed, M.S.; van Delden, H.; Muro, M.; Mills, J.; Oenema, O.; Areal, F.; et al. Soil-Improving Cropping Systems for Sustainable and Profitable Farming in Europe. Land 2022, 11, 780. [Google Scholar] [CrossRef]
- Reicosky, D.C. Conservation Tillage Is Not Conservation Agriculture. J. Soil Water Conserv. 2015, 70, 103A–108A. [Google Scholar] [CrossRef]
- Birkás, M.; Jug, D.; Kende, Z.; Kisic, I.; Szemők, A. Soil Tillage Responses to the Climate Threats—Revaluation of the Classic Theories. Agric. Conspec. Sci. 2018, 83, 1–9. [Google Scholar]
- Souza, R.; Hartzell, S.; Freire Ferraz, A.P.; de Almeida, A.Q.; de Sousa Lima, J.R.; Dantas Antonino, A.C.; de Souza, E.S. Dynamics of Soil Penetration Resistance in Water-Controlled Environments. Soil Tillage Res. 2021, 205, 104768. [Google Scholar] [CrossRef]
- Lardy, J.M.; DeSutter, T.M.; Daigh, A.L.M.; Meehan, M.A.; Staricka, J.A. Effects of Soil Bulk Density and Water Content on Penetration Resistance. Agric. Environ. Lett. 2022, 7, e20096. [Google Scholar] [CrossRef]
- Jug, D.; Đurđević, B.; Birkás, M.; Brozović, B.; Lipiec, J.; Vukadinović, V.; Jug, I. Effect of Conservation Tillage on Crop Productivity and Nitrogen Use Efficiency. Soil Tillage Res. 2019, 194, 104327. [Google Scholar] [CrossRef]
- Jug, I.; Brozović, B.; Đurđević, B.; Wilczewski, E.; Vukadinović, V.; Stipešević, B.; Jug, D. Response of Crops to Conservation Tillage and Nitrogen Fertilization under Different Agroecological Conditions. Agronomy 2021, 11, 2156. [Google Scholar] [CrossRef]
- Wang, X.; Sun, X.; Sun, L.; Chen, N.; Du, Y. Small-Scale Variability of Soil Quality in Permafrost Peatland of the Great Hing’an Mountains, Northeast China. Water 2022, 14, 2597. [Google Scholar] [CrossRef]
- Dexter, A.R.; Czyż, E.A.; Gaţe, O.P. A Method for Prediction of Soil Penetration Resistance. Soil Tillage Res. 2007, 93, 412–419. [Google Scholar] [CrossRef]
- Mohieddinne, H.; Brasseur, B.; Spicher, F.; Gallet-Moron, E.; Buridant, J.; Kobaissi, A.; Horen, H. Physical Recovery of Forest Soil after Compaction by Heavy Machines, Revealed by Penetration Resistance over Multiple Decades. For. Ecol. Manag. 2019, 449, 117472. [Google Scholar] [CrossRef]
- Colombi, T.; Torres, L.C.; Walter, A.; Keller, T. Feedbacks between Soil Penetration Resistance, Root Architecture and Water Uptake Limit Water Accessibility and Crop Growth—A Vicious Circle. Sci. Total Environ. 2018, 626, 1026–1035. [Google Scholar] [CrossRef]
- Dresbøll, D.B.; Thorup-Kristensen, K.; McKenzie, B.M.; Dupuy, L.X.; Bengough, A.G. Timelapse Scanning Reveals Spatial Variation in Tomato (Solanum lycopersicum L.) Root Elongation Rates during Partial Waterlogging. Plant Soil 2013, 369, 467–477. [Google Scholar] [CrossRef]
- Ferreira, C.S.S.; Seifollahi-Aghmiuni, S.; Destouni, G.; Ghajarnia, N.; Kalantari, Z. Soil Degradation in the European Mediterranean Region: Processes, Status and Consequences. Sci. Total Environ. 2022, 805, 150106. [Google Scholar] [CrossRef]
- Whalley, W.R.; To, J.; Kay, B.D.; Whitmore, A.P. Prediction of the Penetrometer Resistance of Soils with Models with Few Parameters. Geoderma 2007, 137, 370–377. [Google Scholar] [CrossRef]
- Soane, B.D.; van Ouwerkerk, C. Implications of Soil Compaction in Crop Production for the Quality of the Environment. Soil Tillage Res. 1995, 35, 5–22. [Google Scholar] [CrossRef]
- Arruda, A.B.; de Souza, R.F.; Brito, G.H.M.; de Moura, J.B.; de Oliveira, M.H.R.; dos Santos, J.M.; Dutra e Silva, S. Resistance of Soil to Penetration as a Parameter Indicator of Subsolation in Crop Areas of Sugar Cane. Sci. Rep. 2021, 11, 11780. [Google Scholar] [CrossRef] [PubMed]
- Wilczewski, E.; Jug, I.; Lipiec, J.; Gałęzewski, L.; Đurđević, B.; Kocira, A.; Brozović, B.; Marković, M.; Jug, D. Tillage System Regulates the Soil Moisture Tension, Penetration Resistance and Temperature Responses to the Temporal Variability of Precipitation during the Growing Season. Int. Agrophys. 2023, 37, 391–399. [Google Scholar] [CrossRef] [PubMed]
- Oliveira, P.D.D.; Sato, M.K.; de Lima, H.V.; Rodrigues, S.; Silva, A.P. da Critical Limits of the Degree of Compactness and Soil Penetration Resistance for the Soybean Crop in N Brazil. J. Plant Nutr. Soil Sci. 2016, 179, 78–87. [Google Scholar] [CrossRef]
- de Moraes, M.T.; Debiasi, H.; Franchini, J.C.; Mastroberti, A.A.; Levien, R.; Leitner, D.; Schnepf, A. Soil Compaction Impacts Soybean Root Growth in an Oxisol from Subtropical Brazil. Soil Tillage Res. 2020, 200, 104611. [Google Scholar] [CrossRef]
- Lipiec, J.; Hatano, R. Quantification of Compaction Effects on Soil Physical Properties and Crop Growth. Geoderma 2003, 116, 107–136. [Google Scholar] [CrossRef]
- Celik, İ. Effects of Tillage Methods on Penetration Resistance, Bulk Density and Saturated Hydraulic Conductivity in a Clayey Soil Conditions. J. Agric. Sci. 2011, 17, 143–156. [Google Scholar] [CrossRef]
- Liu, F.; Wu, H.; Zhao, Y.; Li, D.; Yang, J.-L.; Song, X.; Shi, Z.; Zhu, A.-X.; Zhang, G.-L. Mapping High Resolution National Soil Information Grids of China. Sci. Bull. 2022, 67, 328–340. [Google Scholar] [CrossRef]
- Ferreras, L.A.; Costa, J.L.; Garcia, F.O.; Pecorari, C. Effect of No-Tillage on Some Soil Physical Properties of a Structural Degraded Petrocalcic Paleudoll of the Southern “Pampa” of Argentina. Soil Tillage Res. 2000, 54, 31–39. [Google Scholar] [CrossRef]
- Tuba, G.; Kovács, G.; Sinka, L.; Nagy, P.; Rivera-Garcia, A.; Bajusová, Z.; Findura, P.; Zsembeli, J. Effect of Soil Conditioning on Soil Penetration Resistance and Traction Power Demand of Ploughing. Agric. Polnohospodárstvo 2021, 67, 113–123. [Google Scholar] [CrossRef]
- Bogunovic, I.; Trevisani, S.; Seput, M.; Juzbasic, D.; Durdevic, B. Short-Range and Regional Spatial Variability of Soil Chemical Properties in an Agro-Ecosystem in Eastern Croatia. Catena 2017, 154, 50–62. [Google Scholar] [CrossRef]
- Afzalinia, S.; Zabihi, J. Soil Compaction Variation during Corn Growing Season under Conservation Tillage. Soil Tillage Res. 2014, 137, 1–6. [Google Scholar] [CrossRef]
- Bogunovic, I.; Pereira, P.; Kisic, I.; Sajko, K.; Sraka, M. Tillage Management Impacts on Soil Compaction, Erosion and Crop Yield in Stagnosols (Croatia). CATENA 2018, 160, 376–384. [Google Scholar] [CrossRef]
- Bogunović, I.; Kisić, I. Compaction of a clay loam soil in pannonian region of Croatia under different tillage systems. J. Agric. Sci. Technol. 2017, 19, 475–486. [Google Scholar]
- Basic, F.; Kisic, I.; Butorac, A.; Nestroy, O.; Mesic, M. Runoff and Soil Loss under Different Tillage Methods on Stagnic Luvisols in Central Croatia. Soil Tillage Res. 2001, 62, 145–151. [Google Scholar] [CrossRef]
- Basic, F.; Kisic, I.; Mesic, M.; Nestroy, O.; Butorac, A. Tillage and Crop Management Effects on Soil Erosion in Central Croatia. Soil Tillage Res. 2004, 78, 197–206. [Google Scholar] [CrossRef]
- Bašić, F.; Bogunović, M.; Božić, M.; Husnjak, S.; Jurić, I.; Kisić, I.; Mesić, M.; Mirošević, N.; Romić, D.; Žugec, I. Regionalisation of Croatian Agriculture. Agric. Conspec. Sci. 2007, 72, 27–38. [Google Scholar]
- FAO. Soils and Creating Legends for Soil Maps; World Soil Resources Reports No.106; FAO: Rome, Italy, 2015; Available online: www.fao.org/3/i3794en/I3794en.pdf (accessed on 28 August 2024).
- Li, Y.; Cui, S.; Chang, S.X.; Zhang, Q. Liming Effects on Soil pH and Crop Yield Depend on Lime Material Type, Application Method and Rate, and Crop Species: A Global Meta-Analysis. J. Soils Sediments 2019, 19, 1393–1406. [Google Scholar] [CrossRef]
- Đurđević, B.; Vukadinović, V.; Bertić, B.; Jug, I.; Vukadinović, V.; Jurišić, M.; Dolijanović, Ž.; Andrijačić, M. Liming of Acid Soils in Osijek-Baranja County. J. Agric. Sci. Belgrade 2011, 56, 187–195. [Google Scholar]
- 14:00–17:00 ISO 11461:2001. Available online: https://www.iso.org/standard/33031.html (accessed on 18 September 2024).
- TIBCO® Data Science—Workbench 14.1.0. Available online: https://docs.tibco.com/products/tibco-data-science-workbench-14-1-0 (accessed on 28 August 2024).
- Horn, R. Time Dependence of Soil Mechanical Properties and Pore Functions for Arable Soils. Soil Sci. Soc. Am. J. 2004, 68, 1131–1137. [Google Scholar] [CrossRef]
- Kuhwald, M.; Hamer, W.B.; Brunotte, J.; Duttmann, R. Soil Penetration Resistance after One-Time Inversion Tillage: A Spatio-Temporal Analysis at the Field Scale. Land 2020, 9, 482. [Google Scholar] [CrossRef]
- Upadhyay, G.; Raheman, H. Comparative Analysis of Tillage in Sandy Clay Loam Soil by Free Rolling and Powered Disc Harrow. Eng. Agric. Environ. Food 2019, 12, 118–125. [Google Scholar] [CrossRef]
- Rubinić, V.; Galović, L.; Husnjak, S.; Durn, G. Climate vs. Parent Material—Which Is the Key of Stagnosol Diversity in Croatia? Geoderma 2015, 241–242, 250–261. [Google Scholar] [CrossRef]
- Gozubuyuk, Z.; Sahin, U.; Ozturk, I.; Celik, A.; Adiguzel, M.C. Tillage Effects on Certain Physical and Hydraulic Properties of a Loamy Soil under a Crop Rotation in a Semi-Arid Region with a Cool Climate. CATENA 2014, 118, 195–205. [Google Scholar] [CrossRef]
- Kovács, G.P.; Simon, B.; Balla, I.; Bozóki, B.; Dekemati, I.; Gyuricza, C.; Percze, A.; Birkás, M. Conservation Tillage Improves Soil Quality and Crop Yield in Hungary. Agronomy 2023, 13, 894. [Google Scholar] [CrossRef]
- Taylor, H.M.; Gardner, H.R. Penetration of Cotton Seedlingn Taproots as Influenced By Bulk Density, Moisture Content, and Strength of Soil. Soil Sci. 1963, 96, 153. [Google Scholar] [CrossRef]
- Håkansson, I.; Lipiec, J. A Review of the Usefulness of Relative Bulk Density Values in Studies of Soil Structure and Compaction. Soil Tillage Res. 2000, 53, 71–85. [Google Scholar] [CrossRef]
- Birkás, M.; Jolánkai, M.; Schmidt, R. Environmentally-Sound Adaptable Tillage—Solutions from Hungary. In 1st Scientific Agronomic Days; Hruba, M., Ed.; University of Agriculture: Nyitra, Slovakia, 2008; pp. 191–194. [Google Scholar]
- Tabor, N.J.; Myers, T.S.; Michel, L.A. Sedimentologist’s Guide for Recognition, Description, and Classification of Paleosols. In Terrestrial Depositional Systems; Zeigler, K.E., Parker, W.G., Eds.; Elsevier: Hoboken, NJ, USA, 2017; pp. 165–208. ISBN 978-0-12-803243-5. [Google Scholar]
- Bengough, A.G.; McKenzie, B.M.; Hallett, P.D.; Valentine, T.A. Root Elongation, Water Stress, and Mechanical Impedance: A Review of Limiting Stresses and Beneficial Root Tip Traits. J. Exp. Bot. 2011, 62, 59–68. [Google Scholar] [CrossRef]
- Bašić, F.; Kisić, I.; Mesić, M. Framework of Climate Change—And Soil Type—Oriented Tillage and Land Management in Croatia; CROSTRO: Osijek, Croatia, 2012; pp. 55–72. ISBN 978-963-269-268-5. [Google Scholar]

| Parameter | ES1 1 | ES2 |
|---|---|---|
| Location | 17°86′36″ E | 16°33′32″ E |
| 45°61′32″ N | 46°01′38″ N | |
| 111 m a. s. l. | 141 m a. s. l. | |
| Mechanical properties | ||
| Soil type | Stagnosol | Gleysol |
| Soil texture | Silty clay loam | Silt |
| Soil particles (%) 4 | Depth 2 0–32 cm: | Depth 0–36 cm: |
| Silt = 60.84 | Silt = 82.95 | |
| Clay = 29.35 | Clay = 9.61 | |
| Sand = 9.81 | Sand = 7.44 | |
| Depth 32–65 cm: | Depth 36–97 cm: | |
| Silt = 57.61 | Silt = 80.41 | |
| Clay = 34.08 | Clay = 14.08 | |
| Sand = 8.31 | Sand = 5.52 | |
| Depth 65–200 cm: | Depth 97–175 cm: | |
| Silt = 58.92 | Silt = 78.96 | |
| Clay = 30.29 | Clay = 14.90 | |
| Sand = 10.79 | Sand = 6.15 | |
| Physical properties | ||
| Field capacity—FC (vol.%) | D1 3: 43.04 | D4: 42.44 |
| D2: 42.58 | D5: 37.69 | |
| D3: 40.13 | D6: 36.31 | |
| Particle density—ρb (g cm−3) | D1: 2.65 | D4: 2.69 |
| D2: 2.74 | D5: 2.73 | |
| D3: 2.71 | D6: 2.78 | |
| Packing density—PD (g cm−3) | D1: 1.76 | D4: 1.51 |
| D2: 1.87 | D5: 1.73 | |
| D3: 1.83 | D6: 1.79 | |
| Total porosity—ε (%) | D1: 43.50 | D4: 47.21 |
| D2: 42.97 | D5: 41.39 | |
| D3: 40.65 | D6: 39.91 | |
| Chemical properties | ||
| pH(KCl) | D1: 3.92 | D4: 5.22 |
| D2: 4.23 | D5: 5.73 | |
| D3: 4.39 | D6: 5.68 | |
| pH(H2O) | D1: 5.12 | D4: 6.65 |
| D2: 6.16 | D5: 7.44 | |
| D3: 5.92 | D6: 7.50 | |
| Hidrolitic acidity—Hy (cmol(+) kg−1) | D1: 7.48 | D4: 2.47 |
| D2: 4.07 | D5: – | |
| D3: 3.15 | D6: – | |
| P2O5 (AL), mg kg−1 soil | D1: 75 | D4: 154 |
| D2: 20 | D5: 26 | |
| D3: 18 | D6: 32 | |
| K2O (AL), mg kg−1 soil | D1: 111 | D4: 75 |
| D2: 107 | D5: 52 | |
| D3: 114 | D6: 48 | |
| Soil Organic Matter—SOM (%) | D1: 2.83 | D4: 1.64 |
| D2: 0.83 | D5: 0.52 | |
| D3: 0.48 | D6: 0.41 | |
| Site | Year | Month | |||||||
|---|---|---|---|---|---|---|---|---|---|
| April | May | June | July | August | September | Tvp 1 | Avp 2 | ||
| Precipitation (mm) | |||||||||
| ES1 | 2021 | 41 | 20 | 34 | 135 | 52 | 29 | 311 | |
| 2022 | 1 | 60 | 69 | 19 | 62 | 217 | 427 | ||
| 2023 | 101 | 239 | 56 | 70 | 31 | 71 | 568 | ||
| LTA | 63 | 75 | 95 | 69 | 70 | 77 | 449 | ||
| ES2 | 2021 | 55 | 17 | 4 | 56 | 60 | 35 | 227 | |
| 2022 | 0 | 70 | 57 | 12 | 18 | 168 | 325 | ||
| 2023 | 64 | 11 | 119 | 47 | 12 | 1 | 254 | ||
| LTA 3 | 53 | 70 | 81 | 70 | 78 | 93 | 445 | ||
| Air temperature (°C) | |||||||||
| ES1 | 2021 | 10.7 | 14.7 | 22.1 | 23.4 | 20.8 | 16.9 | 18.1 | |
| 2022 | 13.7 | 17.8 | 22.5 | 23.3 | 22.8 | 16.4 | 19.4 | ||
| 2023 | 10.3 | 15.9 | 21.0 | 23.8 | 22.7 | 20.1 | 18.9 | ||
| LTA | 11.6 | 16.3 | 19.7 | 21.8 | 21.1 | 16.4 | 17.8 | ||
| ES2 | 2021 | 11.0 | 13.9 | 21.5 | 22.2 | 19.6 | 15.2 | 17.2 | |
| 2022 | 10.0 | 16.9 | 21.5 | 22.0 | 21.5 | 15.5 | 17.9 | ||
| 2023 | 9.2 | 14.9 | 19.6 | 21.9 | 20.8 | 18.0 | 17.4 | ||
| LTA | 11.2 | 15.8 | 19.2 | 21.0 | 20.3 | 15.5 | 17.2 | ||
| Season | Crop | Site | Sowing Date | Harvest Date | Penetration Resistance Measurement | |
|---|---|---|---|---|---|---|
| GS | Date 2 | |||||
| 2020/2021 | Maize | ES1 1 | 6 May 2021 2 | 22 September 2021 | V3 | 4 June 2021 |
| R5 | 23 September 2021 | |||||
| ES2 | 10 May 2021 | 25 September 2021 | V3 | 5 June 2021 | ||
| R5 | 25 September 2021 | |||||
| 2021/2022 | Soybean | ES1 1 | 14 January 2022 | 29 September 2022 | V3 | 27 May 2022 |
| R8 | 17 October 2022 | |||||
| ES2 | 29 April 2022 | 3 October 2022 | V3 | 3 June 2022 | ||
| R8 | 17 October 2022 | |||||
| 2022/2023 | Winter | ES1 1 | 20 October 2022 | 6 July 2023 | Feekes 6 | 10 April 2023 |
| wheat | Feekes 11 | 10 April 2023 | ||||
| ES2 | 21 October 2022 | 12 July 2023 | Feekes 6 | 1 June 2023 | ||
| Feekes 11 | 1 June 2023 | |||||
| d.f. | 2021 | 2022 | 2023 | ||||
|---|---|---|---|---|---|---|---|
| 1st | 2nd | 1st | 2nd | 1st | 2nd | ||
| Stagnosol | |||||||
| Tillage (T) | 2 | * | * | * | * | * | * |
| Depth (D) | 15 | * | * | * | * | * | * |
| T × D | 30 | * | ns | * | * | * | ns |
| Gleysol | |||||||
| Tillage (T) | 2 | * | * | * | * | * | * |
| Depth (D) | 15 | * | * | * | * | * | * |
| T × D | 30 | * | * | * | ns | * | ns |
| Depth 3 MPa | 1 2.08 | 2 4.00 | 3 4.93 | 4 4.96 | 5 5.08 | 6 5.74 | 7 6.35 | 8 6.47 | 9 6.29 | 10 6.12 | 11 5.99 | 12 5.90 | 13 5.75 | 14 5.54 | 15 5.28 | 16 5.08 |
|---|---|---|---|---|---|---|---|---|---|---|---|---|---|---|---|---|
| 1 | * | * | * | * | * | * | * | * | * | * | * | * | * | * | * | |
| 2 | * 2 | * | * | * | * | * | * | * | * | * | * | * | * | * | * | |
| 3 | * | * | ns | ns | * | * | * | * | * | * | * | * | * | * | ns | |
| 4 | * | * | ns | ns | * | * | * | * | * | * | * | * | * | ns | ns | |
| 5 | * | * | ns | ns | * | * | * | * | * | * | * | * | * | ns | ns | |
| 6 | * | * | * | * | * | * | * | * | * | ns | ns | ns | ns | * | * | |
| 7 | * | * | * | * | * | * | ns | ns | ns | * | * | * | * | * | * | |
| 8 | * | * | * | * | * | * | ns | ns | * | * | * | * | * | * | * | |
| 9 | * | * | * | * | * | * | ns | ns | ns | ns | * | * | * | * | * | |
| 10 | * | * | * | * | * | * | ns | * | ns | ns | ns | * | * | * | * | |
| 11 | * | * | * | * | * | ns | * | * | ns | ns | ns | ns | * | * | * | |
| 12 | * | * | * | * | * | ns | * | * | * | ns | ns | ns | * | * | * | |
| 13 | * | * | * | * | * | ns | * | * | * | * | ns | ns | ns | * | * | |
| 14 | * | * | * | * | * | ns | * | * | * | * | * | * | ns | ns | * | |
| 15 | * | * | * | ns | ns | * | * | * | * | * | * | * | * | ns | ns | |
| 16 | * | * | ns | ns | ns | * | * | * | * | * | * | * | * | * | ns |
| Depth 3 MPa | 1 2.50 | 2 3.34 | 3 3.66 | 4 4.38 | 5 4.84 | 6 5.30 | 7 5.87 | 8 5.98 | 9 5.97 | 10 5.96 | 11 5.93 | 12 5.88 | 13 5.88 | 14 5.80 | 15 5.81 | 16 5.59 |
|---|---|---|---|---|---|---|---|---|---|---|---|---|---|---|---|---|
| 1 | * | * | * | * | * | * | * | * | * | * | * | * | * | * | * | |
| 2 | * 2 | ns | * | * | * | * | * | * | * | * | * | * | * | * | * | |
| 3 | * | ns | ns | * | * | * | * | * | * | * | * | * | * | * | * | |
| 4 | * | * | ns | ns | * | * | * | * | * | * | * | * | * | * | * | |
| 5 | * | * | * | ns | ns | * | * | * | * | * | * | * | * | * | * | |
| 6 | * | * | * | * | ns | ns | ns | ns | ns | ns | ns | ns | ns | ns | ns | |
| 7 | * | * | * | * | * | ns | ns | ns | ns | ns | ns | ns | ns | ns | ns | |
| 8 | * | * | * | * | * | * | ns | ns | ns | ns | ns | ns | ns | ns | ns | |
| 9 | * | * | * | * | * | * | ns | ns | ns | ns | ns | ns | ns | ns | ns | |
| 10 | * | * | * | * | * | * | ns | ns | ns | ns | ns | ns | ns | ns | ns | |
| 11 | * | * | * | * | * | * | ns | ns | ns | ns | ns | ns | ns | ns | ns | |
| 12 | * | * | * | * | * | * | ns | ns | ns | ns | ns | ns | ns | ns | ns | |
| 13 | * | * | * | * | * | * | ns | ns | ns | ns | ns | ns | ns | ns | ns | |
| 14 | * | * | * | * | * | * | ns | ns | ns | ns | ns | ns | ns | ns | ns | |
| 15 | * | * | * | * | * | * | ns | ns | ns | ns | ns | ns | ns | ns | ns | |
| 16 | * | * | * | * | * | * | ns | ns | ns | ns | ns | ns | ns | ns | ns |
| Depth 3 MPa | 1 1.18 | 2 1.53 | 3 1.69 | 4 1.83 | 5 1.98 | 6 2.34 | 7 2.96 | 8 3.76 | 9 3.96 | 10 4.06 | 11 4.32 | 12 4.70 | 13 5.32 | 14 5.31 | 15 5.56 | 16 5.95 |
|---|---|---|---|---|---|---|---|---|---|---|---|---|---|---|---|---|
| 1 | ns | ns | ns | * | * | * | * | * | * | * | * | * | * | * | * | |
| 2 | ns 2 | ns | ns | ns | * | * | * | * | * | * | * | * | * | * | * | |
| 3 | ns | ns | ns | ns | ns | * | * | * | * | * | * | * | * | * | * | |
| 4 | ns | ns | ns | ns | ns | * | * | * | * | * | * | * | * | * | * | |
| 5 | * | ns | ns | ns | ns | * | * | * | * | * | * | * | * | * | * | |
| 6 | * | * | ns | ns | ns | ns | * | * | * | * | * | * | * | * | * | |
| 7 | * | * | * | * | * | ns | * | * | * | * | * | * | * | * | * | |
| 8 | * | * | * | * | * | * | * | ns | ns | ns | * | * | * | * | * | |
| 9 | * | * | * | * | * | * | * | ns | ns | ns | * | * | * | * | * | |
| 10 | * | * | * | * | * | * | * | ns | ns | ns | ns | * | * | * | * | |
| 11 | * | * | * | * | * | * | * | ns | ns | ns | ns | * | * | * | * | |
| 12 | * | * | * | * | * | * | * | * | * | ns | ns | ns | ns | * | * | |
| 13 | * | * | * | * | * | * | * | * | * | * | * | ns | ns | ns | ns | |
| 14 | * | * | * | * | * | * | * | * | * | * | * | ns | ns | ns | ns | |
| 15 | * | * | * | * | * | * | * | * | * | * | * | * | ns | ns | ns | |
| 16 | * | * | * | * | * | * | * | * | * | * | * | * | ns | ns | ns |
| Depth 3 MPa | 1 0.87 | 2 1.22 | 3 1.41 | 4 1.39 | 5 1.48 | 6 1.83 | 7 2.22 | 8 2.84 | 9 3.12 | 10 3.03 | 11 3.26 | 12 3.34 | 13 3.42 | 14 3.31 | 15 3.28 | 16 3.29 |
|---|---|---|---|---|---|---|---|---|---|---|---|---|---|---|---|---|
| 1 | ns | ns | ns | ns | * | * | * | * | * | * | * | * | * | * | * | |
| 2 | ns 2 | ns | ns | ns | ns | * | * | * | * | * | * | * | * | * | * | |
| 3 | ns | ns | ns | ns | ns | ns | * | * | * | * | * | * | * | * | * | |
| 4 | ns | ns | ns | ns | ns | ns | * | * | * | * | * | * | * | * | * | |
| 5 | ns | ns | ns | ns | ns | ns | * | * | * | * | * | * | * | * | * | |
| 6 | * | ns | ns | ns | ns | ns | * | * | * | * | * | * | * | * | * | |
| 7 | * | * | ns | ns | ns | ns | ns | * | ns | * | * | * | * | * | * | |
| 8 | * | * | * | * | * | * | ns | ns | ns | ns | ns | ns | ns | ns | ns | |
| 9 | * | * | * | * | * | * | * | ns | ns | ns | ns | ns | ns | ns | ns | |
| 10 | * | * | * | * | * | * | ns | ns | ns | ns | ns | ns | ns | ns | ns | |
| 11 | * | * | * | * | * | * | * | ns | ns | ns | ns | ns | ns | ns | ns | |
| 12 | * | * | * | * | * | * | * | ns | ns | ns | ns | ns | ns | ns | ns | |
| 13 | * | * | * | * | * | * | * | ns | ns | ns | ns | ns | ns | ns | ns | |
| 14 | * | * | * | * | * | * | * | ns | ns | ns | ns | ns | ns | ns | ns | |
| 15 | * | * | * | * | * | * | * | ns | ns | ns | ns | ns | ns | ns | ns | |
| 16 | * | * | * | * | * | * | * | ns | ns | ns | ns | ns | ns | ns | ns |
| Year | Depth (cm) | Stagnosol | Gleysol | ||||||||||
|---|---|---|---|---|---|---|---|---|---|---|---|---|---|
| Measuring 1 | Measuring 2 | Measuring 1 | Measuring 2 | ||||||||||
| ST | CTD | CTS | ST | CTD | CTS | ST | CTD | CTS | ST | CTD | CTS | ||
| 2021 | 0–20 | 33.1 | 37.2 | 35.9 | 27.2 | 16.4 | 19.7 | 39.6 | 36.6 | 39.7 | 24.5 | 28.2 | 27.3 |
| 20–40 | 41.3 | 41.3 | 42.0 | 25.4 | 14.3 | 19.0 | 40.3 | 37.4 | 42.6 | 13.8 | 20.1 | 18.7 | |
| 40–60 | 36.1 | 37.2 | 36.9 | 21.0 | 16.4 | 18.8 | 39.9 | 40.9 | 37.0 | 16.2 | 15.7 | 19.4 | |
| 60–80 | 44.5 | 41.4 | 37.8 | 21.4 | 17.9 | 18.1 | 42.1 | 40.0 | 38.7 | 16.6 | 16.2 | 15.6 | |
| 2022 | 0–20 | 36.1 | 37.2 | 34.7 | 34.7 | 38.9 | 34.0 | 31.3 | 35.2 | 35.9 | 34.7 | 38.0 | 31.0 |
| 20–40 | 40.9 | 38.7 | 36.9 | 35.9 | 40.4 | 40.0 | 34.1 | 39.6 | 40.7 | 35.9 | 42.3 | 38.9 | |
| 40–60 | 37.7 | 33.1 | 35.2 | 41.6 | 40.6 | 40.2 | 36.8 | 34.1 | 35.2 | 39.6 | 42.7 | 40.1 | |
| 60–80 | 42.8 | 37.3 | 40.6 | 40.3 | 39.4 | 39.3 | 32.7 | 36.9 | 38.6 | 40.4 | 38.8 | 39.6 | |
| 2023 | 0–20 | 44.3 | 44.5 | 42.3 | 40.0 | 42.1 | 41.4 | 43.2 | 43.1 | 43.9 | 43.1 | 43.0 | 46.0 |
| 20–40 | 43.2 | 42.9 | 41.6 | 41.1 | 41.8 | 42.4 | 42.9 | 41.4 | 44.2 | 40.1 | 42.7 | 43.8 | |
| 40–60 | 45.7 | 44.2 | 44.7 | 41.2 | 42.7 | 42.2 | 41.1 | 43.2 | 42.5 | 39.6 | 40.5 | 44.1 | |
| 60–80 | 43.6 | 42.7 | 42.8 | 39.8 | 42.1 | 42.5 | 41.6 | 42.1 | 41.4 | 42.9 | 43.6 | 41.9 | |
| average | 40.8 | 39.8 | 39.3 | 34.1 | 32.8 | 33.1 | 38.8 | 39.2 | 40.0 | 32.3 | 34.3 | 33.9 | |
| min | 33.1 | 33.1 | 34.7 | 21.0 | 14.3 | 18.1 | 31.3 | 34.1 | 35.2 | 13.8 | 15.7 | 15.6 | |
| max | 45.7 | 44.5 | 44.7 | 41.6 | 42.7 | 42.5 | 43.2 | 43.2 | 44.2 | 43.2 | 43.6 | 46.0 | |
| Me | 42.0 | 40.0 | 39.2 | 37.9 | 39.9 | 39.7 | 40.1 | 39.8 | 40.2 | 37.8 | 39.7 | 39.3 | |
| SD | 4.0 | 3.5 | 3.4 | 8.1 | 12.3 | 10.8 | 4.1 | 3.1 | 3.0 | 11.2 | 11.1 | 11.0 | |
| CV | 9.9 | 8.8 | 8.7 | 23.7 | 37.4 | 32.5 | 10.6 | 7.9 | 7.6 | 34.8 | 32.3 | 32.6 | |
Disclaimer/Publisher’s Note: The statements, opinions and data contained in all publications are solely those of the individual author(s) and contributor(s) and not of MDPI and/or the editor(s). MDPI and/or the editor(s) disclaim responsibility for any injury to people or property resulting from any ideas, methods, instructions or products referred to in the content. |
© 2024 by the authors. Licensee MDPI, Basel, Switzerland. This article is an open access article distributed under the terms and conditions of the Creative Commons Attribution (CC BY) license (https://creativecommons.org/licenses/by/4.0/).
Share and Cite
Jug, D.; Jug, I.; Radočaj, D.; Wilczewski, E.; Đurđević, B.; Jurišić, M.; Zsembeli, J.; Brozović, B. Spatio-Temporal Dynamics of Soil Penetration Resistance Depending on Different Conservation Tillage Systems. Agronomy 2024, 14, 2168. https://doi.org/10.3390/agronomy14092168
Jug D, Jug I, Radočaj D, Wilczewski E, Đurđević B, Jurišić M, Zsembeli J, Brozović B. Spatio-Temporal Dynamics of Soil Penetration Resistance Depending on Different Conservation Tillage Systems. Agronomy. 2024; 14(9):2168. https://doi.org/10.3390/agronomy14092168
Chicago/Turabian StyleJug, Danijel, Irena Jug, Dorijan Radočaj, Edward Wilczewski, Boris Đurđević, Mladen Jurišić, Jozsef Zsembeli, and Bojana Brozović. 2024. "Spatio-Temporal Dynamics of Soil Penetration Resistance Depending on Different Conservation Tillage Systems" Agronomy 14, no. 9: 2168. https://doi.org/10.3390/agronomy14092168