Article

Genome-Wide Association Analysis and Candidate Gene Prediction of Wheat Grain Copper Concentration

1
College of Plant Science and Technology, Huazhong Agricultural University, Wuhan 430070, China
2
Institute of Crop Molecular Breeding, Henan Academy of Agricultural Sciences, Zhengzhou 450002, China
3
Institute of Food Crops, Hubei Academy of Agricultural Sciences, Wuhan 430064, China
4
Anhui Provincial Key Laboratory of Crop Quality Improvement, Hefei 230031, China
*
Authors to whom correspondence should be addressed.
Agronomy 2025, 15(4), 792; https://doi.org/10.3390/agronomy15040792
Submission received: 8 February 2025 / Revised: 9 March 2025 / Accepted: 19 March 2025 / Published: 24 March 2025
(This article belongs to the Section Crop Breeding and Genetics)

Abstract

:
Copper (Cu) is an essential micronutrient for almost all organisms; however, the genetic basis regarding copper accumulation remains unclear. In the present study, a genome-wide association study (GWAS) was performed on the Cu concentration in grains of 207 wheat accessions based on five multi-locus models (FASTmrMLM, ISIS EM-BLASSO, mrMLM, pKWmEB, pLARmEB). A total of 86 significant quantitative trait nucleotides (QTNs) were identified using five methods, with the mrMLM model detecting the fewest QTNs, only 12, while the other four models detected 21–40 QTNs. Thirty stable QTNs were detected in multiple environments or multiple models, mainly distributed on chromosomes 2A, 4B, 2B, and 5A, explaining 0.5–29.3% of the phenotypic variation. Finally, five potential candidate genes associated with Cu absorption and transport in the genomic regions near the reliable QTNs were screened out, including TraesCS2A02G505500 and TraesCS4B02G019300 (zinc transporters), TraesCS2B02G313200 (copper transporter), TraesCS3A02G042600 and TraesCS3B02G040900 (metal tolerance protein). These findings provide new insights into the genetic basis for Cu accumulation in wheat grains and demonstrate the role of the multi-locus GWAS (ML-GWAS) method.

1. Introduction

Wheat (Triticum aestivum L.), as the main food crop in the world, provides carbohydrates, proteins, vitamins, and minerals for more than one third of the population [1]. Copper (Cu) is an indispensable micronutrient in plants and plays a vital role in the growth and development of wheat. It is not only an important participant in physiological processes, such as photosynthesis, respiration, and redox reactions, but also helps to maintain the stability of cell wall structure [2,3]. For humans, copper is also an essential trace element, which is critical for maintaining nerve health and bone development [4]. Copper deficiency can cause anemia, bone and arterial abnormalities, and even lead to brain diseases [5]. Therefore, in countries and regions where wheat is the staple food, it is particularly important to increase the copper content of wheat grains.
The process of copper absorption, transport, distribution, and redistribution depends on the synergistic effect of multiple transporters. Related studies have shown that copper transporter (COPT), zinc–iron transporter (ZIP), heavy metal ATPase (HMA), yellow stripe protein (YSL), and copper chaperone protein (COX) mediate the distribution and detoxification of copper in plants. The expression level and functional activity of these transporters directly determine the absorption efficiency of copper and its distribution in plants, which in turn affects the balance of copper metabolism and growth and development of plants [6,7]. At present, QTLs related to copper accumulation and transport have been mapped in rice, maize, and other crops. Lu et al. used the recombinant inbred lines (RILs) population to map a major QTL on rice chromosome 2 that has a significant effect on the copper content of rice grains and can explain 23.57% of the phenotypic variation [8]. Hu et al. also identified four QTLs affecting grain copper content in rice, explaining 6.5–32.6% of the phenotypic variation [9]. In maize, Zhang et al. located QTLs closely related to copper accumulation in maize grains on multiple chromosomes through joint analysis of single environment and META, while the QTL on chromosome 8 showed the highest phenotypic variation explanatory power [10]. In wheat, Liu et al. [11] and Ma et al. [12] identified 12 QTLs associated with grain copper content by genome-wide association analysis. These QTLs individually explained a wide range of phenotypic variations, indicating that the genetic regulation of grain copper content in wheat is highly complex and diverse [13].
The traditional single-locus GWAS (SL-GWAS) method has some limitations in dealing with complex quantitative traits. It can only detect the loci with large effects, while ignoring the cumulative effects of many small effect loci [14]. The multi-locus GWAS (ML-GWAS) method considers information from all markers at the same time and is considered to be a valuable positioning method [15]. Through comparative analysis, Zhou et al. found that compared with SL-GWAS, ML-GWAS can detect more QTNs related to maize grain moisture content [15]. Zhong et al. identified 74 stable QTNs associated with rice yield by ML-GWAS, of which 20 were simultaneously detected by SL-GWAS [16]. In wheat, ML-GWAS has also been widely used. Vikas et al. revealed new loci associated with leaf rust resistance in wheat seedlings and adult plants through ML-GWAS [17]. Peng et al. used six ML-GWAS models to detect 328 QTNs that were significantly associated with free amino acid content in wheat grains, of which 66 QTNs were repeatedly detected by two or more models [18].
In this study, we used inductively coupled plasma mass spectrometry (ICP-MS) to detect the grain copper content of 207 wheat germplasms, and used FASTmrMLM, ISIS EM-BLASSO, mrMLM, pKWmEB, and pLARmEB five multi-site models to perform genome-wide association analysis of wheat seed copper content, identify QTNs that affect wheat grain copper content, and explore candidate genes involved in wheat grain copper accumulation. The results not only provide important clues for revealing the genetic basis of copper accumulation in wheat grains but also provide new ideas and methods for wheat genetic improvement and breeding practice.

2. Materials and Methods

2.1. Test Materials and Field Planting

In this study, 207 wheat varieties (lines) mainly from the Yellow-Huai River Valleys of China were used as materials, including 194 domestic materials and 13 foreign materials [19]. The experimental materials were planted in Yuanyang Base of Henan Academy of Agricultural Sciences in 2018–2019 (E1) and 2019–2020 (E2), respectively. A randomized block design was used in the experiment. Each material was planted with 2 rows, 2 m in length and 0.3 m in width. Field management refers to local cultivation methods.

2.2. Determination of Copper Content in Mature Grains of Wheat

After the harvested mature wheat grains were dried at 55 °C for 24 h, healthy and full grains were selected and ground into fine powder and placed in a 2 ml centrifuge tube, which was dried again at 55 °C for 24 h. Subsequently, 200 mg of dry powder was weighed from each sample in a digestion tube, and 8 mL of concentrated nitric acid was added. The sample was digested in a microwave digestion instrument (CEM9, Matthews, NC, USA) at a temperature gradient of 120 °C to 180 °C (Table 1). After digestion, the samples were diluted with ultrapure water, and the copper content in the samples was detected by inductively coupled plasma mass spectrometry (ICP-MS, NexION 1000, Perkin Elmer, Waltham, MA, USA).

2.3. Statistical Analysis

Descriptive statistical analysis was performed on the data using SPSS v22.0 software, including mean, standard deviation, coefficient of variation, skewness and kurtosis. Pearson correlation and statistical significance between traits were analyzed using R software 4.41 (R package corrplot). The generalized heritability (H2) of copper in two environments was calculated using the lme4 software package in software R [20]. The best linear unbiased prediction (BLUP) was obtained by fitting the mixed linear model in the R package lem4 (R Core Team, 2012) for the estimation of the breeding values of each line across two locations. The formula is as follows:
Y = μ + Year + (1|Line) + (1|Line:Year) + ε
where Y is the measured copper concentration; μ is the overall mean; Year is a fixed effect capturing the differences between 2019 and 2020; (1|Line) is the random effect for the individual wheat lines; (1|Line:Year) is the random interaction between lines and years (if applicable); ε is the residual error. Finally, the BLUP data for the Cu concentrations were also used for the GWAS.

2.4. Multi-Loci Association Analysis

All wheat germplasms were genotyped using a wheat 660K SNP chip. Genotype quality control was performed, and the SNPs with a minor allele frequency (MAF) < 0.05 and missing data > 10% were deleted. Finally, 224,706 SNPs were obtained for subsequent analysis [19]. The calculation of group structure and kinship matrix is based on Zhou et al. [19]. Five multi-locus models—FASTmrMLM, ISIS EM-BLASSO, mrMLM, pKWmEB and pLARmEB—were used for genome-wide association analysis of wheat grain copper content [18]. FASTmrMLM: This model combines a fast stepwise regression approach with a mixed linear model to quickly identify significant QTLs [21]. ISIS EM-BLASSO: It uses an iterative sure independence screening method coupled with an expectation–maximization algorithm and BLASSO to effectively control false positives while pinpointing important markers [22]. mrMLM: This model simultaneously detects multiple loci by incorporating a multi-locus mixed linear model, improving detection power for complex traits [23]. pKWmEB: It employs a non-parametric kernel method to evaluate marker effects and interactions, offering a flexible approach to capture genetic variation [24]. pLARmEB: This model integrates partial least squares regression with the EM-BLASSO algorithm to more accurately capture the genetic variation associated with complex traits [25]. When LOD > 3, the SNP marker was considered to be significantly associated with traits, and the contribution rate of the marker locus to phenotypic variation was calculated. A QTN detected in two or more environments or models is defined as a stable QTN.

2.5. Candidate Gene Prediction

Based on the linkage disequilibrium of the associated population [19], in the 5 Mb region upstream and downstream of the stable QTNs, combined with the annotation information of the Chinese spring wheat reference genome (IWGSC RefSeq v1.1) (https://wheat-urgi.versailles.inra.fr/ accessed on 11 December 2024) [26,27] and rice (IRGSP-1.0), homologous genes related to copper were reported in Arabidopsis (TAIR10) to predict candidate genes. The phylogenetic tree was constructed by combining the amino acid sequence of the candidate gene with the reported genes in rice (IRGSP-1.0) and Arabidopsis (TAIR10) using the neighbor joining method in MEGA 11, and the bootstrap value was 1000 replicates.

3. Results

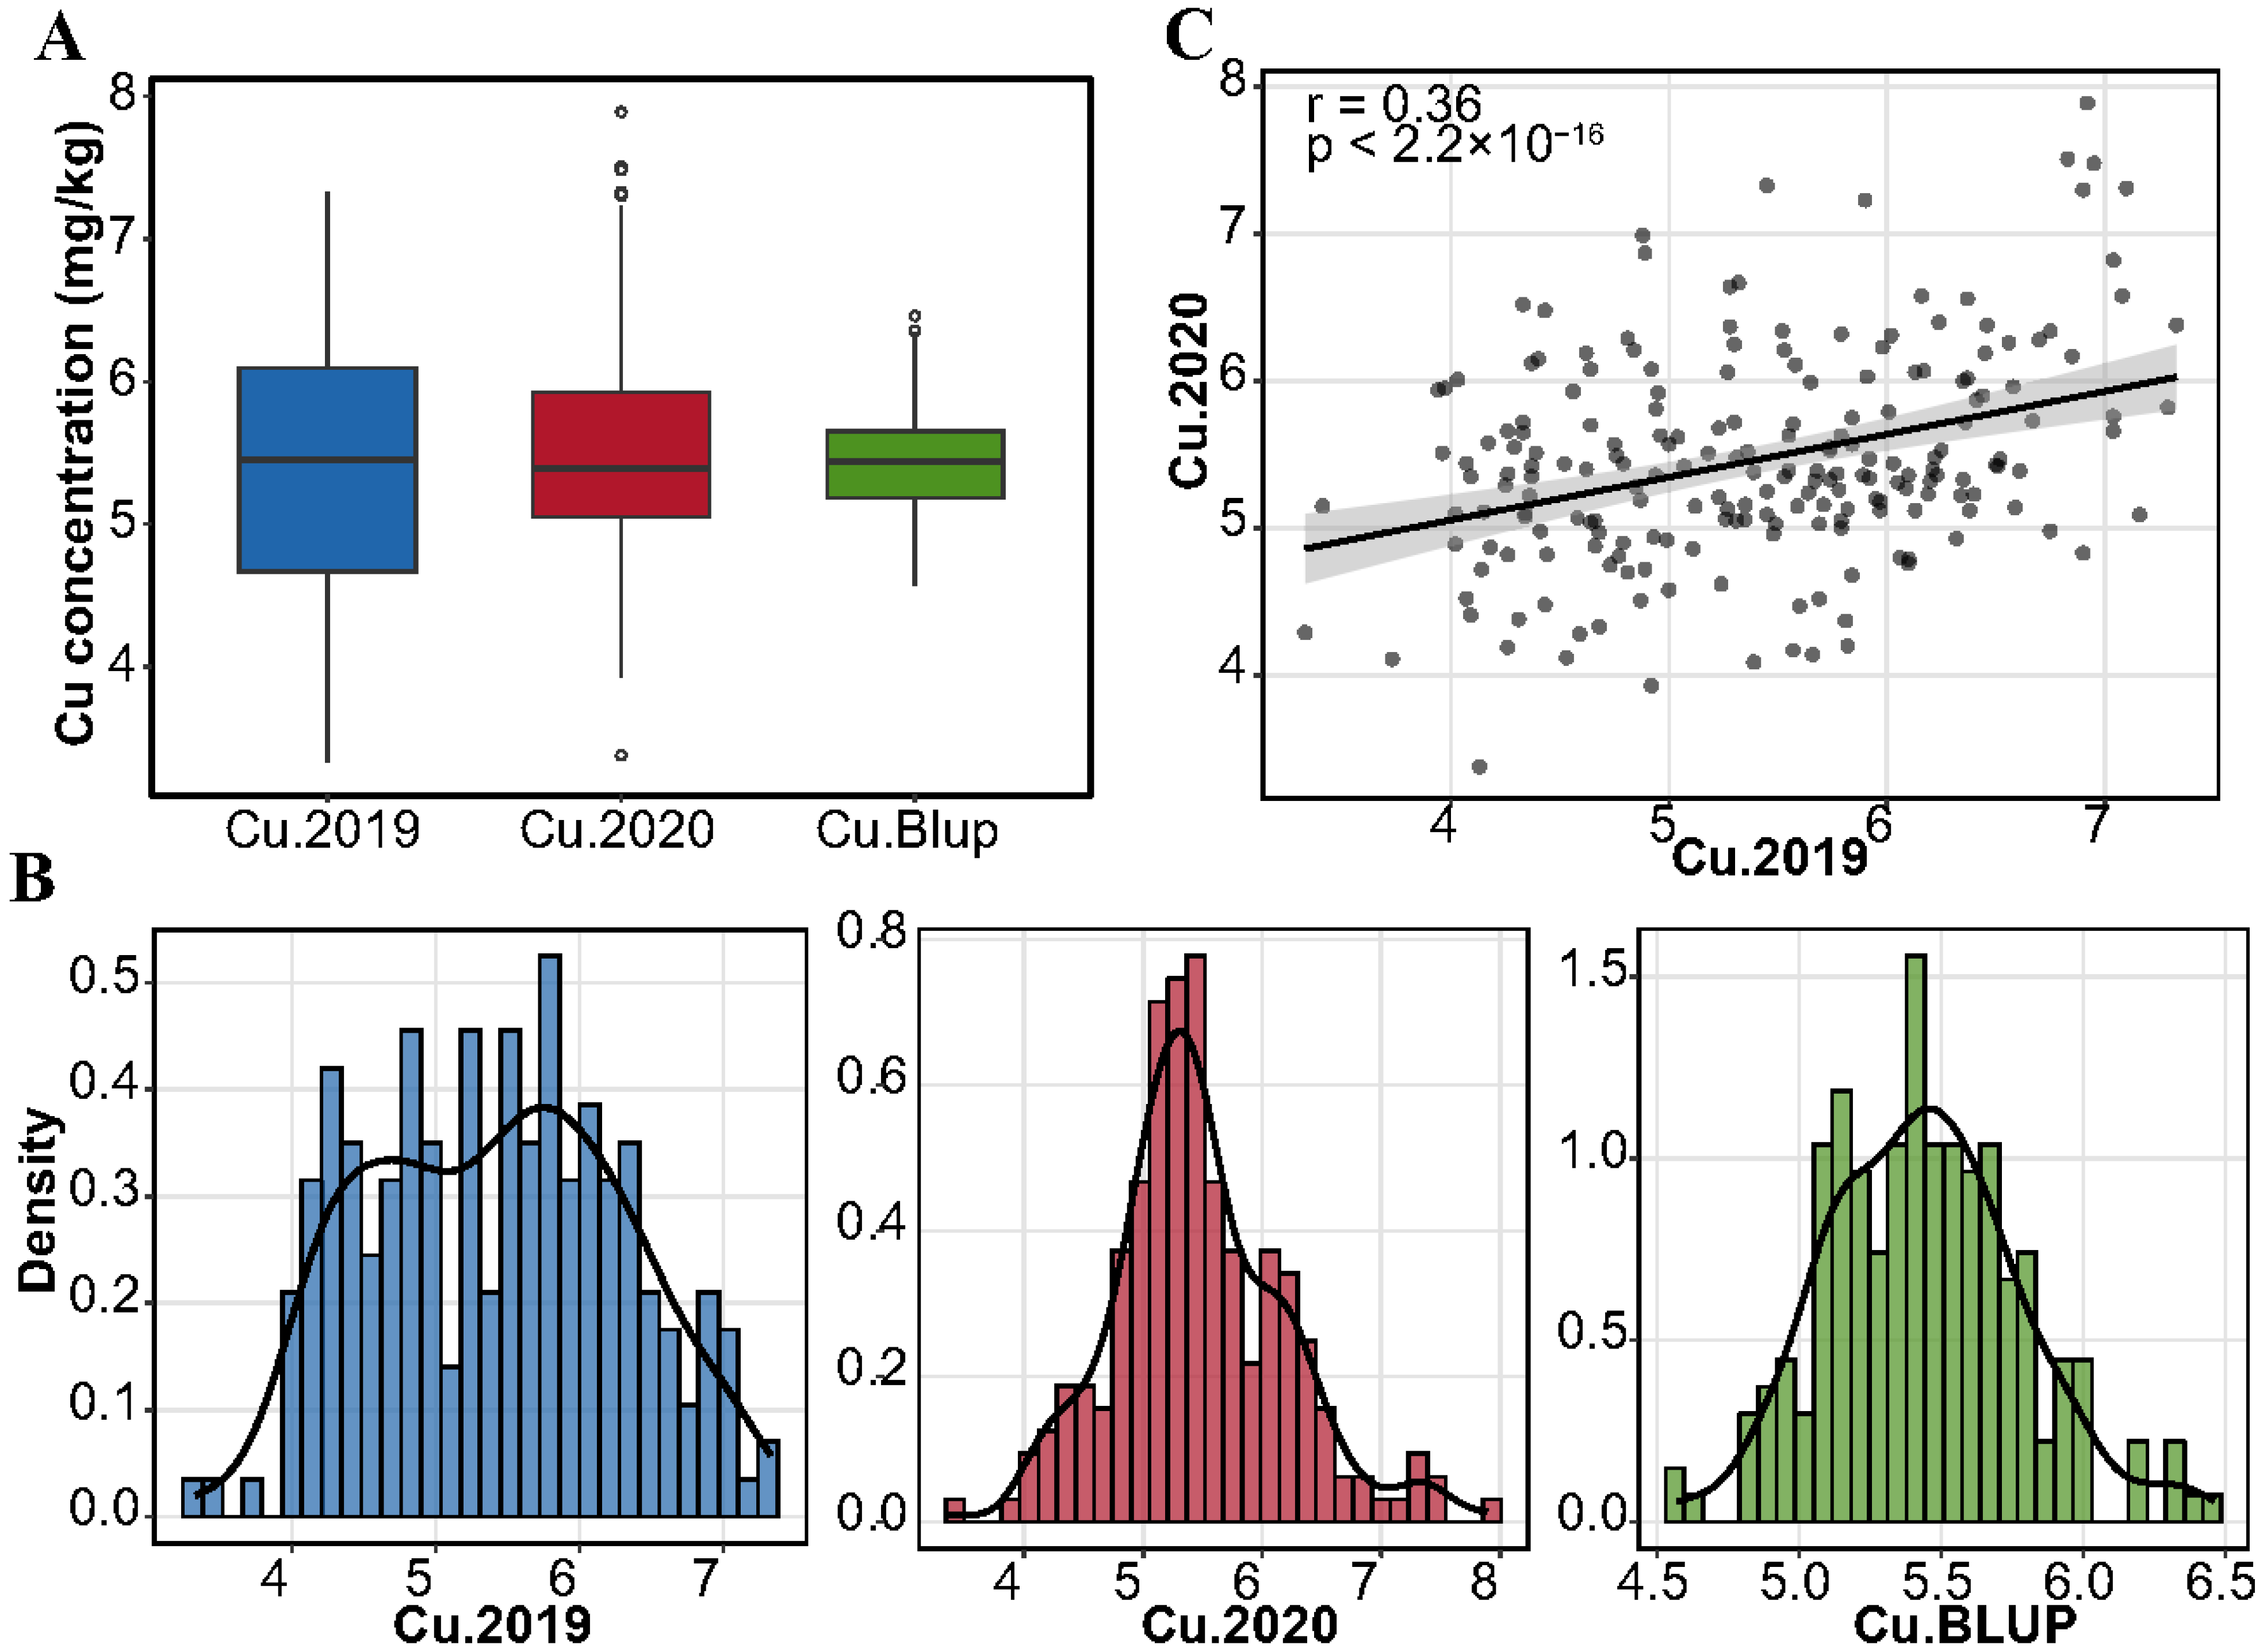
3.1. Variation Analysis of Copper Content in Mature Grains of Wheat

In order to evaluate the phenotypic variation of copper content (GCuC) in mature wheat grains, ICP-MS was used to detect the copper content in mature grains of 207 wheat varieties (lines) from China and abroad (Table S1). In 2019–2020 (E1), GCuC ranged from 3.33 to 7.33 mg/kg, with an average of 5.41 mg/kg, and the coefficient of variation was 16.39% (Figure 1A and Table 2). In 2020–2021 (E2), GCuC ranged from 3.38 to 7.89 mg/kg, with an average of 5.47 mg/kg, and the coefficient of variation was 13.29% (Figure 1A and Table 2). In addition, the range of BLUP was 4.57–6.46 mg/kg, the average value was 5.44 mg/kg, and the coefficient of variation was 6.34% (Figure 1A and Table 2). The data showed continuous changes, and the overall performance was approximately normal distribution (Figure 1B and Table 2). The broad heritability was 0.67, and the correlation coefficient between the two environments (E1 and E2) was 0.36 (p < 0.001) (Figure 1C).

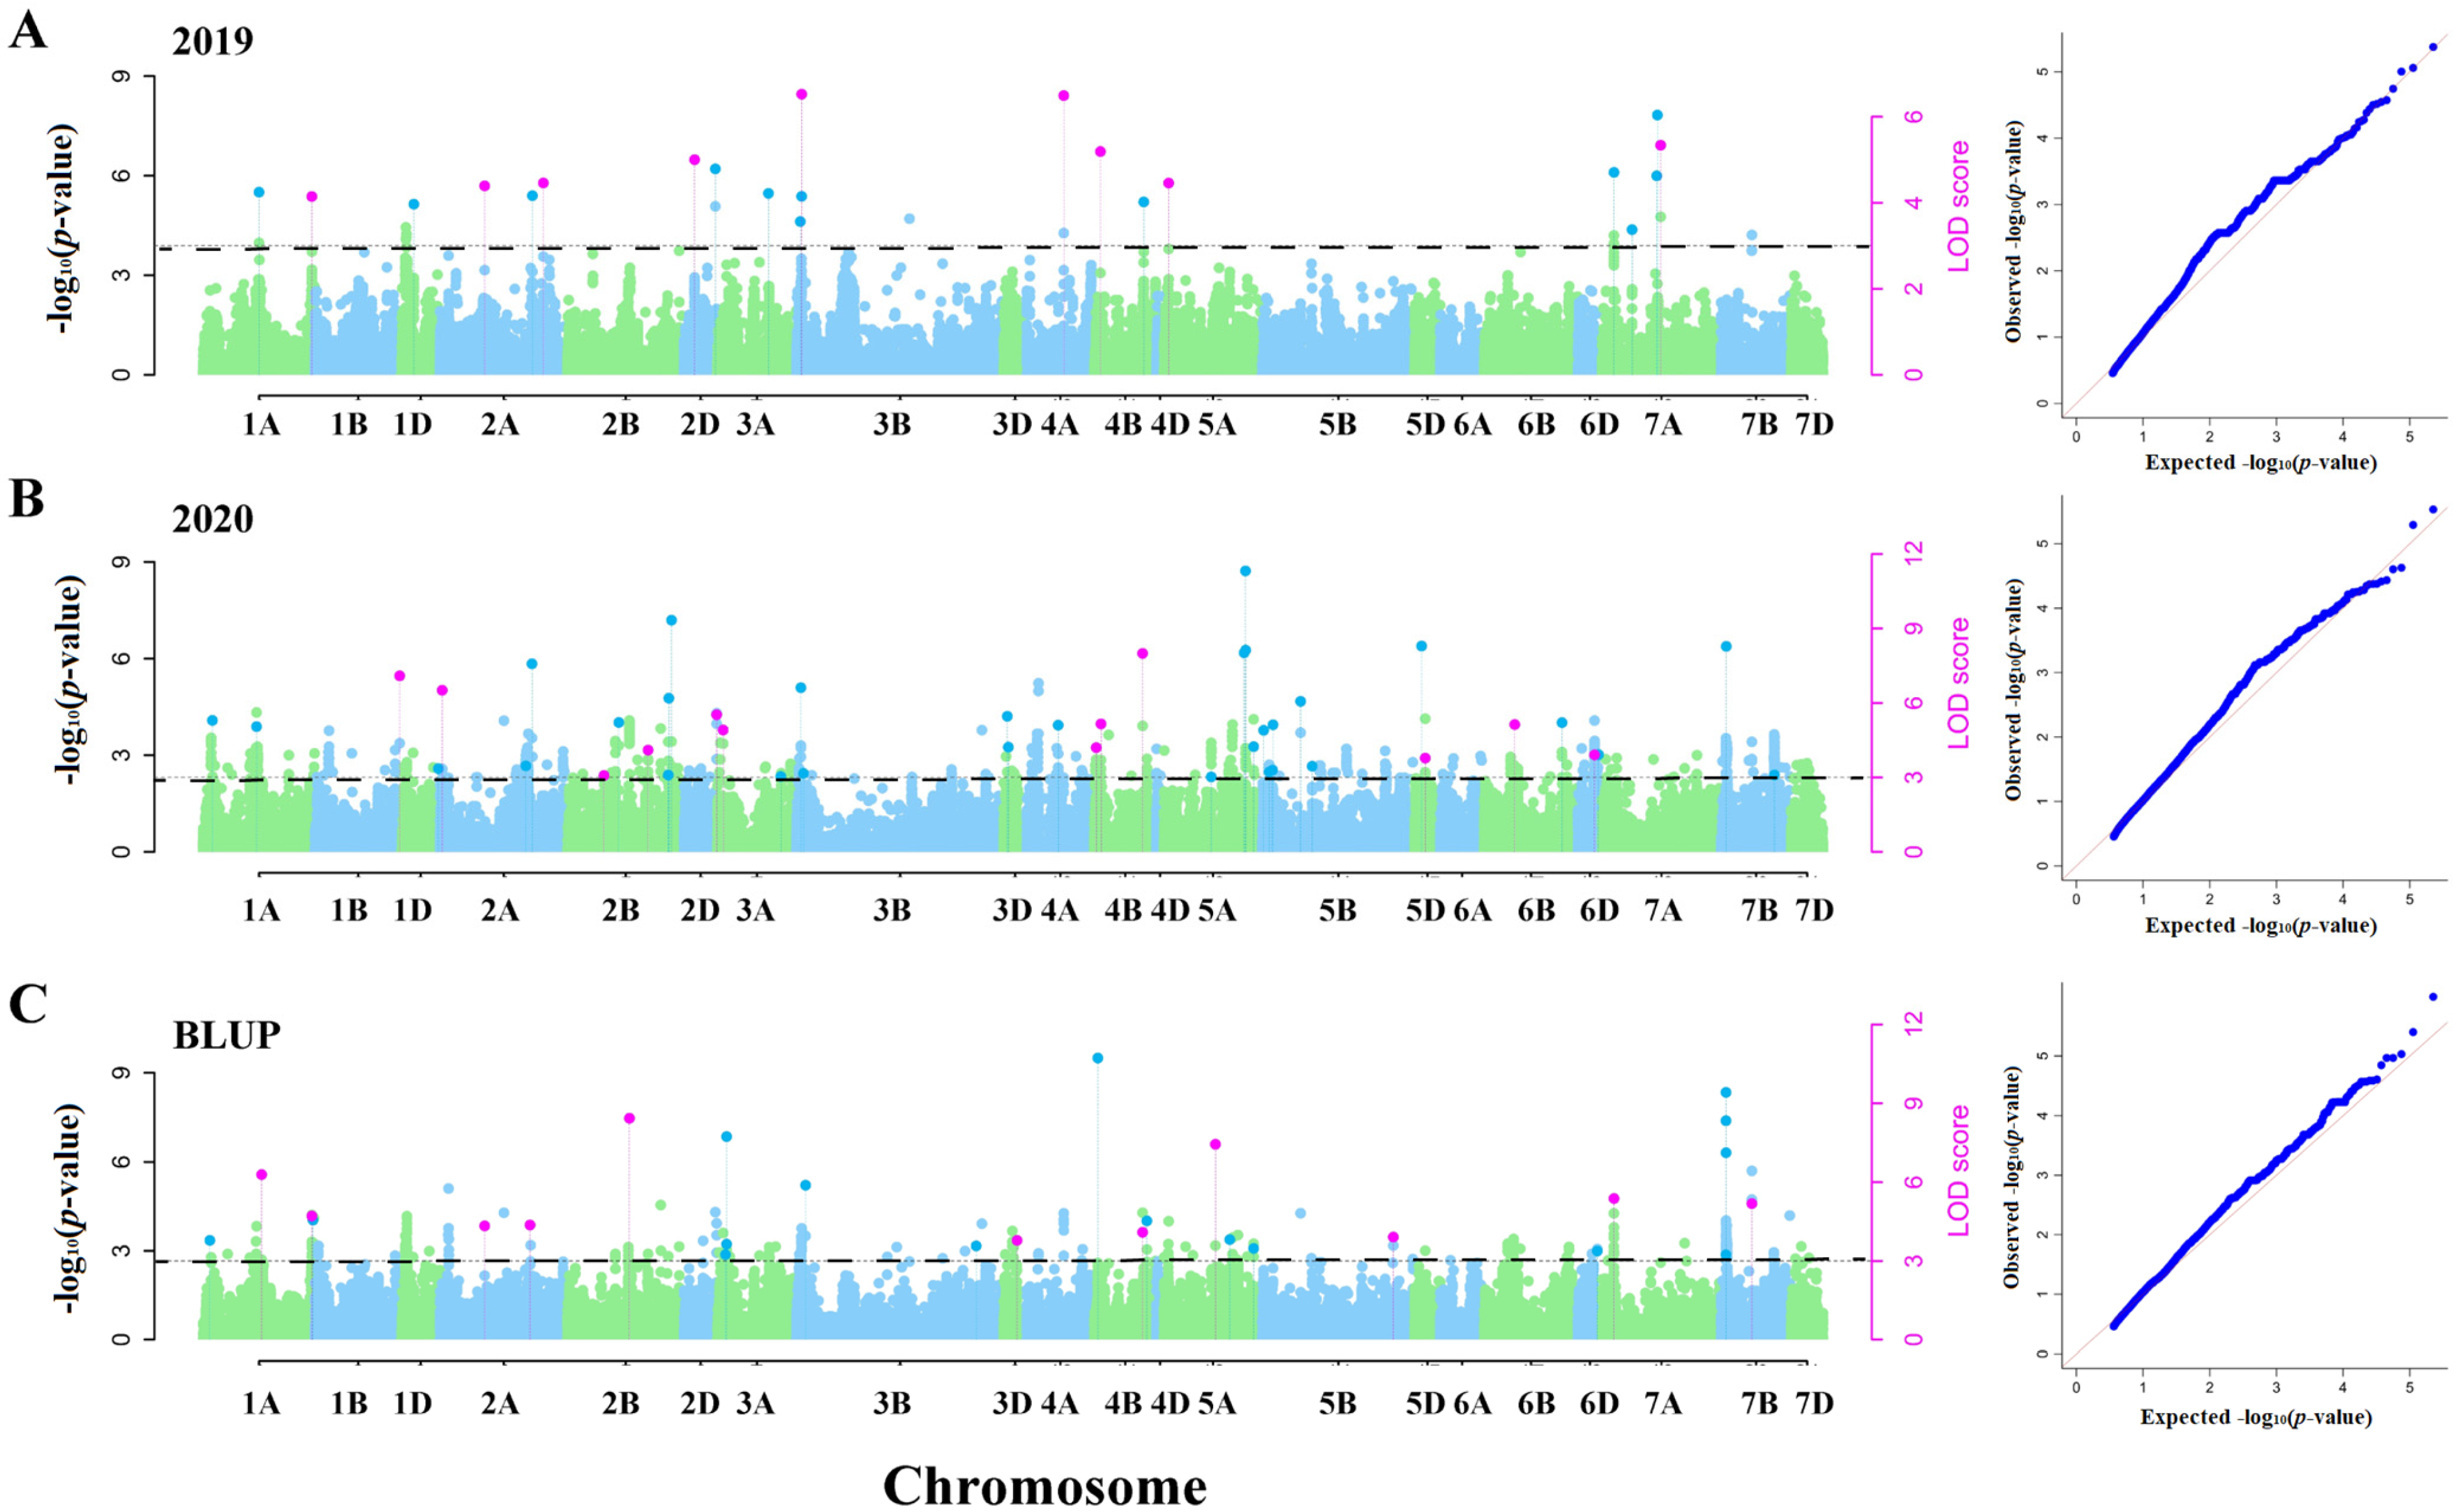
3.2. Genome-Wide Association Analysis Based on Multiple Models

Five ML-GWAS models—FASTmrMLM, ISIS EM-BLASSO, mrMLM, pKWmEB, and pLARmEB—were used to analyze the association of copper content in wheat grains under two environments and BLUP in 207 wheat materials. A total of 86 QTNs were detected under three environments (E1, E2, and BLUP) (Figure 2 and Table S2). Among them, 12 QTNs were detected by the mrMLM model, and the number of QTNs detected by the other four models was similar, which were 36, 21, 31, and 40, respectively. Among the 86 QTNs, a total of 30 QTNs could be simultaneously detected by more than two models, especially AX-94651674, AX-110386266, AX-109925765, and AX-110506329, and four QTNs could be simultaneously detected by four different models (Figure 2 and Table S2). In E1, E2, and BLUP, 34, 59, and 47 QTNs were detected, respectively, of which only 5 QTNs were detected by one environment and BLUP at the same time (Figure 2 and Table 3).
The phenotypic variation explained by a single QTN ranged from 0.3% to 29.3%, with an average of 6.5% (Table S2). The same QTN showed different effects in different models. For example, QTN on chromosome 7B (AX-110506329) had a range of r2 from 6.7% of pLARmEB to 29.3% of mrMLM (Table S2). The QTNs detected in two or more environments or models were defined as stable QTNs. A total of 30 stable QTNs were detected in this study, mainly distributed on chromosomes 2A (4), 2B (3), 4B (4), and 5A (3) (Table 3).

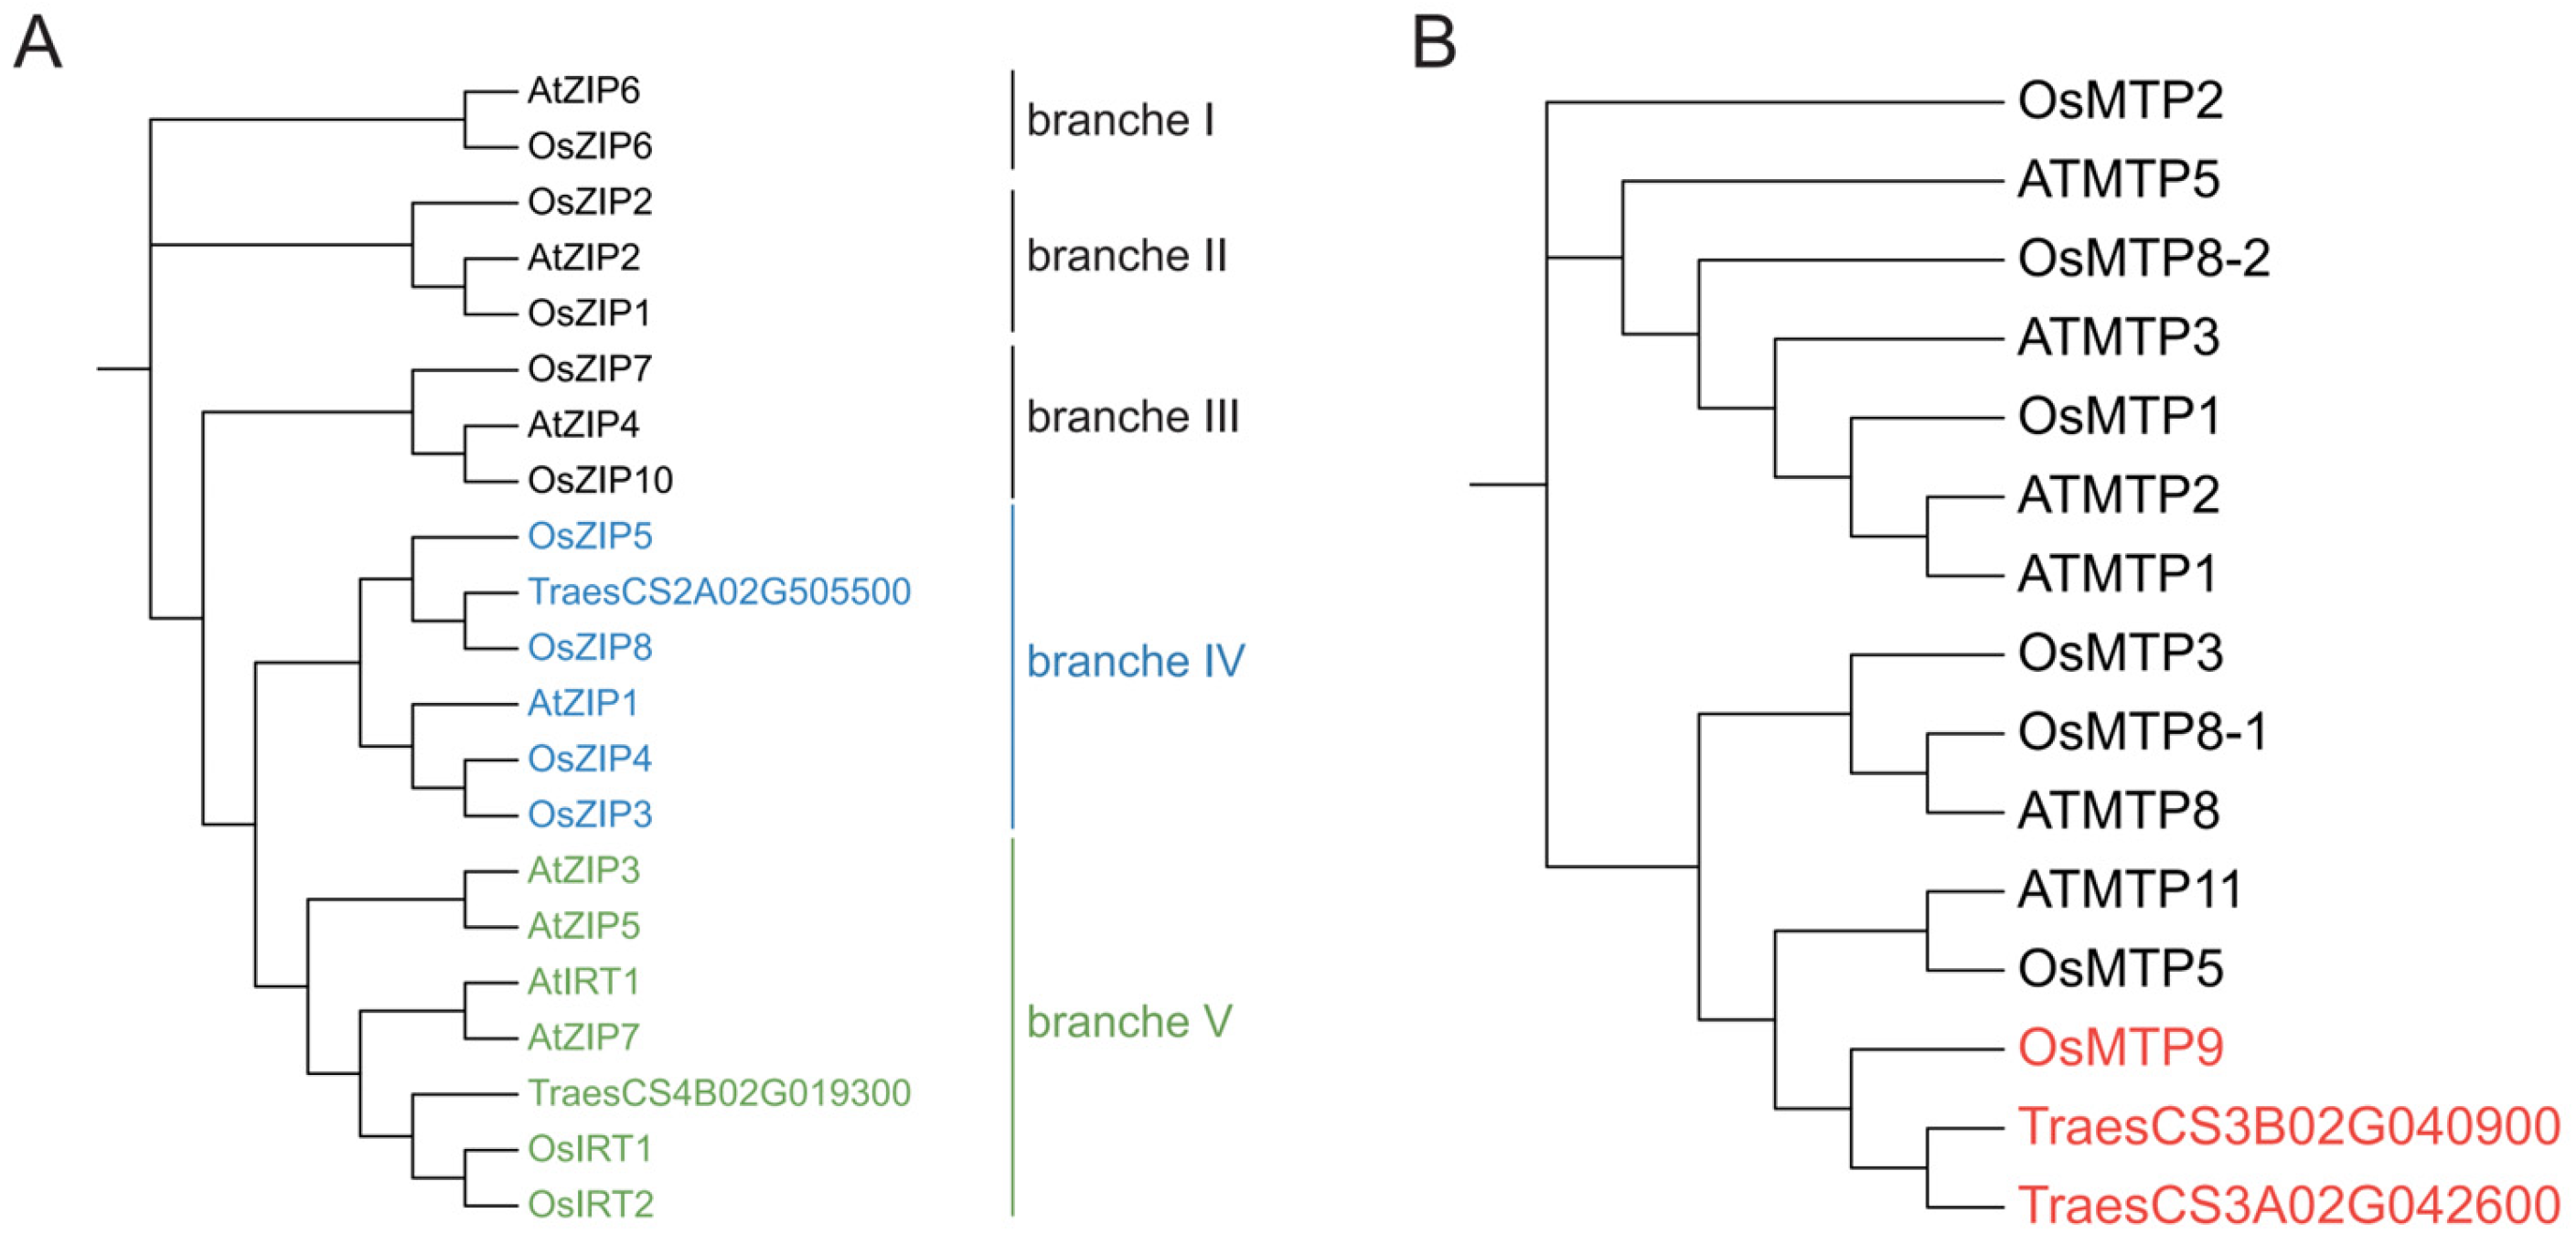
3.3. Candidate Gene Analysis

Based on the Chinese Spring reference genome (IWGSC RefSeq v1.1) annotation information, a total of five candidate genes were predicted in the 5 Mb range of the upstream and downstream of 30 stable QTNs, which were located on chromosomes 2A, 2B, 3A, 3B, and 4B, respectively (Table 4). Among them, the candidate gene TraesCS2B02G313200 on chromosome 2B was annotated as a copper transporter, and it was only 0.4 Mb with QTN (AX-110456252) (Table 4). Further analysis showed that the gene was highly similar to OsCOPT4 involved in copper transport in different tissues of rice (67% similarity at the amino acid level) [28].Therefore, TraesCS2B02G313200 was identified as a copper transporter in wheat.
In addition, TraesCS2A02G505500 and TraesCS4B02G019300 on chromosomes 2A and 4B were annotated as zinc transporters in the Chinese Spring reference genome (Table 4). The phylogenetic tree was constructed by combining the amino acid sequence of the candidate gene with the reported genes in rice and Arabidopsis. The results are shown in Figure 3: The phylogenetic tree of ZIPs was mainly divided into five branches, of which TraesCS2A02G505500 and TraesCS4B02G019300 were located in branches IV and V, respectively (Figure 3A). TraesCS2A02G505500 was located near rice zinc transporter OsZIP8 and OsZIP5 [29,30]. In branch V, TraesCS4B02G019300 was highly homologous to OsIRT1 and OsIRT2 [31], with amino acid sequence similarity of 76% and 71%, respectively (Figure 3A). These results suggested that TraesCS2A02G505500 and TraesCS4B02G019300 might be candidate genes affecting copper ion transport in wheat. Two homologous genes, TraesCS3A02G042600 and TraesCS3B02G040900, were annotated as metal tolerance proteins (Table 4), and the high sequence identity (amino acid levels of 91% and 91%, respectively) with OsMTP9, reported to be involved in manganese transport in rice, further supported the accuracy of this QTN [32]. Phylogenetic analysis further validated these associations (Figure 3B).

4. Discussion

Copper is an essential micronutrient for organisms. As a cofactor of protein, copper participates in a variety of physiological processes [33]. Too much or too little accumulation of copper will cause adverse effects, so it is necessary to study the absorption and transport of copper in plants. However, there are few studies on how wheat mineral elements are absorbed from the soil and transported to the ground; most of them focus on beneficial elements such as iron and zinc, while there are relatively few studies on copper. Here, we predicted candidate genes for copper content through accurate quantification of copper and genome-wide association analysis and analyzed the genetic structure behind them.

4.1. Natural Variation of Copper Content in Wheat Grain

Recessive hunger caused by trace element deficiency seriously endangers human health [34]. However, in recent years, a variety of trace elements such as iron, zinc, calcium, manganese, and copper in wheat grains have decreased to varying degrees. Hao et al. [35] found that the iron content in Chinese wheat grains showed a downward trend from 1933 to 2017. Murphy et al. [36] evaluated the contents of calcium, copper, iron, magnesium, manganese, phosphorus, selenium, and zinc in 63 wheat varieties and found that the concentrations of all mineral elements except calcium decreased. Ma et al. [12] showed that the copper content in the grains of Chinese wheat varieties gradually decreased, especially in Huang-Huai-Hai wheat region, Southwest wheat region, and Jiangsu Province. In this study, the copper content of 207 wheat grains was between 3.33–7.89 mg/kg (Table 2 and Figure 1A), which was close to previous reports [37,38]. In addition, eight wheat varieties with high and stable grain copper content were selected in this study, such as local varieties Dalibanmang and Wuhuatou, bred varieties Jingdong1hao and Hanxuan10hao, which can be used for breeding and improvement of wheat grain copper content.

4.2. Advantages of Multi-Loci Model

Traditional single-point methods, such as the MLM model, ignore the overall effect of multiple gene loci, and the strict threshold makes it impossible to detect many small-effect QTLs [39]. However, the variation of traits is often controlled by many small effect sites. In order to reduce the false positive rate and detect more QTNs, Segura et al. [40] developed a multi-locus association analysis model for the first time. Since then, Liu et al. [41] developed FarmCPU. Zhang Yuanming’s team of statistical genomics in Huazhong Agricultural University developed and integrated an R package (mrMLM) (Multi-Locus Random-SNP-Effect Mixed Linear Model) with six multi-locus GWAS methods (FASTmrMLM, FASTmrEMMA, ISIS EM-BLASSO, mrMLM, pKWmEB, and pLARmEB) and promoted the application (https://cran.r-project.org/web/packages/mrMLM/index.html accessed on 6 December 2024). The FASTmrMLM model employs a fast stepwise regression combined with a mixed linear model to quickly identify significant QTNs while reducing computational time. In contrast, ISIS EM-BLASSO uses an iterative sure independence screening approach with an expectation–maximization algorithm and a Bayesian LASSO method, which effectively controls false positives and enhances marker detection accuracy. The core mrMLM model applies a multi-locus mixed linear framework to simultaneously detect multiple associated loci, providing increased detection power for polygenic traits. Additionally, the pKWmEB model utilizes a non-parametric kernel-based method that evaluates both main effects and interactions, offering a flexible approach to capture genetic variation beyond what traditional linear models can reveal. Finally, the pLARmEB model integrates partial least squares regression with the EM-BLASSO algorithm, leveraging dimensionality reduction to improve sensitivity and precision in QTL identification. Previous studies identified 10–34 QTLs [12,14] for copper content in wheat grains by genome-wide association analysis using the traditional single-point model. Based on the five ML-GWAS methods in mrMLM, a total of 86 QTNs were identified, indicating that ML-GWAS has higher detection efficiency (Figure 2). Among them, 30 stable QTNs were detected by multiple models at the same time, indicating that the ML-GWAS method has high reliability (Table 3). In addition, the QTN (AX-111478015) detected on chromosome 6D in this study overlapped with the QTL identified by Ma et al. [12], further indicating the reliability of the results of this study (Table 3).

4.3. Candidate Gene Prediction of Copper Content in Wheat Grain

Five candidate genes were predicted in this study (Table 4). Among them, TraesCS2A02G505500 and TraesCS4B02G019300 were annotated as zinc transporters and highly homologous to OsZIP8 and OsIRT, which have been reported to have zinc transport activity (Figure 3A). Related studies have shown that the contents of iron, zinc, copper, and other elements belonging to divalent metal cations are significantly positively correlated, and their accumulation may be affected by the sharing mechanism [42,43]. Therefore, it is speculated that these two zinc transporters may be involved in the absorption and transport of zinc, but also partially involved in the absorption and transport of copper. Based on the analysis of WheatOmics transcriptome data, it was found that the expression levels of TraesCS2A02G505500 in wheat roots, stems, leaves, ears, and grains were very low (Figure S1). This gene was highly homologous to OsZIP8, which is reported to be zinc deficiency-induced in rice [31], so the gene might also be induced to express. TraesCS4B02G019300 was only expressed in roots (Figure S1), which may be mainly involved in the absorption of copper ions from soil by roots. TraesCS2B02G313200 is a copper transporter, but its expression levels in roots, stems, leaves, panicles, and grains were low (Figure S1), which might also induce expression or play a role in auxiliary absorption.
TraesCS3A02G042600 and TraesCS3B02G040900 were homologous genes, both of which were metal tolerance proteins (Table 4). Metal tolerance proteins belong to the cation diffusion enhancer (CDF) protein family, similar to ZIPs, and were also mainly involved in the transport of divalent metal ions (zinc, manganese, cadmium) [32,44,45]. Therefore, these two genes were also predicted as candidate genes. The expression patterns of TraesCS3A02G042600 and TraesCS3B02G04090 were similar, highly expressed in all tissues except leaves and spikes (Figure S1).
We utilized the transcriptomic data of the grain at 20 days after flowering (20DAF) from this population and conducted a correlation analysis, which revealed no significant correlation between copper content and the expression levels of the five candidate genes. This indirectly suggests that these candidate genes may influence copper content in the grain by affecting root absorption rather than directly participating in the transport of copper within the grain. In summary, these five genes were considered to be candidate genes affecting copper content in wheat grains.

5. Conclusions

In this study, five multi-locus association analysis methods were used to perform genome-wide association analysis of grain copper content in 207 wheat germplasms. A total of 30 stable QTNs were detected, and five candidate genes affecting grain copper accumulation were predicted. The results of this study provide useful information for the genetic basis of copper accumulation in wheat grains and help to improve the nutritional quality of wheat grains.

Supplementary Materials

The following supporting information can be downloaded at: https://www.mdpi.com/article/10.3390/agronomy15040792/s1, Figure S1. Expression of five copper candidate genes in multiple tissues of wheat (roots, stems, leaves, spikes, and grains). Data were from WheatOmics; Table S1. The content of copper in wheat mature grain of 207 wheat varieties; Table S2. The results of five ML-GWAS models for copper element.

Author Contributions

Conceptualization, J.M.; Data curation, X.L., X.J. and Y.P.; Formal analysis, X.L. and Z.Z. (Zhaojun Zou); Funding acquisition, J.M. and Z.L.; Investigation, X.L. and Z.Z. (Zhaojun Zou); Methodology, X.L., Z.Z. (Zhaojun Zou), F.L., J.H. and Z.Z. (Zhengfu Zhou); Project administration, Z.L.; Resources, Z.Z. (Zhaojun Zou), F.L., J.H., Z.Z. (Zhengfu Zhou) and X.J.; Software, Y.P.; Supervision, J.M. and Z.L.; Validation, X.L., Z.Z. (Zhaojun Zou), J.H. and X.J.; Visualization, X.L. and Y.P.; Writing—original draft, X.L.; Writing—review and editing, J.M. and Z.L. All authors have read and agreed to the published version of the manuscript.

Funding

This research was funded by the National Key Research and Development Program (2023YFD2300205), the Key Research & Development Project of Henan Province (241111111000), the Agriculture Research System of Henan Province (HARS-22-01-G3), and the Open Research Fund of Anhui Provincial Key Laboratory of Crop Quality Improvement (2024ZW002).

Data Availability Statement

The original contributions presented in this study are included in the article/Supplementary Material. Further inquiries can be directed to the corresponding authors.

Conflicts of Interest

The authors declare no conflicts of interest.

References

  1. Poudel, R.; Bhatta, M. Review of Nutraceuticals and Functional Properties of Whole Wheat. J. Nutr. Food Sci. 2017, 7, 571. [Google Scholar] [CrossRef]
  2. Burkhead, J.L.; Gogolin Reynolds, K.A.; Abdel-Ghany, S.E.; Cohu, C.M.; Pilon, M. Copper Homeostasis. New Phytol. 2009, 182, 799–816. [Google Scholar] [CrossRef] [PubMed]
  3. Ravet, K.; Pilon, M. Copper and Iron Homeostasis in Plants: The Challenges of Oxidative Stress. Antioxid. Redox Signal. 2013, 19, 919–932. [Google Scholar] [CrossRef]
  4. Binesh, A.; Venkatachalam, K. Copper in Human Health and Disease: A Comprehensive Review. J. Biochem. Mol. Tox 2024, 38, e70052. [Google Scholar] [CrossRef]
  5. Chhetri, S.K.; Mills, R.J.; Shaunak, S.; Emsley, H.C.A. Copper Deficiency. BMJ 2014, 348, g3691. [Google Scholar] [CrossRef]
  6. Cobbett, C.; Goldsbrough, P. Phytochelatins and metallothioneins: Roles in Heavy Metal Detoxification and Homeostasis. Annu. Rev. Plant Biol. 2002, 53, 159–182. [Google Scholar] [CrossRef]
  7. Andrés-Colás, N.; Sancenón, V.; Rodríguez-Navarro, S.; Mayo, S.; Thiele, D.J.; Ecker, J.R.; Puig, S.; Peñarrubia, L. The Arabidopsis Heavy Metal P-type ATPase HMA5 Interacts with Metallochaperones and Functions in Copper Detoxification of Roots. Plant J. 2006, 45, 225–236. [Google Scholar]
  8. Lu, K.; Li, L.; Zheng, X.; Zhang, Z.; Mou, T.; Hu, Z. Quantitative Trait Loci Controlling Cu, Ca, Zn, Mn and Fe Content in Rice Grains. J. Genet. 2008, 87, 305–310. [Google Scholar] [CrossRef]
  9. Hu, B.-L.; Huang, D.-R.; Xiao, Y.-Q.; Fan, Y.-Y.; Chen, D.-Z.; Zhuang, J.-Y. Mapping QTLs for Mineral Element Contents in Brown and Milled Rice Using an Oryza Sativa × O. Rufipogon Backcross Inbred Line Population. Cereal Res. Commun. 2016, 44, 57–68. [Google Scholar] [CrossRef]
  10. Zhang, H.; Liu, J.; Jin, T.; Huang, Y.; Chen, J.; Zhu, L.; Zhao, Y.; Guo, J. Correction to: Identification of Quantitative Trait Locus and Prediction of Candidate Genes for Grain Mineral Concentration in Maize across Multiple Environments. Euphytica 2018, 214, 71. [Google Scholar] [CrossRef]
  11. Liu, Y.; Chen, Y.; Yang, Y.; Zhang, Q.; Fu, B.; Cai, J.; Guo, W.; Shi, L.; Wu, J.; Chen, Y. A Thorough Screening Based on QTLs Controlling Zinc and Copper Accumulation in the Grain of Different Wheat Genotypes. Environ. Sci. Pollut. Res. 2021, 28, 15043–15054. [Google Scholar] [CrossRef] [PubMed]
  12. Ma, J.; Qi, S.; Yuan, M.; Zhao, D.; Zhang, D.; Feng, J.; Wang, J.; Li, W.; Song, C.; Wang, T.; et al. A Genome-Wide Association Study Revealed the Genetic Variation and Candidate Genes for Grain Copper Content in Bread Wheat (Triticum aestivum L.). Food Funct. 2022, 13, 5177–5188. [Google Scholar] [CrossRef] [PubMed]
  13. Bálint, A.F.; Röder, M.S.; Hell, R.; Galiba, G.; Börner, A. Mapping of QTLs Affecting Copper Tolerance and the Cu, Fe, Mn and Zn Contents in the Shoots of Wheat Seedlings. Biol. Plant 2007, 51, 129–134. [Google Scholar] [CrossRef]
  14. Zhao, L.; Pan, Y.; Dong, Z.; Zheng, Y.; Liu, J.; Geng, J.; Ren, Y.; Zhang, N.; Chen, F. Investigation and Genome-Wide Association Study of Grain Copper Content in Chinese Common Wheat. J. Cereal Sci. 2020, 95, 102991. [Google Scholar] [CrossRef]
  15. Zhou, G.; Zhu, Q.; Mao, Y.; Chen, G.; Xue, L.; Lu, H.; Shi, M.; Zhang, Z.; Song, X.; Zhang, H.; et al. Multi-Locus Genome-Wide Association Study and Genomic Selection of Kernel Moisture Content at the Harvest Stage in Maize. Front. Plant Sci. 2021, 12, 697688. [Google Scholar] [CrossRef]
  16. Zhong, H.; Liu, S.; Sun, T.; Kong, W.; Deng, X.; Peng, Z.; Li, Y. Multi-Locus Genome-Wide Association Studies for Five Yield-Related Traits in Rice. BMC Plant Biol. 2021, 21, 364. [Google Scholar] [CrossRef]
  17. Vikas, V.K.; Pradhan, A.K.; Budhlakoti, N.; Mishra, D.C.; Chandra, T.; Bhardwaj, S.C.; Kumar, S.; Sivasamy, M.; Jayaprakash, P.; Nisha, R.; et al. Multi-Locus Genome-Wide Association Studies (ML-GWAS) Reveal Novel Genomic Regions Associated with Seedling and Adult Plant Stage Leaf Rust Resistance in Bread Wheat (Triticum aestivum L.). Heredity 2022, 128, 434–449. [Google Scholar] [CrossRef]
  18. Peng, Y.; Liu, H.; Chen, J.; Shi, T.; Zhang, C.; Sun, D.; He, Z.; Hao, Y.; Chen, W. Genome-Wide Association Studies of Free Amino Acid Levels by Six Multi-Locus Models in Bread Wheat. Front. Plant Sci. 2018, 9, 1196. [Google Scholar] [CrossRef]
  19. Zhou, Z.; Guan, H.; Liu, C.; Zhang, Z.; Geng, S.; Qin, M.; Li, W.; Shi, X.; Dai, Z.; Lei, Z.; et al. Identification of Genomic Regions Affecting Grain Peroxidase Activity in Bread Wheat Using Genome-Wide Association Study. BMC Plant Biol. 2021, 21, 52. [Google Scholar] [CrossRef]
  20. Bates, D.; Mächler, M.; Bolker, B.; Walker, S. Fitting Linear Mixed-Effects Models Using Lme4. J. Stat. Soft. 2015, 67, 1–48. [Google Scholar] [CrossRef]
  21. Tamba, C.; Zhang, Y.M. A fast mrMLM algorithm for multi-locus genome-wide association studies. bioRxiv 2018, 7, 341784. [Google Scholar]
  22. Tamba, C.L.; Ni, Y.L.; Zhang, Y.M. Iterative sure independence screening EM-Bayesian LASSO algorithm for multi-locus genome-wide association studies. PLoS Comput. Biol. 2017, 13, e1005357. [Google Scholar]
  23. Wang, S.B.; Feng, J.Y.; Ren, W.L.; Huang, B.; Zhou, L.; Wen, Y.J.; Jin, Z.; Dunwell, J.M.; Xu, S.; Zhang, Y.M. Improving power and accuracy of genome-wide association studies via a multi-locus mixed linear model methodology. Sci. Rep. 2016, 6, 19444. [Google Scholar]
  24. Ren, W.L.; Wen, Y.J.; Dunwell, J.M.; Zhang, Y.M. pKWmEB: Integration of kruskal-wallis test with empirical bayes under polygenic background control for multi-locus genome-wide association study. Heredity 2018, 120, 208–218. [Google Scholar]
  25. Zhang, J.; Feng, J.Y.; Ni, Y.L.; Wen, Y.J.; Niu, Y.; Tamba, C.L.; Yue, C.; Song, Q.; Zhang, Y.M. pLARmEB: Integration of least angle regression with empirical Bayes for multilocus genome-wide association studies. Heredity 2017, 118, 517–524. [Google Scholar]
  26. Alaux, M.; Rogers, J.; Letellier, T.; Flores, R.; Alfama, F.; Pommier, C.; Mohellibi, N.; Durand, S.; Kimmel, E.; Michotey, C.; et al. Linking the International Wheat Genome Sequencing Consortium bread wheat reference genome sequence to wheat genetic and phenomic data. Genome Biol. 2018, 19, 111. [Google Scholar] [CrossRef]
  27. Alaux, M.; Dyer, S.; Sen, T.Z. Wheat Data Integration and FAIRification: IWGSC, GrainGenes, Ensembl and Other Data Repositories. In The Wheat Genome. Compendium of Plant Genomes; Appels, R., Eversole, K., Feuillet, C., Gallagher, D., Eds.; Springer: Cham, Switzerland, 2024. [Google Scholar]
  28. Yuan, M.; Li, X.; Xiao, J.; Wang, S. Molecular and Functional Analyses of COPT/Ctr-Type Copper Transporter-like Gene Family in Rice. BMC Plant Biol. 2011, 11, 69. [Google Scholar] [CrossRef]
  29. Lee, S.; Kim, S.A.; Lee, J.; Guerinot, M.L.; An, G. Zinc Deficiency-Inducible OsZIP8 Encodes a Plasma Membrane-Localized Zinc Transporter in Rice. Mol. Cells 2010, 29, 551–558. [Google Scholar]
  30. Tan, L.; Qu, M.; Zhu, Y.; Peng, C.; Wang, J.; Gao, D.; Chen, C. ZINC TRANSPORTER5 and ZINC TRANSPORTER9 Function Synergistically in Zinc/Cadmium Uptake. Plant Physiol. 2020, 183, 1235–1249. [Google Scholar]
  31. Ishimaru, Y.; Suzuki, M.; Tsukamoto, T.; Suzuki, K.; Nakazono, M.; Kobayashi, T.; Wada, Y.; Watanabe, S.; Matsuhashi, S.; Takahashi, M.; et al. Rice Plants Take up Iron as an Fe3+ -phytosiderophore and as Fe2+. Plant J. 2006, 45, 335–346. [Google Scholar]
  32. Yu, E.; Yamaji, N.; Mao, C.; Wang, H.; Ma, J.F. Lateral Roots but Not Root Hairs Contribute to High Uptake of Manganese and Cadmium in Rice. J. Exp. Bot. 2021, 72, 7219–7228. [Google Scholar] [CrossRef] [PubMed]
  33. Zheng, W. Systemic Impact of Trace Elements on Human Health and Diseases: Nutrition, Toxicity, and Beyond. J. Trace Elem. Med. Biol. 2020, 62, 126634. [Google Scholar]
  34. Li, J.; Martin, C.; Fernie, A. Biofortification’s Contribution to Mitigating Micronutrient Deficiencies. Nat. Food 2024, 5, 19–27. [Google Scholar] [CrossRef] [PubMed]
  35. Hao, B.; Ma, J.; Chen, P.; Jiang, L.; Wang, X.; Li, C.; Wang, Z. Wheat Breeding in China over the Past 80 Years Has Increased Grain Zinc but Decreased Grain Iron Concentration. Field Crops Res. 2021, 271, 108253. [Google Scholar]
  36. Murphy, K.M.; Reeves, P.G.; Jones, S.S. Relationship between Yield and Mineral Nutrient Concentrations in Historical and Modern Spring Wheat Cultivars. Euphytica 2008, 163, 381–390. [Google Scholar] [CrossRef]
  37. Bhatta, M.; Baenziger, P.S.; Waters, B.M.; Poudel, R.; Belamkar, V.; Poland, J.; Morgounov, A. Genome-Wide Association Study Reveals Novel Genomic Regions Associated with 10 Grain Minerals in Synthetic Hexaploid Wheat. Int. J. Mol. Sci. 2018, 19, 3237. [Google Scholar] [CrossRef]
  38. Cu, S.T.; Guild, G.; Nicolson, A.; Velu, G.; Singh, R.; Stangoulis, J. Genetic Dissection of Zinc, Iron, Copper, Manganese and Phosphorus in Wheat (Triticum aestivum L.) Grain and Rachis at Two Developmental Stages. Plant Sci. 2020, 291, 110338. [Google Scholar] [CrossRef]
  39. Cui, Y.; Zhang, F.; Zhou, Y. The Application of Multi-Locus GWAS for the Detection of Salt-Tolerance Loci in Rice. Front. Plant Sci. 2018, 9, 1464. [Google Scholar] [CrossRef]
  40. Segura, V.; Vilhjálmsson, B.J.; Platt, A.; Korte, A.; Seren, Ü.; Long, Q.; Nordborg, M. An Efficient Multi-Locus Mixed-Model Approach for Genome-Wide Association Studies in Structured Populations. Nat. Genet. 2012, 44, 825–830. [Google Scholar] [CrossRef]
  41. Liu, X.; Huang, M.; Fan, B.; Buckler, E.S.; Zhang, Z. Iterative Usage of Fixed and Random Effect Models for Powerful and Efficient Genome-Wide Association Studies. PLoS Genet. 2016, 12, e1005767. [Google Scholar] [CrossRef]
  42. Shakoor, N.; Ziegler, G.; Dilkes, B.P.; Brenton, Z.; Boyles, R.; Connolly, E.L.; Kresovich, S.; Baxter, I. Integration of Experiments across Diverse Environments Identifies the Genetic Determinants of Variation in Sorghum Bicolor Seed Element Composition. Plant Physiol. 2016, 170, 1989–1998. [Google Scholar] [PubMed]
  43. Pandey, A.; Khan, M.K.; Hakki, E.E.; Thomas, G.; Hamurcu, M.; Gezgin, S.; Gizlenci, O.; Akkaya, M.S. Assessment of Genetic Variability for Grain Nutrients from Diverse Regions: Potential for Wheat Improvement. SpringerPlus 2016, 5, 1912. [Google Scholar] [CrossRef] [PubMed]
  44. Yuan, L.; Yang, S.; Liu, B.; Zhang, M.; Wu, K. Molecular Characterization of a Rice Metal Tolerance Protein, OsMTP1. Plant Cell Rep. 2012, 31, 67–79. [Google Scholar] [CrossRef] [PubMed]
  45. Chen, Z.; Fujii, Y.; Yamaji, N.; Masuda, S.; Takemoto, Y.; Kamiya, T.; Yusuyin, Y.; Iwasaki, K.; Kato, S.; Maeshima, M.; et al. Mn Tolerance in Rice Is Mediated by MTP8.1, a Member of the Cation Diffusion Facilitator Family. J. Exp. Bot. 2013, 64, 4375–4387. [Google Scholar] [CrossRef]
Figure 1. Grain Cu concentration (mg/kg) of 207 wheat accessions in two different years (E1 and E2) and BLUP values. (A) Boxplots of Cu concentration for E1, E2, and BLUP values. (B) Phenotype distribution of grain Cu concentration (mg/kg) in E1, E2, and BLUP values. (C) Pearson correlation coefficient between two different years (E1 and E2). E1: 2019–2020; E2: 2020–2021.
Agronomy 15 00792 g001
Figure 2. Manhattan plots and QQ plots based on GWAS of GCuC by five multi-locus GWAS. (A) 2019 (E1), (B) 2020 (E2), and (C) BLUP values. Blue dot represents the QTN detected by a single model; Red dot represents the QTN detected by two or more models.
Agronomy 15 00792 g002
Figure 3. Phylogenetic tree construction for homologous amino acid sequences of zinc transporter (ZIP) genes and metal tolerance protein (MTP). (A) Homologous amino acid sequences of zinc transporter (ZIP). (B) Homologous amino acid sequences of metal tolerance protein (MTP). The neighbor-joining trees were constructed using MEGA 11 software and tested using bootstrap method at replication number of 1000. Triticum aestivum L. (IWGSC RefSeq v1.1); Os, Oryza sativa (IRGSP-1.0); At, Arabidopsis thaliana (TAIR 10).
Agronomy 15 00792 g003
Table 1. Digestion procedure of microwave digestion instrument.
ProgramStep 1Step 2Step 3
Temperature/°C RT *–120120–180180–RT *
climbing time/min 121015
settling time/min53510
* RT: room temperature.
Table 2. Descriptive statistics of the Cu content (mg/kg) in wheat grain.
TraitsEnvironment *MinMaxMeanKurtosisSkewnessCV (%)
CopperE13.337.335.41−0.860.0416.39
E23.387.895.470.690.4613.29
BLUP4.576.465.440.160.316.34
* E1: 2019–2020; E2: 2020–2021.
Table 3. List of stable QTNs of grain copper content in wheat.
QTNChromosomePosition (Mb)−log10(p)r2 (%)ModelEnvironment *
AX-1109056251A473.86.6–7.72.1–3.9FASTmrMLM, pLARmEBBLUP
AX-1115424701A580.14.4–6.82.3–4.7FASTmrMLM, pLARmEB, pKWmEBE1, BLUP
AX-946516741B685.14.2–8.31.4–3.6FASTmrMLM, ISIS EM-BLASSO, pLARmEB, pKWmEBE2
AX-1101292462A19.86.0–8.78.0–11.5FASTmrMLM, mrMLME2
AX-1103862662A226.54.9–6.26.2–14.8FASTmrMLM, mrMLM, pLARmEB, pKWmEBE1, BLUP
AX-1088748922A691.14.8–6.31.9–5.8FASTmrMLM, mrMLM, pLARmEBBLUP
AX-1093194572A729.35.2–5.33.9–4.7FASTmrMLM, pKWmEBE1
AX-1106761612B172.83.8–3.80.5–1.6FASTmrMLM, pLARmEBE2
AX-1104562522B449.13.8–10.13.0–6.2FASTmrMLM, pLARmEB, pKWmEBBLUP
AX-1107070642B603.83.8–5.70.3–2.2FASTmrMLM, ISIS EM-BLASSO, pLARmEBE2
AX-1101927312D75.65.6–5.93.3–4.2FASTmrMLM, pKWmEBE1
AX-1112118242D647.54.1–8.65.5–17.0FASTmrMLM, pKWmEBE2
AX-1112316423A20.35.2–6.21.4–10.9mrMLM, pLARmEBE2
AX-1100928043B18.84.9–7.42.2–4.9FASTmrMLM, pLARmEB, pKWmEBE1
AX-1108167443D594.54.2–4.92.5–4.9FASTmrMLM, pLARmEBBLUP
AX-1107100584A606.63.8–7.61.2–7.3ISIS EM-BLASSO, pLARmEB, pKWmEBE1
AX-1106303084B10.63.8–6.11.4–8.1FASTmrMLM, mrMLME2
AX-1109847514B32.35.2–6.85.9–6.1ISIS EM-BLASSO, pKWmEBE1
AX-1094077214B38.85.7–6.31.1–3.3ISIS EM-BLASSO, pLARmEBE2
AX-1087520034B610.24.0–9.52.9–7.8mrMLM, ISIS EM-BLASSO, pLARmEBE2, BLUP
AX-1088018515A17.43.9–6.53.4–5.2ISIS EM-BLASSO, pKWmEBE1
AX-1109750445A512.66.2–11.14.0–11.3FASTmrMLM, pLARmEB, pKWmEBBLUP
AX-1110737395A681.54.2–5.01.2–3.7pLARmEB, pKWmEBE2, BLUP
AX-1118222275B634.14.5–4.81.2–1.8FASTmrMLM, pLARmEBBLUP
AX-1097378235D443.94.3–4.82.4–16.2pLARmEB, pKWmEBE2
AX-1093304526B202.95.4–6.43.0–6.0FASTmrMLM, mrMLME2
AX-1102760996D463.94.6–4.90.9–3.1FASTmrMLM, pLARmEB, pKWmEBE2
AX-1099257657A37.35.1–7.22.1–4.6FASTmrMLM, mrMLM, pLARmEB, pKWmEBE1, BLUP
AX-1110122637A261.74.9–6.45.2–9.7FASTmrMLM, pLARmEB, pKWmEBE1
AX-1105063297B336.44.2–7.16.7–29.3mrMLM, ISIS EM-BLASSO, pLARmEB, pKWmEBBLUP
* E1: 2019–2020; E2: 2020–2021.
Table 4. List of candidate genes for copper content in wheat grain.
QTNChromosomeCandidate GeneAnnotationDistance to QTN (Mb)
AX-1093194572ATraesCS2A02G505500Zinc transporter4.50
AX-1104562522BTraesCS2B02G313200Copper transporter family protein−0.40
AX-1112316423ATraesCS3A02G042600Metal tolerance protein2.49
AX-1100928043BTraesCS3B02G040900Metal tolerance protein1.52
AX-1106303084BTraesCS4B02G019300Zinc transporter3.38
Disclaimer/Publisher’s Note: The statements, opinions and data contained in all publications are solely those of the individual author(s) and contributor(s) and not of MDPI and/or the editor(s). MDPI and/or the editor(s) disclaim responsibility for any injury to people or property resulting from any ideas, methods, instructions or products referred to in the content.

