Article

Analysis of Spatiotemporal Variation and Driving Forces of Vegetation Net Primary Productivity in the North China Plain over the Past Two Decades

1
Langfang Integrated Natural Resources Survey Center, China Geological Survey, Langfang 065000, China
2
Haihe River Basin North Natural Resources Field Scientific Observatory, Langfang 065699, China
3
Key Laboratory of Coupling Process and Effect of Natural Resources Elements, Command Center for Natural Resources Comprehensive Survey, China Geological Survey, Beijing 100055, China
4
Innovation Base of Natural Resources Change Observation and Capital Monitoring in the Northern Haihe River Basin of China Society of Territorial Economists, Langfang 065000, China
*
Author to whom correspondence should be addressed.
These authors contributed equally to this work.
Agronomy 2025, 15(4), 975; https://doi.org/10.3390/agronomy15040975
Submission received: 16 March 2025 / Revised: 15 April 2025 / Accepted: 15 April 2025 / Published: 17 April 2025

Abstract

:
The net primary productivity (NPP) of vegetation—a critical component of ecosystem carbon cycling and a key indicator of the quality and functionality of ecosystems—is jointly influenced by natural and anthropogenic factors. As NPP is a vital agricultural and ecological region in China, understanding the spatiotemporal dynamics and driving mechanisms of vegetation NPP in the North China Plain (NCP) has significant implications for regional sustainable development. Utilizing MODIS NPP, temperature, precipitation, and human activity data from 2003 to 2023, this study employs univariate linear regression, ArcGIS spatial analysis, and the Hurst index to investigate the spatiotemporal characteristics, driving factors, and future trends in vegetation NPP. The results indicate that vegetation NPP exhibited a fluctuating upward trend over the 21-year period, with an annual increase of 2.60 g C/m2. Spatially, NPP displayed a “high in the south, low in the north” pattern. There is significant spatial heterogeneity between temperature, precipitation, and vegetation NPP in the study area, with natural factors generally exerting a greater influence than human activities; however, the coupling of human activities with other factors significantly amplify their impact. The Hurst index (mean: 0.43) revealed an anti-persistent future trend in vegetation NPP, suggesting substantial uncertainties regarding its long-term dynamics. These findings enhance our understanding of the responses of vegetation to global change and provide a scientific basis for balancing food security and ecological conservation in the NCP.

1. Introduction

Vegetation, as a core component of terrestrial ecosystems, fixes carbon dioxide through photosynthesis and converts it into organic carbon, playing a crucial role in maintaining the Earth’s carbon cycle and ecological balance [1,2]. The net primary productivity (NPP) of vegetation refers to the total amount of organic carbon fixed via photosynthesis in a unit of time minus the carbon consumed by autotrophic respiration and serves as a crucial indicator for assessing the functions and carbon sink capacity of ecosystems [3,4]. The spatiotemporal variation in NPP not only reflects the growth status and resource utilization efficiency of vegetation but also reveals the comprehensive impacts of climate change and human activities on ecosystems [5,6]. In recent years, global warming, land use transitions, and water scarcity have intensified, making NPP research a pivotal scientific basis for assessing the potential for regional ecological restoration and for formulating sustainable development policies [7,8,9]. Therefore, exploring the spatiotemporal evolution trends and driving factors of NPP holds great significance for evaluating the quality and stability of the regional ecological environment and formulating sustainable development policies.
In recent years, scholars have conducted extensive research on the spatiotemporal changes and driving mechanisms of vegetation NPP globally, primarily focusing on the spatiotemporal variation patterns of regional and large-scale vegetation NPP [10,11], the response patterns of vegetation NPP to climate factors [12,13], and the contributions of climate change and human activities to changes in vegetation NPP [14,15]. The utilized research methods mainly include remote sensing inversion, process model simulation, and multi-source data fusion. At present, NPP estimation based on MODIS data remains the mainstream method, as data with high spatiotemporal resolution (e.g., 500 m) can effectively capture the regional dynamics of vegetation. For instance, Igboeli et al. [16] used the MODIS product MOD17A3 to estimate the actual net primary productivity (ANPP) of the Lake Chad Basin (LCB) and the Aral Sea Basin (ASB) from 2000 to 2020, based on factors such as photosynthetically active radiation. They found that human activities were the dominant factor affecting ANPP in the LCB, while climate was the dominant factor in the ASB. Some studies have improved the CASA model and spatiotemporal fusion algorithm to obtain vegetation NPP data and quantitatively evaluated the contributions of climate and human factors to NPP changes based on partial derivatives. As Zhang et al. [17] discovered, the vegetation NPP of Dongting Lake wetland in China exhibited a notable upward trend between 2000 and 2019. Temperature, precipitation, and solar radiation (SR) positively influenced variations in NPP, with SR being the most significant contributor. Human activities primarily contributed to the degradation of vegetation, whereas climate played a pivotal role in its restoration. Furthermore, numerous scholars have refined the CASA model to quantitatively assess NPP at national or watershed scales. For instance, Liu et al. [18] enhanced the precision of grassland NPP simulation by interpolating meteorological elements, thereby increasing the resolution of the data. Field et al. [19] set the maximum light energy utilization rate at 0.389 gC · MJ−1 and estimated the annual global land NPP to be 48 PgC, based on AVHRRNDVI time-series and the CASA model. Wang et al. [20] investigated the spatial non-stationarity and scale effects of various natural and anthropogenic factors on NPP, revealing that natural factors, such as relative humidity, exert a substantial influence on NPP in the Yellow River Basin, both in terms of magnitude and scale. Conversely, Xue et al. [21] noted that vegetation NPP in the Qimeng region exhibited a fluctuating upward trend from 2003 to 2020, with an average annual growth rate of 2.91%. Precipitation, population density, and GDP were identified as the primary driving factors, with human activities contributing slightly more than climate change. These disparities highlight the need for region-specific analyses to unravel complex interactions between natural and anthropogenic drivers. Hence, it is imperative to further investigate the spatiotemporal evolution patterns and driving mechanisms of vegetation NPP at the regional scale.
The NCP, as the largest alluvial plain and major grain-producing region in China, supports 20% of the country’s population and contributes 25% of its grain output. Its ecological stability is crucial for national food security and carbon sink objectives [22]. In recent years, rapid economic development, coupled with various human activities and climate-change-related disruptions, have significantly impacted ecosystem functions in the NCP, adversely affecting vegetation growth and ecosystem services within the region. To address this issue, the government has implemented several policies aimed at ecological restoration, including the Comprehensive Control Plan for Overextraction of Groundwater in the NCP (2021–2025) and a subsidy policy for straw returning. These policies seek to enhance the productivity of vegetation through appropriate water resource management and farmland carbon sequestration. Previous research has delved into the spatiotemporal variations and driving factors of vegetation NPP in North China, achieving a certain degree of progress. For instance, Ge et al. [23] investigated the detrimental effects of ozone pollution on the NPP in the NCP, revealing that ozone pollution led to an average decrease of 24.7% in NPP across the region. Tang et al. [24] posited that climate change contributed relatively little to vegetation dynamics in the NCP. Existing studies in the NCP have primarily examined isolated drivers, leaving the synergistic effects of multi-factor interactions and future vegetation trends understudied. Consequently, this study selected the NCP as its study area. Utilizing MOD17A3HGF data, as well as meteorological, hydrological, and human activity data spanning from 2003 to 2023, alongside techniques such as linear regression analysis and correlation analysis, we explore the spatiotemporal patterns of vegetation NPP. Furthermore, we employ the geographical detector model to scrutinize the factors influencing variations in vegetation NPP.

2. Materials and Methods

2.1. Overview of the Study Area

The NCP is bordered by the Bohai Sea to the east, the Taihang Mountains to the west, the Yanshan Mountains to the north, and the Yellow River to the south. It features a low and flat terrain, with an altitude mostly below 50 m, covering an area of approximately 138,000 square kilometers (Figure 1). Located in a warm temperate humid or semi-humid climate zone, it experiences concurrent rainfall and heat, with an annual average temperature ranging from 11 to 12 degrees Celsius and annual precipitation generally falling between 400 and 600 mm. The seasonal distribution of precipitation is uneven, often resulting in severe droughts in spring and floods in summer. The study area is home to various vegetation types, including cultivated vegetation, coniferous forests, broad-leaved forests, grasslands, and shrubs, with cultivated vegetation comprising over half of the total area. This region stands as one of China’s key agricultural production bases, cultivating major crops, such as wheat (Triticum aestivum), corn (Zea mays), cotton (Gossypium spp.), and soybeans (Glycine max). The primary planting pattern is the cultivation of winter wheat followed by summer corn, which represents a yearly double cropping cycle.

2.2. Data Sources

The data source information is shown in Table 1. All spatial data were converted to the WGS 1984 Albers coordinate system in ArcGIS Pro 3.0.2 software, and the resolutions were resampled to 1000 m with the nearest neighbor resampling method.

2.2.1. Vegetation Data

The annual NPP data from 2003 to 2023 were obtained from the MOD17A3HGF dataset provided by NASA.

2.2.2. Environmental Factor Data

Annual precipitation data from 2003 to 2023 were obtained based on the TerraClimate dataset (https://climate.northwestknowledge.net/, accessed on 26 December 2024). The accumulated monthly precipitation values were calculated, and the annual average temperature data were obtained by taking the average of the highest and lowest monthly temperatures in the TerraClimate dataset.
The actual evapotranspiration (AET), solar radiation (SR), saturated vapor pressure deficit (VPD), and soil moisture (SM) content data were obtained from the Resource and Environmental Science and Data Center of the Chinese Academy of Sciences. Elevation data were obtained through the Geographic Spatial Data Cloud Platform (https://www.gscloud.cn/, accessed on 26 December 2024), from which raw elevation data were downloaded as SRTM DEM datasets.

2.2.3. Land Use Data

The land use data were downloaded from the Zenodo platform.

2.2.4. Human Footprint Data

Human footprint data were downloaded from relevant research data repositories.

2.3. Methods

2.3.1. Trend Analysis

A univariate linear regression model and the least-squares method were applied at the pixel level to calculate the slope of annual NPP trends from 2003 to 2023. The slope ( β ) was derived using the following formula:
s l o p e = n × i = 1 n N i t i i = 1 n N i × i = 1 n t i n × i = 1 n t i 2 ( i = 1 n t i ) 2
where N P P i represents the NPP value in year i . A positive slope (β > 0) indicates an increasing trend, while a negative slope (β < 0) denotes a decreasing trend.

2.3.2. Correlation Analysis

Pearson correlation coefficients (r) were calculated to assess the relationships between NPP and annual precipitation (Per, mm) and mean annual temperature (Temp, °C). Significance was tested at a level of α = 0.05. The formulae are as follows:
R NPP , Per = i = 1 n ( N i N ¯ ) ( P i P ¯ ) i = 1 n ( N i N ¯ ) 2 × i = 1 n ( P i P ¯ ) 2
R NPP , Temp = i = 1 n ( N i N ¯ ) ( T i T ¯ ) i = 1 n ( N i N ¯ ) 2 × i = 1 n ( T i T ¯ ) 2
where N P P i , P i , and T i denote the annual NPP (g C/m2/yr), precipitation (mm), and temperature (°C) in year i , respectively, and N P P ¯ , P ¯ , and T ¯ are their multi-year averages. A two-tailed t-test was performed to evaluate the significance:
t = N M 1 × R 1 R 2
with n = 21 (years) and considering a critical t-value of 2.093.

2.3.3. Stability Analysis

The coefficient of variation ( C v ) was employed to quantify interannual NPP stability from 2003 to 2023:
C v = 1 n 1 i = 1 n ( N i N ¯ ) 2 / N ¯
Stability was classified into four levels: low ( C v < 0.1), moderate (0.1 ≤ C v < 0.2), high (0.2 ≤ C v < 0.5), and extreme ( C v ≥ 0.5).

2.3.4. Geographical Detector Model

A geographical detector model was used to assess driving factors of NPP variation. The explanatory power ( q ) of each factor was calculated as follows:
q = 1 S S W S S T = 1 h = 1 L N h δ h 2 N δ 2
The q statistic quantifies the influence of discretized driving factors on NPP variation, with values ranging from 0 to 1. Higher q values indicate stronger explanatory power of the driving factors, where L is the number of strata for a factor; N h and δ h 2 are the sample size and variance of stratum h , respectively; and n and δ 2 are the total sample size and variance, respectively. Specifically, SSW (sum of squared deviations within layers) and SST (total sum of squared deviations) measure intra-layer and total variability, respectively.

2.3.5. Hurst Index for Trend Prediction

The Hurst index ( H ) was computed using rescaled range analysis (R/S) to predict future NPP trends:
① 0 < H < 0.5: Anti-persistent trend (closer to 0 indicates stronger anti-persistence);
H = 0.5: Random trend;
③ 0.5 < H < 1: Persistent trend (closer to 1 indicates stronger persistence).
As such, four categories were defined: strong anti-persistence ( H < 0.35), weak anti-persistence (0.35 ≤ H < 0.5), weak persistence (0.5 ≤ H < 0.65), and strong persistence ( H ≥ 0.65).

2.3.6. Workflow Diagram

To further demonstrate the processing approach and research ideas, a workflow diagram is shown in Figure 2.

3. Results

3.1. Spatiotemporal Distribution Patterns of NPP in the NCP

3.1.1. Temporal Variation in Vegetation NPP

Figure 3 illustrates the interannual variations in vegetation NPP across the NCP from 2003 to 2023. The annual mean NPP exhibited a fluctuating upward trend, ranging from 317.14 to 407.51 g C/m2, with a 21-year average of 360.33 g C/m2. Notably, the lowest annual NPP (317.14 g C/m2) occurred in 2007, while the peak value (407.51 g C/m2) was recorded in 2021, representing a difference of 90.37 g C/m2 (Figure 3a). A distinct divergence in NPP trends was observed among vegetation types during this period. Cultivated vegetation (slope = 2.98 g C/m2/yr) and broad-leaved forests (slope = 2.31 g C/m2/yr) demonstrated the most rapid increases, rising by 47.85 g C/m2 (14.71%) and 70.22 g C/m2 (16.22%), respectively. In contrast, grasslands showed relatively stable growth, with an increase of 33.89 g C/m2 (14.45%) (Figure 3b).

3.1.2. Spatial Variation Characteristics of Vegetation NPP

The multi-year average NPP (NPPm) displayed a pronounced “high in the south, low in the north” spatial gradient across the NCP (Figure 4a). Provincial-level rankings of vegetation NPP followed the following order: Henan > Shandong > Hebei > Beijing > Tianjin. Approximately 54.14% of the study area exhibited NPP values between 300 and 450 g C/m2. Regions with NPP below 150 g C/m2 (6.64% coverage) were concentrated in urban centers, such as Beijing, Tianjin, Shijiazhuang, and Baoding. Conversely, localized high-NPP zones (>600 g C/m2) occupied only 1.61% of the area, primarily in Nanyang (Henan Province) and Weihai (Shandong Province). Over the study period, the variability of NP (coefficient of variation, Cv) ranged from 0 to 4.6 (mean: 0.13), indicating predominantly moderate-to-low fluctuations. Specifically, the low fluctuation areas (Cv ≤ 0.1) constituted 22.45% of the total study area, while moderate (0.1 < Cv ≤ 0.2) and high fluctuation areas (Cv ≥ 0.5) accounted for 70.65% and 0.25%, respectively. Spatially, low annual NPP variability was predominantly observed in the northern Yanshan Mountains (Hebei Province), eastern Shandong Peninsula, and Funiu Mountain region (Henan Province). In contrast, high variability areas were concentrated in Beijing and southwestern Hebei Province (Figure 4b).
As illustrated in Figure 4c,d, the slope of vegetation NPPm across the study area during 2004–2023 varied between −26.4 and 49.1 g C/m2/yr, with 12.65% of the total area exhibiting statistically significant trends (p < 0.05). Notably, 11.93% of the region displayed significant NPPm increases, predominantly concentrated in central and southern areas. The most rapid growth rates (slope > 8 g C/m2/yr) were observed in Beijing, Zhangjiakou (Hebei Province), Dezhou (Shandong Province), Luoyang, and Sanmenxia (Henan Province), collectively constituting 2.63% of the study area (Figure 4c). Conversely, non-significant NPPm declines covered a larger spatial extent (7.67%) compared to significant reductions, primarily clustered in Zhengzhou and Xinxiang (central Henan), Dezhou and Liaocheng (northwestern Shandong), and Handan and Cangzhou (southwestern Hebei) (Figure 4d).

3.2. Driving Factors of Vegetation NPP Change in the NCP

3.2.1. Climate Factors Influencing Vegetation NPP

Pixel-scale analysis revealed significant spatial heterogeneity regarding the relationships between climatic variables (temperature/precipitation) and vegetation NPP across the NCP (Figure 5). The correlation coefficients between NPP and precipitation ranged from −0.71 to 0.88 (mean = 0.22), with 85.67% of the study area exhibiting positive correlations (Figure 5a). Notably, 14.08% of pixels demonstrated statistically significant correlations (p < 0.05), concentrated in the Henan Plains, Shandong Peninsula, and Beijing–Tianjin–Hebei metropolitan region (correlation coefficients: 0.10–0.65). Significant negative correlations were clustered in western Henan, northern Hebei, and isolated areas of Shandong (Figure 5a,c).
As illustrated in Figure 5b, the correlation coefficients between vegetation NPP and mean air temperature in the study area ranged from −0.90 to 0.91, with an average value of 0.17. Positive correlations were observed in 75.75% of the study area, indicating a predominant positive relationship between vegetation NPP and mean air temperature across most regions of the NCP. Figure 5d presents the significance testing results for these correlations, showing statistically significant positive correlations (p < 0.05) in 13.71% of the total area. These significant positive correlations were primarily distributed in southern Shandong Province (Linyi City, Zaozhuang City, and Rizhao City) and central Hebei Province (Cangzhou City, Langfang City, and Tangshan City). Negative correlations between vegetation NPP and mean air temperature accounted for 24.25% of the study area, with statistically significant negative correlations (p < 0.05) occupying 86.29% of these negatively correlated regions. These significant negative correlations were predominantly scattered across northern Henan Province (Puyang City and Xinxiang City), coastal areas of Shandong Province (Qingdao City and Dongying City), and southwestern Hebei Province (Shijiazhuang City, Handan City, and Hengshui City) (Figure 5b,d).

3.2.2. Analysis of Vegetation NPP Drivers

The preceding sections examine the spatial correlations between vegetation NPP and unstable environmental factors, such as temperature and precipitation. To further investigate the driving mechanisms of vegetation NPP, a geographical detector model was employed, incorporating AET, SR, VPD, mean temperature (TEMP), precipitation (PRE), elevation (ALT), SM, and human activity intensity (HFP) as influencing factors. The results obtained with the factor detector (Table 2) revealed the following order of explanatory power for vegetation NPP: VPD > ALT > HFP > PRE > TEMP > AET > SM > SR. Saturated water vapor pressure (VPD), elevation (ALT), and human activity intensity (HFP) emerged as the primary drivers, with the explanatory power ranging from 10% to 19%, while precipitation and temperature were secondary factors, contributing 9% each.
The interaction detector results (Figure 6) demonstrated that the combined explanatory power of two-factor interactions exceeded those of the individual factors, with interaction types categorized as either dual-factor enhancement or non-linear enhancement. Notably, the interactions between ALT, HFP, and VPD exhibited the strongest explanatory powers, reaching 29% and 25%, respectively. These findings underscore that the spatiotemporal distribution of vegetation NPP in natural environments is driven by multiple factors, with natural influences generally outweighing human activities. Although the standalone impact of human activities on NPP was weaker than that of VPD and ALT, coupling with other factors significantly amplified their influence. Overall, variations in vegetation NPP in the NCP are co-driven by climatic conditions and human activities.

3.3. Vegetation NPP Trends in the NPP

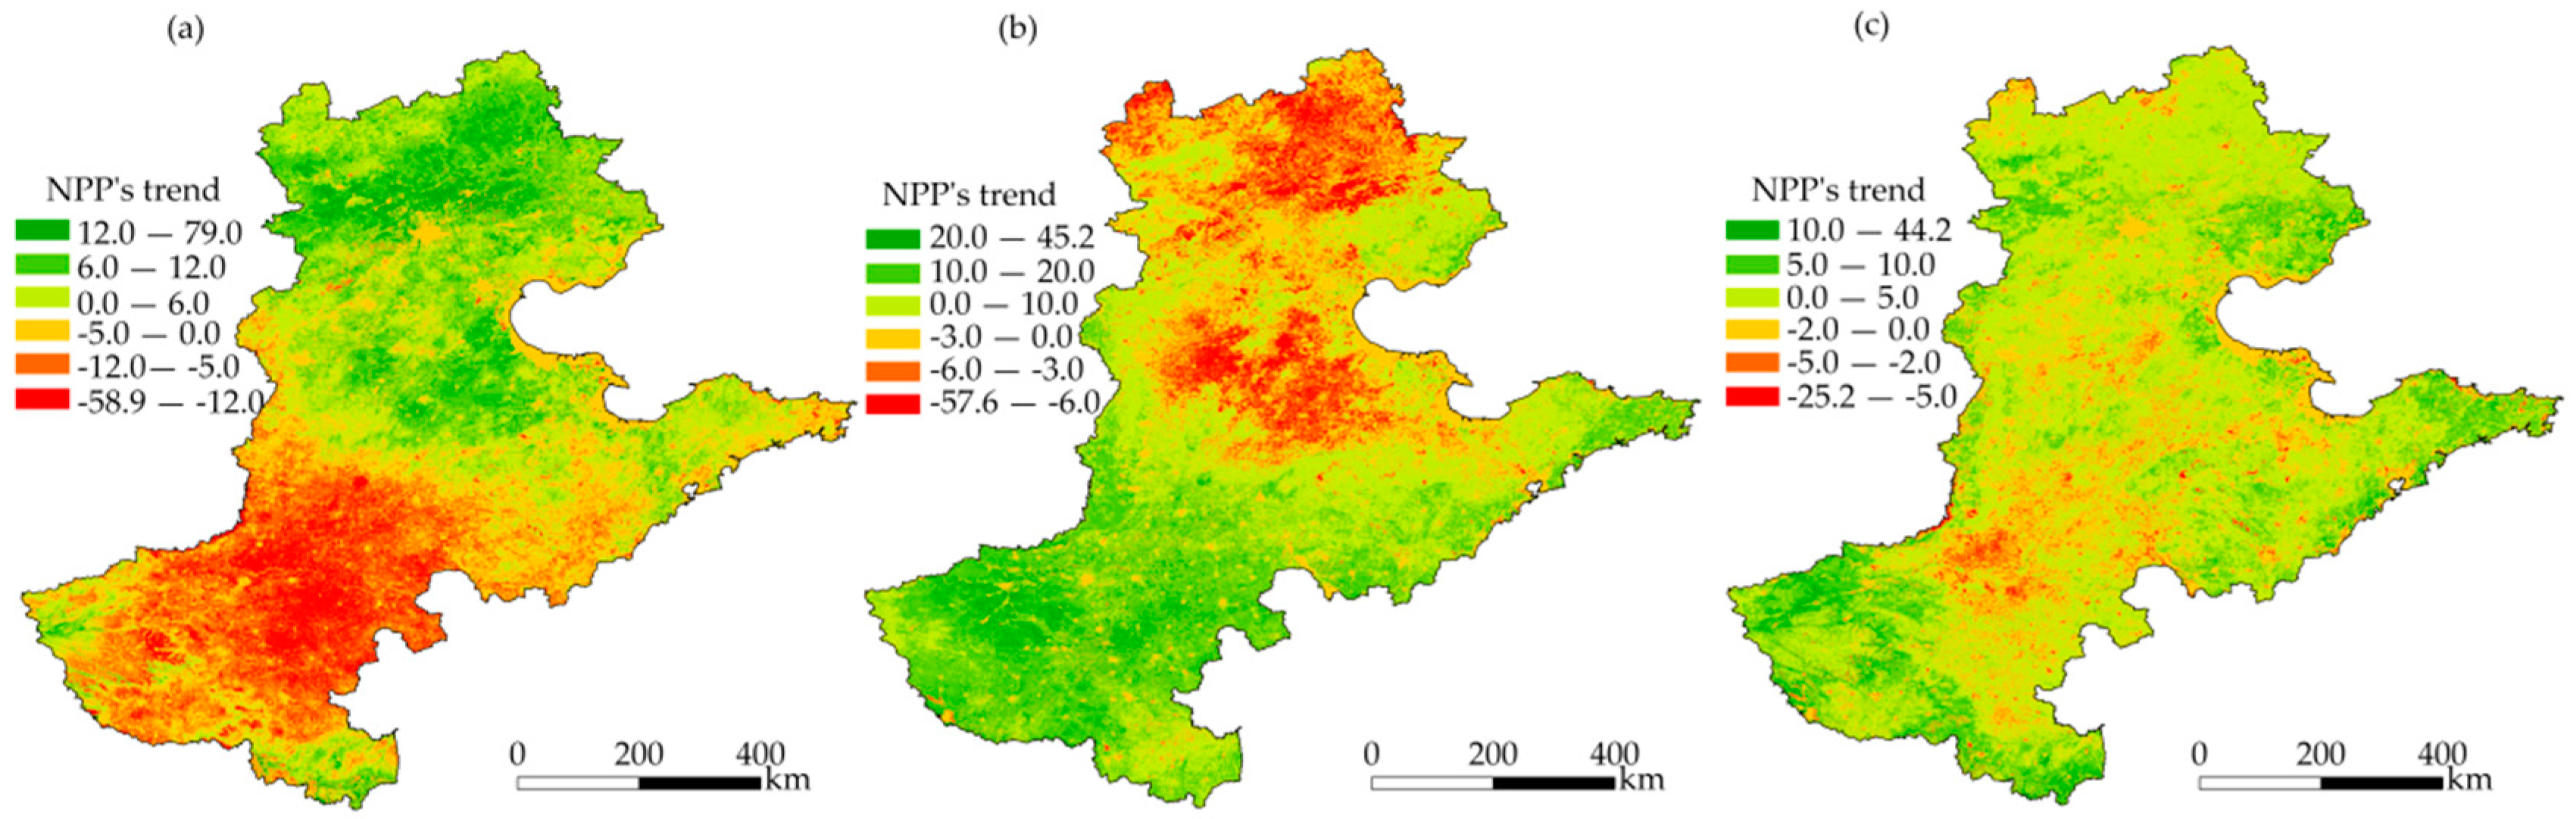
3.3.1. NPP Trends from 2003 to 2023

The vegetation NPP trends during 2003–2023 (Figure 7) predominantly increased (slope: 5.00–44.20 g C/m2), accounting for over 18.74% of the study area in all three phases. From 2003 to 2013, NPP increases were concentrated in the central and northern regions, with rapid growth observed in northern Hebei and northwestern Shandong. Conversely, significant declines occurred in most parts of Henan. From 2013 to 2023, NPP continued to rise, particularly in central-western Henan. Over the entire study period (2003–2023), significant NPP increases (p < 0.05) covered 31.01% of the region, primarily in the central and southern parts of the NCP. The fastest growth (10.0–44.2 g C/m2/yr) occurred in scattered areas, such as Chengde (Hebei), Luoyang, and Nanyang (Henan). Moderate growth (3.0–10.0 g C/m2/yr) dominated northeastern and western Hebei, western and southern Henan, and most of Shandong. Slight increases (0.0–3.0 g C/m2/yr) were sporadically distributed in the Yanshan Mountains (Hebei) and northern Henan. Declines were localized in Xinxiang, Anyang (Henan), and Hengshui and Cangzhou (Hebei).

3.3.2. Prediction of Vegetation NPP Trends

The Hurst index for the NCP ranged from 0.15 to 0.91 (mean: 0.43), indicating an overall anti-persistent future trend (Figure 8a). High values were found to be clustered in coastal cities (e.g., Qinhuangdao, Tangshan, Tianjin) and parts of Luoyang and Jiaozuo (Henan), while low values dominated in the Taihang Mountains (western Hebei), Funiu Mountains (southwestern Henan), and southwestern Shandong. Anti-persistent and persistent trends covered 81.50% and 18.50% of the region, respectively. Integration with the trend analysis (Figure 8b) revealed four categories: anti-persistent decrease (13.91%), persistent decrease (4.06%), anti-persistent increase (67.59%), and persistent increase (14.44%). Persistent increases were prominent in Zhangjiakou, Handan, Xingtai (Hebei), and coastal Shandong, suggesting the potential recovery of vegetation. Conversely, anti-persistent decreases dominated central-eastern Henan, western Shandong, and southern Hebei, indicating future instability. Persistent decreases in northern Zhangjiakou, western Cangzhou, and coastal Dongying highlight regions requiring focused monitoring.

4. Discussion

As a crucial agricultural and ecological region in China, the NCP exhibits distinct spatiotemporal patterns of vegetation NPP. Understanding vegetation adaptability to climate change and anthropogenic disturbances requires multiscale analyses of successional patterns and their driving mechanisms. By investigating spatial heterogeneity across diverse spatiotemporal scales, this study establishes a theoretical framework that elucidates how vegetation responds to both environmental fluctuations and human activities. Our results demonstrate that vegetation NPP in the NCP showed an overall increasing trend over the past two decades, with a mean annual value of 360.33 g C/m2. Notably, the annual vegetation NPP reached its minimum in 2007 (320.15 g C/m2), potentially associated with an extreme drought event characterized by 28% below-average precipitation and 1.5 °C above-average temperatures, conditions detrimental to vegetation growth [25,26]. The spatial distribution of vegetation NPP followed a distinct south-to-north gradient, with high-value zones (450–580 g C/m2) concentrated in Henan and Shandong provinces, contrasting with low-value areas (220–300 g C/m2) in Hebei Province, Beijing, and Tianjin. This spatial pattern arises from the interplay between natural climatic gradients and anthropogenic pressures [27,28]. Southern regions (Henan and Shandong) benefit from a transitional monsoon climate (warm temperate to northern subtropical) with sufficient hydrothermal resources (≥600 mm annual precipitation and ≥12 °C mean temperature) to support wheat–corn rotations and deciduous broadleaf forests [29]. In contrast, northern areas (Beijing–Tianjin–Hebei) experience a temperate monsoon climate with limited precipitation (400–550 mm annually), exacerbated by orographic barriers (Yanshan and Taihang Mountains) that create semi-arid ecotones [30]. Shallow soils (<50 cm depth) and high evapotranspiration rates (>1200 mm/yr) in northern mountainous regions further constrain the productivity of natural vegetation [31].
Anthropogenic influences amplify this spatial disparity. The Beijing–Tianjin–Hebei megapolis, as China’s political–economic core with 85% urbanization [32], dedicates over 30% of its land to urban development [33]. This urban expansion has fragmented ecological spaces and suppressed photosynthetic efficiency through heat island effects (ΔT ≥ 2.5 °C) and impervious surface coverage (>40%) [34]. Conversely, Henan’s agricultural dominance (68% arable land) and intensive farming practices (e.g., 300 kg/ha annual fertilizer input, 80% irrigated cropland) elevate crop NPP, forming regional productivity hotspots [35]. However, excessive nitrogen inputs (>250 kg/ha) in 35% of croplands have triggered soil acidification (pH decline by 0.3–0.5 units) and reduced microbial diversity, potentially undermining long-term NPP sustainability [36,37].
Climatic and anthropogenic drivers jointly regulate vegetation NPP dynamics through modifications in plant community structures, land cover transformations, and ecological engineering interventions [38,39,40]. Our analysis identified vapor pressure deficit (VPD) and altitude (ALT) as the primary natural determinants of NPP variability (explanatory power: 10–19%), diverging from the traditional paradigm of precipitation—temperature dominance [41]. This discrepancy likely stems from methodological advancements, such as the incorporation of geographical detector models that emphasize spatial differentiation effects. As a comprehensive atmospheric aridity index, elevated VPD (>2.5 kPa) induces stomatal closure, reducing plant water loss but concurrently limiting carbon assimilation—a critical constraint in the semi-arid NCP [42,43]. Notably, human footprint (HFP) exhibited amplified influence on NPP through synergistic interactions with environmental factors [44,45]. Anthropogenic modifications (e.g., land conversion, irrigation, fertilization) alter edaphic conditions, such as increasing soil organic carbon by 15–30% in managed systems, thereby mediating vegetation–climate feedback mechanisms [46]. The NCP exemplifies such human–environment coupling, where intensive land use (≥3 cropping cycles annually) and rapid urbanization (2.8% annual growth rate) drive non-linear NPP responses [47]. While previous studies focus on isolated drivers, our interaction detection revealed threshold effects under natural-anthropogenic synergy; for instance, HFP–NDVI coupling explained 38% of the variance in NPP, suggesting priority areas for restoration policies. However, this study has several limitations, such as reliance on annual NPP data obscured seasonal dynamics—critical for assessing drought responses and phenological shifts. For instance, spring NPP in the NCP decreased by 12% during 2010–2020 due to delayed monsoon onset, while summer NPP increased by 9% [48]. The results may be slightly skewed due to limitations in data resolution, analytical methods, and temporal scope selection. For example, the coarse spatial resolution of the MOD17A3HGF product limits accurate detection of fine-scale ecosystem dynamics, particularly in heterogeneous agricultural landscapes where localized vegetation variations require higher-resolution data inputs. Future research should aim to enhance the spatiotemporal accuracy of vegetation NPP and influencing factor data. Specifically, systematic validation of the MODIS NPP product using multi-source ground-truth measurements (e.g., eddy covariance flux tower data and plot-scale biomass sampling) is necessary. Additionally, comparisons of refined modeling methods, such as the fusion of machine learning and process models, are critical to minimizing uncertainties.
In recent years, ecological initiatives (e.g., farmland-to-forest conversion, mountain closure for afforestation, and sand source control in the Beijing–Tianjin region) have significantly propelled regional ecological restoration through increased vegetation coverage, thereby positively impacting NPP growth [49,50]. However, this study suggests that future vegetation NPP will exhibit a pronounced anti-sustainability trend, diverging from linear growth patterns observed in the US Corn Belt (+1.2% yr⁻1) and Indo-Gangetic Plain (+0.8% yr⁻1). Unlike these regions, where irrigation buffers climate variability, groundwater depletion in the NCP (−1.2 m·yr−1) exacerbates drought sensitivity, necessitating adaptive policies, such as drip irrigation subsidies and crop rotation mandates [51,52]. This discrepancy likely arises from methodological advancements. By integrating non-linear models such as the Hurst exponent, this study detected negative ecosystem feedback mechanisms, such as sustainability thresholds from excessive water resource exploitation. Moreover, Mu et al. [53] observed significant seasonal NPP fluctuations in Henan Province’s Zhongyuan city cluster, with urban heat environments promoting vegetation growth more effectively in autumn and winter than in summer. This suggests that climate warming may intensify future NPP fluctuations by altering phenological periods, aligning with the anti-sustainability prediction mechanism proposed here. These findings caution that the current efficacy of vegetation restoration might be constrained by long-term resource carrying capacity threshold, implying that policies should balance natural restoration with targeted human intervention.

5. Conclusions

This study analyzes the temporal–spatial patterns of vegetation NPP in the NCP from 2003 to 2023 using linear regression and ArcGIS-based spatial analysis, utilizing vegetation, meteorological, soil, and human activity data. The geographical exploration model was employed to identify key drivers of vegetation NPP. The major findings of the study are as follows:
(1)
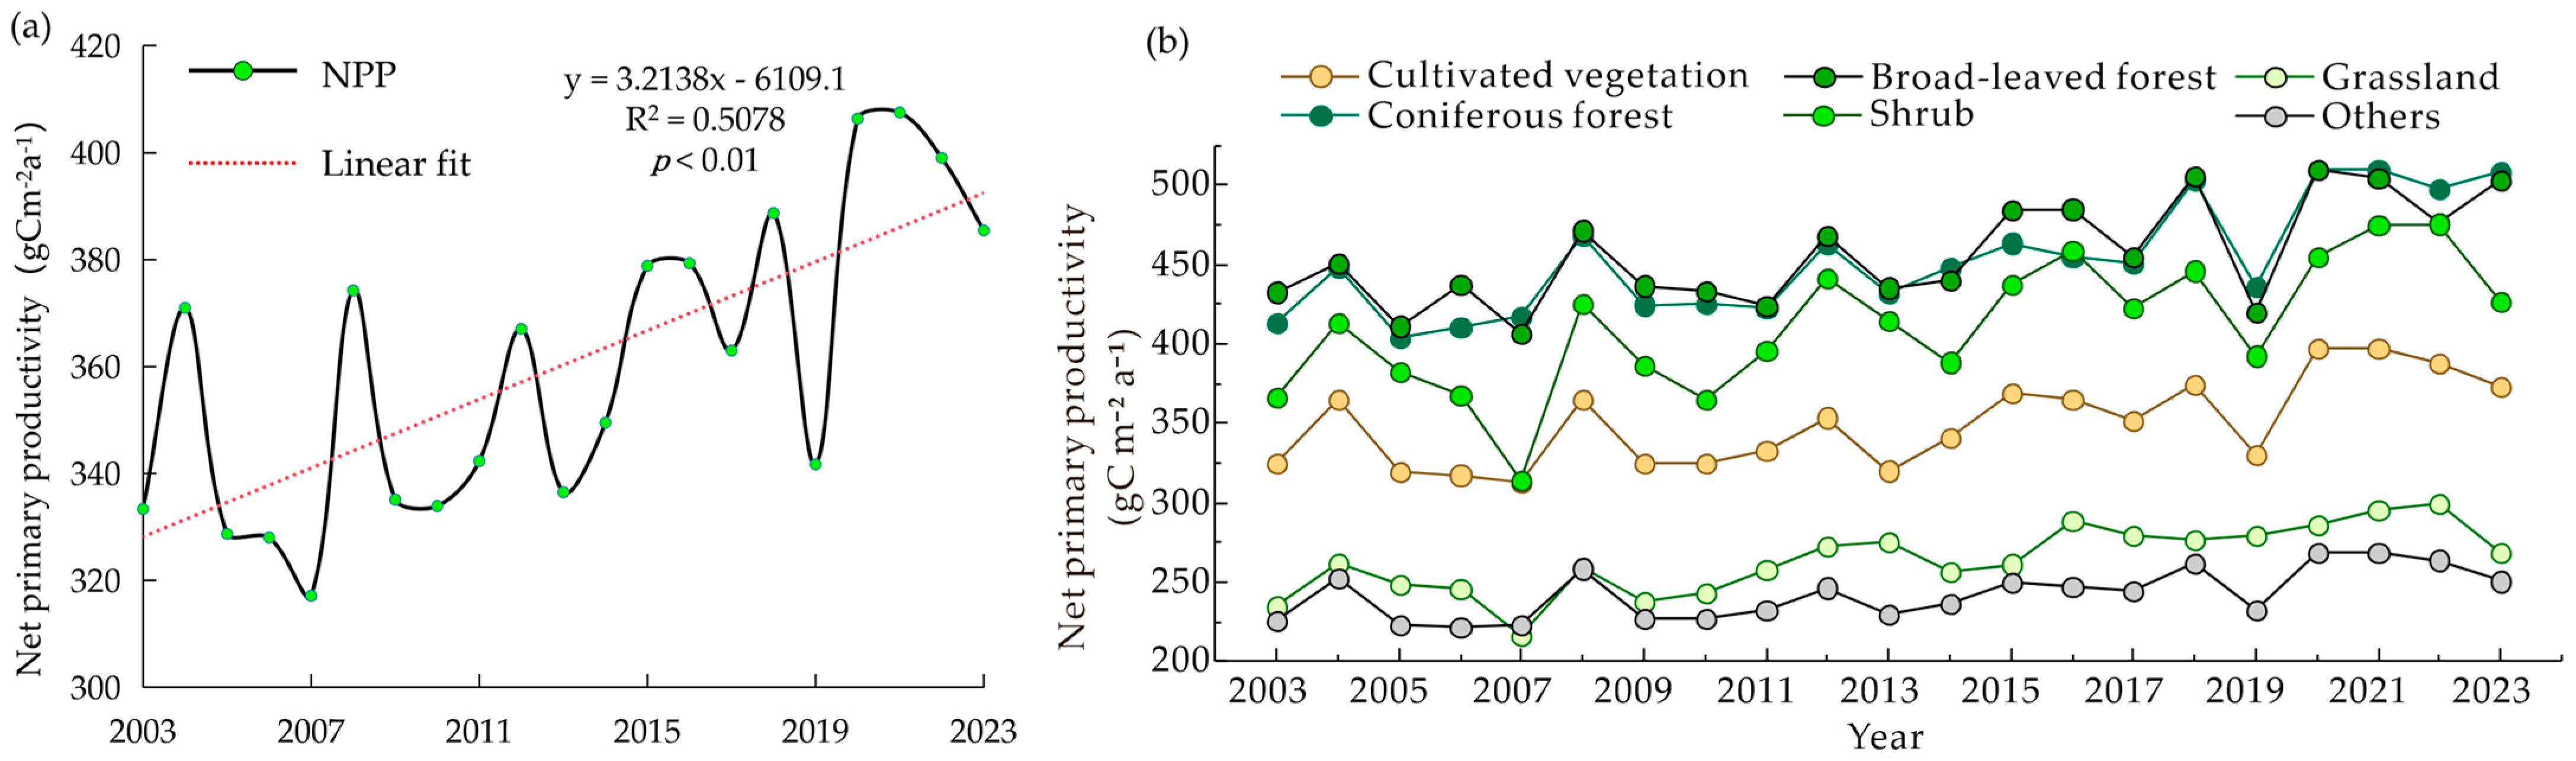
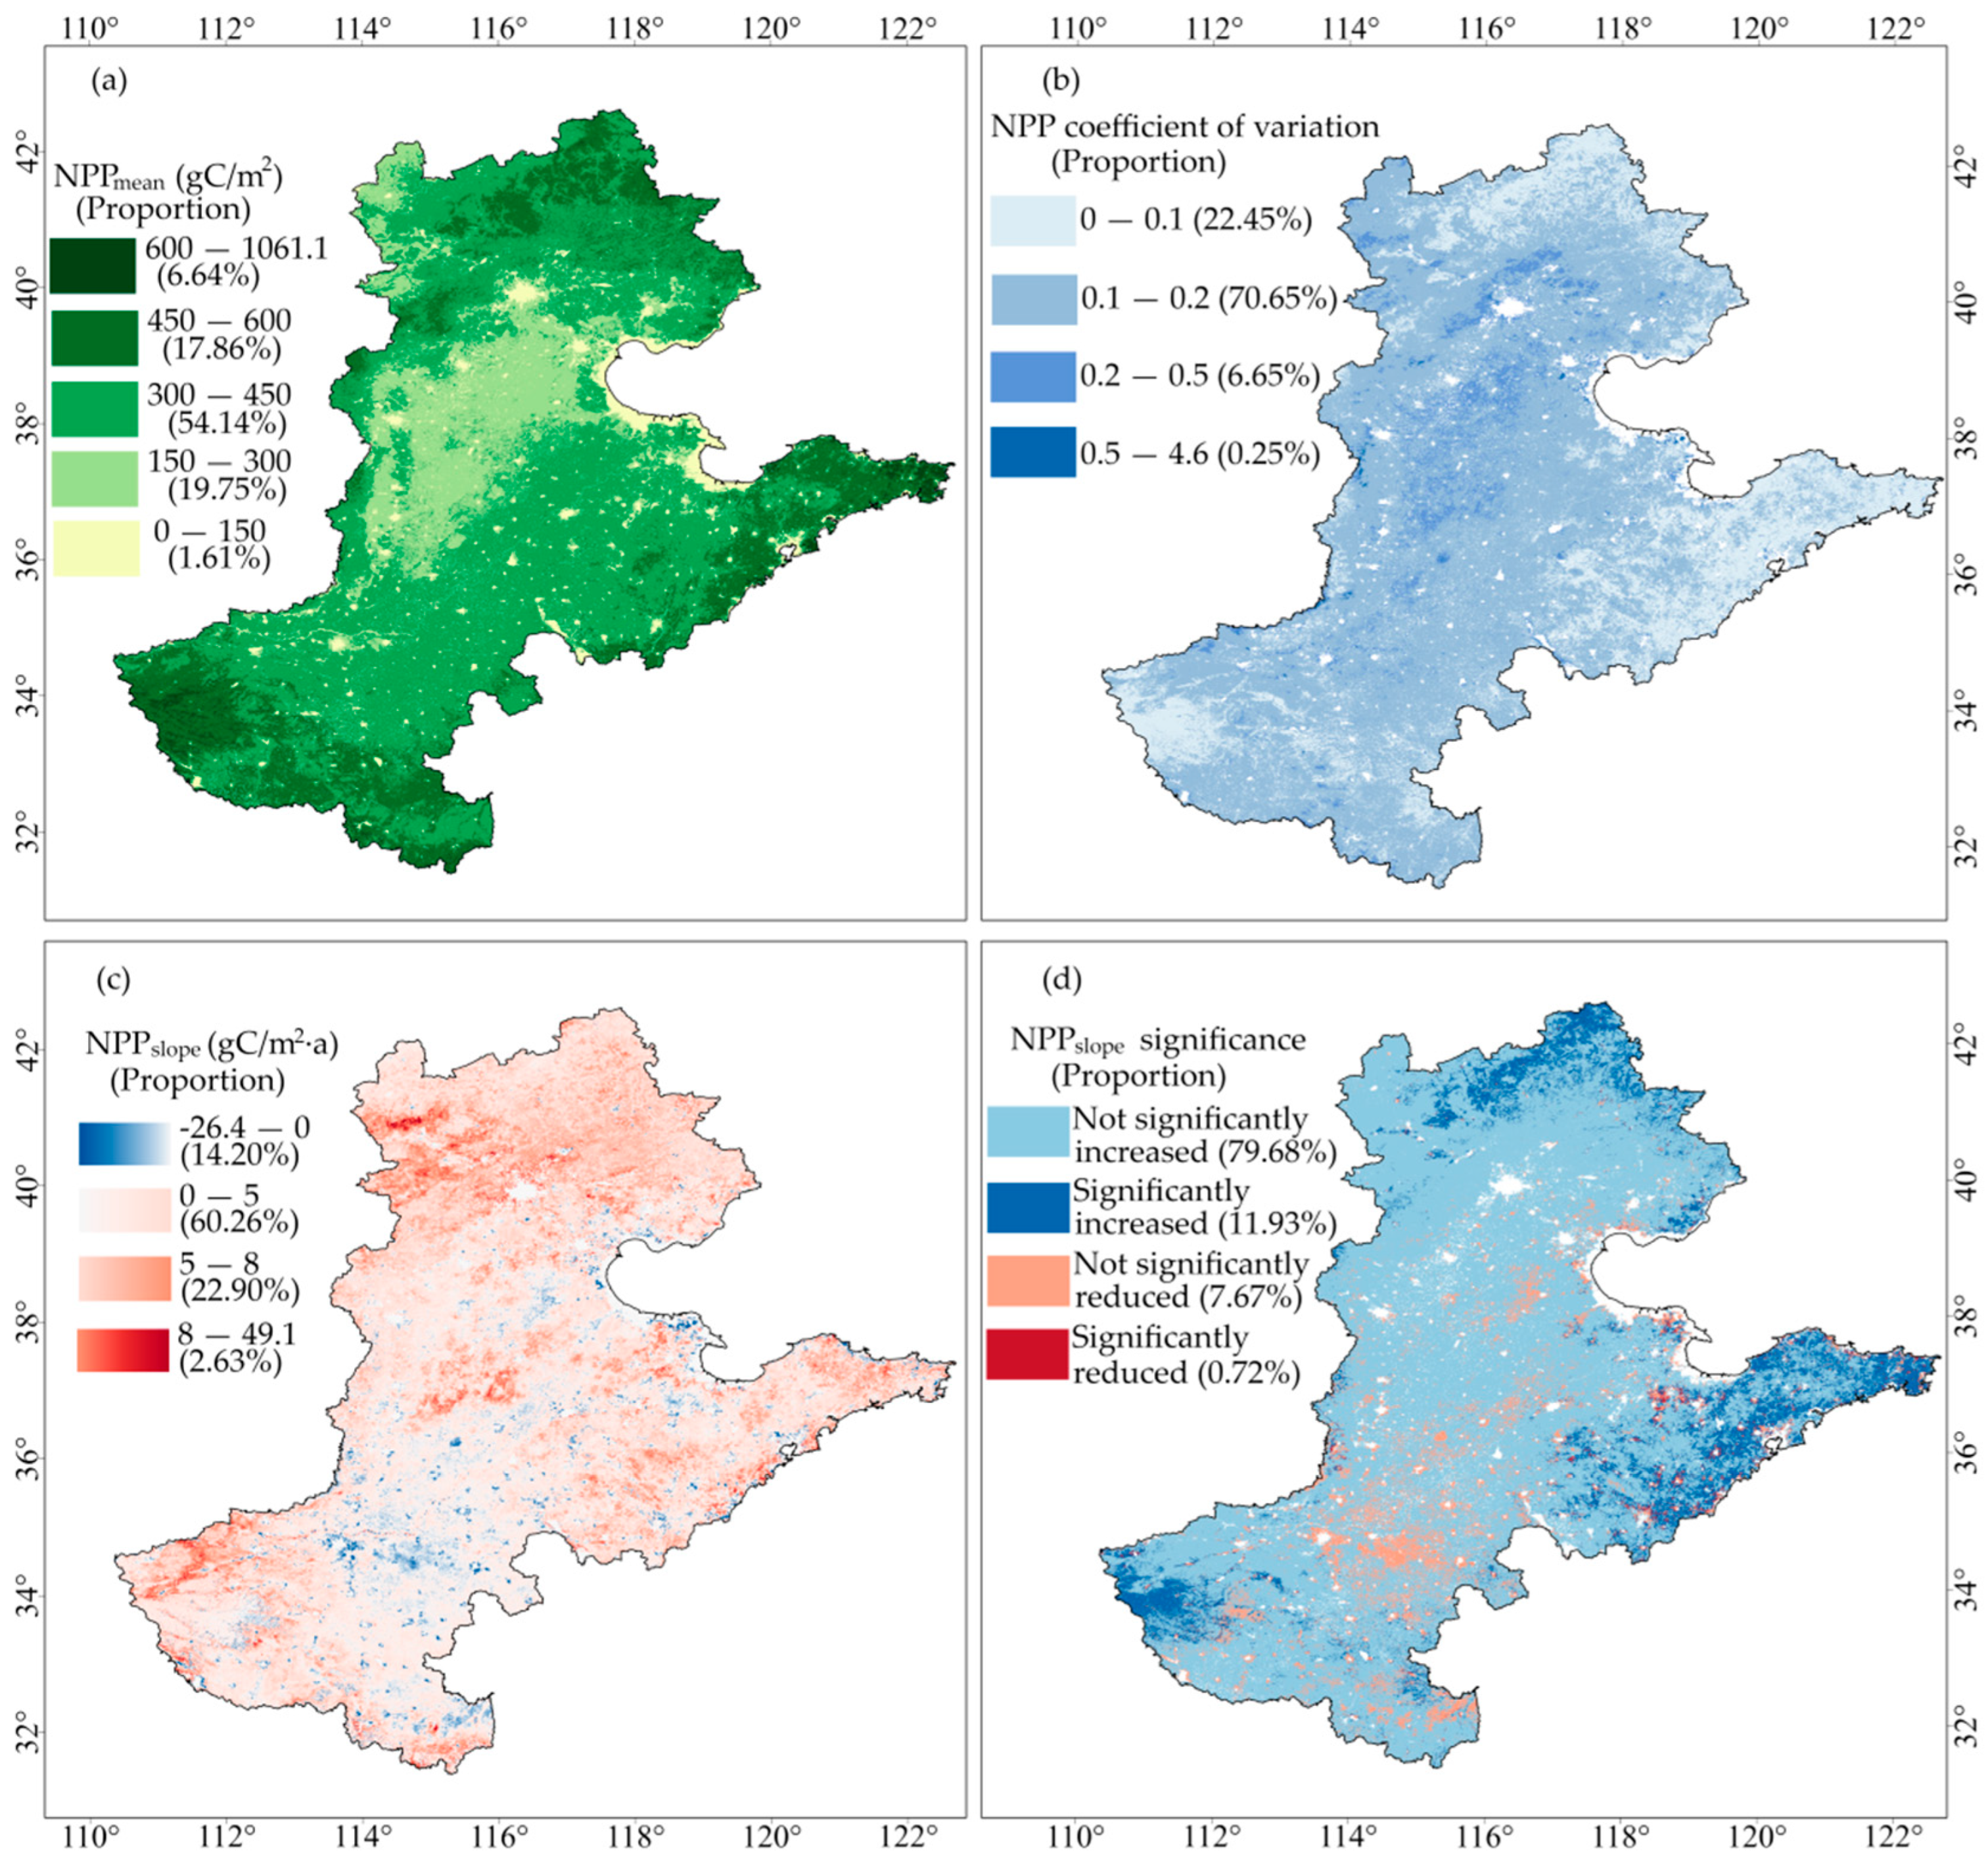
Between 2003 and 2023, the annual average vegetation NPP in the NCP showed a fluctuating upward trend, increasing by an average of 2.60 g C/m2 per year, with values ranging from 317.14 to 407.51 g C/m2 and a multi-year average of 360.33 g C/m2. The lowest annual average NPP occurred in 2007, while the highest was in 2021. Over the past two decades, the growth rates of NPP for cropland and broad-leaved forest vegetation have been significantly higher than those for other vegetation types (p < 0.05). Spatially, a general pattern of higher values in the south and lower values in the north was observed. This spatial disparity highlights the need for region-specific policies, such as precision agriculture in high-NPP zones and ecological restoration in low-NPP urban clusters to optimize vegetation carbon sequestration potential.
(2)
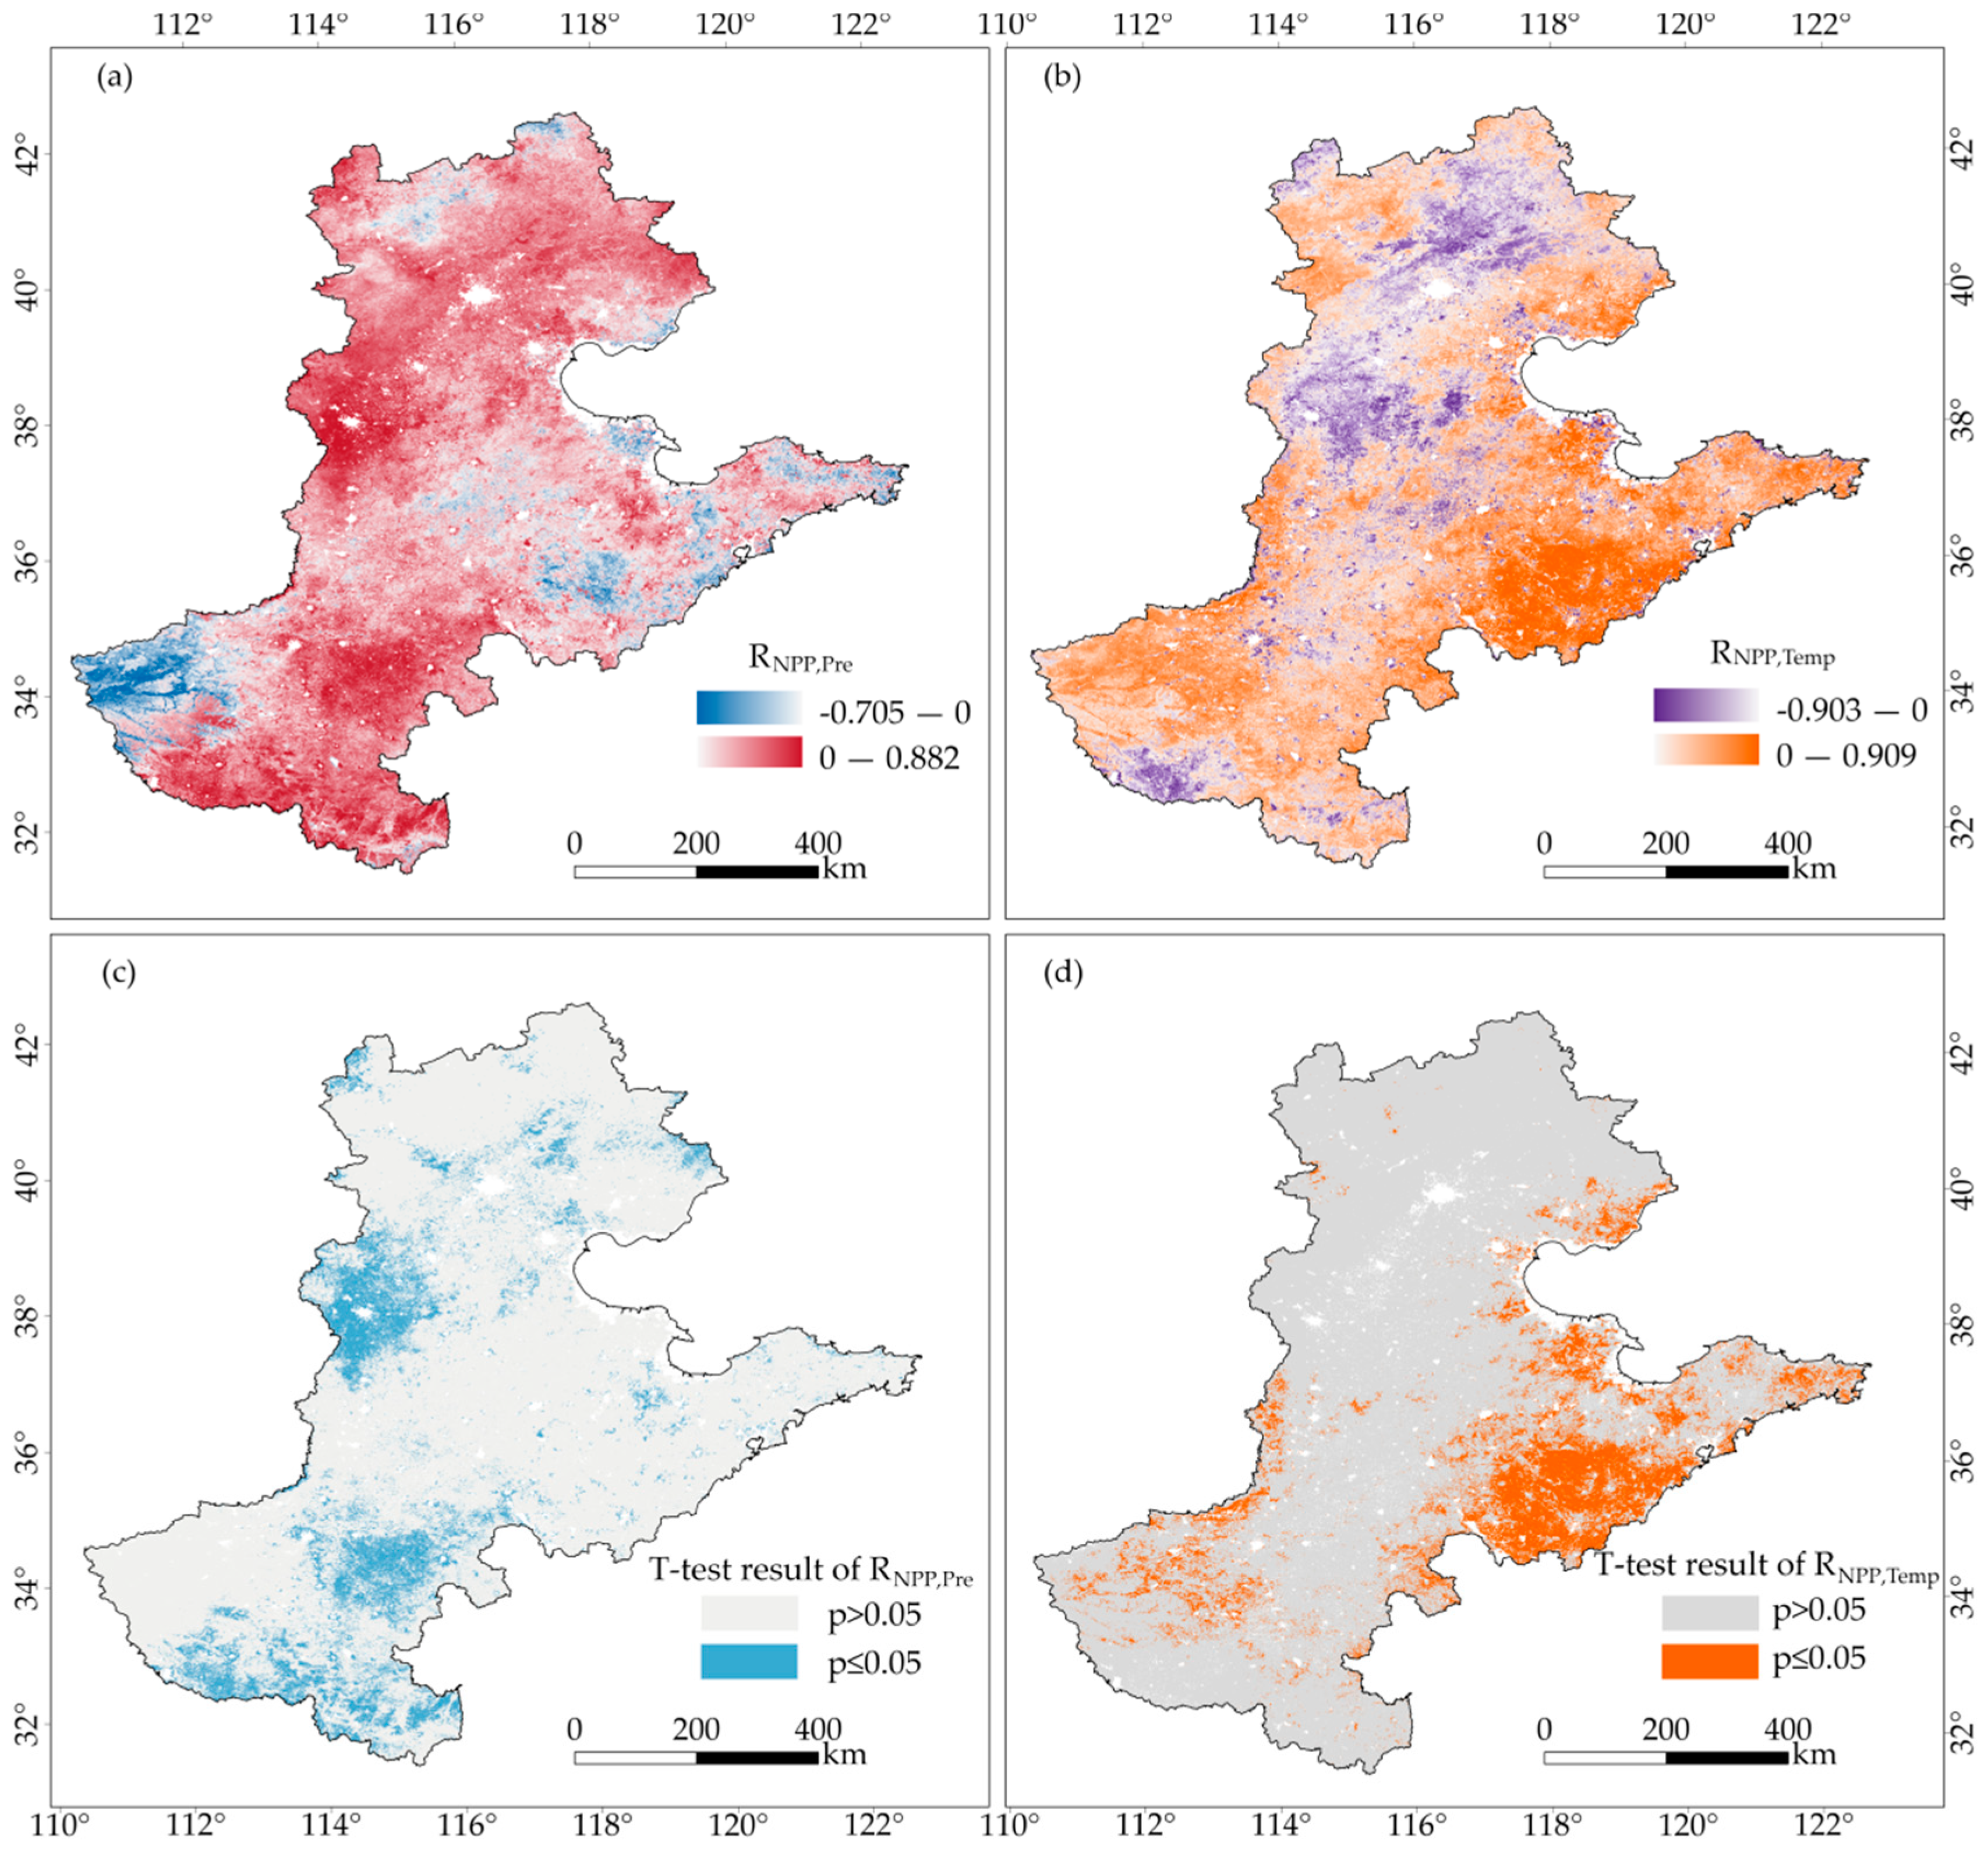
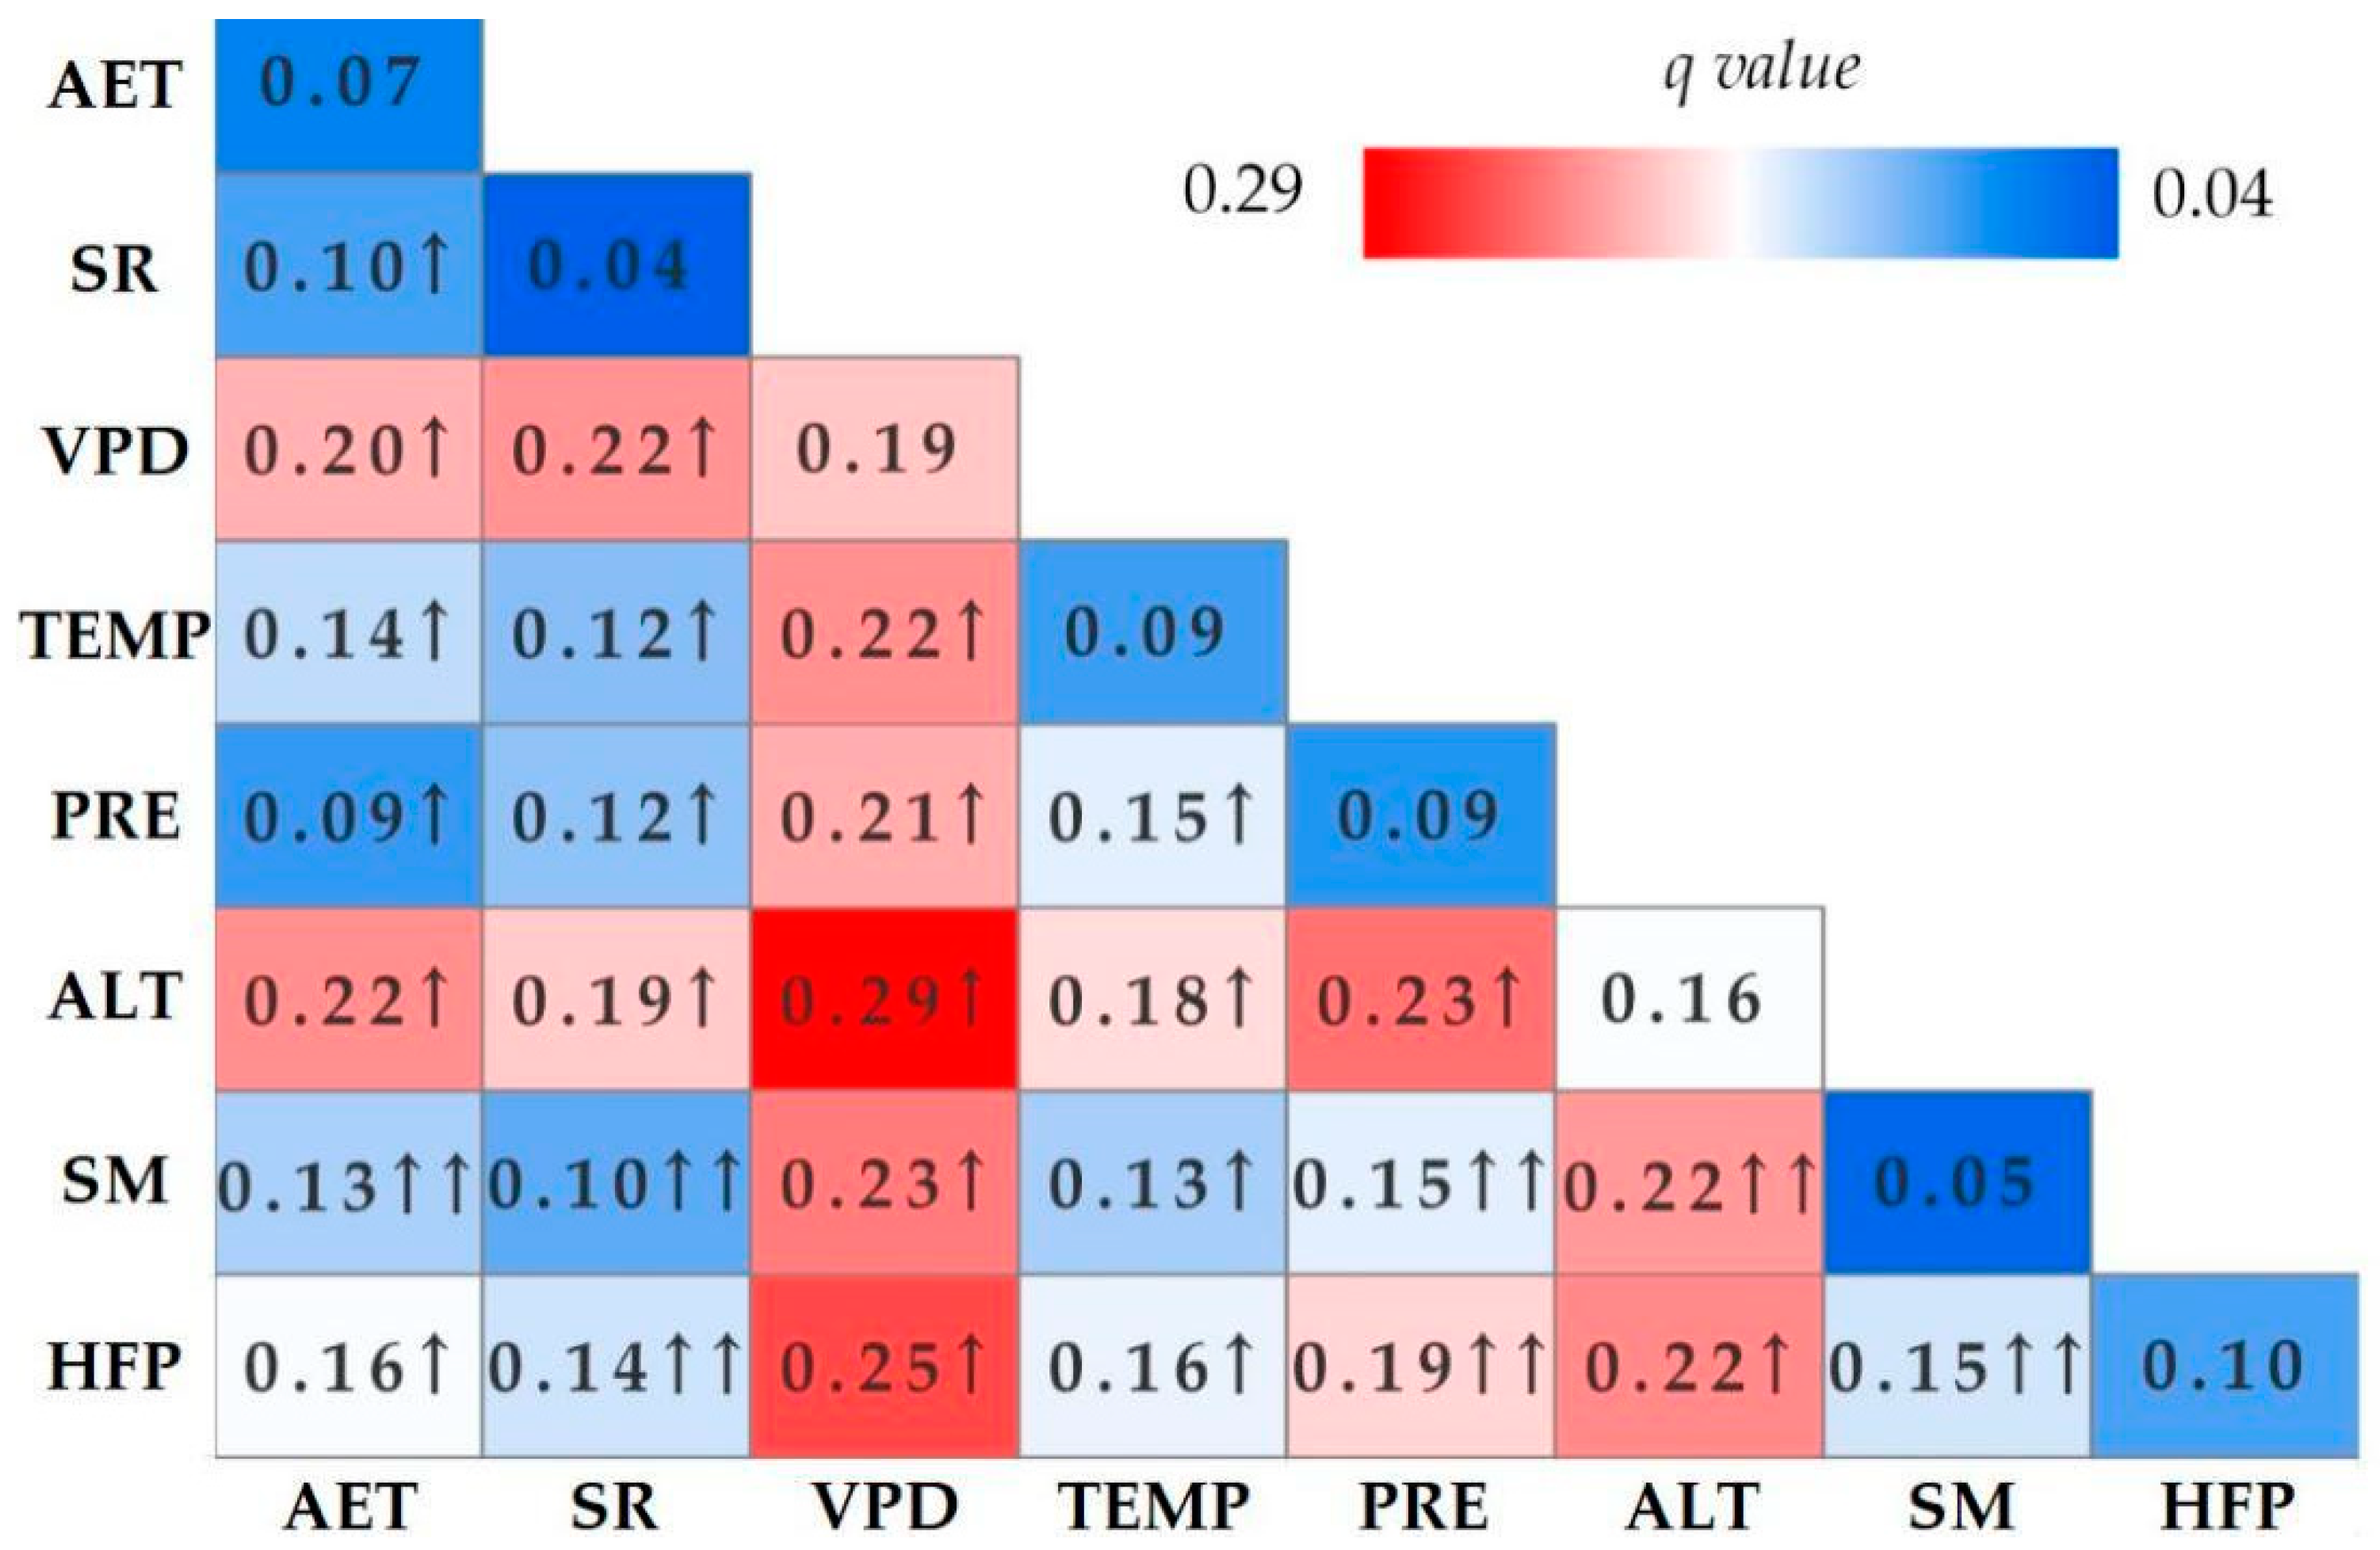
Significant spatial heterogeneity was observed in the relationships between temperature, precipitation, and vegetation NPP in the region. Saturated vapor pressure (VPD), altitude (ALT), and human activity intensity (HFP) were found to be the primary factors influencing vegetation NPP in the NCP. Their combined interaction had the strongest explanatory power, with VPD, ALT, and HFP accounting for 29%, 25%, and 25%, respectively. When human activities interact with other factors, their impact on NPP is significantly enhanced. To address the complexity of these interactions, future studies should integrate multi-agent modeling frameworks (e.g., structural equation modeling) to better quantify direct and indirect effects of multiple drivers.
(3)
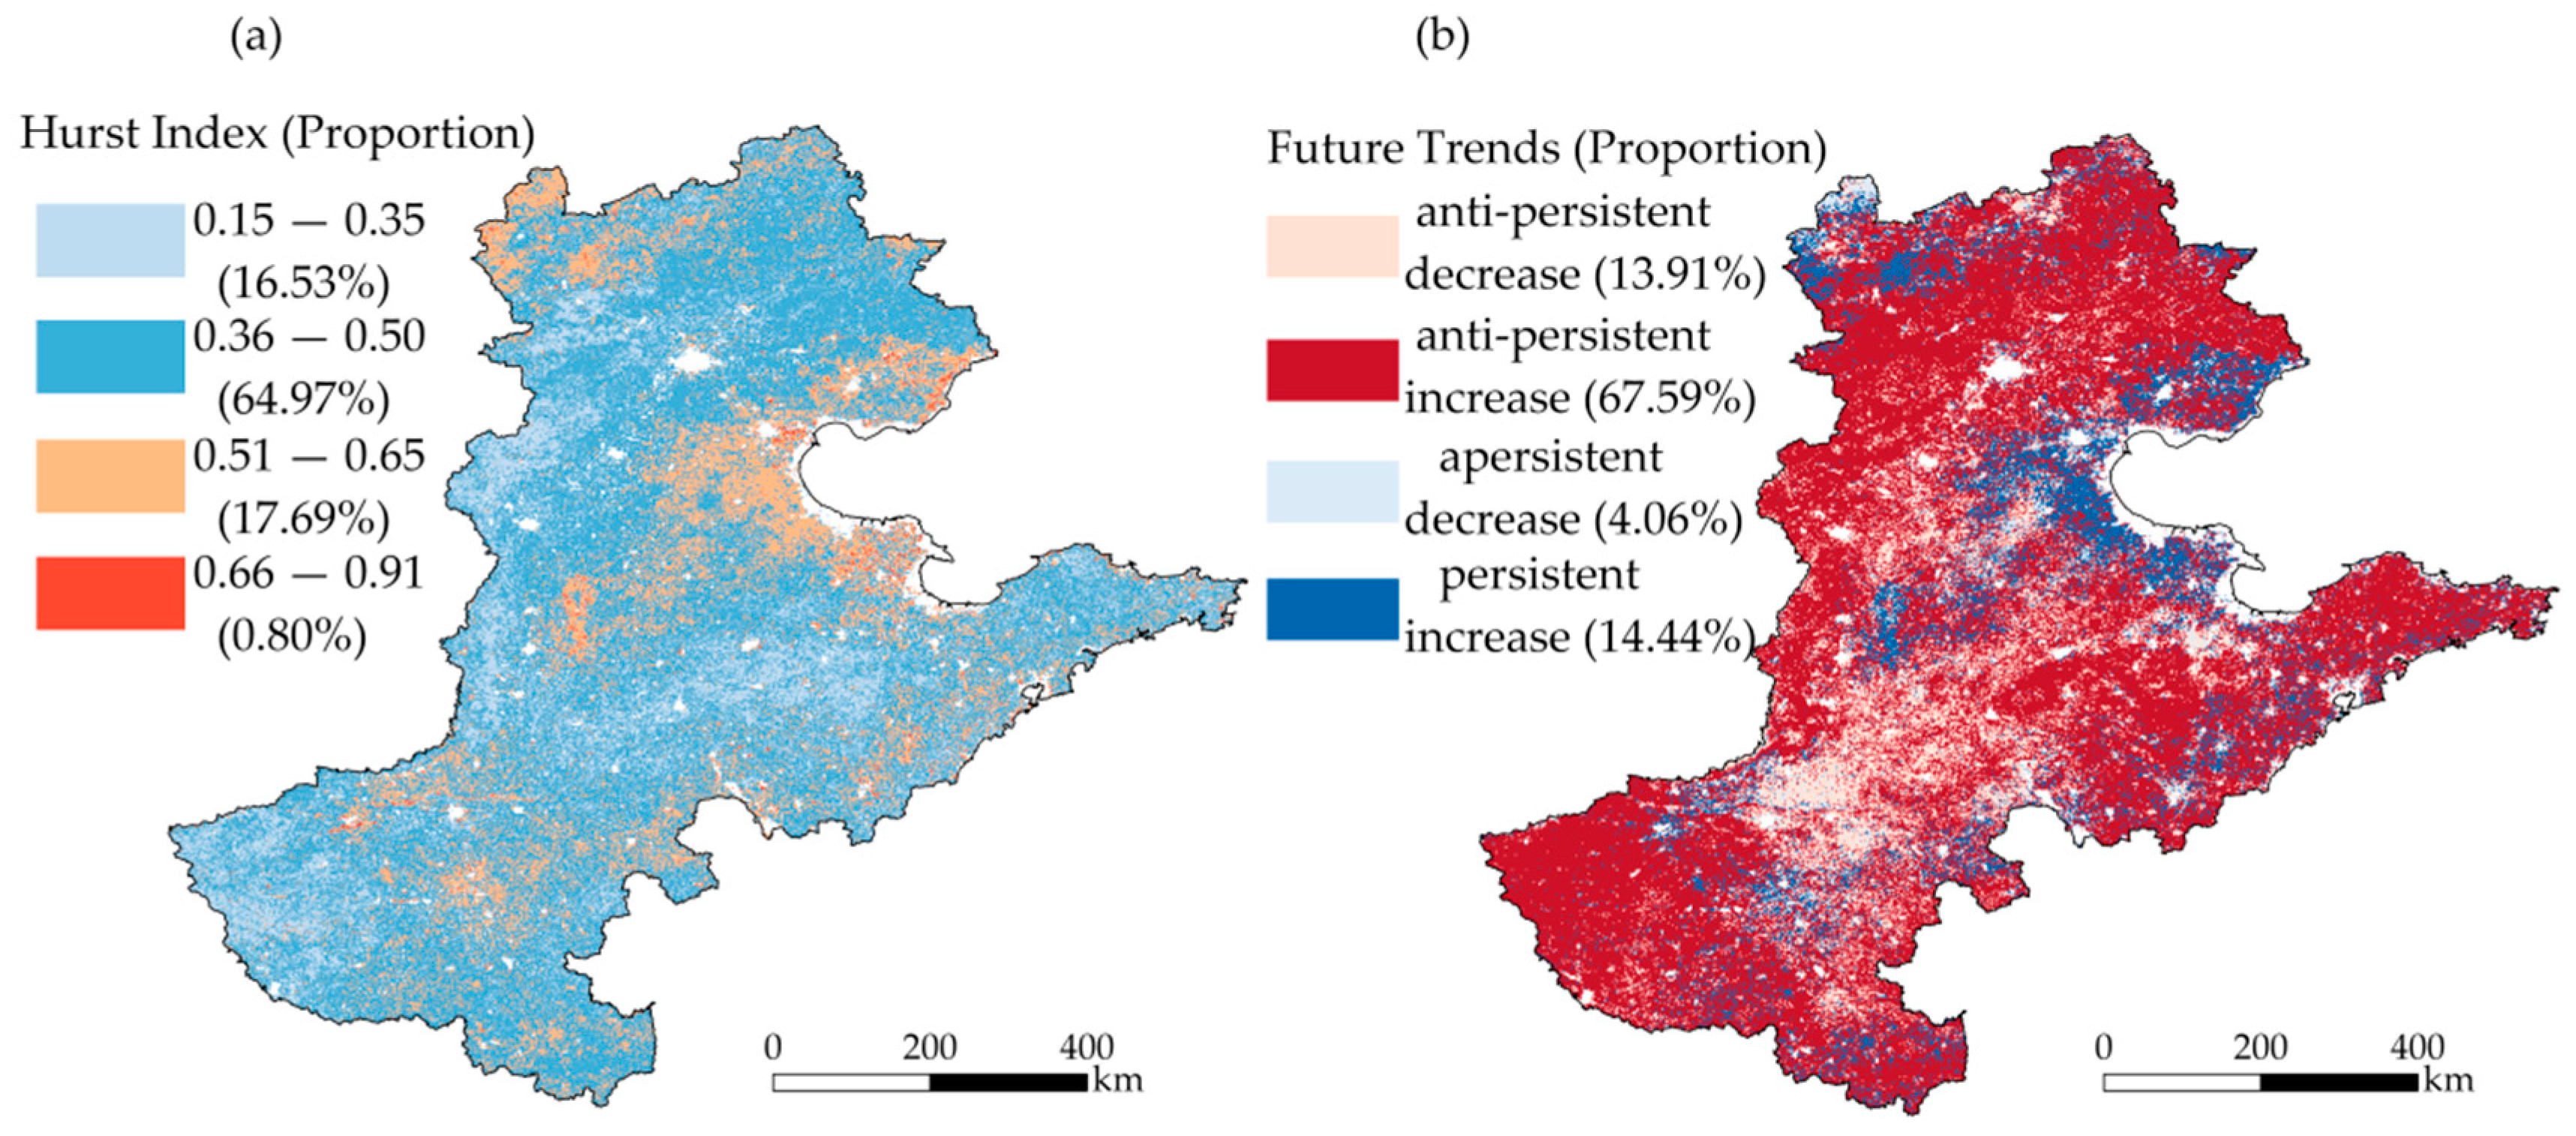
From 2003 to 2023, the Hurst index in the NCP ranged from 0.15 to 0.91, with an average of 0.43. Regions with a Hurst index less than 0.5 accounted for 81.50%, while those with an index greater than 0.5 accounted for 18.50%. This indicates that the trend in vegetation NPP has strong anti-persistence, with 67.59% of regional NPP changes predicted to show anti-persistent increases, indicating uncertainty regarding future vegetation NPP changes. Future adaptive management strategies (e.g., real-time ecosystem monitoring and threshold-based resource management) must be prioritized to mitigate risks posed by non-linear ecosystem dynamics.

Author Contributions

M.Y. and D.Z. collected and analyzed the data and were the main writers of the manuscript. Z.A. provided guidance on the theoretical framework of the study and proofread the manuscript. K.L. and L.S. downloaded and preprocessed the data and played a key role in the development of the methodology used in the study. K.S. oversaw the entire project, secured the funding necessary for the research, and provided mentorship to the lead author. K.S. was also responsible for the final review and submission of the manuscript. All authors have read and agreed to the published version of the manuscript.

Funding

Comprehensive Observation and Monitoring, Assessment of Natural Resources in the Yongding–Luanhe River Basin (DD20242329).

Data Availability Statement

The data presented in this study are available upon request from the corresponding authors.

Acknowledgments

We greatly appreciate the guidance of Xiaohuang Liu from the Key Laboratory of Coupling Process and Effect of Natural Resources Elements, Command Center for Natural Resources Comprehensive Survey.

Conflicts of Interest

The authors declare no conflicts of interest.

References

  1. Sims, D.; Luo, H.; Hastings, S.; Oechel, W.; Rahman, A.; Gamon, J. Parallel adjustments in vegetation greenness and ecosystem CO2 exchange in response to drought in a Southern California chaparral ecosystem. Remote Sens. Environ. 2006, 103, 289–303. [Google Scholar] [CrossRef]
  2. Manvailer, V.; Hamann, A. Validation of global precipitation time series products against tree ring records and remotely sensed vegetation greenness. PLoS ONE 2024, 19, e0299111. [Google Scholar] [CrossRef]
  3. Roxburgh, S.; Berry, S.; Buckley, T.; Barnes, B.; Roderick, M. What is NPP? Inconsistent accounting of respiratory fluxes in the definition of net primary production. Funct. Ecol. 2010, 19, 378–382. [Google Scholar] [CrossRef]
  4. Brian, W.; Leanne, M.; Xia, X.; Forest, I.; Wayne, H. Biodiversity: Net primary productivity relationships are eliminated by invasive species dominance. Ecol. Lett. 2023, 27, e14342. [Google Scholar]
  5. Crabtree, R.; Potter, C.; Mullen, R.; Sheldon, J.; Huang, S.; Harmsen, J.; Jean, C. A modeling and spatio-temporal analysis framework for monitoring environmental change using NPP as an ecosystem indicator. Remote Sens. Environ. 2009, 113, 1486–1496. [Google Scholar] [CrossRef]
  6. Afzali, A.; Hadian, F.; Sabri, S.; Leila, Y. Investigating net primary production in climate regions of Khuzestan Province, Iran using CASA model. Int. J. Biometeorol. 2024, 68, 1357–1370. [Google Scholar] [CrossRef]
  7. Nobre, C.; Sampaio, G.; Borma, L.; Castilla-Rubio, J.; Silva, J.; Cardoso, M. Land-use and climate change risks in the Amazon and the need of a novel sustainable development paradigm. Proc. Natl. Acad. Sci. USA 2016, 113, 10759–10768. [Google Scholar] [CrossRef] [PubMed]
  8. Alexander, J.; McCafferty, M.; Fricker, G.; Jeremy, J. Climate seasonality and extremes influence net primary productivity across California’s grasslands, shrublands, and woodlands. Environ. Res. Lett. 2023, 18, 064021. [Google Scholar] [CrossRef]
  9. Ma, Z.; Wu, J.; Yang, H.; Hong, Z.; Yang, J.; Gao, L. Assessment of vegetation net primary productivity variation and influencing factors in the Beijing-Tianjin-Hebei Region. J. Environ. Manag. 2024, 365, 121490. [Google Scholar] [CrossRef]
  10. Richter, G.; Topp, C. Climate factors contribute to grassland net primary productivity. Agronomy 2021, 11, 1076. [Google Scholar] [CrossRef]
  11. Bejagam, V.; Sharma, A. Impact of climatic changes and anthropogenic activities on ecosystem net primary productivity in India during 2001–2019. Ecol. Inf. 2022, 70, 101732. [Google Scholar] [CrossRef]
  12. Pessarrodona, A.; Filbee-Dexter, K.; Krumhansl, K.A.; Pedersen, M.F.; Moore, P.J.; Wernberg, T. A global dataset of seaweed net primary productivity. Sci. Data 2022, 9, 484. [Google Scholar] [CrossRef] [PubMed]
  13. Mohamedelhassan, A.; Zhang, B.; Jahelnabi, A.; Elhassan, E. Responses of annual variability of vegetation NPP to climate variables using satellite techniques in Gadarif State, Sudan. J. Geogr. Inf. Syst. 2024, 16, 136–147. [Google Scholar] [CrossRef]
  14. Naeem, S.; Zhang, Y.; Tian, J.; Qamer, F.; Latif, A.; Paul, P. Quantifying the impacts of anthropogenic activities and climate variations on vegetation productivity changes in China from 1985 to 2015. Remote Sens. 2020, 12, 1113. [Google Scholar] [CrossRef]
  15. Ugbaje, S.; Odeh, I.; Bishop, T.; Li, J. Assessing the spatio-temporal variability of vegetation productivity in Africa: Quantifying the relative roles of climate variability and human activities. Int. J. Digit. Earth. 2017, 10, 879–900. [Google Scholar] [CrossRef]
  16. Igboeli, E.; Ogbue, C.; Ochege, F.; Onyekwelu, A.; Qing, L.; Ajaero, C.; Hamdi, R.; Rahman, M.; Kayiranga, A.; Luo, G. Combined impacts of land change and climate variability on ecosystem net primary productivity in Arid Regions. Glob. Planet. Chang. 2025, 245, 104682. [Google Scholar] [CrossRef]
  17. Zhang, M.; Yuan, N.; Lin, H.; Liu, Y.; Zhang, H. Quantitative estimation of the factors impacting spatiotemporal variation inNPP in the Dongting Lake Wetlands using landsat time series data for the last two decades. Ecol. Indic. 2022, 135, 108544. [Google Scholar] [CrossRef]
  18. Liu, Y.; Wang, Q.; Zhang, Z.; Tong, L.; Wang, Z.; Li, J. Grassland dynamics in responses to climate variation and human activities in China from 2000 to 2013. Sci. Total Environ. 2019, 690, 27–39. [Google Scholar] [CrossRef]
  19. Field, C.; Behrenfeld, M.; Randerson, J.; Falkowski, P. Primary production of the biosphere: Integrating terrestrial and oceanic components. Science 1998, 281, 237–240. [Google Scholar] [CrossRef]
  20. Wang, X.L.; He, W.X.; Huang, Y.L.; Wu, X.; Zhang, X.; Zhang, B. Exploring spatial non-stationarity and scale effects of natural and anthropogenic factors on net primary productivity of vegetation in the Yellow River Basin. Remote Sens. 2024, 16, 3156. [Google Scholar] [CrossRef]
  21. Xue, H.; Chen, Y.; Dong, G.; Li, J. Quantitative analysis of spatiotemporal changes and driving forces of vegetation net primary productivity (NPP) in the Qimeng Region of Inner Mongolia. Ecol. Indic. 2023, 154, 110610. [Google Scholar] [CrossRef]
  22. Long, X.; Han, Y.; Wang, Q.; Li, X.; Feng, T.; Wang, Y.; Zhang, S.; Han, Y.; Li, G.; Tie, J.; et al. Adverse effects of ozone pollution on net primary productivity in the North China Plain. Geophys. Res. Lett. 2024, 51, e2023GL105209. [Google Scholar] [CrossRef]
  23. Ge, W.Y.; Deng, L.Q.; Wang, F.; Han, J. Quantifying the contributions of human activities and climate change to vegetation net primary productivity dynamics in China from 2001 to 2016. Sci. Total Environ. 2021, 773, 145648. [Google Scholar] [CrossRef]
  24. Tang, C.; Hal, O.; Hou, Y.; Simon, J.; Pierre, J. Assessing nitrogen circularity in food systems in the North China Plain. Resour. Conserv. Recycl. 2025, 213, 108015. [Google Scholar] [CrossRef]
  25. Peng, Q.; Wang, R.G.; Jiang, Y.; Li, C. Contributions of climate change and human activities to vegetation dynamics in Qilian Mountain National Park, Northwest China. Glob. Ecol. Conserv. 2021, 32, e01947. [Google Scholar] [CrossRef]
  26. Ba, W.; Qiu, H.; Cao, Y.; Gong, A. Spatiotemporal characteristics prediction and driving factors analysis of npp in Shanxi Province covering the period 2001–2020. Remote Sens. 2023, 15, 12070. [Google Scholar] [CrossRef]
  27. Zhao, Y.X.; Qie, X. Quantitative assessment of the relative impacts of climate change and human activities on net primary productivity of vegetation in the Beijing-Tianjin-Hebei Region. Front. Environ. Sci. 2024, 12, 1508433. [Google Scholar] [CrossRef]
  28. Li, F.; Zhang, K.; Ren, J.; Yin, C.; Zhang, Y.; Nie, J. Driving mechanism for farmers to adopt improved agricultural systems in China: The case of rice-green manure crops rotation system. Agric. Syst. 2021, 192, 103202. [Google Scholar] [CrossRef]
  29. Yang, G.; Li, S.; Wang, H.; Wang, L. Study on agricultural cultivation development layout based on the matching characteristic of water and land resources in North China Plain. Agric. Water Manag. 2022, 259, 107272. [Google Scholar] [CrossRef]
  30. Zhao, N.; Yue, T.; Li, H.; Zhang, L.; Yin, X.; Liu, Y. Spatio-temporal changes in precipitation over Beijing-Tianjin-Hebei Region, China. Atmos. Res. 2017, 202, 156–168. [Google Scholar] [CrossRef]
  31. Deng, X.; Xu, X.; Cai, H.; Li, J. Assessment the impact of urban expansion on cropland net primary productivity in Northeast China. Ecol. Indic. 2024, 159, 111698. [Google Scholar] [CrossRef]
  32. National Bureau of Statistics of China (NBS). China Statistical Yearbook 2024; Chapter 3; China Statistics Press: Beijing, China, 2024. [Google Scholar]
  33. Zeng, L.; Yang, L.; Su, L.; Hu, H.; Feng, C. The impact of policies on land use and land cover changes in the Beijing-Tianjin-Hebei Region in China. Environ. Impact Assess. Rev. 2025, 110, 107676. [Google Scholar] [CrossRef]
  34. Zhong, Q.; Ma, J.; Zhao, B.; Wang, X.; Zong, J.; Xiao, X. Assessing spatial-temporal dynamics of urban expansion, vegetation greenness and photosynthesis in Megacity Shanghai, China during 2000–2016. Remote Sens. Environ. 2019, 233, 111374. [Google Scholar] [CrossRef]
  35. Li, Y.; Wang, R.; Chen, Z.; Xiong, Y.; Huang, Q.; Huang, G. Increasing net ecosystem carbon budget and mitigating global warming potential with improved irrigation and nitrogen fertilization management of a spring wheat farmland system in Arid Northwest China. Plant Soil. 2023, 489, 193–209. [Google Scholar] [CrossRef]
  36. Wang, C.; Liu, D.; Bai, E. Decreasing soil microbial diversity is associated with decreasing microbial biomass under nitrogen addition. Soil Biol. Biochem. 2018, 120, 126–133. [Google Scholar] [CrossRef]
  37. Yu, X.; Zhu, Y.; Wang, B.; Liu, D.; Bai, H.; Jin, L.; Wang, B.; Ruan, H.; Mao, L.; Jin, F.; et al. Effects of nitrogen addition on rhizospheric soil microbial communities of poplar plantations at different ages. For. Ecol. Manag. 2021, 494, 119328. [Google Scholar] [CrossRef]
  38. Michaletz, S.; Cheng, D.; Kerkhoff, A.; Enquist, B. Convergence of terrestrial plant production across global climate gradients. Nature 2014, 512, 39–43. [Google Scholar] [CrossRef]
  39. Grešlová, P.; Laštovička, J.; Štych, P.; Kabrda, J. Land cover flows and land use intensity in the three decades of the post-communist Czechia: Changing trends and driving forces. Anthropocene 2023, 43, 100395. [Google Scholar] [CrossRef]
  40. Buitenwerf, R.; Sandel, B.; Normand, S.; Mimet, A.; Svenning, J. Land surface greening suggests vigorous woody regrowth throughout European semi-natural vegetation. Glob. Chang. Biol. 2018, 24, 5789–5801. [Google Scholar] [CrossRef]
  41. Bogale, T.; Degefa, S.; Dalle, G.; Abebe, G. Spatiotemporal dynamics of vegetation net primary productivity and its response to climate variability. Environ. Syst. Res. 2024, 13, 47. [Google Scholar] [CrossRef]
  42. Shirke, P.; Pathre, U. Influence of leaf-to-air vapour pressure deficit (vpd) on the biochemistry and physiology of photosynthesis in Prosopis Juliflora. J. Exp. Bot. 2004, 55, 2111–2120. [Google Scholar] [CrossRef] [PubMed]
  43. Burgess, A.; Ugalde, J. SOS: Speed of stomata opening and closing is influenced by vapour pressure deficit. Plant Physiol. 2024, 195, 251–253. [Google Scholar] [CrossRef] [PubMed]
  44. Ni, X.; Guo, W.; Li, X.; Li, S. Heterogeneity of increases in net primary production under intensified human activity and climate variability on the Loess Plateau of China. Remote Sens. 2022, 14, 4706. [Google Scholar] [CrossRef]
  45. Xu, Y.; Lu, Y.G.; Zou, B.; Xu, M.; Feng, Y. Unraveling the enigma of npp variation in Chinese Vegetation Ecosystems: The interplay of climate change and land use change. Sci. Total Environ. 2023, 912, 169023. [Google Scholar] [CrossRef]
  46. Teng, M.; Zeng, L.; Hu, W.; Wang, P.; Yan, Z.; He, W.; Zhang, Y.; Huang, Z.; Xiao, W. The impacts of climate changes and human activities on net primary productivity vary across an ecotone zone in Northwest China. Sci. Total Environ. 2020, 714, 136691. [Google Scholar] [CrossRef] [PubMed]
  47. Feng, Z.; Wang, L.; Peng, Q.; Li, J.; Liang, T. Effect of environmental factors on soil properties under different land use types in a Typical Basin of the North China Plain. J. Clean. Prod. 2022, 344, 131084. [Google Scholar] [CrossRef]
  48. Han, H.; Bai, J.; Ma, G.; Yan, J.; Wang, X.; Ta, Z.; Wang, P. Seasonal responses of net primary productivity of vegetation to phenological dynamics in the Loess Plateau, China. Chin. Geogr. Sci. 2022, 32, 340–357. [Google Scholar] [CrossRef]
  49. Li, W.; Zhou, J.; Xu, Z.; Liang, Y.; Shi, J.; Zhao, X. Climate impact greater on vegetation npp but human enhance benefits after the grain for green program in Loess Plateau. Ecol. Indic. 2023, 157, 111201. [Google Scholar] [CrossRef]
  50. Li, B.; Ding, J.; Liu, X. Returning farmland to forests and grasslands promotes soil quality restoration in Northeast China: Evidence from soil nitrogen cycle. Appl. Soil Ecol. 2024, 203, 105655. [Google Scholar] [CrossRef]
  51. Shi, S.; Zhu, L.; Luo, Z.; Qiu, H. Quantitative Analysis of the Contributions of Climatic and Anthropogenic Factors to the Variation in Net Primary Productivity, China. Remote Sens. 2023, 15, 789. [Google Scholar] [CrossRef]
  52. Ren, P. Spatio-temporal changes and driving mechanisms of vegetation net primary productivity in Xinjiang, China from 2001 to 2022. Land 2024, 13, 1305. [Google Scholar] [CrossRef]
  53. Mu, W.; Zhu, X.; Ma, W.; Han, Y.; Huang, H.; Huang, X. Impact assessment of urbanization on vegetation net primary productivity: A case study of the core development area in Central Plains Urban Agglomeration, China. Environ. Res. 2023, 229, 115995. [Google Scholar] [CrossRef] [PubMed]
Figure 1. Overview of the study area: (a): geographical location of the North China Plain (NCP) within China; (b): land use types (2023) classified into six categories: cultivated land, forest land, grassland, waters, construction land, and unused land; (c): dominant vegetation types, including cultivated vegetation, coniferous forest, broad-leaved forest, shrub, grassland, others.
Agronomy 15 00975 g001
Figure 2. Overall technical flowchart of this study: HFP stands for human footprint; DEM represents elevation.
Agronomy 15 00975 g002
Figure 3. Variation trends in annual net primary productivity (NPP) in the North China Plain from 2003 to 2023: (a): Interannual NPP variation curve (black line) with linear fitted trend (red dashed line); 2021: maximum NPP; (b): interannual variation trends in NPP for different vegetation types.
Agronomy 15 00975 g003
Figure 4. Net primary productivity (NPP) spatial pattern in the North China Plain from 2004 to 2023: (a): multi-year mean NPP (g C/m2) with provincial boundaries overlaid; (b): stability classes based on coefficient of variation (CV): low (CV < 0.1), moderate (0.1 ≤ CV < 0.2), high (0.2 ≤ CV < 0.5), and extreme (CV ≥ 0.5); (c): NPP slope distribution (g C/m2/yr), highlighting significant increases (red) and decreases (blue) (p < 0.05); (d): statistical significance of NPP trends.
Agronomy 15 00975 g004
Figure 5. Spatial correlation of net primary productivity (NPP) with precipitation, temperature coverage, and the t-test results in the North China Plain: (a): correlation coefficients between NPP and precipitation; (b): correlation coefficients between NPP and temperature; (c): significance of the correlations between NPP and precipitation; (d): significance of the correlations between NPP and temperature.
Agronomy 15 00975 g005
Figure 6. Note: AET: Actual evapotranspiration; SR: Solar radiation; VPD: Vapor pressure deficit; TEMP: Annual mean temperature; PRE: Annual total precipitation; ALT: Altitude; SM: Soil moisture; HFP: Human footprint. Factor interaction test diagram: ↑ represents dual factor enhancement (the q-value of the combined effect is greater than the maximum value in the individual effect); ↑↑ represents non-linear enhancement (the combined effect q-value is greater than the sum of the individual effect q-values). Colored bars represent interaction strengths between factors (e.g., ALT and HFP; VPD and PRE).
Agronomy 15 00975 g006
Figure 7. Vegetation net primary productivity (NPP) change trend in the North China Plain from 2004 to 2023: (a): The trend in vegetation NPP changes from 2003 to 2013; (b): The trend in vegetation NPP changes from 2013 to 2023; (c): The trend in vegetation NPP changes from 2003 to 2023.
Agronomy 15 00975 g007
Figure 8. Prediction of vegetation net primary productivity (NPP) change trend in the NCP: (a): spatial distribution of Hurst index (H): Red: Persistent trends (H > 0.5); Blue: Anti-persistent trends (H < 0.5). (b): The predicted future trend in vegetation NPP changes: Anti-persistent decrease (13.91%): Central Henan, southwestern Hebei; Persistent decrease (4.06%): Northern Zhangjiakou, coastal Dongying; Anti-persistent increase (67.59%): Widespread but unstable growth; Persistent increase (14.44%): Zhangjiakou, Handan, coastal Shandong.
Agronomy 15 00975 g008
Table 1. Data sources.
DataTimeResolutionSource
MODIS 17A3HGF(NPP)2003–2023500 mhttps://ladsweb.modaps.eosdis.nasa.gov/ (accessed on 26 December 2024)
Vegetation type1990–20001000 mhttps://www.resdc.cn/ (accessed on 26 December 2024)
Annual average temperature and annual precipitation2003–20234400 mhttps://climate.northwestknowledge.net/ (accessed on 26 December 2024)
Actual evapotranspiration2003–2023500 mhttps://www.resdc.cn/ (accessed on 26 December 2024)
Solar radiation2003–2023500 mhttps://www.resdc.cn/ (accessed on 26 December 2024)
Vapor pressure deficit2003–2023500 mhttps://www.resdc.cn/ (accessed on 26 December 2024)
Soil moisture2003–2023500 mhttps://www.resdc.cn/ (accessed on 26 December 2024)
Altitude90 mhttps://earthexplorer.Usgs.gov/ (accessed on 26 December 2024)
Land use202330 mhttps://zenodo.org/records/12779975 (accessed on 26 December 2024)
Human footprint2003–2022500 mhttps://figshare.com/ (accessed on 26 December 2024)
Table 2. The factor detection results.
Impact FactorAETSRVPDTEMPPREALTSMHFP
q value0.070.040.190.090.090.160.050.10
Note: AET: Actual evapotranspiration; SR: Solar radiation; VPD: Vapor pressure deficit; TEMP: Annual mean temperature; PRE: Annual total precipitation; ALT: Altitude; SM: Soil moisture; HFP: Human footprint.
Disclaimer/Publisher’s Note: The statements, opinions and data contained in all publications are solely those of the individual author(s) and contributor(s) and not of MDPI and/or the editor(s). MDPI and/or the editor(s) disclaim responsibility for any injury to people or property resulting from any ideas, methods, instructions or products referred to in the content.

